
Investigation of Plane-Strain Fracture Toughness and Failure Analysis of AISI-4140 Alloy Steel †


Department of Mechanical and Industrial Engineering, Manipal Institute of Technology, Manipal Academy of Higher Education, Manipal 576 104, Karnataka, India
*
Author to whom correspondence should be addressed.
†
Presented at the International Conference on Recent Advances on Science and Engineering, Dubai, United Arab Emirates, 4–5 October 2023.
Eng. Proc. 2023, 59(1), 119; https://doi.org/10.3390/engproc2023059119
Published: 25 December 2023
(This article belongs to the Proceedings of Eng. Proc., 2023, RAiSE-2023)
Abstract
:AISI-4140 alloy steel is a widely used a material in various fields of engineering like automotive, aerospace, oil and gas industries, construction, and structural engineering. Its application in diverse industries is mainly due to its excellent combination of strength, toughness, and wear resistance properties. Understanding the fracture toughness of AISI-4140 alloy steel is essential for ensuring the structural integrity and reliability of engineering components made from this material. The current study focuses on the experimental evaluation of fracture toughness due to its critical role in determining the material’s resistance to fracture and crack propagation. In this research, the plane-strain fracture toughness of AISI-4140 alloy steel material is investigated. Five compact tension specimens (CT) with three different thicknesses 12.5 mm, 20 mm, and 25 mm, are prepared as per ASTM standard E 399-90. The initial pre-crack in these specimens is introduced using fatigue loading. The fracture toughness test is conducted as per established procedures, and the specimens are subjected to controlled loading until a fracture occurs. Scanning electron microscopy analysis of the fractured surfaces allowed for a detailed examination of the fracture features, including crack propagation paths and microstructural characteristics. The average fracture toughness value for the AISI-4140 alloy steel is determined as 44.8 MPa .
1. Introduction
In recent years, for many automobile, mechanical, and aerospace applications, a material has been required that is suitable for high-loading conditions and offers high safety and reliability. AISI-4140 alloy steel is one of the most preferred materials used in these conditions. It is mainly used for two-wheeler axles, crankshaft and connecting rods, and engine gearboxes. Most of these applications have high-loading conditions that are cyclic in nature. By evaluating the fracture toughness of this material, one can assess whether the material can withstand the loading conditions without developing cracks. Additionally, such evaluation aids in predicting the lifespan of this component and mitigating unexpected failures. The literature shows the presence of considerable attention from researchers on fracture toughness and crack growth behavior analysis of various metals, such as titanium alloys, aluminum alloys, 17-4 PH stainless steel, and various other steels, along with ceramic and polymeric materials and biological materials tested for fracture toughness and other properties [1,2,3].
AISI-4140 alloy steel, which is also known as SAE-4140 steel or EN-19 steel in industries, exhibits a high strength, toughness, and wear resistance. It also exhibits high fatigue strength which allows it to withstand repeated and cyclic loading conditions [4]. Another important property is its fracture toughness; this is the ability of a material to resist crack propagation and fracture. Analysis of the lifespan of specimen requires determination of its fracture toughness [1]. Efforts have been made in determining the fracture toughness and behavior of AISI-4140 alloy steel that has been treated through different methods [5,6,7,8,9].
The testing methods for the calculation of the plane-strain fracture toughness of metallic materials have been standardized by ASTM International in ASTM E399-90 [10]. This method uses the approach of determining the critical stress intensity factor (KIC). KIC represents the lowest limit of critical stress intensity factor that a material can exhibit under a wide range of cracking configurations. The thickness of specimens must first be figured out by assuming a value for KIC, which should be overestimated so that the selection of smaller specimens can be avoided. The ASTM standard further specifies that the thickness of the specimen must be much greater than the crack tip plastic zone dimensions, such that it causes a crack tip tri-tensile stress condition that maximizes the constraint on plastic deformation. The specimens have to be essentially sized in such a way that their thickness, the crack size, and the residual ligament size exceed the ratio of 2.5(KIC/σys)2 [11].
Four different kinds of test specimens are recommended in the ASTM standard E 399-90 [10]. These are compact tension C(T), single-edge notch bend (SENB), arc-shaped tension A(T), and disc-shaped compact tension DC(T). However, C(T) and SENB are the most widely used. The A(T) specimen is convenient for cylindrical geometries such as pressure vessels or piping; the DC(T) specimen is suitable for circular blanks, round bars, cores, etc. Many researchers use the C(T) specimen as it best models crack growth in mode-I. For orthotropic materials, the SENB specimen was used for the determination of fracture toughness in [12]. These geometries allow for controlled stress concentrations, the crack tip, and the development of crack growth resistance curves. Notch is generated using electron discharge machining (EDM); this creates stress concentration at specific locations to help to initiate cracks when subjected to fatigue loading and promote crack propagation. The construction of a crack growth resistance curve is possible with testing methods utilizing CT and SENB specimens. Overall, for a proper assessment of a material’s fracture toughness, the use of specimens with geometries such as compact tension (CT) or single-edge notched bend (SENB) is required.
From our survey of the literature, it is noted that detailed explanations on the methodology of investigation of fracture toughness and failure analysis are limited. Therefore, an attempt is made to provide detailed explanation on methodology by conducting an experimental study on AISI-4140 alloy steel, a selected material for this purpose. The material composition of the selected material will be assessed using energy dispersive spectroscopy (EDS). The compact tension (CT) specimens will be prepared as per the ASTM standards. A notch and pre-cut in the specimen is introduced using EDM. An initial crack will be generated using fatigue loading to reduce the experimental duration; and finally, these specimens will be tested under tensile loading for fracture toughness analysis. The fractured specimen surface will be investigated using scanning electron microscopy (SEM) to understand the failure. By conducting fracture toughness tests under plane-strain conditions, this research seeks to analyze the selected material’s resistance to crack propagation and fracture.
2. Materials and Methodology
2.1. Material
AISI-4140 alloy steel is a typical 1% chromium molybdenum steel with higher molybdenum and comes under the category of high-quality medium carbon structural steel [13]. In the current experimental work, specimens are prepared using untreated AISI-4140 alloy steel that is well known to possess high tensile strength and shock resistance properties. The major elements in this alloy and its composition are shown in Table 1. This material comes with remarkable physical properties, such as a yield strength of 415 MPa, an ultimate strength of 655 MPa, and a hardness of 219 BHN [14], which make it desirable for various applications.
2.2. Specimen Preparation for Fracture Toughness Test
In order to have flat specimens for the fracture test, a Ø80 mm hot-rolled bar was used as the raw material. The C(T) specimen is a better choice to model the crack growth in mode-I; accordingly, the C(T) specimen is considered in this study. Figure 1 shows the proportions of C(T) specimens as per ASTM standard E 399-90 [10]. The dimensions of each specimen are decided based on thickness (B). The thickness is obtained using Equation (1), by assuming an approximate value of KIC and knowing the yield strength (Sy) of the material. Equation (1) ensures the plane-strain condition, which is essential for determining the fracture toughness of the material.
Crack length in the specimen is maintained at about a/W = 0.45, including the length of the straight line through the notch. This crack provided in the specimen is obtained by means of wire-cut electrical discharge machining (EDM). The specimen is provided with a pair of accurately machined knife edges that support the gauge arms and serve as the displacement reference points. These knife edges are machined and are integral within the specimen, as shown in Figure 1. Accurate machining of a notch and knife edge region is carried out for the mounting of a crack-opening displacement (COD) gauge.
Assuming an approximate value of fracture toughness of 50 MPa for AISI-4140 steel [11,15] and using the modulus of elasticity (E), 0.2% yield strength (Sy), determined from the monotonic test [16], the minimum thickness of the C(T) specimen required is determined with the help of Equation (1). To confirm that the fracture toughness values obtained correspond to the plane-strain condition, five specimens of thicknesses of 12.5 mm, 20 mm, and 25 mm are considered based on the available dimensions of the mounting fixture. All the C(T) specimens of the L-R type are machined from the round bar. The initial crack length provided in each specimen corresponds to a/W of 0.44 to 0.46. Table 2 shows the major dimensions of the C(T) specimen used for AISI-4140 steel, and Figure 2 shows the image of these three specimens.
2.3. Fracture Toughness Test
For the determination of the fracture toughness of AISI-4140 alloy steel, a test is carried out on a UTM machine with a 50 kN load-applying capacity with the provision for the autographic recording of the load applied to the specimen. The fixtures used for mounting the specimen are designed as per ASTM standard E 399-90 [11], to minimize the frictional contributions to the measured load. The COD gauge output indicates the relative displacement of two precisely located gauge positions spanning the crack initiation notch mouth. Necessary measures are taken to ensure an accurate and positive positioning of the gauge on the specimen for obtaining the desired readings. The gauge is released without damage when the specimen breaks. Figure 3 shows the specimen mounted in the machine for the fracture toughness test.
A crack was initiated on the testing plane using a fatigue load at 10 Hz in the region of a pre-existing cut that was introduced in the specimen via wire-cut EDM [17]. Initial cracking is performed for about 0.5 to 1 mm in constant loading and at a very low positive stress ratio R. Later, the pre-cracking is extended until a/W reaches values of 0.5 to 0.51 at R = 0.3, to reduce the test’s duration. Further, the specimen is subjected to tensile loading at 0.55 to 2.75 MPa, and a record of load vs. displacement is noted. The maximum load corresponding to the linear portion of the load–displacement curve is noted as PQ and the maximum load recorded is Pmax, as shown in Figure 4. Corresponding to these two values of forces, stress intensity factors KQ and Kmax are determined using the expression of stress intensity factor and the geometry constant for the C(T) specimen. If Pmax/PQ ≤ 1.1, then KQ is considered as the fracture toughness of the material [11]. If not, the test is declared invalid.
2.4. Scanning Electron Microscopy (SEM) Imaging and EDS Analysis
The ZEISS EVO-MA18 SEM instrument is used to analyze the fractured surface. The quantitative chemical composition of the fractured surface was examined using the Oxford EDS attachment associated with the SEM instrument. SEM images were taken at 500×, 1500× and 3000× magnifications over different regions of the surface, and the chemical composition is captured at the selected location.
3. Results
3.1. Evaluation of Fracture Toughness
Initial pre-cracking was carried out via fatigue loading, as explained above, and the fracture toughness values were obtained via tensile loading. The load–displacement curve obtained during the test is shown in Figure 5. The fracture toughness test was not a failure for both the 20 mm and 25 mm thickness specimens, as shown in Table 3.
As the experimental and assumed value of KIc are close, the design of the C(T) specimen in terms of thickness is valid. Therefore, obtained KIC values corresponds to the plane-strain fracture toughness. By averaging these two values, the recommended fracture toughness value for AISI-4140 alloy steel is found to be 44.8 MPa . Figure 6 shows all three failed specimens.
3.2. Scanning Electron Microscopy (SEM)-Based Fractography
The tested specimens were cleaned using an ultrasonic cleaning procedure before conducting SEM imaging. This helps in shedding debris or loose particles that may be stuck to their surface. Figure 7a,b shows the top and side view of a fractured specimen, while Figure 7c shows the overall view of the fractured surface in an SEM image. As seen in Figure 7, the specimen is divided into three zones, namely i, ii, and iii. Figure 8 shows the surface topography of different zones of the tested specimen. Each column of stacked images shows each zone, with varying magnifications. For example, in the first column, zone ‘i’ is shown in the first image with a magnification of 500×, in the second image with a magnification of 1500×, and in the third image with a magnification of 3000×. Similarly, columns two and three show the surfaces of zone ii and iii, respectively, with magnifications of 500×, 1500×, and 3000×.
3.3. Energy Dispersive X-ray Spectroscopy (EDS)
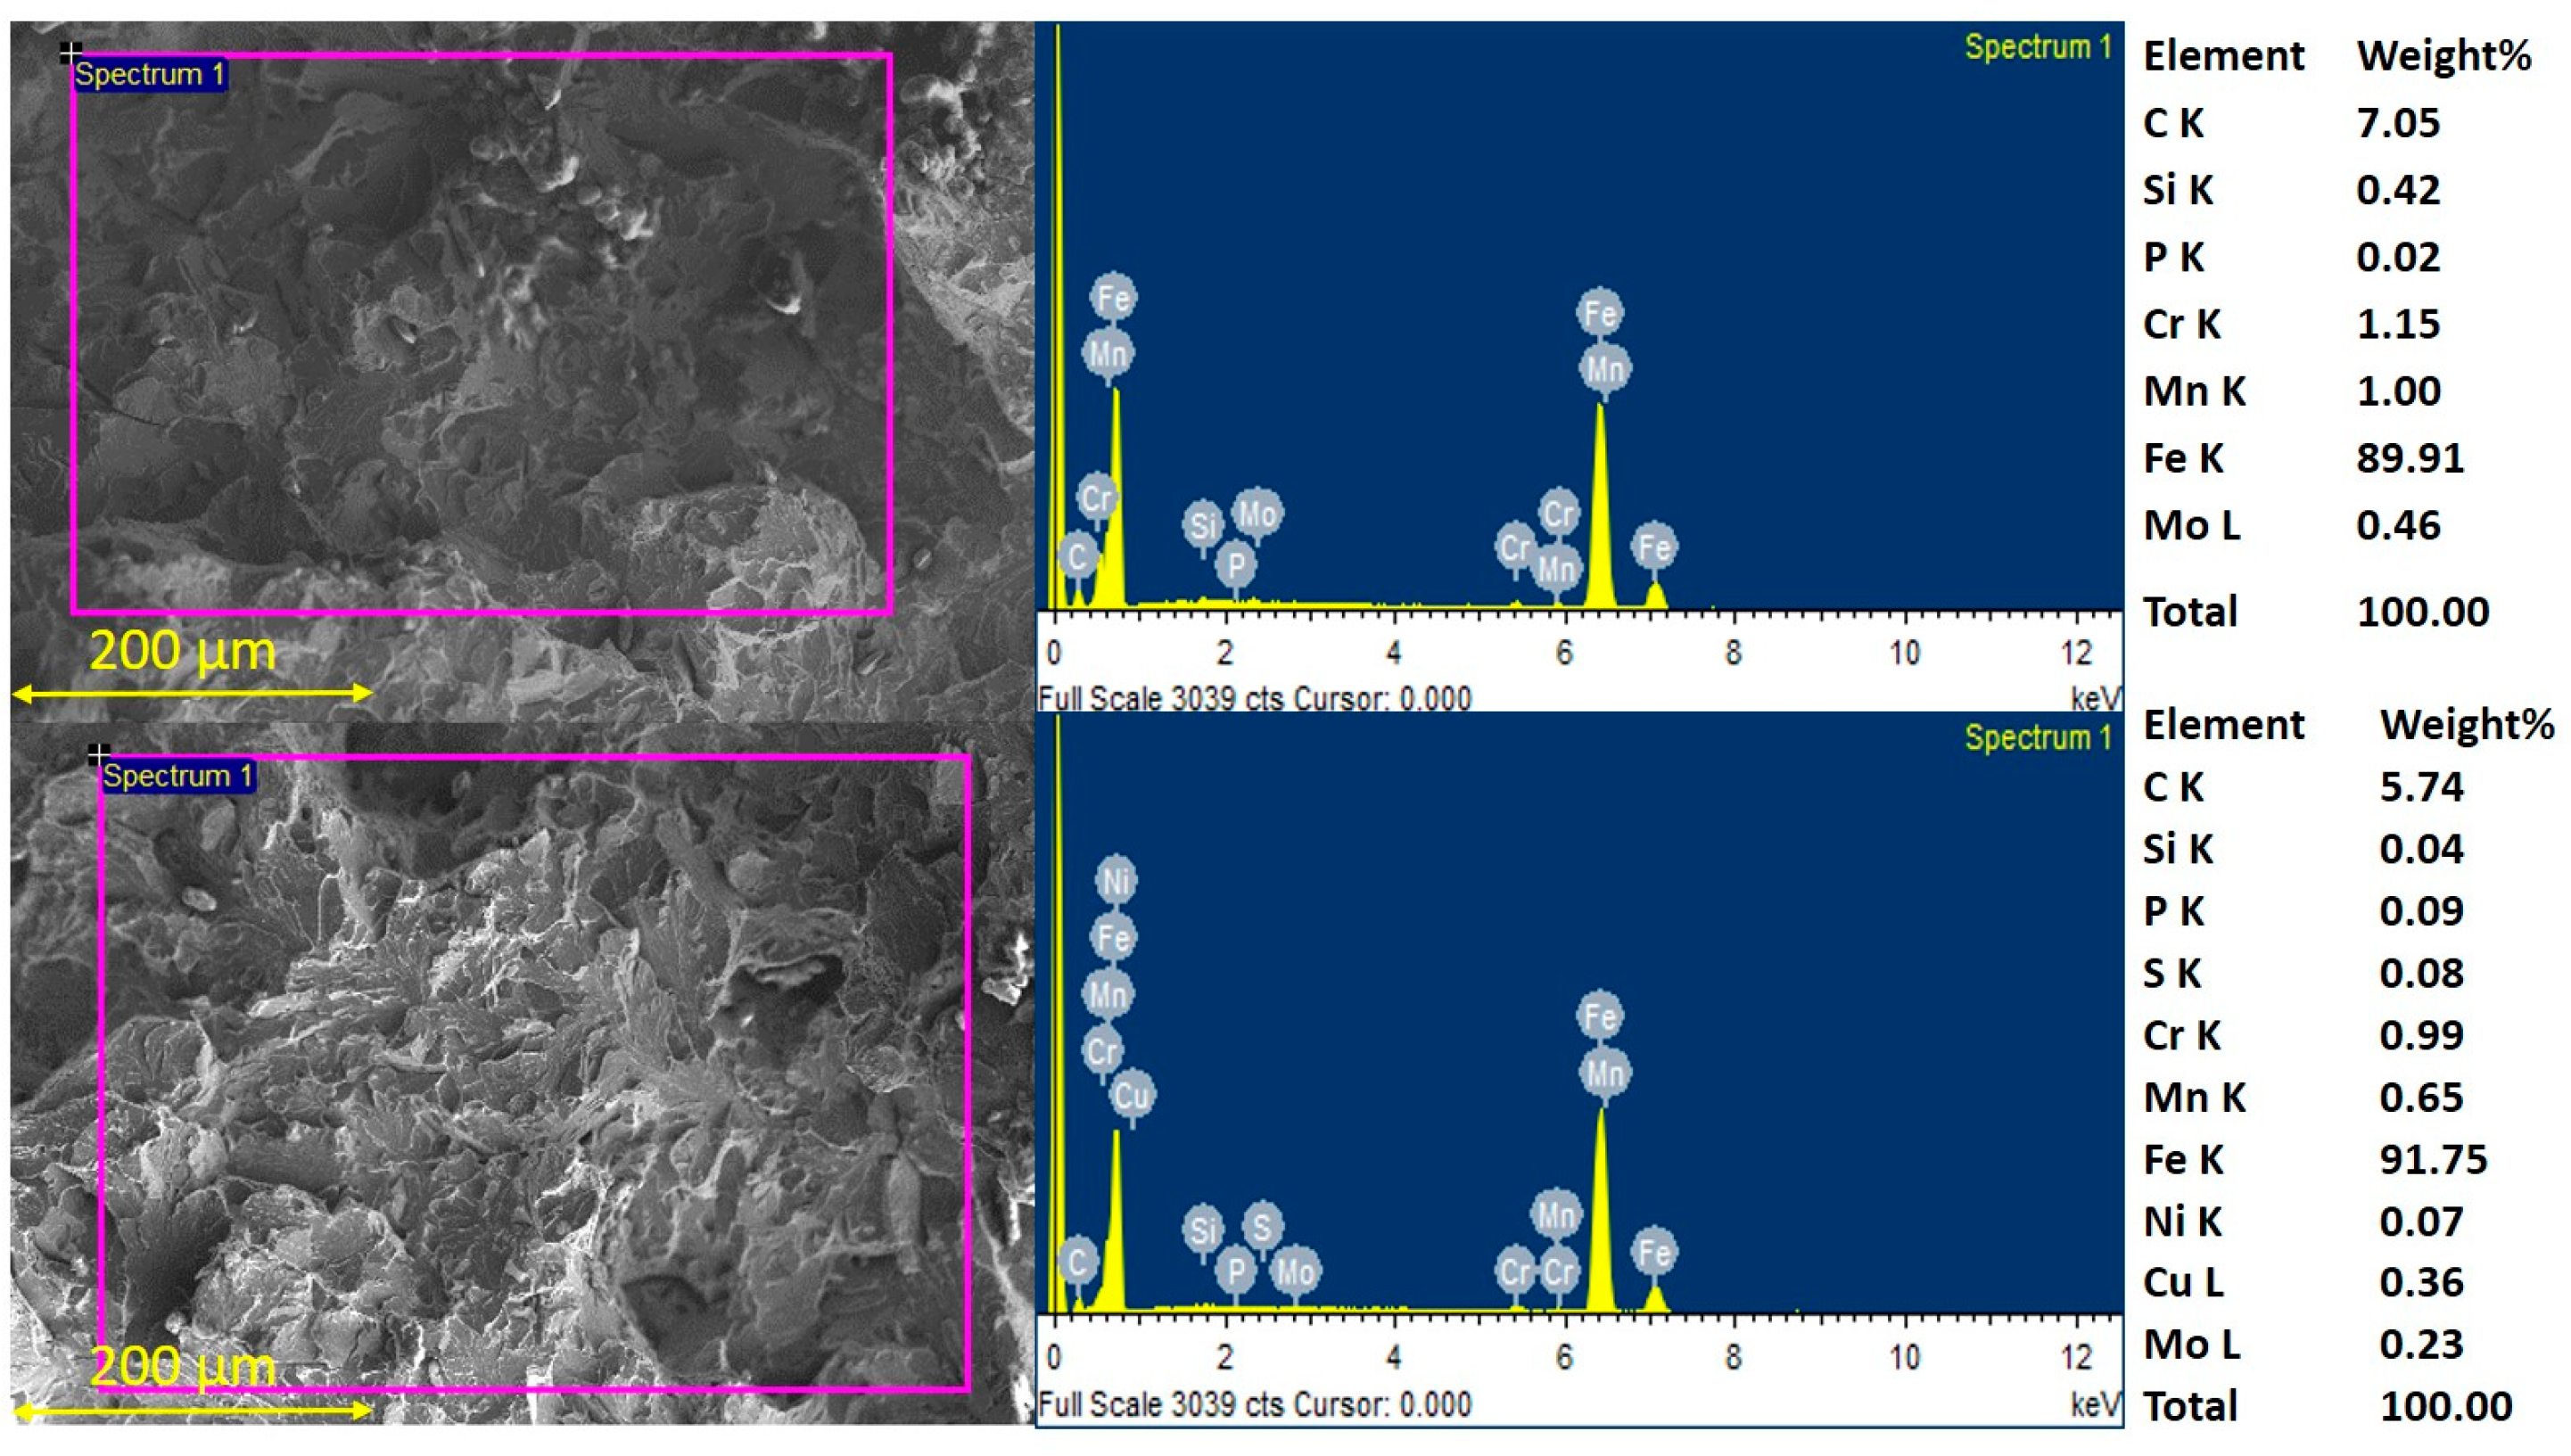
Energy dispersive spectroscopy (EDS) analyses were used to detect and quantify elements present in the fractured regions of the AISI-4140 specimens. The findings from this EDS analysis have been reported in the tables provided on the right of each EDS analysis image in Figure 9.
4. Discussion
Fracture Toughness and Failure Analysis
The design of the C(T) specimen is important to obtain the appropriate fracture toughness value. The design primarily refers to the determination of the specimen thickness, as other dimensions are decided in accordance with this thickness. Specimen thickness is determined by assuming an appropriate value of fracture toughness, which is not known initially. By referring to the literature, an approximate value can be assumed; in this case, it was assumed as 50 MPa . The critical stress intensity factor is thickness-dependent and it increases with a decrease in the thickness value. At the threshold thickness, the critical stress factor is minimum and further increases in thickness will not result in any change in the critical stress intensity factor. This threshold value of the critical stress intensity factor is considered as the fracture toughness of a material. By considering the assumed value of fracture toughness and using Equation (1), we obtained the minimum specimen thickness as 18 mm. To ensure that our test results confirm the fracture toughness test, specimens with thicknesses of more than 18 mm and also less than 18 mm were considered.
The fracture toughness test for both the 12.5 mm thickness specimens failed, and the test results for the 20 mm and 25 mm thicknesses are valid. But the test result shows that there is hardly any variation in these fracture toughness values, and this confirms that our assumed value of fracture toughness is correct. Also, specimen thicknesses like 20 mm and 25 mm are valid for determining the fracture toughness of AISI-4140 alloy steel. Therefore, an average value of fracture toughness was considered with reference to the 20 mm and 25 mm thicknesses. On obtaining the fracture toughness value as 44.8 MPa , the specimen thickness was recalculated again, and its value was a minimum of 15 mm. This confirms our selection of specimen thickness and also confirms the validity of our experimental work. Wahab A M A et al. [18] and Tecer M. M. [5] have recorded the fracture toughness of AISI-4140 alloy steel as 48 MPa . Therefore, our obtained value of fracture toughness of AISI-4140 alloy steel is in line with the literature.
Energy dispersive X-ray spectroscopy was used to determine the elemental composition of the material at different regions in its microstructure, as shown in Figure 9. The composition values are measured in weight%, and these values are close to the listed values in Table 1 of the Materials and Methodology section. This confirms the composition. The failed surface of the specimen analyzed under SEM shows three distinct regions, as shown in Figure 7 and Figure 8, marked as regions ‘i, ii, and iii’. The region marked ‘i’ shows the surface morphology generated during the making of a pre-cut path using wire-cut EDM. Here, the effect of the high temperature caused at the point of spark can be seen, as shown in Figure 7a, where it has been highlighted by drawing two lines. The SEM image taken at 20× provides an overall view of the three zones, shown in Figure 7c, and higher magnification images taken at 500×, 1500×, and 3000× are shown in the first column of Figure 8i. The higher magnification images show that the burnt regions occurred on the surface due to the intense thermal energy generated during electrical discharges at the localized points of contact between the wire and work-piece during the making of the pre-cut, as shown in Figure 2.
The region marked as ‘ii’ in Figure 7 and Figure 8 is related to the fracture toughness test. The origin of the crack started from this zone during the initiation of the pre-crack using fatigue loading. Zone ‘ii’ shows a relatively smoother surface compared to zone ‘iii’. The length of this zone is found to be approximately 3 mm in both the 20 and 25mm specimens. But it is hypothesized that the crack length generated during pre-cracking due to fatigue loading was around or less than 0.5 mm, and onwards from this, the crack further propagated until it reached the critical length (≈3 mm) value under tensile loading, and onwards from that, it showed a sudden failure.
Figure 7a,c shows more in-plane fracture in zone ‘ii’ compared to zone ‘iii’. The comparison of the higher magnification images of these zones shown in Figure 8 indicates the formation of cleavage facets, and these formations are more clearly visible in zone ‘iii’. Cleavage facets indicate the presence of a brittle fracture mechanism, and here, the propagation of cracks is happening by breaking the atomic bonds along the specific crystal planes. SEM images of zone ‘iii’ also show cleavage cracks and micro-void formations in some locations. Cleavage fracture is common in metals with crystalline structures and occurs when fracture faces are perpendicular to the direction of the highest principle stress [19]. The presence of micro-voids on the surface indicates the ductile–brittle transition during sudden failure. Images taken at higher magnifications show the river lines and fracture facets cutting through the grains in a trans-granular manner; a similar observation was made in reference [20], indicating that the fracture propagates through the interior of the material, rather than along grain boundaries. This provides insights into the material’s internal structure and the path taken by the propagating crack. Zone ii shows several local cracks between facets at 3000× magnification. Also, it is important to note that AISI-4140 alloy steel is typically of a body-centered cubic (BCC) structure, and this might have played a role in cleavage fracture behavior observed in fracture toughness testing. The observed features on the fractured surface provide clues about the crack’s propagation and the nature of the fracture. Overall, this investigation of the fracture toughness of AISI-4140 alloy steel provides significant insights into the material’s fracture behavior and procedures to be followed for accurate evaluations of the fracture toughness properties of any other materials.
5. Conclusions
Fracture toughness evaluations are a critical aspect of material testing, particularly for metals like the AISI-4140 steel alloy, which is widely used in various industries. The extracted information presented in this paper will be of significant importance for considering the safety and reliability, failure prevention, and maintenance of structures. The extraction of these properties from any material needs clarity on many aspects related to utilization of the plane-strain fracture toughness equation, specimen design, and experiments. In this work, all of these procedural steps were followed for an evaluation of the fracture toughness of AISI-4140 alloy steel. The average value of fracture toughness was found to be 44.8 MPa , and our failure analysis using SEM showed the brittle fracture mechanism. To confirm this fracture toughness value test result, five specimens were considered in the current work; but, in general, a minimum of three specimens satisfying the plane-strain condition are required.
Author Contributions
Conceptualization and experiments, Y.S.U.; characterization—Vishwanath Managuli; formal analysis, Y.S.U. and V.M.; resources—Y.S.U.; writing—original draft preparation—R.B.K. and N.S.P. and Y.S.U.; writing—review and editing, V.M. and Y.S.U.; supervision, Y.S.U. All authors have read and agreed to the published version of the manuscript.
Funding
This research received no external funding.
Institutional Review Board Statement
Not applicable.
Informed Consent Statement
Not applicable.
Data Availability Statement
The manuscript contains all the required data.
Acknowledgments
We acknowledge the Bangalore Integrated System Solutions (BISS), and the Central Instrumentation Facility (CIF), Manipal Institute of Technology, Manipal Academy of Higher Education, Karnataka, India—576104, for providing access to the analytical instruments required for the specimen preparation and experimental testing in the specimen surface analysis.
Conflicts of Interest
The authors declare no conflict of interest.
References
- Hohenwarter, A.; Pippan, R. Fracture and fracture toughness of nanopolycrystalline metals produced by severe plastic deformation. Philos. Trans. R. Soc. A 2015, 373, 20140366. [Google Scholar] [CrossRef] [PubMed]
- Sadananda, K.; Vasudevan, A.K. Fatigue crack growth behavior of titanium alloys. Int. J. Fatigue 2005, 27, 1255–1266. [Google Scholar] [CrossRef]
- Launey, M.E.; Ritchie, R.O. On the fracture toughness of advanced materials. Adv. Mater. 2009, 21, 2103–2110. [Google Scholar] [CrossRef]
- Takesue, S.; Hayama, M.; Komotori, J. Effect of atmospheric-controlled induction-heating fine particle peening on microstructure and fatigue properties of low-alloy steel. Fatigue Fract. Eng. Mater. Struct. 2022, 45, 2908–2919. [Google Scholar] [CrossRef]
- Tecer, M.M. Effects of various heat treatment procedures on the toughness of AISI 4140 low alloy steel. Int. J. Mater. Eng. Technol. 2020, 3, 131–149. [Google Scholar]
- Feng, J.; Wettlaufer, M. Plane-strain fracture toughness of AISI 4140 steel austempered below MS. Mater. Sci. Eng. A 2019, 743, 494–499. [Google Scholar] [CrossRef]
- Nagarajan, V.R.; Putatunda, S.K.; Boileau, J. Fatigue Crack Growth Behavior of Austempered AISI 4140 Steel with Dissolved Hydrogen. Metals 2017, 7, 466. [Google Scholar] [CrossRef]
- Park, H.J.; Kim, B.S.; Ahn, C.S.; Cho, K.T.; Moon, K.I.; Kim, S.S. Fracture Behavior of Ion-Nitrided AISI 4140 Steel in accordance with Variable Applied Current Density. Adv. Mater. Sci. Eng. 2022, 2022, 6244566. [Google Scholar] [CrossRef]
- Ozturk, M.; Husem, F.; Karademir, I.; Maleki, E.; Amanov, A.; Unal, O. Fatigue crack growth rate of AISI 4140 low alloy steel treated via shot peening and plasma nitriding. Vacuum 2023, 207, 111552. [Google Scholar] [CrossRef]
- ASTM Standard E 399-90 (Reapproved 1997); Standard Test Method for Plane-Strain Fracture Toughness of Metallic Materials. American Society for Testing of Materials: West Conshohocken, PA, USA, 1997.
- Dowling, N.E. Mechanical Behaviour of Materials, 2nd ed.; Prentice Hall: Saddle River, NJ, USA, 1999. [Google Scholar]
- Huang, Y.; Wang, X. On the fracture toughness testing for single-edge notched bend specimen of orthotropic materials. Compos. Struct. 2022, 281, 114970. [Google Scholar] [CrossRef]
- Geethanjali, K.S.; Ramesha, C.M.; Chandan, B.R. Comparative studies on machinability of MCLA steels EN19 and EN24 using Taguchi optimization techniques. Mater. Today Proc. 2018, 5, 25705–25712. [Google Scholar] [CrossRef]
- Saajsteel. Available online: https://www.saajsteel.com/alloy-steel-round-bar-manufacturers-and-suppliers-in-chennai/en19-alloy-steel-bar-manufacturers-suppliers-in-chennai/ (accessed on 7 July 2023).
- Kumar, P. Elements of Fracture Mechanics; McGraw-Hill Education LLC: New York, NY, USA, 2009. [Google Scholar]
- Upadhyaya, Y.S.; Sridhara, B.K. Fatigue life prediction: A continuum damage mechanics and fracture mechanics approach. Mater. Des. 2012, 35, 220–224. [Google Scholar] [CrossRef]
- Madyira, D.M.; Akinlabi, E.T. Effects of wire electrical discharge machining on fracture toughness of grade 5 titanium alloy. Proc. World Congr. Eng. 2014, 2, 1393–1398. [Google Scholar]
- Wahab, A.A.; Mokhtar, E.G.; Mazen, A. Effect of heat treatment on the fracture toughness of AISI 4140 Steel. Minia J. Eng. Technol. 2014, 33, 1–6. [Google Scholar]
- Horwood, A.; Chockalingam, N. Clinical Biomechanics in Human Locomotion: Origins and Principles; Elsevier: Amsterdam, The Netherlands, 2023; Chapter 2. [Google Scholar]
- Moore, P.L.; Booth, G. Brittle fracture and the behavior of cracks in structures. In The Welding Engineer’s Guide to Fracture and Fatigue; Moore, P., Booth, G., Eds.; Woodhead Publishing: Thorston, UK, 2014; Volume 1, pp. 45–63. [Google Scholar]
Figure 1.
Schematic of the specimen showing front and side views with dimensions.
Figure 2.
C(T) specimens of AISI-4140 alloy steel.
Figure 3.
Specimen mounted in the machine for fracture toughness test.
Figure 4.
A typical load–COD curve.
Figure 5.
Load–COD curve for the 20 and 25 mm thicknesses of AISI-4140 in the KIC test.

Figure 6.
Failed fracture toughness test specimens of AISI-4140.
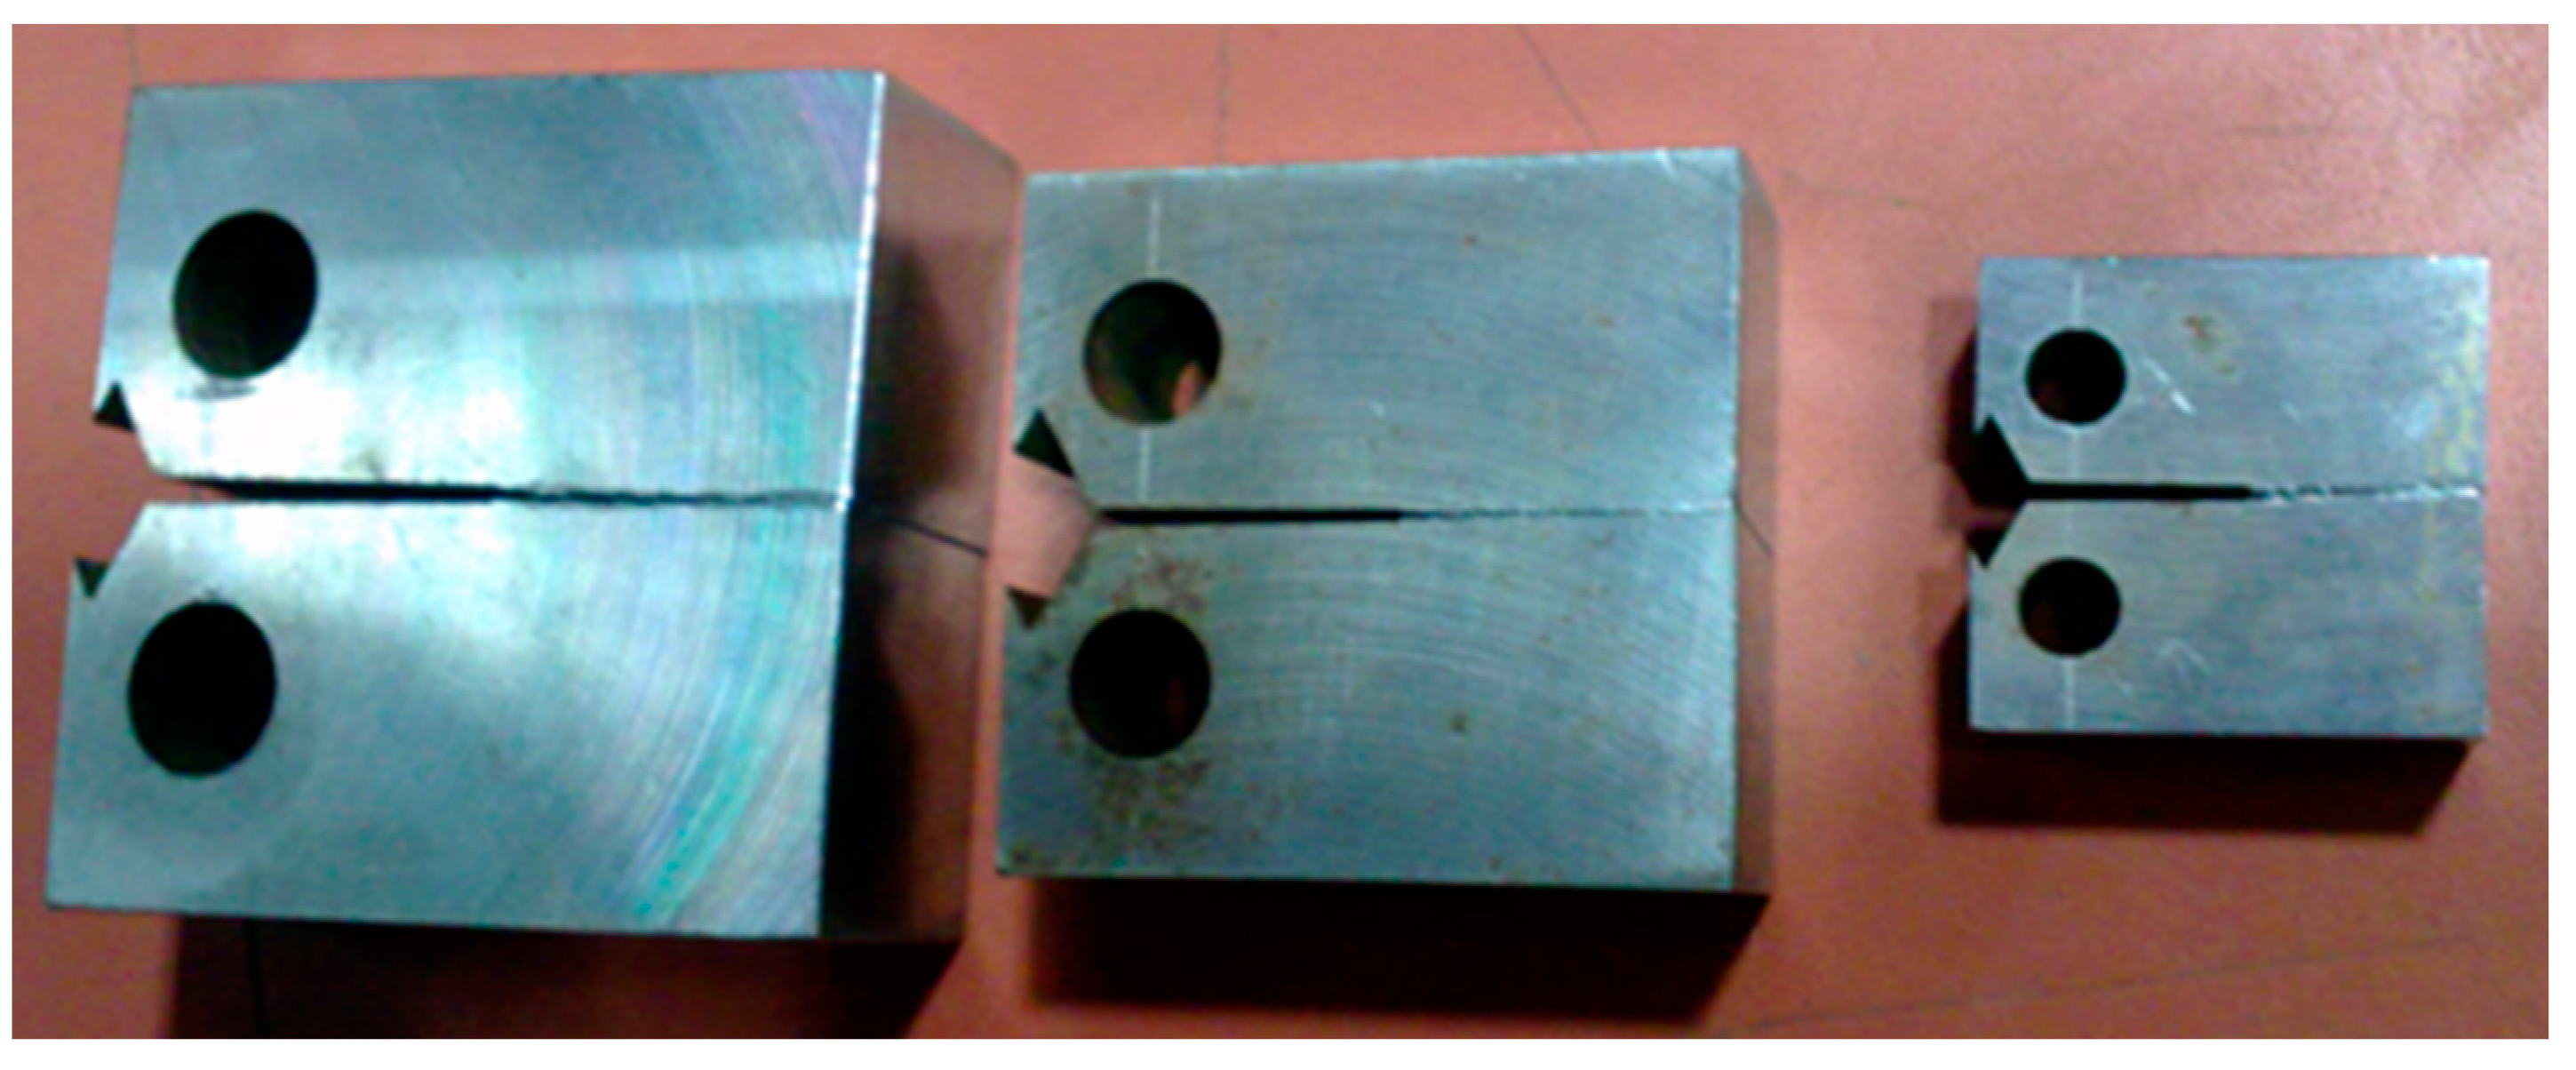
Figure 7.
(a,b) Top and side view of the fractured specimen; (c) SEM image taken at 20× showing distinct regions over the failed surface. The specimen is divided into three zones, namely i, ii, and iii, as shown in figure (a,c).
Figure 7.
(a,b) Top and side view of the fractured specimen; (c) SEM image taken at 20× showing distinct regions over the failed surface. The specimen is divided into three zones, namely i, ii, and iii, as shown in figure (a,c).

Figure 8.
SEM images showing the observed surface features in different zones of the tested specimen. The specimen is divided into three zones, namely i, ii, and iii and represented the respective zone images in column format. The first row of images is taken at 500× magnification; the second- and third-row images are taken at 1500× and 3000× magnifications.
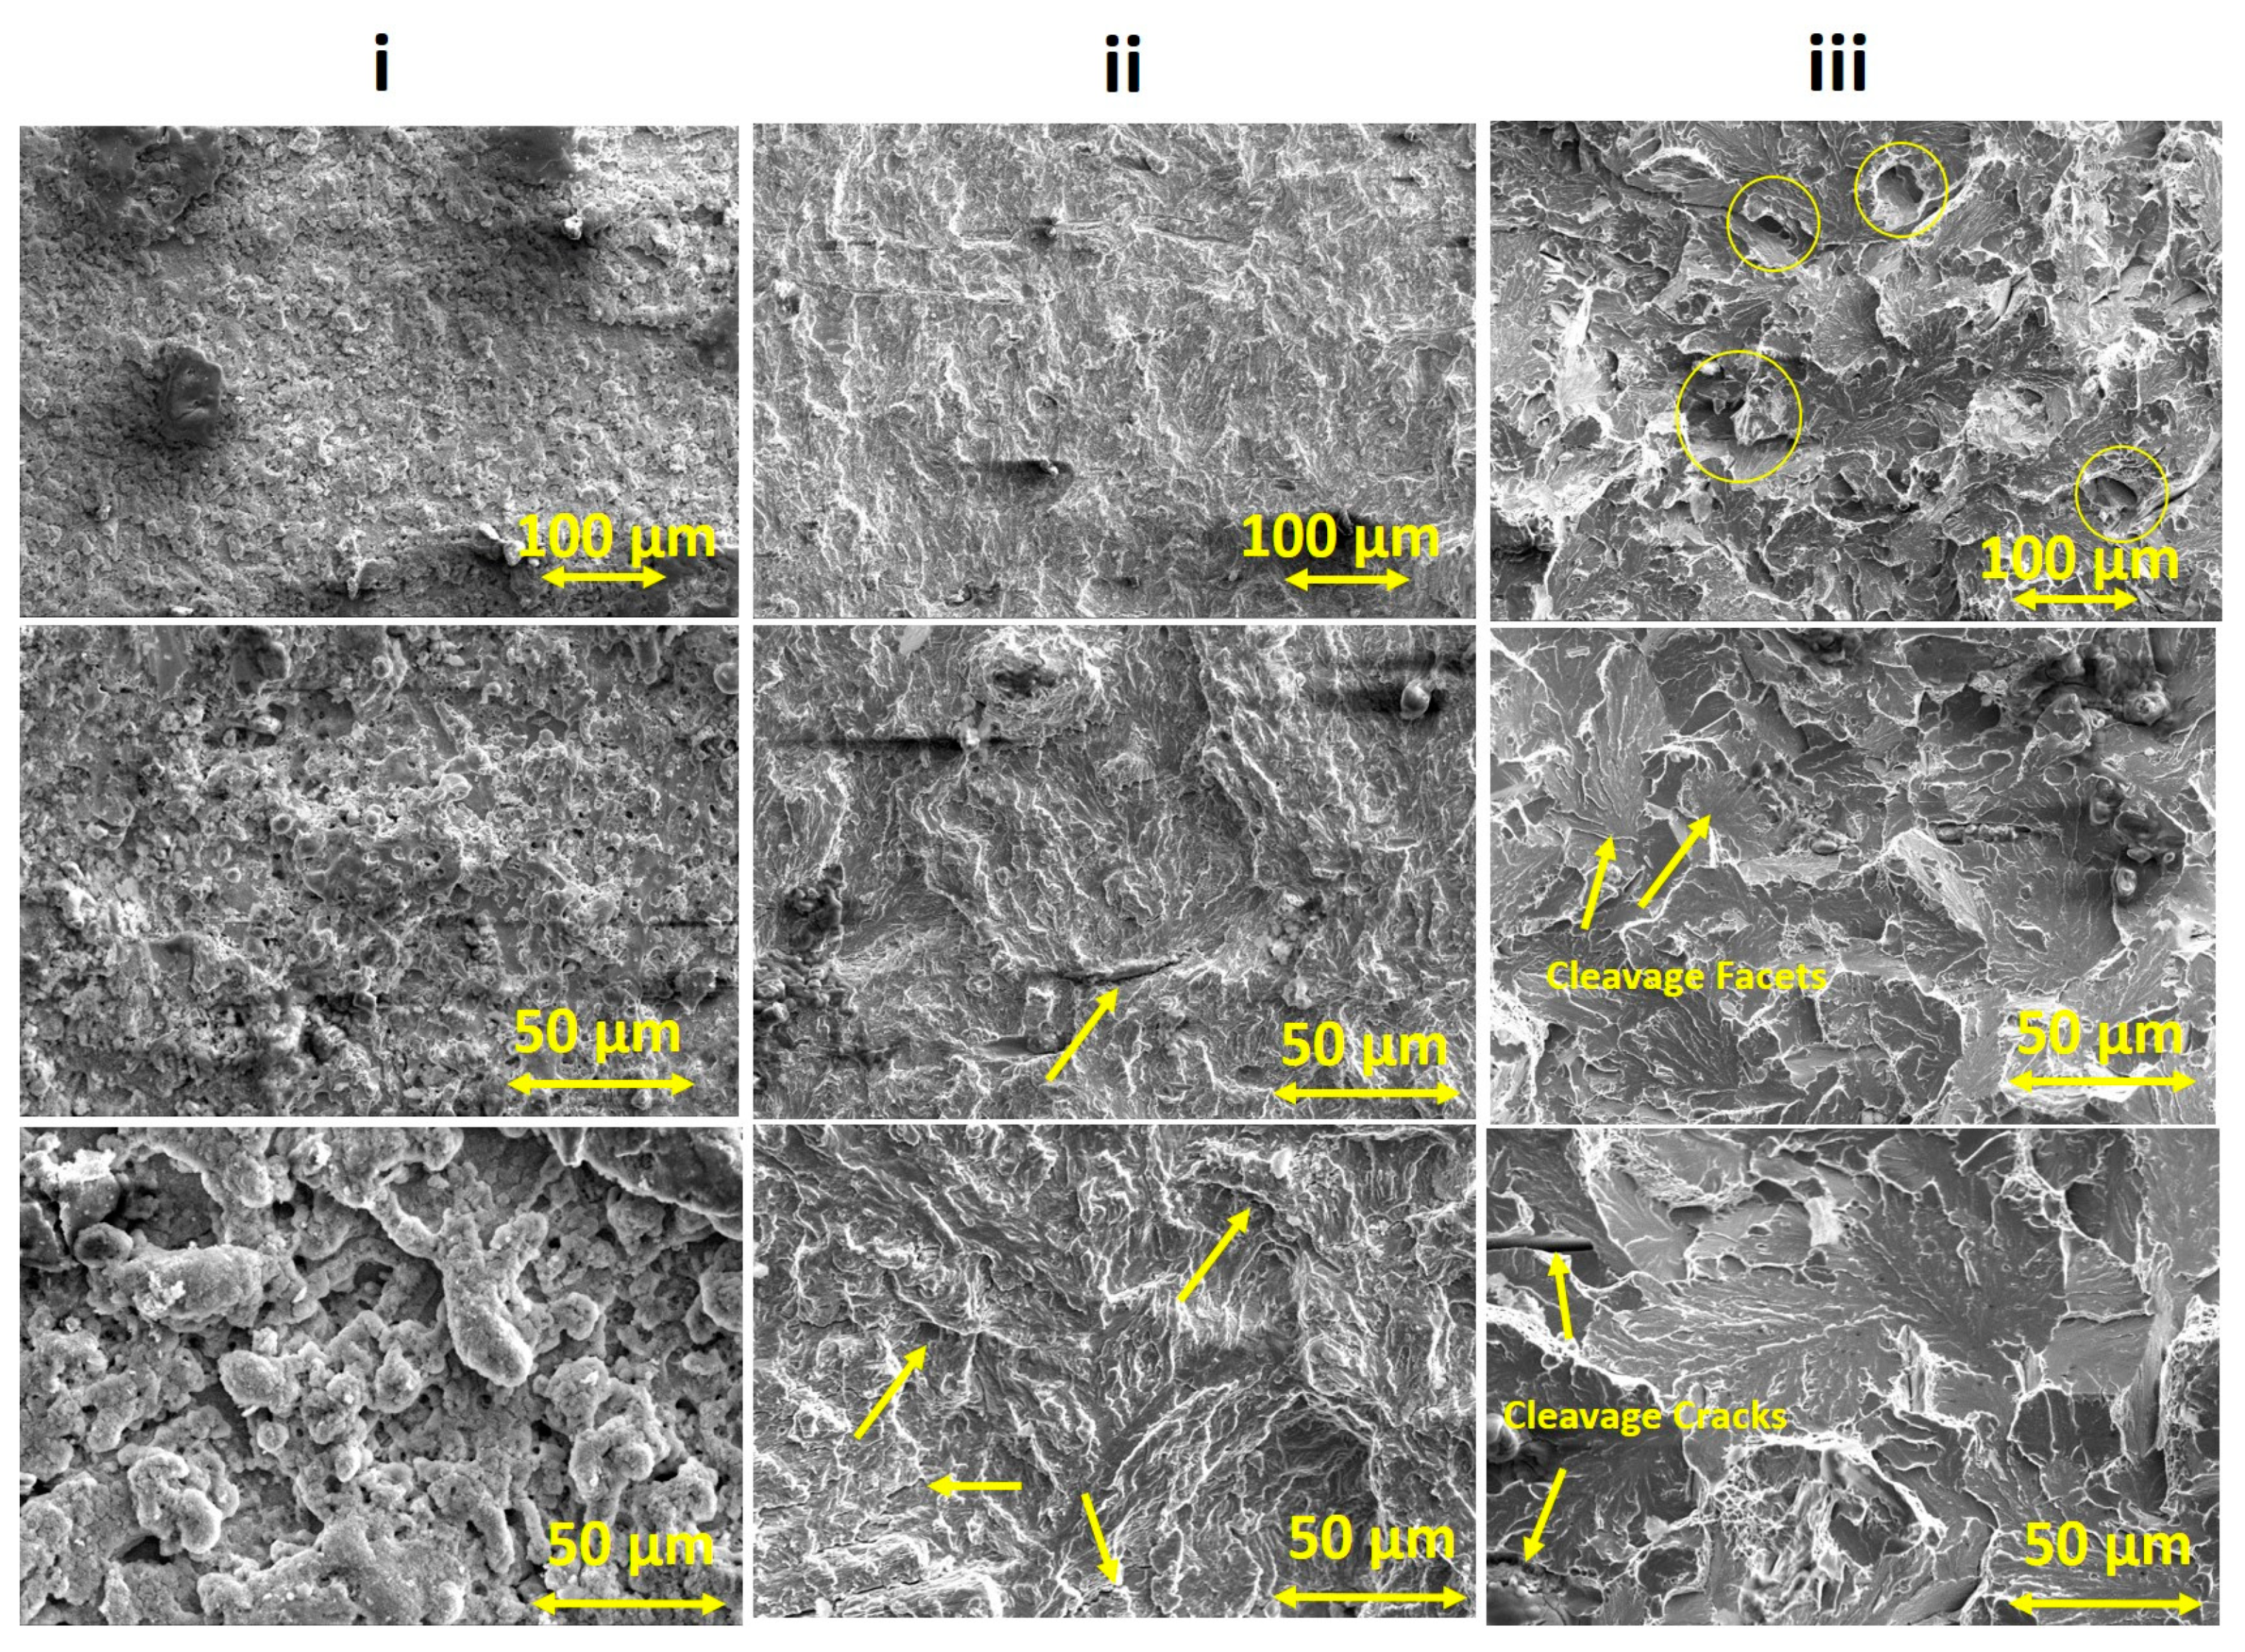
Figure 9.
EDS analyses of different zones over the failed specimen surface.

Table 1.
Chemical composition of AISI-4140 alloy steel.
| Constituents | C | Si | Mn | S | P | Cr | Mo | Fe |
|---|---|---|---|---|---|---|---|---|
| % by weight | 0.42 | 0.28 | 0.67 | 0.027 | 0.031 | 1.03 | 0.22 | Balance |
Table 2.
C(T) specimen dimension (mm) of AISI-4140 alloy steel, as prescribed by ASTM standard E 399-90 [11].
Table 2.
C(T) specimen dimension (mm) of AISI-4140 alloy steel, as prescribed by ASTM standard E 399-90 [11].
| No. | Thickness (B) | Width (W) | Crack Length (a) | No. of Specimens |
|---|---|---|---|---|
| 1 | 12.5 | 25 | 11 | 2 |
| 2 | 20 | 40 | 18 | 1 |
| 3 | 25 | 50 | 23 | 2 |
Table 3.
Fracture toughness values obtained for specimens of different thicknesses.
| Thickness (B) mm | ) | Pmax/PQ |
|---|---|---|
| 20 | 44.5 | 1.01 |
| 25 | 45.1 | 1 |
Disclaimer/Publisher’s Note: The statements, opinions and data contained in all publications are solely those of the individual author(s) and contributor(s) and not of MDPI and/or the editor(s). MDPI and/or the editor(s) disclaim responsibility for any injury to people or property resulting from any ideas, methods, instructions or products referred to in the content. |
© 2023 by the authors. Licensee MDPI, Basel, Switzerland. This article is an open access article distributed under the terms and conditions of the Creative Commons Attribution (CC BY) license (https://creativecommons.org/licenses/by/4.0/).
Share and Cite
MDPI and ACS Style
Upadhyaya, Y.S.; Kottawar, R.B.; Patil, N.S.; Managuli, V. Investigation of Plane-Strain Fracture Toughness and Failure Analysis of AISI-4140 Alloy Steel. Eng. Proc. 2023, 59, 119. https://doi.org/10.3390/engproc2023059119
AMA Style
Upadhyaya YS, Kottawar RB, Patil NS, Managuli V. Investigation of Plane-Strain Fracture Toughness and Failure Analysis of AISI-4140 Alloy Steel. Engineering Proceedings. 2023; 59(1):119. https://doi.org/10.3390/engproc2023059119
Chicago/Turabian StyleUpadhyaya, Y. S., Rutuja Balaji Kottawar, Narahari Suresh Patil, and Vishwanath Managuli. 2023. "Investigation of Plane-Strain Fracture Toughness and Failure Analysis of AISI-4140 Alloy Steel" Engineering Proceedings 59, no. 1: 119. https://doi.org/10.3390/engproc2023059119