
Design and Implementation of Hardware-Implemented Dual-Axis Solar Tracking System for Enhanced Energy Efficiency †

Abstract
:1. Introduction
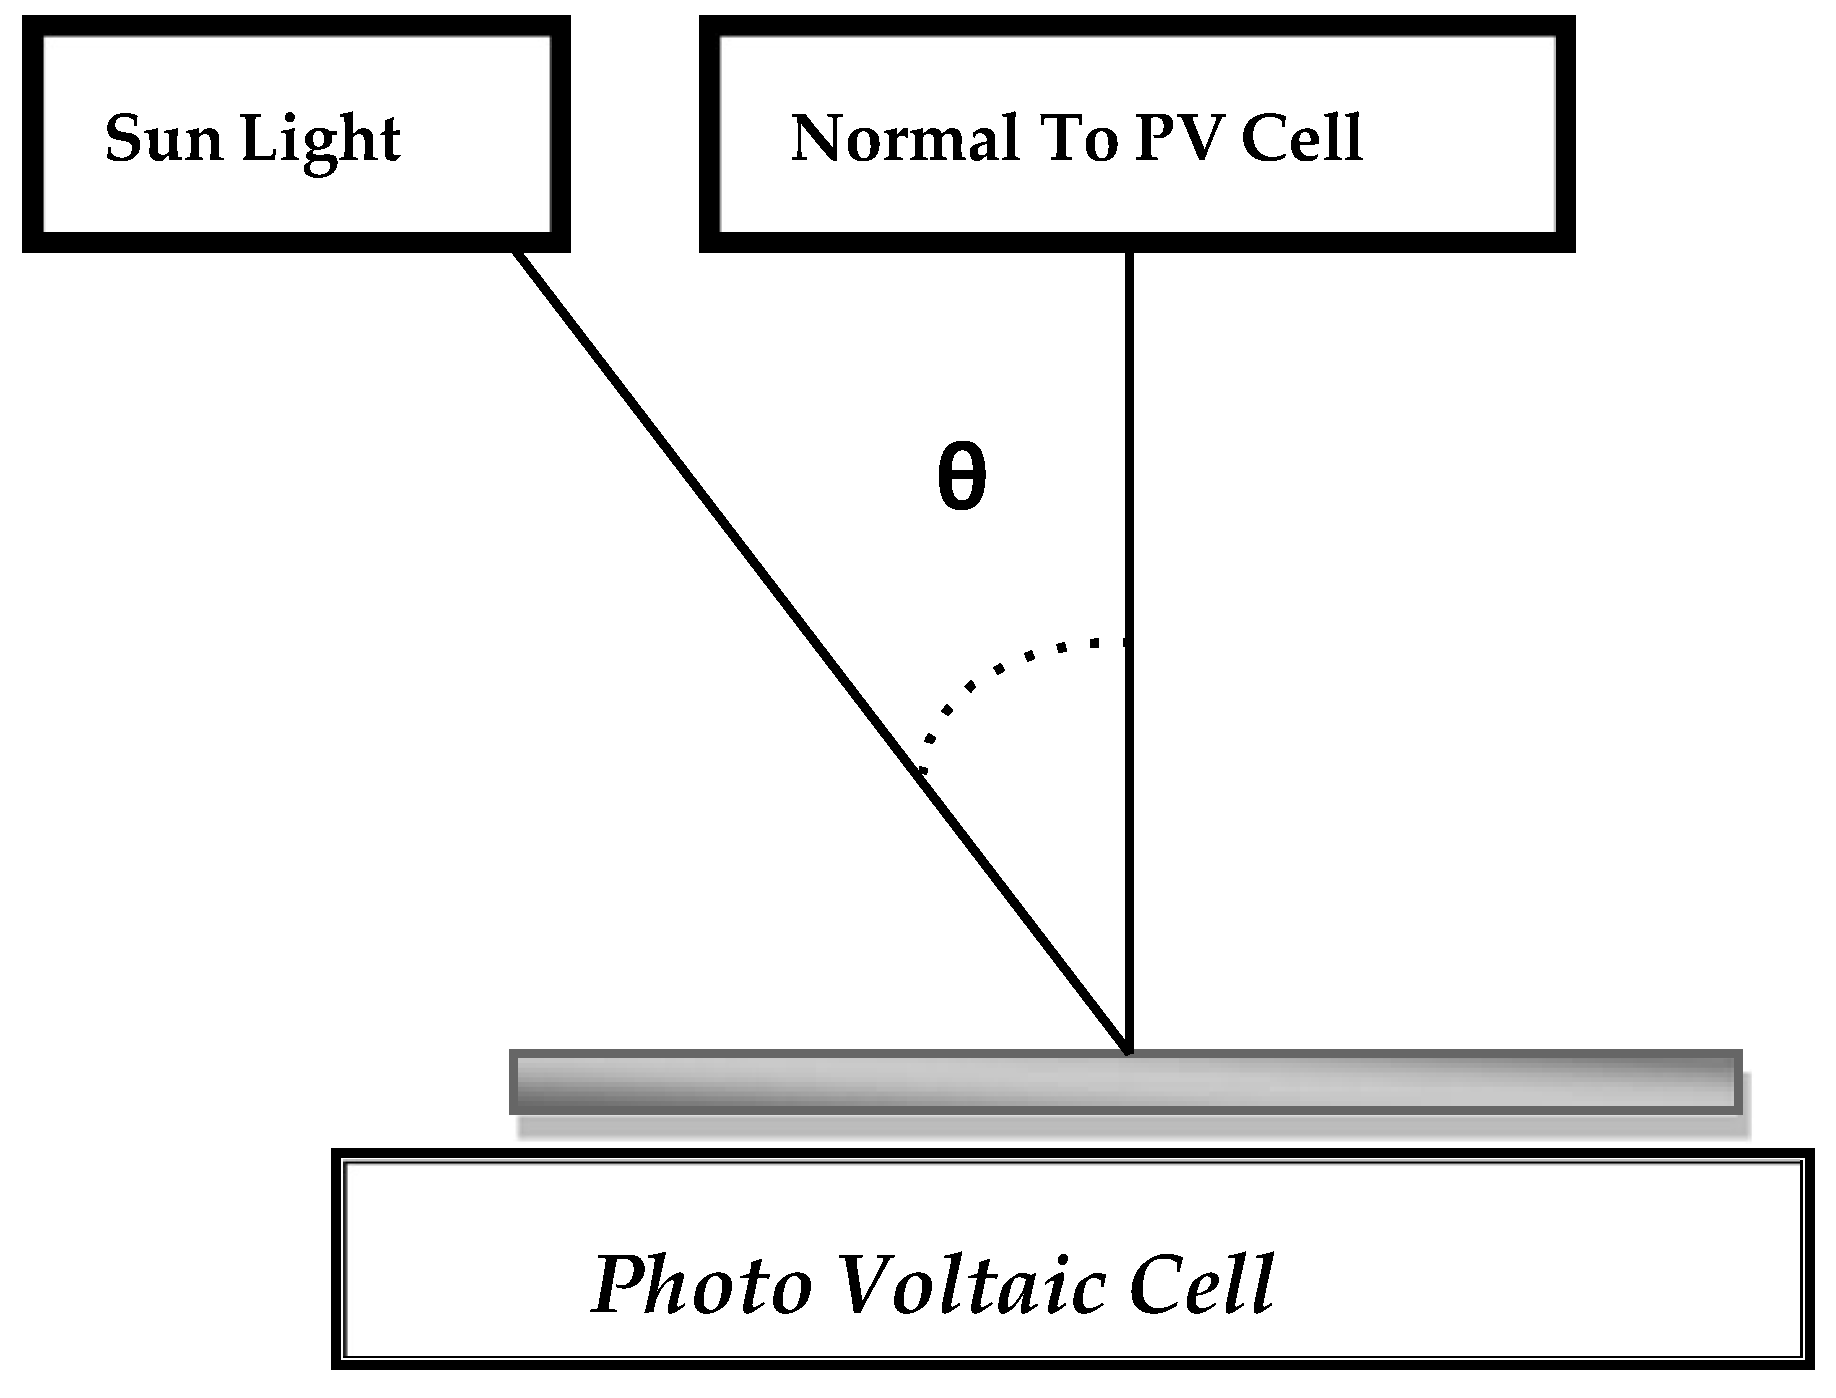
2. Requirement of Tracking System
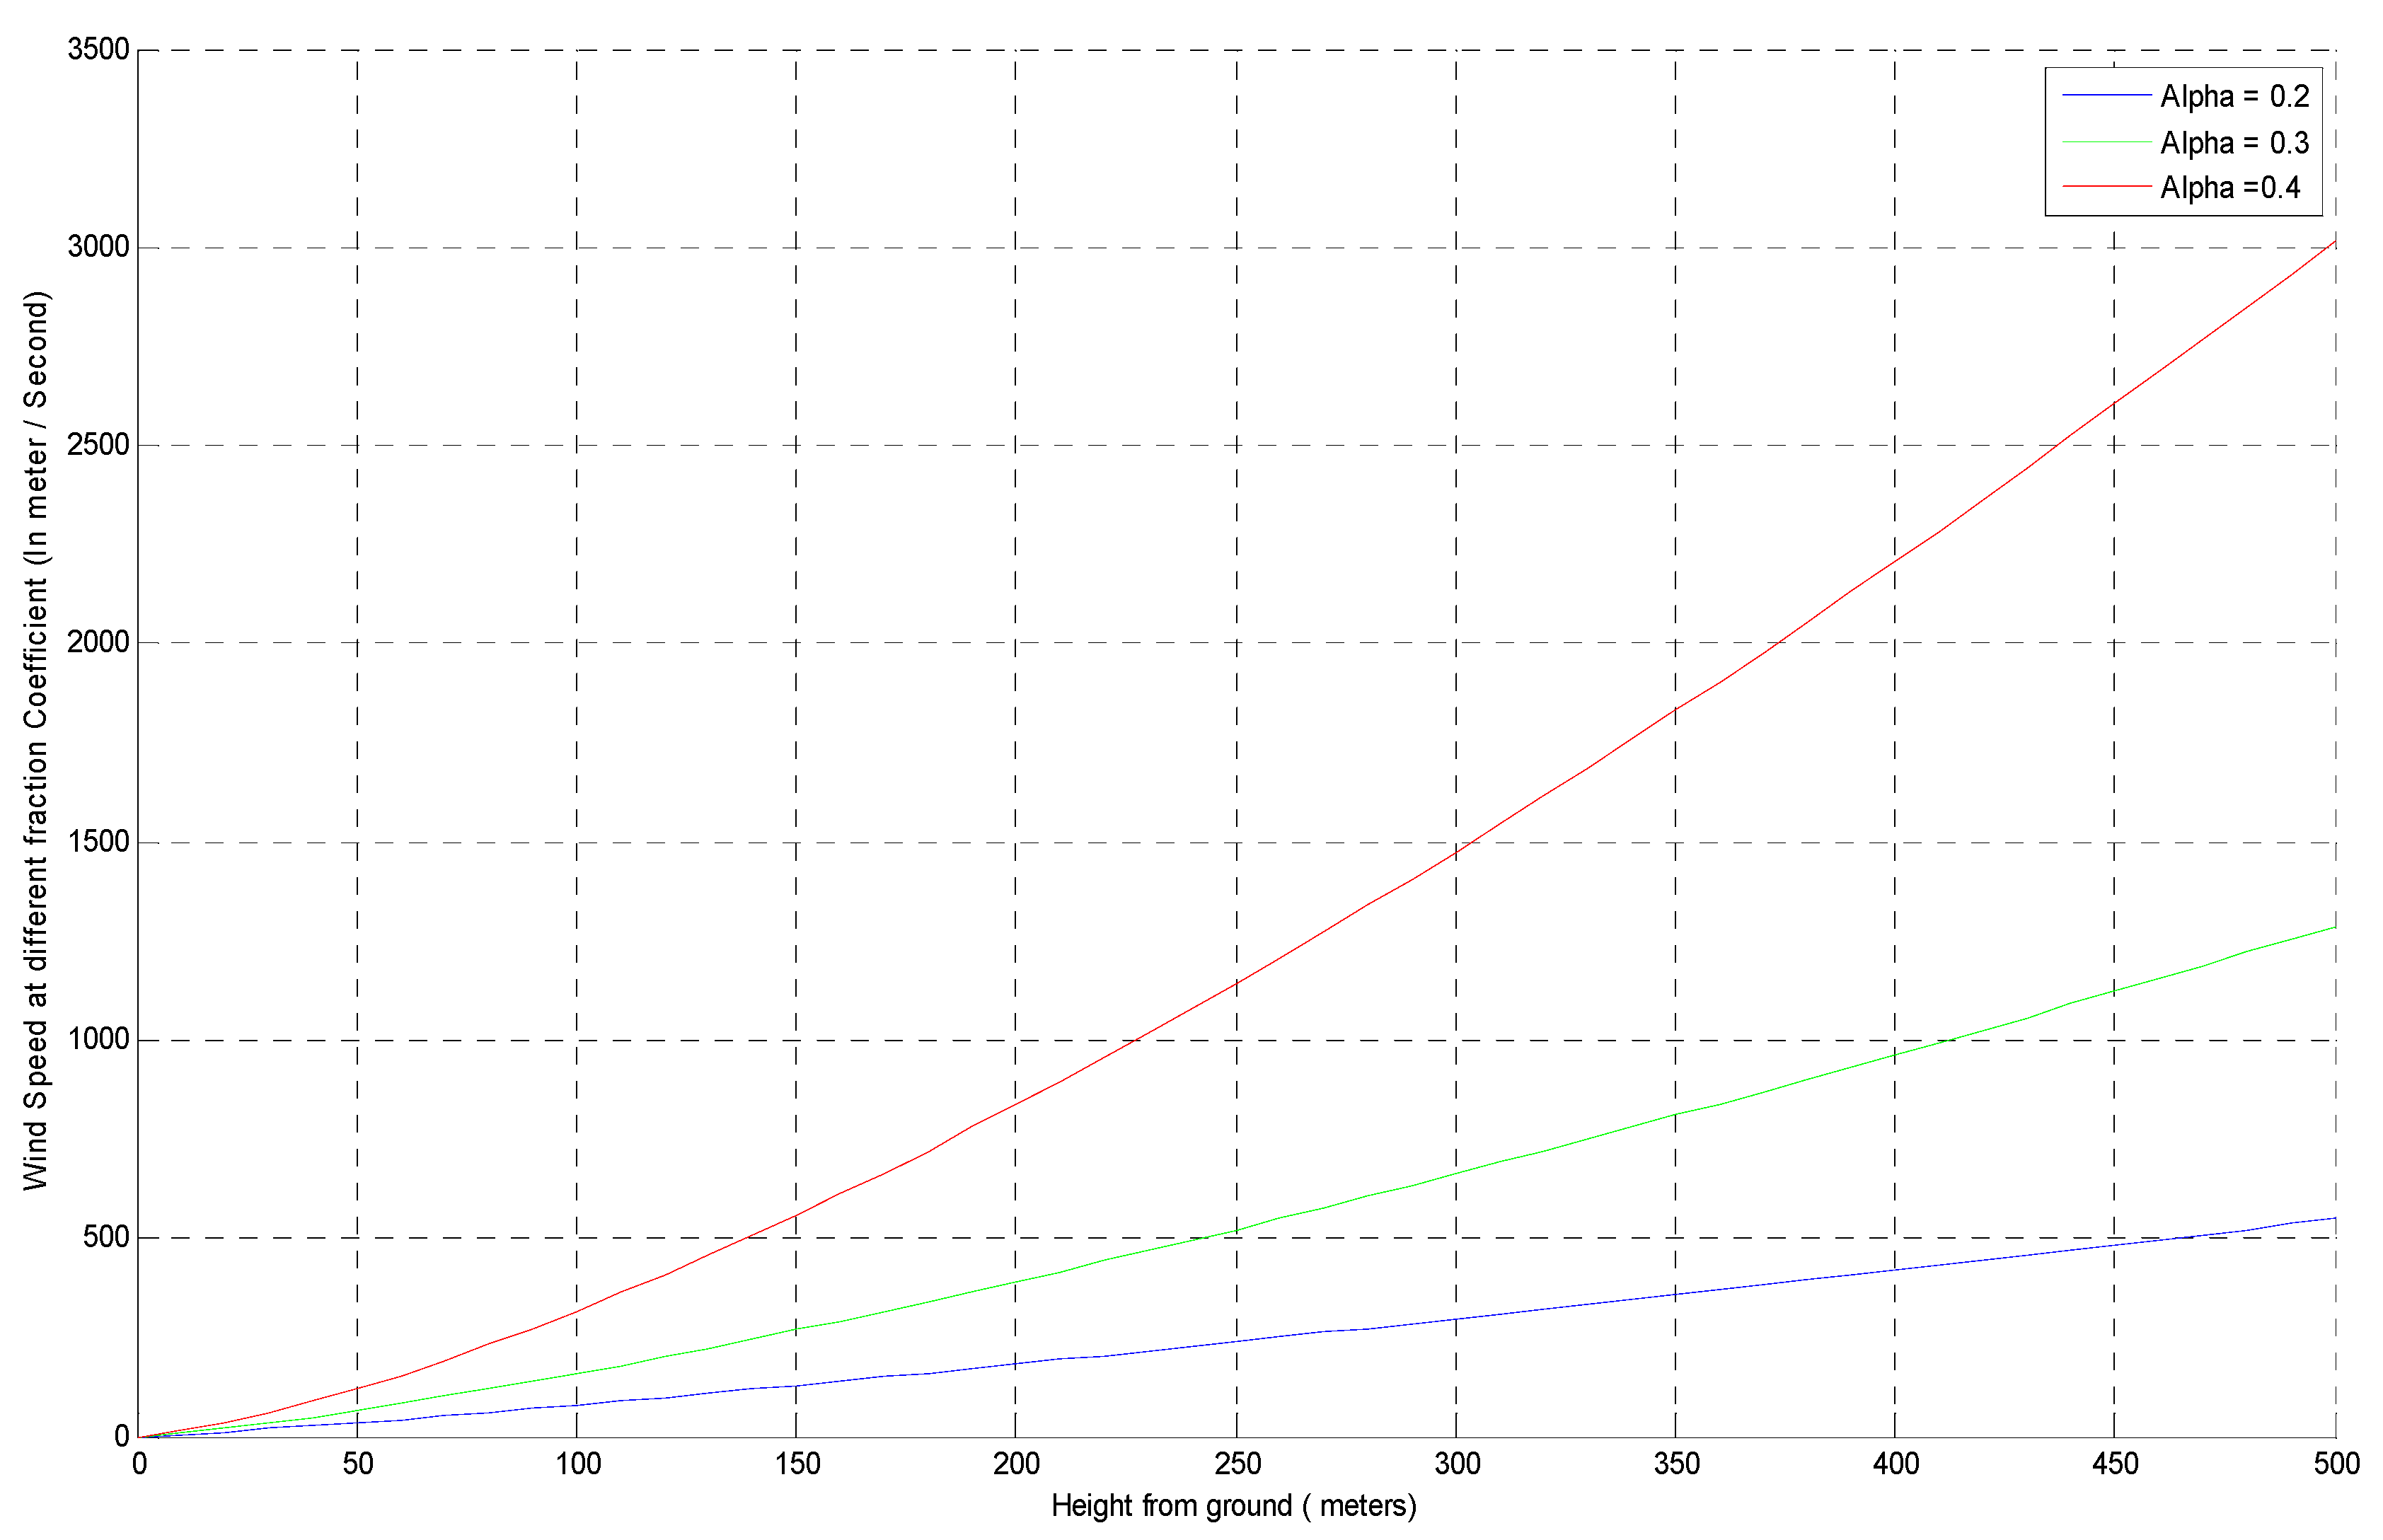
3. Effect of Hub Height on Wind Speed
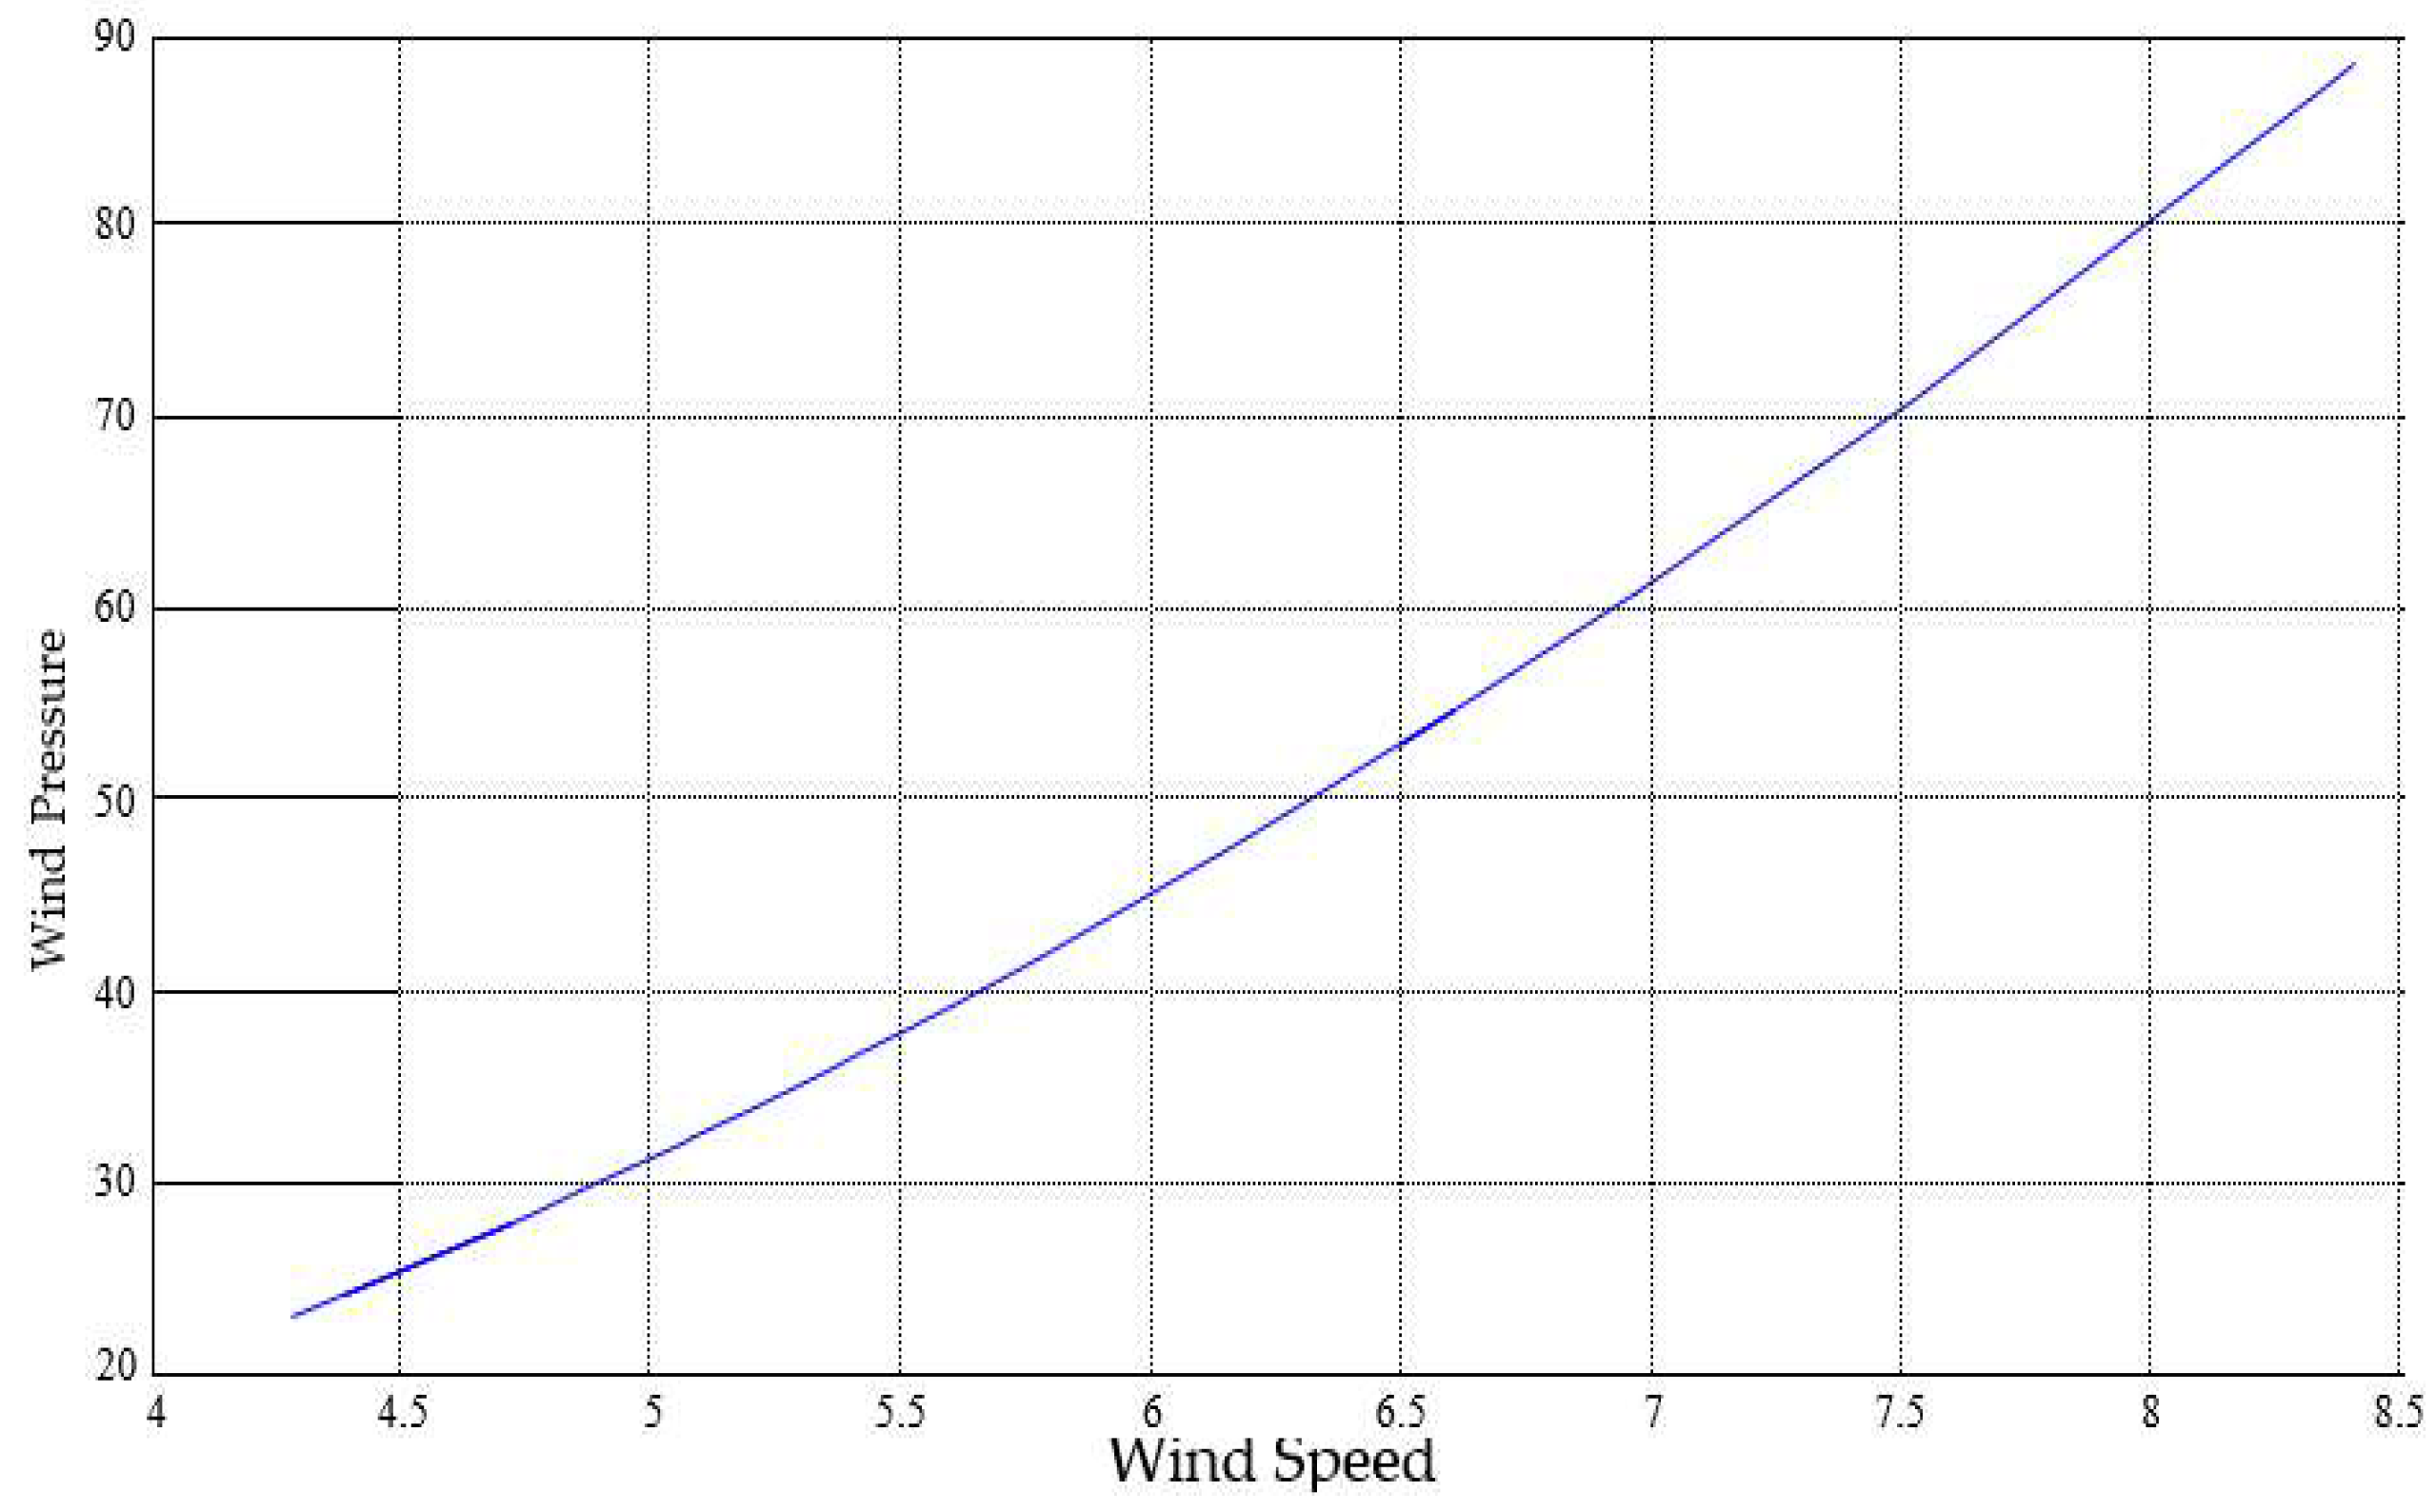
4. Wind Speed vs. Wind Pressure
5. Wind Speed in Jaipur, Rajasthan
6. Conclusions
Author Contributions
Funding
Institutional Review Board Statement
Informed Consent Statement
Data Availability Statement
Conflicts of Interest
References
- Harrison, A.; de Dieu Nguimfack Ndongmo, J.; Alombah, N.H. Robust Nonlinear Control and Maximum Power Point Tracking in PV Solar Energy System under Real Environmental Conditions. Eng. Proc. 2023, 31, 49. [Google Scholar] [CrossRef]
- Alonso-Montesinos, J.; Polo, J.; Ballestrín, J.; Batlles, F.; Portillo, C. Impact of DNI forecasting on CSP tower plant power production. Renew. Energy 2019, 138, 368–377. [Google Scholar] [CrossRef]
- Mahboob, K.; Khan, A.A.; Khan, M.A.; Sarwar, J.; Khan, T.A. Comparison of Li2CO3-Na2CO3-K2CO3, KCl-MgCl2 and NaNO3-KNO3 as heat transfer fluid for different sCO2 and steam power cycles in CSP tower plant under different DNI conditions. Adv. Mech. Eng. 2021, 413, 16878140211011900. [Google Scholar] [CrossRef]
- Ashley, T.; Carrizosa, E.; Fernández-Cara, E. Heliostat field cleaning scheduling for Solar Power Tower plants: A heuristic approach. Appl. Energy 2019, 235, 653–660. [Google Scholar] [CrossRef]
- Bai, Q.; Yang, H.; Cheng, X.; Wang, H. Recombination parameters of the diffusion region and depletion region for crystalline silicon solar cells under different injection levels. Appl. Sci. 2020, 10, 4887. [Google Scholar] [CrossRef]
- Bosman, L.B.; Leon-Salas, W.D.; Hutzel, W.; Soto, E.A. PV system predictive maintenance: Challenges, current approaches, and opportunities. Energies 2020, 16, 1398. [Google Scholar] [CrossRef]
- Altıntaş, M.; Arslan, S. The study of dust removal using electrostatic cleaning system for solar panels. Sustainability 2021, 13, 9454. [Google Scholar] [CrossRef]
- Md, S.; Shakir, D.A.; Fahad, A.A.-S. Grid Integration Challenges and Solution Strategies for Solar PV Systems: A Review. IEEE Access 2022, 10, 52233–52257. [Google Scholar]
- Kishore, T.S.; Singal, S.K. Analysis of Investment Issues and Transmission Schemes for Grid Integration of Remote Renewable Energy Sources. Int. J. Renew. Energy Res. 2015, 5, 483–490. [Google Scholar]
- Lee, D.; Joo, S.-K. Economic Analysis of Large-Scale Renewable Energy (RE) Source Investment Incorporating Power System Transmission Costs. Energies 2023, 16, 7407. [Google Scholar] [CrossRef]
- Fernandes, D.A.; de Almeida, R.G.; Guedes, T.; Filho, A.J.S.; Costa, F.F. State feedback control for DC-photovoltaic systems. Electr. Power Syst. Res. 2017, 143, 794–801. [Google Scholar] [CrossRef]
- Li, X.; Wen, H.; Hu, Y.; Du, Y.; Yang, Y. A Comparative Study on Photovoltaic MPPT Algorithms Under EN50530 Dynamic Test Procedure. IEEE Trans. Power Electron. 2021, 36, 4153–4168. [Google Scholar] [CrossRef]
- Li, X.; Wang, Q.; Wen, H.; Xiao, W. Comprehensive Studies on Operational Principles for Maximum Power Point Tracking in Photovoltaic Systems. IEEE Access 2019, 7, 121407–121420. [Google Scholar] [CrossRef]
- Kjaer, S.B. Evaluation of the “Hill Climbing” and the “Incremental Conductance” Maximum Power Point Trackers for Photovoltaic Power Systems. IEEE Trans. Energy Convers. 2012, 27, 922–929. [Google Scholar] [CrossRef]
- Femia, N.; Petrone, G.; Spagnuolo, G.; Vitelli, M. Optimization of perturb and observe maximum power point tracking method. IEEE Trans. Power Electron. 2005, 20, 963–973. [Google Scholar] [CrossRef]
- Bianconi, E.; Calvente, J.; Giral, R.; Mamarelis, E.; Petrone, G.; Ramos-Paja, C.A.; Spagnuolo, G.; Vitelli, M. A Fast Current-Based MPPT Technique Employing Sliding Mode Control. IEEE Trans. Ind. Electron. 2013, 60, 1168–1178. [Google Scholar] [CrossRef]
- Kumar, N.; Hussain, I.; Singh, B.; Panigrahi, B.K. Framework of Maximum Power Extraction from Solar PV Panel Using Self Predictive Perturb and Observe Algorithm. IEEE Trans. Sustain. Energy 2018, 9, 895–903. [Google Scholar] [CrossRef]
- Abdelsalam, A.; Massoud, A.; Ahmed, S.; Enjeti, P. High-Performance Adaptive Perturb and Observe MPPT Technique for Photovoltaic-Based Microgrids. IEEE Trans. Power Electron. 2011, 26, 1010–1021. [Google Scholar] [CrossRef]
- Xiao, W.; Dunford, W.G. A modified adaptive hill climbing MPPT method for photovoltaic power systems. In Proceedings of the 2004 IEEE 35th Annual Power Electronics Specialists Conference (IEEE Cat. No.04CH37551), Aachen, Germany, 20–25 June 2004; Volume 3, pp. 1957–1963. [Google Scholar]
- Liu, F.; Duan, S.; Liu, F.; Liu, B.; Kang, Y. A Variable Step Size INC MPPT Method for PV Systems. IEEE Trans. Ind. Electron. 2008, 55, 2622–2628. [Google Scholar]


| Terrain Type | Friction Coefficients |
|---|---|
| Lake, ocean | 0.100 |
| High grass-level ground | 0.150 |
| Smooth terrain and hard ground | 0.100 |
| Heavily forested region | 0.250 |
| Tall crops, hedges, and shrubs | 0.200 |
| Tall structures in the city | 0.400 |
| The little community has several bushes and trees | 0.300 |
| Month | Year_2019 | Year_2020 | Year_2021 | Year_2022 | Year_2023 | Averages |
|---|---|---|---|---|---|---|
| January | 5.8 | 6.8 | 5.7 | 6.5 | 6.8 | 7.3 |
| February | 8.2 | 7.8 | 6.3 | 8 | 6.4 | 7.3 |
| March | 8.2 | 9.3 | 8.5 | 7.7 | 8 | 8.3 |
| April | 8.6 | 9.4 | 7.2 | 8.3 | 8 | 8.3 |
| May | 8.7 | 11.2 | 9.8 | 12.4 | 8.0 | 10.5 |
| June | 9.9 | 10.8 | 11.9 | 12.2 | 8.5 | 10.2 |
| July | 10.8 | 9.3 | 11.8 | 8.8 | **** | 10.3 |
| August | 8.5 | 4.7 | 11.2 | 9.7 | **** | 8.8 |
| September | 7.5 | 4.2 | 9.9 | 9 | **** | 7.7 |
| October | 4.5 | 3.4 | 6.3 | 6.4 | **** | 5.1 |
| November | 6.9 | 5.1 | 4.4 | 4.5 | **** | 5.2 |
| December | 5 | 2.3 | 5.8 | 5 | **** | 4.6 |
| Time | PV Tracking System | PV Static System | ||||
|---|---|---|---|---|---|---|
| Current (A) | Voltage (V) | Power (Watt) | Current (A) | Voltage (V) | Power (Watt) | |
| 08:00 | 5 | 14 | 60 | 3.5 | 11 | 38.5 |
| 08:30 | 4.5 | 18 | 81 | 4 | 11 | 44 |
| 09:00 | 5.5 | 20 | 110 | 5.8 | 17 | 98.6 |
| 09:30 | 7.5 | 20 | 150 | 6.5 | 19 | 123.5 |
| 10:00 | 7.5 | 20 | 150 | 7.2 | 18 | 129.6 |
| 10:30 | 7.8 | 20 | 156 | 7.2 | 18 | 129.6 |
| 11:00 | 7 | 20 | 140 | 7.5 | 20 | 150 |
| 11:30 | 9 | 20 | 180 | 7.5 | 20 | 150 |
| 12:00 | 8 | 21 | 168 | 7.8 | 20 | 156 |
| 12:30 | 8.2 | 20 | 164 | 7.3 | 21 | 153.3 |
| 01:00 | 8 | 20 | 160 | 6.8 | 21 | 142.8 |
| 01:30 | 7 | 20 | 140 | 6.2 | 20 | 124 |
| 02:00 | 6.5 | 20 | 130 | 6 | 20 | 120 |
| 02:30 | 6.2 | 18 | 111.6 | 5 | 20 | 100 |
| 03:00 | 5 | 15 | 75 | 2.5 | 10 | 25 |
| 03:30 | 3.5 | 15 | 52.5 | 2.5 | 10 | 25 |
| 04:00 | 3.0 | 10 | 30 | 1.5 | 10 | 15 |
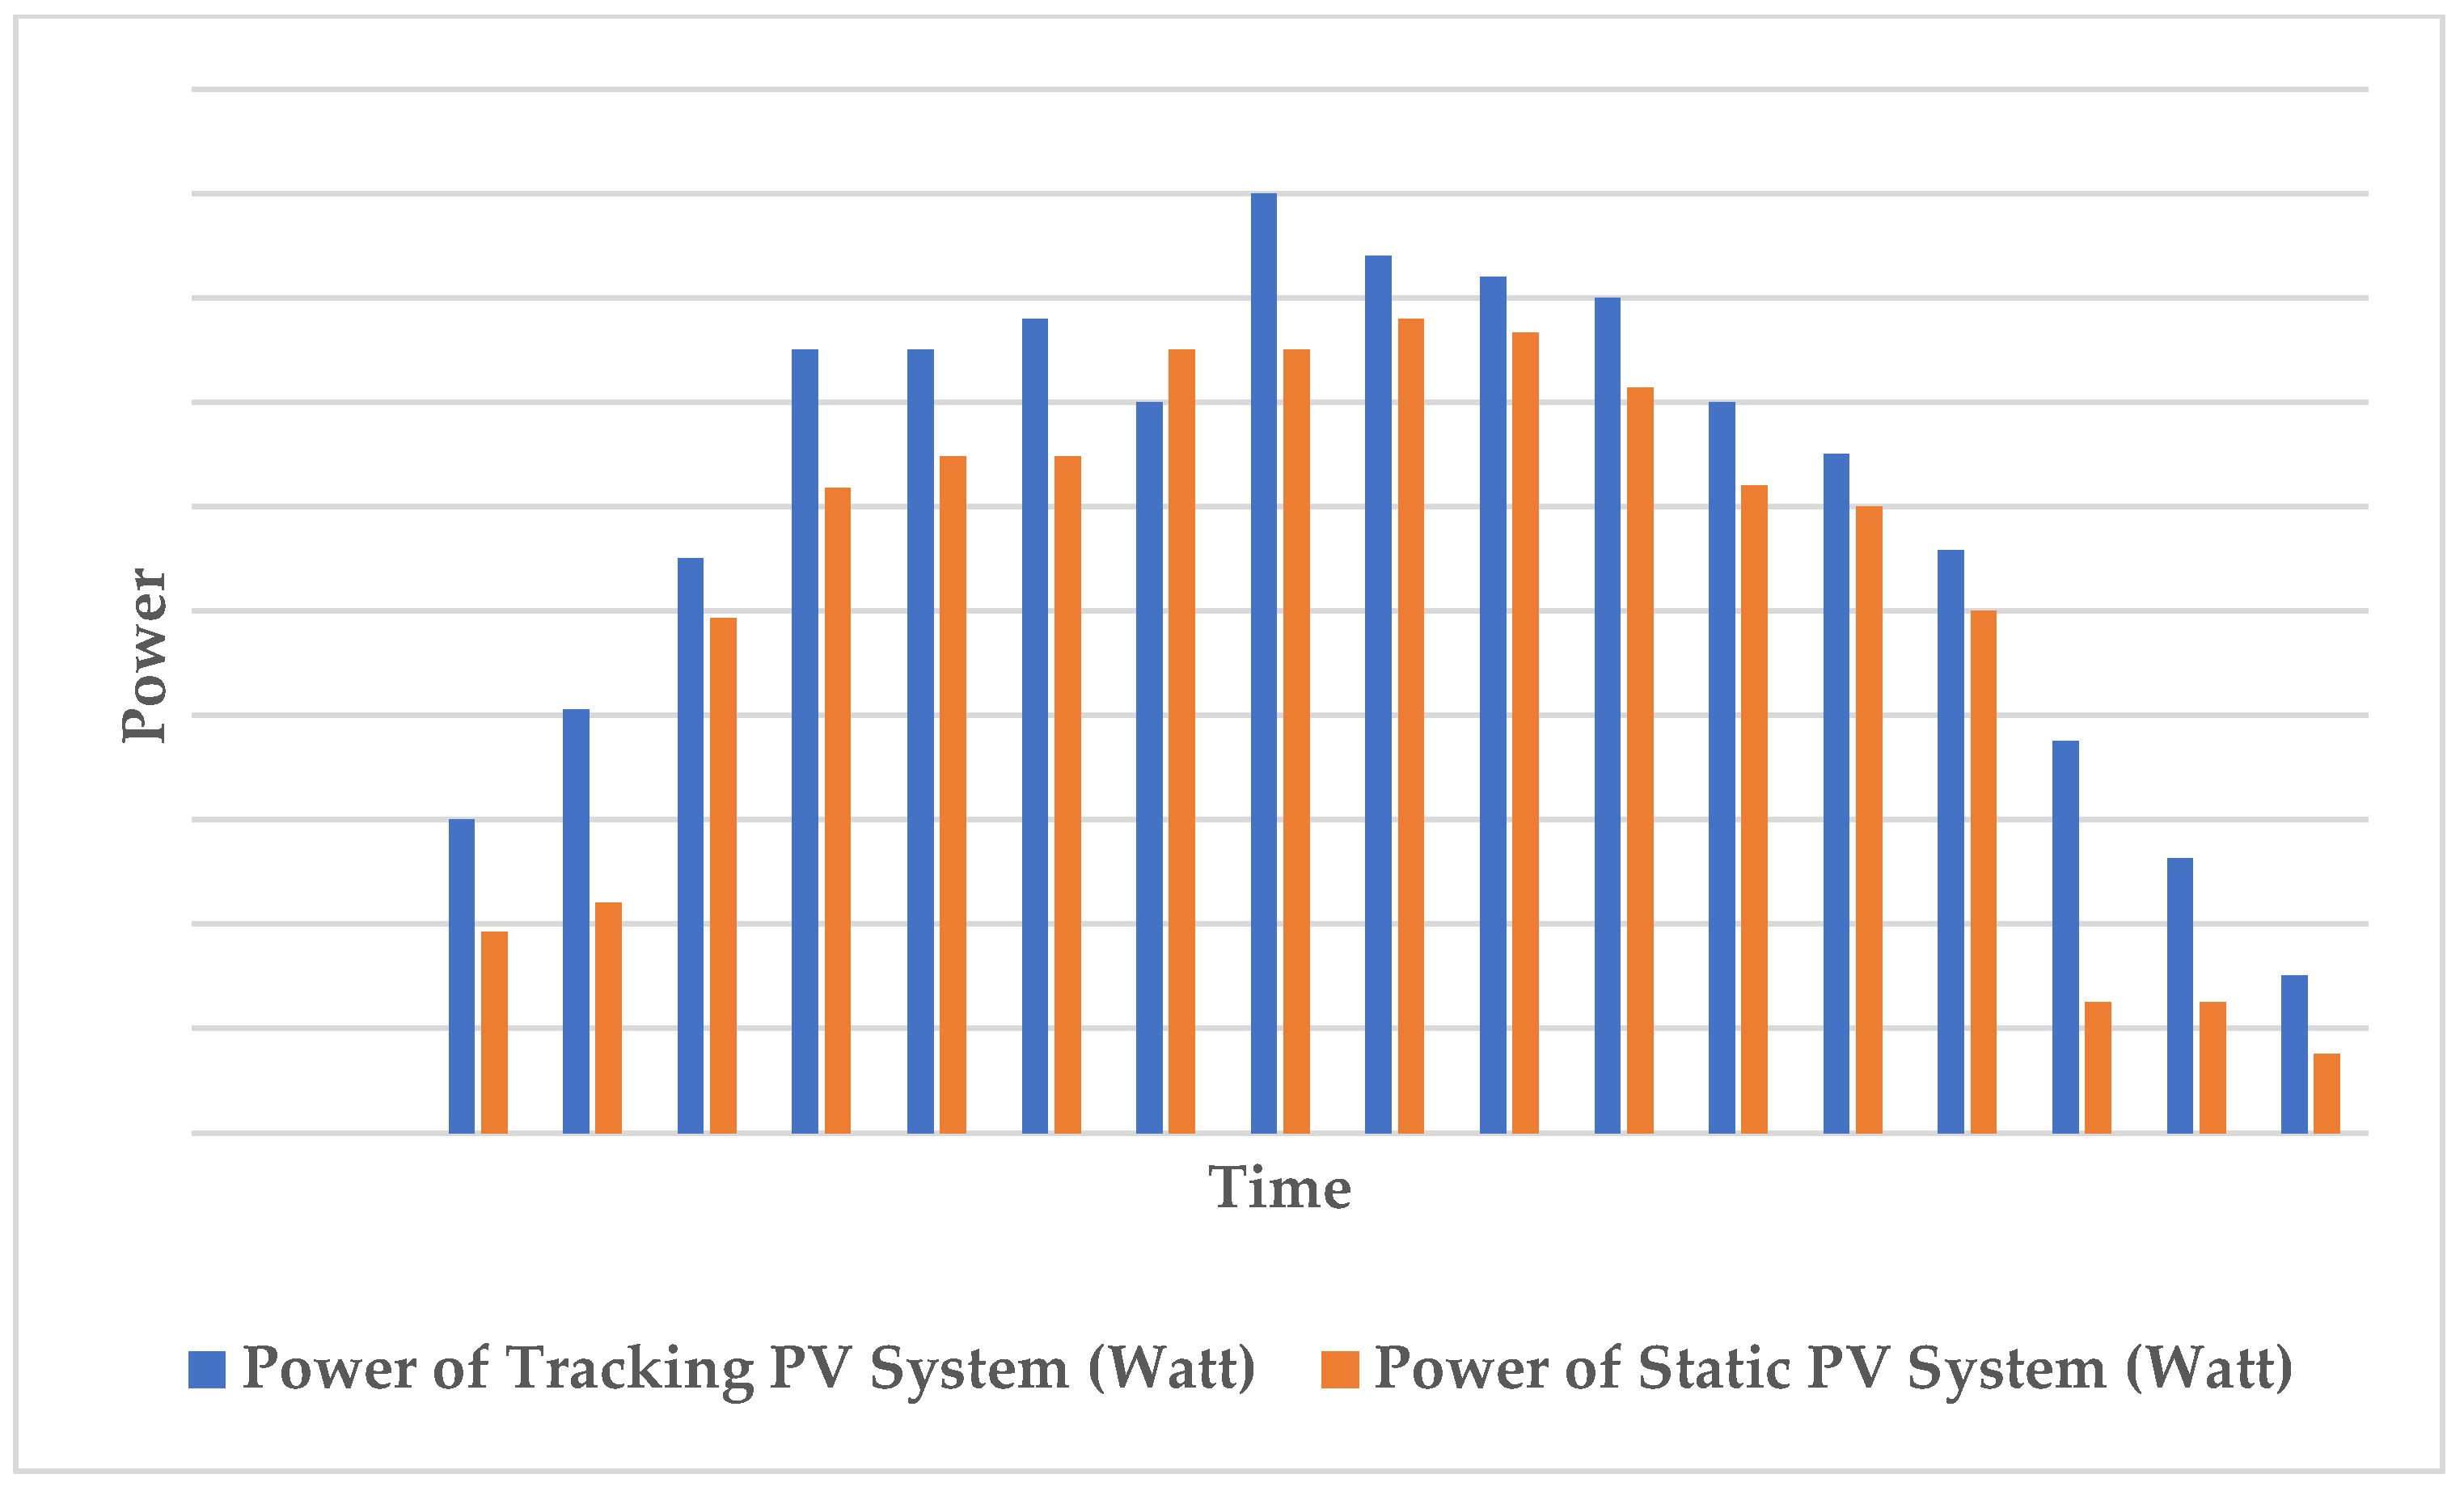
| Time | Power of Tracking PV System (Watt) | Power of Static PV System (Watt) |
|---|---|---|
| 08:00 | 60 | 38.5 |
| 08:30 | 81 | 44 |
| 09:00 | 110 | 98.6 |
| 09:30 | 150 | 123.5 |
| 10:00 | 150 | 129.6 |
| 10:30 | 156 | 129.6 |
| 11:00 | 140 | 150 |
| 11:30 | 180 | 150 |
| 12:00 | 168 | 156 |
| 12:30 | 164 | 153.3 |
| 01:00 | 160 | 142.8 |
| 01:30 | 140 | 124 |
| 02:00 | 130 | 120 |
| 02:30 | 111.6 | 100 |
| 03:00 | 75 | 25 |
| 03:30 | 52.5 | 25 |
| 04:00 | 30 | 15 |
Disclaimer/Publisher’s Note: The statements, opinions and data contained in all publications are solely those of the individual author(s) and contributor(s) and not of MDPI and/or the editor(s). MDPI and/or the editor(s) disclaim responsibility for any injury to people or property resulting from any ideas, methods, instructions or products referred to in the content. |
© 2023 by the authors. Licensee MDPI, Basel, Switzerland. This article is an open access article distributed under the terms and conditions of the Creative Commons Attribution (CC BY) license (https://creativecommons.org/licenses/by/4.0/).
Share and Cite
Mamodiya, U.; Tiwari, N. Design and Implementation of Hardware-Implemented Dual-Axis Solar Tracking System for Enhanced Energy Efficiency. Eng. Proc. 2023, 59, 122. https://doi.org/10.3390/engproc2023059122
Mamodiya U, Tiwari N. Design and Implementation of Hardware-Implemented Dual-Axis Solar Tracking System for Enhanced Energy Efficiency. Engineering Proceedings. 2023; 59(1):122. https://doi.org/10.3390/engproc2023059122
Chicago/Turabian StyleMamodiya, Udit, and Neeraj Tiwari. 2023. "Design and Implementation of Hardware-Implemented Dual-Axis Solar Tracking System for Enhanced Energy Efficiency" Engineering Proceedings 59, no. 1: 122. https://doi.org/10.3390/engproc2023059122
APA StyleMamodiya, U., & Tiwari, N. (2023). Design and Implementation of Hardware-Implemented Dual-Axis Solar Tracking System for Enhanced Energy Efficiency. Engineering Proceedings, 59(1), 122. https://doi.org/10.3390/engproc2023059122