Proceeding Paper

Hybrid Feature Selection and Classifying Stages through Electrocardiogram (ECG) Signal for Heart Disease Prediction †

by
Babu Kumar
1,*,
Radhakrishnan Soundararajan
2,
Kanimozhi Natesan
1 and
Roobini Maridhas Santhi
3
1
Department of Computational Intelligence, SRM Institute of Science & Technology, Kattankulathur 603203, India
2
Department of Mathematics, SRM TRP Engineering College, Trichy 621105, India
3
Department of Computer Science & Engineering, Sathyabama Institute of Science & Technology, Chennai 600119, India
*
Author to whom correspondence should be addressed.
Presented at the International Conference on Recent Advances on Science and Engineering, Dubai, United Arab Emirates, 4–5 October 2023.
Eng. Proc. 2023, 59(1), 126; https://doi.org/10.3390/engproc2023059126
Published: 27 December 2023
(This article belongs to the Proceedings of Eng. Proc., 2023, RAiSE-2023)

Abstract

:
Diseases are major causes for increasing mortality rates. Clinical data analysis must predict cardiovascular disease. Machine learning (ML) may aid decision making and prediction using the healthcare field’s massive data set. ECG demonstrates electrical activities in human hearts, and variations in signals’ morphologies have provided improved knowledge of different types of arrhythmia depending on the state of the heart. In order to accurately forecast cardiac disorders, this study effort proposed a hybrid feature selection model and classification together with the ECG wave graph. QRS waves, which are time intervals of binary data, can be determined using the suggested technique of determining the ECG signal’s time interval from R-peak levels to the next level using double squared differences in signals. This approach involves many rounds of data sorting for decreasing noise, thresholding an ECG difference signal by examining the time interval between QRS, and then comparing relative magnitudes to identify the area of interval processing to evaluate accuracy results. In order to choose the best features, a modified chicken swarm optimization algorithm (MCSO) was proposed. Aberrant waves caused by cardiac ailments impacted the dataset patients, according to the suggested research’s unique machine learning methods of multi-module neural network system (MMNNS). The dataset was collected from the ML repository dataset vault at UCI as an individual ECG signal from the Heart Database. The findings demonstrate that each approach has a particular advantage in achieving the aims that have been set out.

1. Introduction

Heart diseases are the basis for increased deaths in recent years. Heart attack, angina, and stroke are the primary cardiovascular illnesses. Heart problems, or CVD, refer to the heart’s malfunction and dysfunction, which ultimately results in a reduction in the amount of oxygen delivered to the body’s important functions [1]. Risk factors like smoking have an impact on how the heart naturally beats and produces electrical impulses. Smoking causes various CVD disorders and makes heart palpitations and dizziness more common. The most serious disorders are irregular blood flows with a probability of having a heart attack. In total, 17.1 million individuals, or 29% of all deaths worldwide, have resulted from CVDs in 2004, according to a recent study [2]. One estimate has the number of fatalities at 5.7 million from stroke and 7.2 million from coronary heart disease. Low- and middle-income nations are disproportionately impacted; 82% of CVD fatalities occur in these nations and affect both men and women virtually equally. According to a recent analysis, heart disease and stroke will account for the majority of the over 23.6 million CVD deaths that will occur worldwide by 2030. According to projections, these will continue to be the top causes of death. The eastern Mediterranean region will have the highest proportion of deaths from CVDs [3]. At this time, identifying signs of complicated illnesses early on is the greatest practice for lowering human death rates brought on by such conditions. Early symptom detection allows for the best clinical result and the most efficient treatment. Computerized procedures have helped to assist with medical care. The human body’s recorded signals have revealed important details regarding the functions of its organs. They might be linked to a normal or abnormal function based on their distinctive form and spectral features [4]. In order to forecast cardiovascular illness in its early stages, the majority of past research has focused on ECG signal processing. A patient’s cardiac state is diagnosed via an ECG; it depicts cardiac impulses. The first positive signal in an ECG is the P wave; less than 120 milliseconds in length, with a positive polarity.
Wave amplitudes and intervals can help diagnose heart problems where known parameters for these diagnostics include QRS complexes, RR intervals, ST segments, and other time-domain ECG signals [5]. This electrical activity is often disturbed in heart illness. Clinicians may diagnose cardiac issues by comparing the P, QRS, and T signals to the usual signals in timing and amplitude. The bipolar low-frequency weak ECG signal typically ranges from 0.01 to 150 Hz. Additionally, 60–100 BPM and 0.05–3 mV are normal heart rates. Figure 1 displays an ECG signal and the corresponding fiducial points.
Because computers can analyze ECG signals better than humans, automatic ECG analysis is favored for cardiac monitoring and illness diagnosis [6]. Cardiac rhythms known as “normal sinus rhythms” are where sinoatrial nodes serve as starting points for contractions of the heart muscles. The following five properties are present in a typical sinus rhythm: normal P wave, continuous P-P and R-R intervals, typical P-R and QRS intervals, and lead-specific P wave configuration [7]. The heart beats per minute are between 60 and 100. Any irregularity in the regular activation sequence of the myocardium is referred to as a cardiac arrhythmia [8].
The ECG findings that differ in cases of heart illness include irregular RR intervals, lack of P waves, larger QRS complexes, and absence of one full PQRST complex, among other things [9]. Chest X-rays, nuclear imaging, MRI, invasive angiography, and echocardiography are all used to diagnose HF patients. The most used test is echocardiography, which employs ultrasound to measure the heart’s ejection fraction as well as its stroke volume and end-of-diastolic volume. But it may be expensive and time consuming, and it depends heavily on the operator. An electrocardiogram (ECG) is another approach for identifying CHF [10]. However, expert manual ECG signal analysis is difficult and vulnerable to intra- and inter-observer variability. These earlier research studies suggest that instead of focusing on long waves, classification might be conducted on short HF waveforms. The suggested techniques, like SVM, produced encouraging HF classification results. SVM worked well with tiny data pools because of its adaptability. However, ML approaches only work effectively with small, well-balanced data sets. Actually, many factors other than only the availability of regular data cause a data imbalance. Furthermore, in order to attain the best classification accuracy, ML needs hand-crafted features, which are characteristics that are developed by trial and error [11,12]. The optimal visual features for ECG signal extraction must be selected in order to perform relevant and reliable classification. Therefore, additional research into automated feature extraction for ECG signal categorization is necessary. This research work introduced a hybrid feature selection model and classification along with the ECG wave graph for the efficient prediction of heart diseases.
The rest of this paper is organized as follows: current methods for detecting cardiac problems are analyzed in Section 2, Section 3 outlines the proposed methodology’s steps, Section 4 gives the findings and discussion, and Section 5 addresses conclusions and future research.

2. Literature Review

Acharya et al. [13] used CAD with two- and five-second ECG data segments and convolutional neural network (CNN) for their analytics which could assist doctors in making accurate and trustworthy decisions for CAD using ECG data. A novel method was presented by Liang et al. [14] that combined CNNs with bidirectional long short-term memory (BiLSTM) in an effort to increase accuracy and shorten training time. Vafaie et al. [15] created an automated identification of cardiac disorders. This work used the ECG signal’s dynamical model to classify signals more accurately. With more accurate arrhythmia identification, the suggested technique improved the ECG classification’s accuracy.
Chen et al. suggested a unique two-step predictions model based on ECG signals [16]. A regulated nonlinear transformation with optimized parameters may improve signal symmetry for distinct class abnormalities in feature spaces for analyzing accurate deviations. Alarsan et al. [17] suggested that it is effective in accurately categorizing ECG signals. Coordinated action potential waveforms from heart tissues cause the cardiac heartbeat. The Spark–Scala machine learning libraries offer straightforward methods for implementing a variety of classification algorithms, including but not limited to decision trees, random forests, and gradient-boosted trees (GBT). However, it should be noted that the gradient boosting tree algorithm is only capable of supporting binary classification.
Jahmunah et al. [18] created an automated system (AS) that utilizes CNNs and unique Gabor CNN models to categories electrocardiogram signals into four distinct classes: normal, CAD, MI, and congestive heart failures (CHF). The Gabor CNN is more popular than the CNN because of its better efficiency and reduced computational cost.

3. Proposed Methodology

This research work introduced a hybrid feature selection model and classification along with the ECG wave graph for the efficient prediction of heart diseases. This approach used a double squared difference signal to discover the QRS region, which is the time gap between binary data, in order to detect the ECG signal’s time interval from the peak R level to the next level. For the feature selection procedure, the modified chicken swarm optimization algorithm (MCSO) was proposed. The MMNNS unique machine learning algorithms might cause cardiac issues in dataset users if the wave was abnormal. Figure 2 depicts the process of the proposed methodology.

3.1. ECG Data Source

The UCI of the ML repository provided the dataset of individual cardiac ECGs that was used to forecast a heart condition. Advanced machine learning techniques were implemented using database sets from UCI. The parameter of binary values was used to capture real-time ECG signal collections. The programming used binary values of 0 and 1, while the ECG was displayed as time intervals.

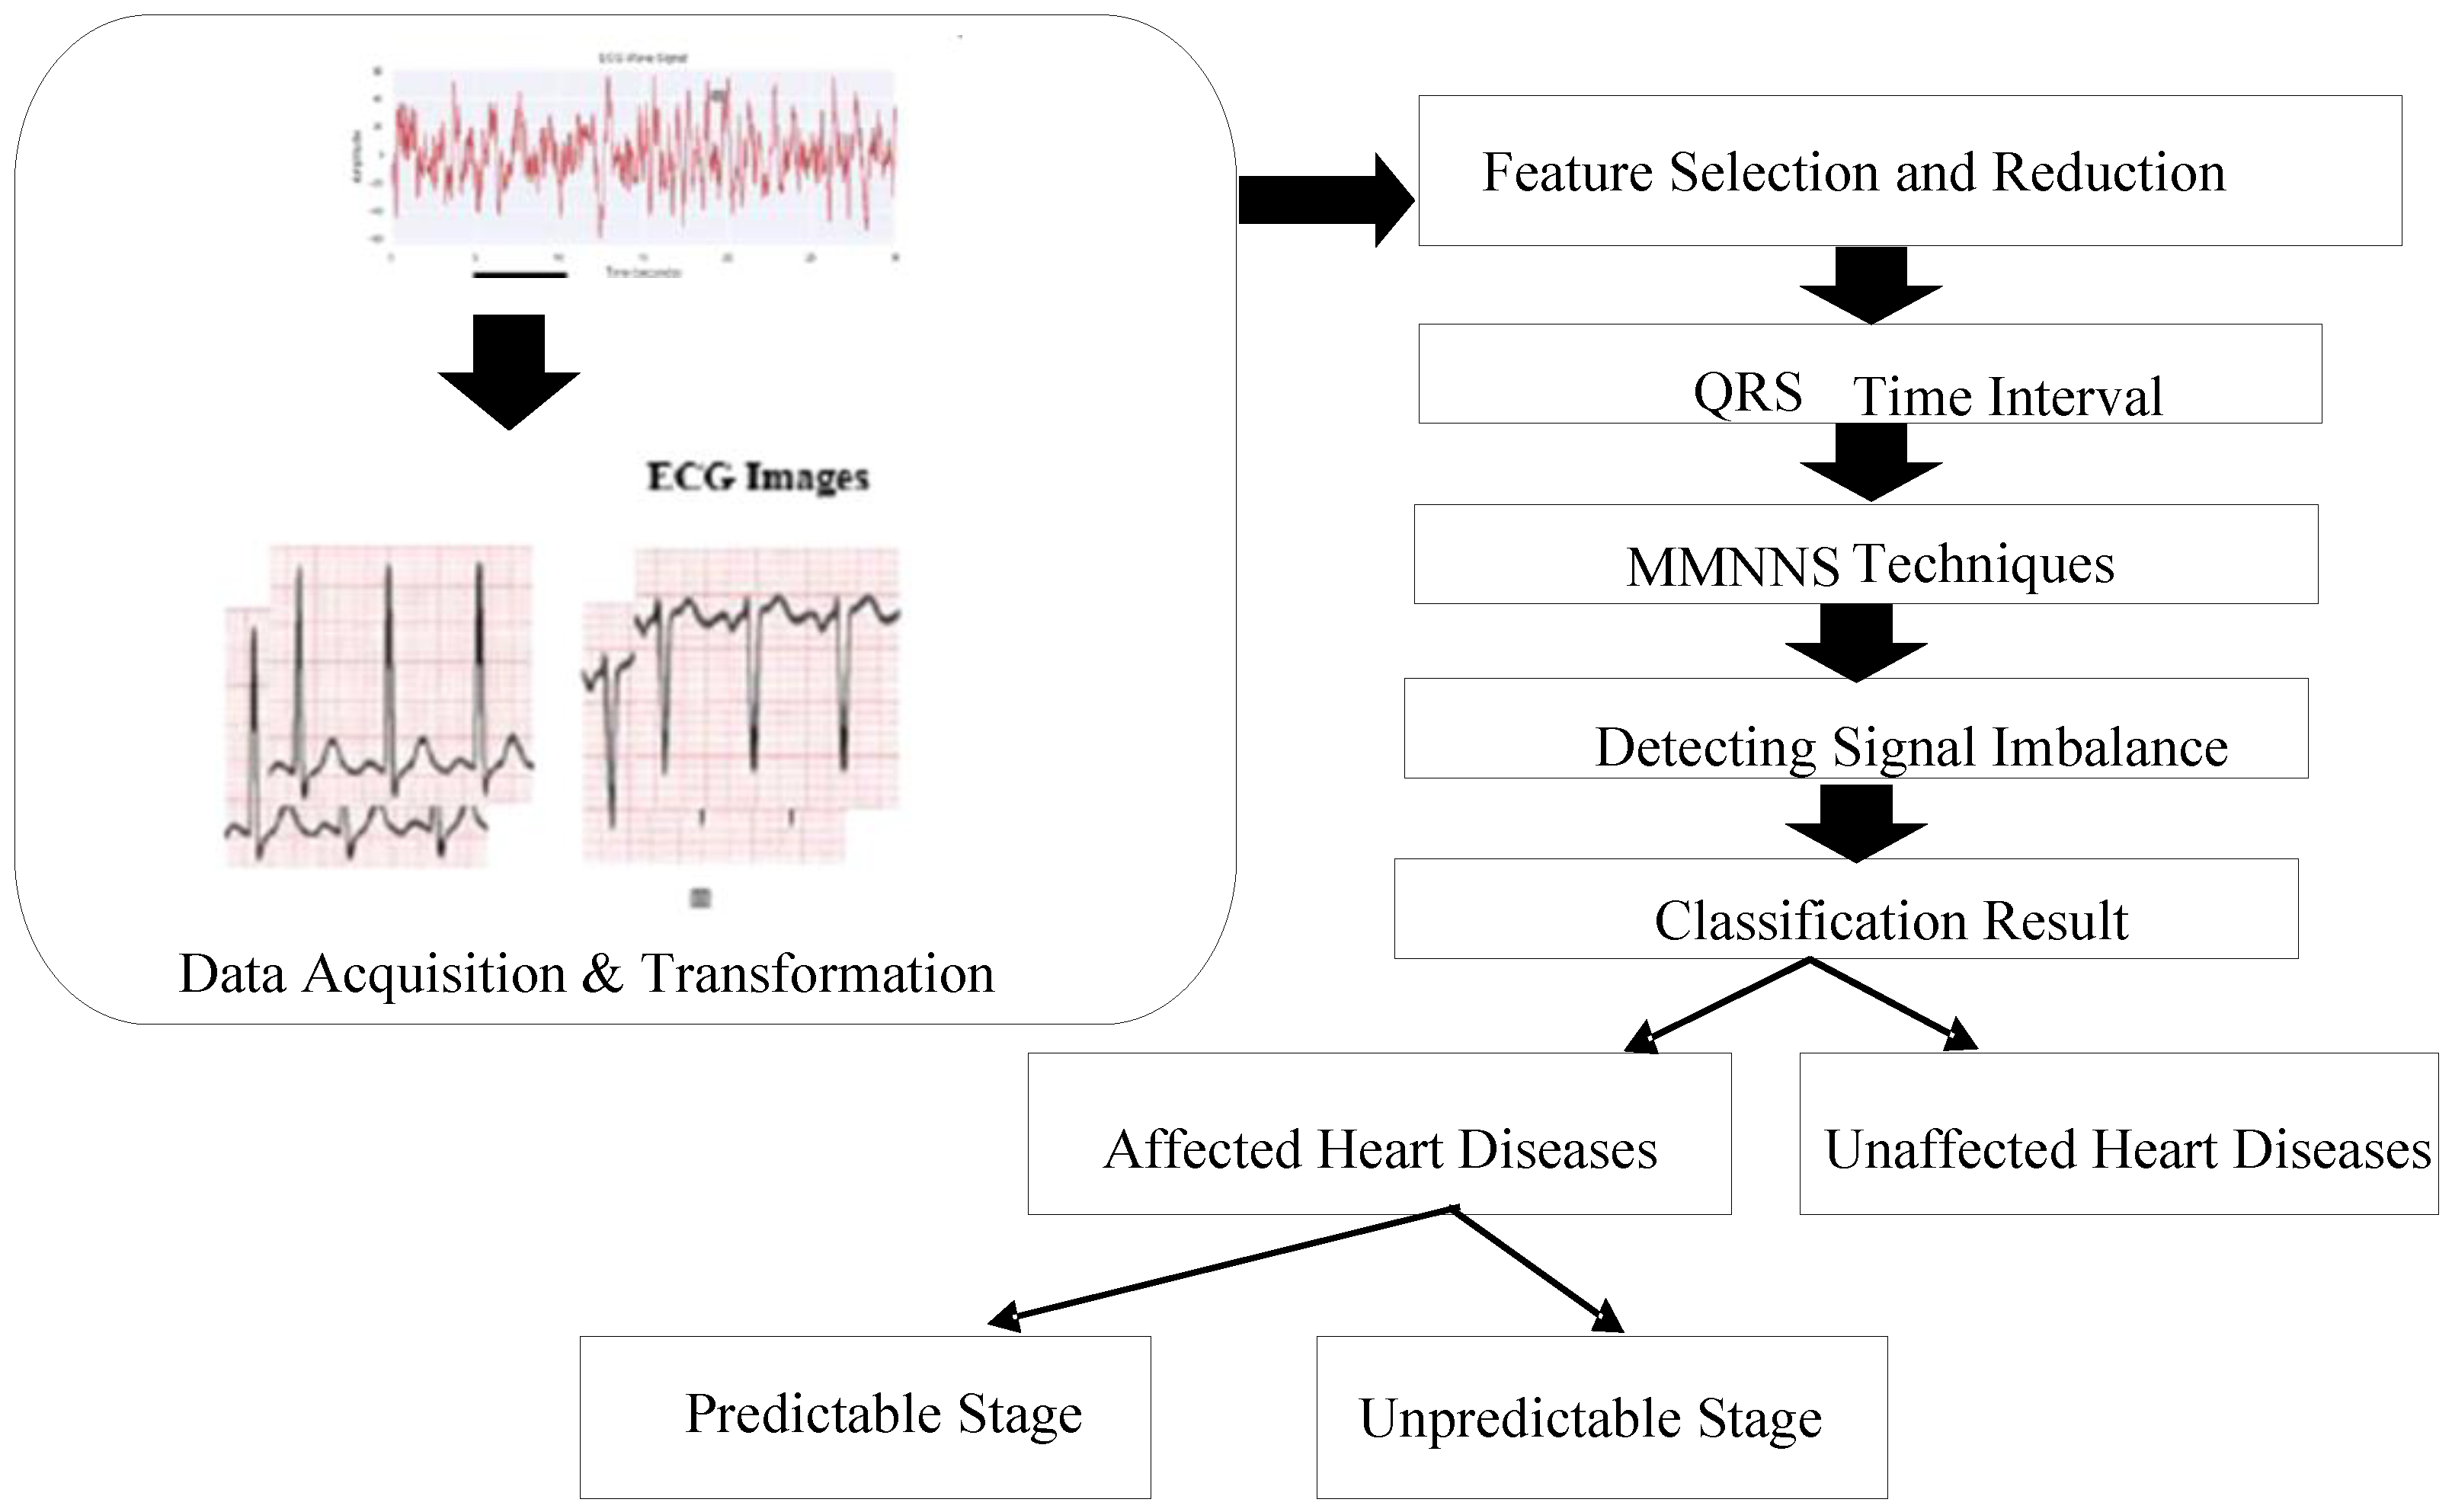
3.2. Acquisition of Data & Transformation

To classify and extract features for cardiac disorders, the ECG signal collection must contain raw data that predicts heart disease. The ECG signal records a binary property that is used to assist with the choice of which features to extract to further investigate and process [19]. This phase uses numerous ECG sources to categorize heart disease stages and forecast heart disease, focusing on the data source. The dataset consisted of unprocessed data that had been acquired, transformed, and processed using a high-level programming language that was supported for altering high level operations.
An electrical movement that occurred as a result of the heart’s natural rhythm may have been captured as an ECG. On the wave graph shown in Figure 1, it will be seen. When the heart cells were picked up by the electrodes on the ECG, a faint electrical motion may have been detected as the signal’s electrical motion.
  • Data Preprocessing: Numerous different types of artefacts and sounds may commonly contaminate the signal of an ECG recording, which will have an impact on the categorization of the findings of any future experiments. It is crucial to put into practice an appropriate pre-processing method that preserves all of the relevant information from the original raw ECG signal. There are only a few number of noises where the spectrum of the signal matches with the pertinent data, even if ECG signals were obtained from public datasets that do not have as much noises as those collected directly from patients. The user should adopt a feasible preparation technique that preserves valuable dataset information while working with the original ECG signal.
  • Denoising ECG Signal: The process of eliminating noise from the ECG signal is referred to as denoising. The precise identification of various anomalies and the removal of noise data from the ECG signal has been a primary area of focus for researchers. Applying a sample entropy band pass filters (0.05–45 Hz) to ECG signals as part of neural network denoise techniques verifies the accuracy of the data. Noise may cause vital health alerts. After collecting data from data sources for ECG analysis, noise is often eliminated.
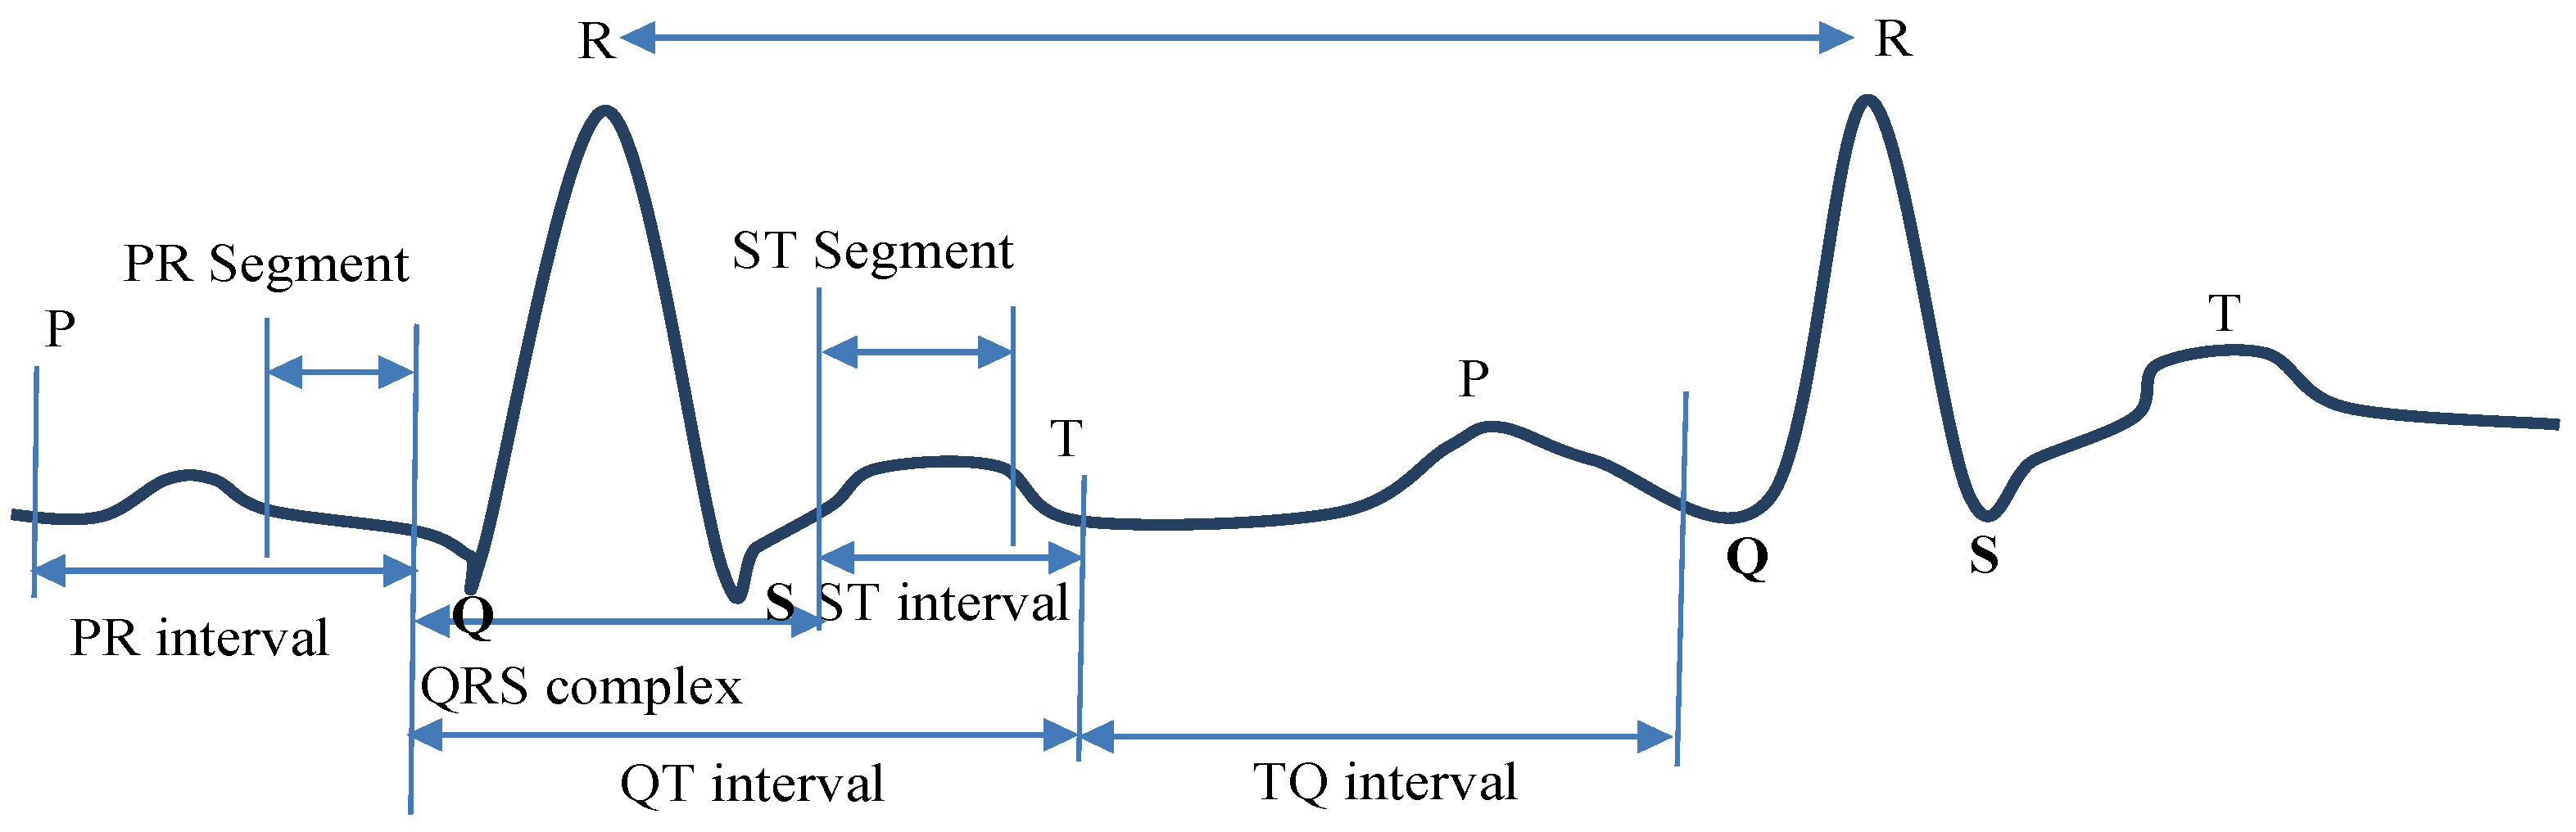
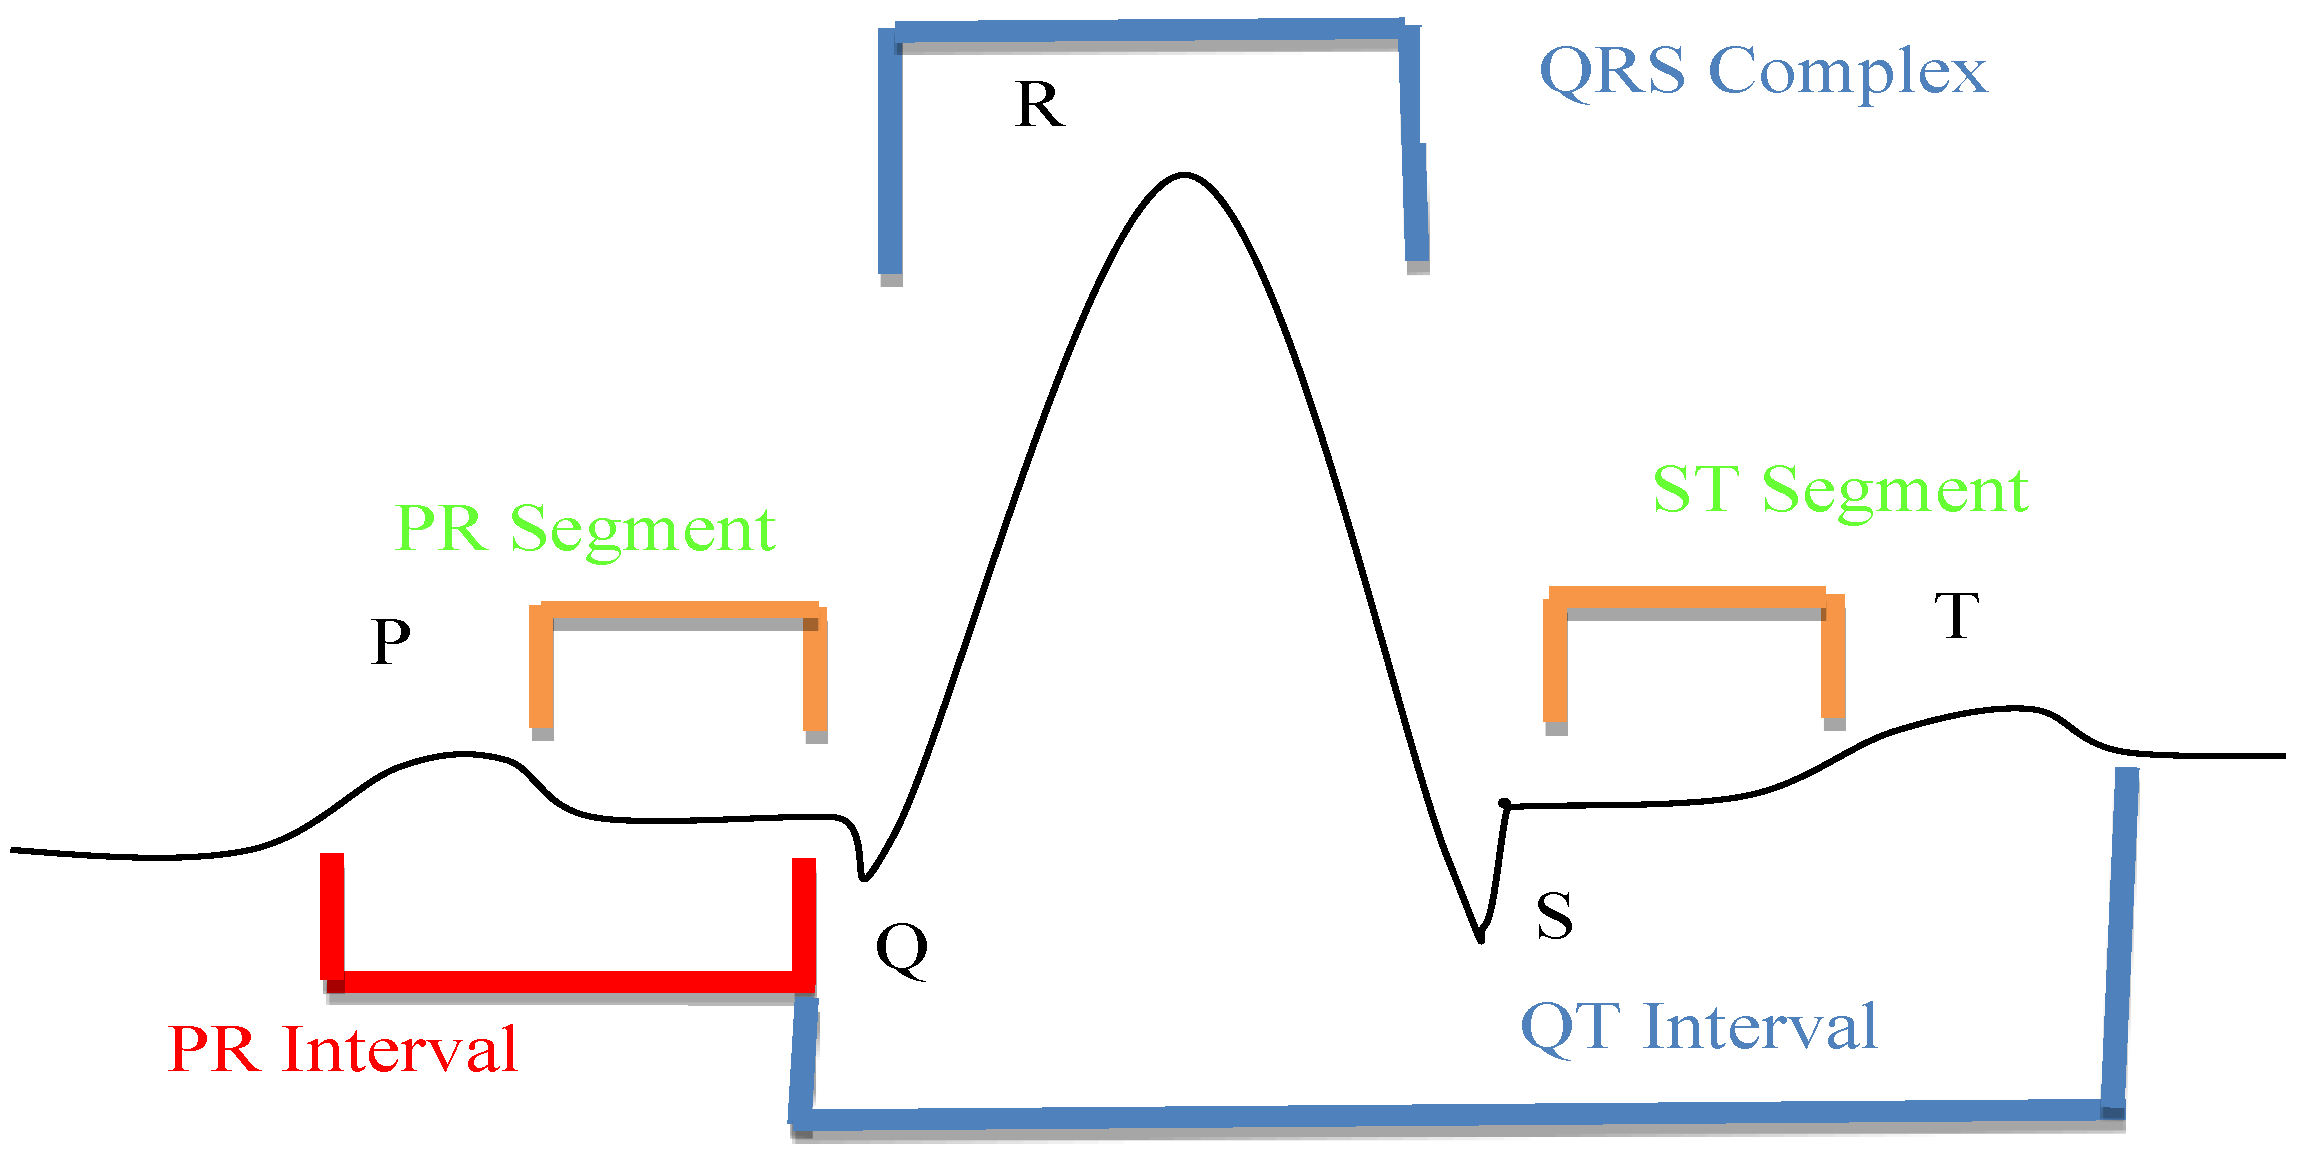
  • QRS Regions’ processing of Intervals: ECG waves are called P, QRS, and T-U in alphabetical sequences. Significant information on health and the state of cardiac issues may be obtained from the amplitude, shape, and time. Atrial depolarization is represented by the P wave is [19]. The QRS complex is used to characterize the reflections of ventricular depolarization. Depolarization of the ventricles is represented by the T-U wave. As a depolarization current moves towards the positive pole of an ECG line, an electrocardiograph may show a positive wave. Figure 3 shows the ECG curves classification by QRS interval.
However, a negative wave occurs when the current is transported away from the pole.
I x , y = f t ψ x , y t d t
This inquiry concerns the temporal interval denotation, as well as the coordinates (x, y) that correspond to the poles of time, with respect to the signal transmission duration denoted as ‘t’, and the distributed temporal processing of the heuristic approach as shown in Equation (1). An ECG irregularity may be a heartbeat standard difference that does not harm human health. A heart attack may be detected by an irregular ECG.

3.3. Hybrid Feature Extraction

Creating new features from existing ones decreases a dataset’s features. This new, smaller set of attributes should then encapsulate the majority of the original set of qualities. A hybrid feature extraction method was suggested in this research study for the effective extraction of features.

3.3.1. Cuckoo Search Algorithm (CSA)

Underlying CS methods are based on cuckoo species that brood parasitize by laying their eggs in host bird nests. Three ideal rules are used to describe the fundamental CS [20] in order to keep things simple: (1) every time a cuckoo lays an egg, it deposits it in a set that is selected at random; (2) nests containing eggs of superior quality will be selectively passed down to succeeding generations; (3) the quantity of host nests that are accessible remains constant, and the probability of a host bird detecting a cuckoo-laid egg is present pa ∈ [0, 1]. In this scenario, the avian hosts either dispose eggs or abandon current nests and construct newer ones. The CS algorithm’s opposition learning and orthogonal design features are also included to boost its capacity to exploit search opportunities. For initializing the population and generating new candidate solutions in evolutionary generations, the quasi-opposition learning (QOL) is incorporated into CSO and is known as (MCSO). This can direct the population towards the more promising areas and spread it as widely as possible over the searching space.

3.3.2. MCSO

We introduced chicken swarm optimization (CSO), a brand-new bio-inspired optimization method. Hierarchical structures and behaviors of chicken swarms were replicated. The formulation of this heuristic framework was the natural behavior of chickens. The rules of motion that various chickens adhere to may differ [21]. We can create CSO on a theoretical proviso. The following criteria served as our simplified idealization of the hens’ behaviors:
  • Several groups may be seen in the chicken swarm. The dominating rooster, a few hens, and chicks are present in each group.
  • The chicken fitness ratings determine how to organize and identify each bird in the swarm. Each of the chickens acting as roosters would be the one with highest overall fitness score. Chick status would be assigned to the hens with the lowest multiple fitness levels. Which group to dwell in, the hens decide at random. Additionally, at random, the hens and chicks are placed in a mother–child connection.
  • In a group, the mother–child connection, dominance relationship, and hierarchical order all stay the same. Only sometimes, (G) time steps, do these statuses change.
  • The chickens may stop the others from eating their own food as they follow the rooster in the group in quest of nourishment. Assume that birds will haphazardly take the tasty food that has already been discovered by others. Around their mother (a hen), the chicks go in quest of nourishment. In struggles for food, dominant species hold an edge.
Assume that RN, HN, CN, and MN represented roosters, hens, chicks, and mother hens, respectively. It is said that chicks are the worst CN chickens and roosters are the finest. All the others were treated like chickens. The locations of all the N virtual chickens were shown as x i , j t i 1 , , N ,   j 1 , . , D found food in a D-dimensional space at time step t. The optimization issues in this study were the simplest; the hens with the lowest RN minimum fitness values were the best RN chickens.
i 
Movement of the Chickens
More priority for food availability is given to the roosters who are fitter than the roosters that are less fit [22]. The following formulation can be presented as in Equations (2) and (3).
x i , j t + 1 = x i , j t ( 1 + R a n d n 0 , σ 2 )
σ 2 = 1 ,   i f   f i f k exp ( f k f i ) f i + ε ,   o t h e r w i s e , k 1 , N ,   k i
where Randn ( 0 , σ 2 ) is a standard deviation and a mean of 0, and is Gaussian. σ 2 . ε , it prevents 0-division mistakes as a lowest constant. f represents corresponding x fitness values, and k implies random rooster indices.
Hens may search for food headed by roosters. It is a fact that they would sometimes take the lovable food source that other birds had discovered. In their competitions for food, dominant hens hold an edge over submissive ones. Following are some mathematical formulations for these occurrences as represented in Equations (4)–(6).
x i , j t + 1 = x i , j t + S 1 R a n d x r 1 , j t x i , j t + S 2 R a n d x r 2 , j t x i , j t
S 1 = exp ( ( f i f r 1 ) / ( a b s f i + ε ) )
S 2 = exp ( f r 2 f i )
R stands for evenly spaced random numbers between [0, 1], where r 1 1 , . , N represents group members of ith hens and indices of the roosters, while r 2 1 , . , N is a swarm’s randomly selected chicken, which is represented by an index r 1 r 2 . Obviously, f i > f r 1 ,   f i > f r 2 , thus S2 < 1 < S1. Assuming S1 = 0, following other chickens in searching for food was the ithhen at that point. S2 was smaller and the distance between the two chickens’ placements was wider the more the two hens’ fitness ratings diverged from one another. This would make it harder for the hens to take the food source that other birds had discovered. Because there were contests inside a team, S1’s evaluation was different from S2’s. For simplicity of use, the contests between the chickens in a group were used to represent how fit the chickens were in comparison to how fit the rooster. If S2 was equal to 0, the ith hen would search the area for food. Rooster fitness varies by group. So, the closer S1 was to 1, the less the distance between the ith hen’s location and that of its teammate the rooster was, and vice versa. In light of this, the dominant hens would be more inclined to consume the food than the submissive hens. Chicks roam about their mother in search of food as expressed mathematically in Equation (7):
x i , j t + 1 = x i , j t + F L ( x m , j t x i , j t )
where x m , j   t represents the mothers of ith chicks m 1 , N .   F L F L 0 , 2 represents parameters, therefore chicks hunt for food with their mothers. A random choice between 0 and 2 would be made by each chick’s FL, taking into account their unique variations.
An innovative idea in computational intelligence is called quasi opposition learning (QOL). In order to gain a better approximation of the present candidate solutions, the primary principle underlying QOL is to take into account both a solution and its matching opposing solution. It has been shown to be a successful way to improve several optimization strategies. Consequently, the QOL concept is used in the suggested algorithm to further boost variety and hasten convergence. Suppose X = ( x 1 ,   x 2 , . ,   x n ) is an n-dimensional space solution, with x i L x i ,   U x i ,   i = 1 , 2 , , n . The contrarian approach X = ( x 1 ,   x 2 , . ,   x n ) is given by Equation (8):
x i = L x i + U x i x i
Let f (.) be a fitness function that allows for the evaluation of the fitness value. Definitions of X and X , if f   ( X )     f   ( X ) , then X is replaced with X , otherwise X is kept. Consequently, the concurrent evaluation of both the solution and its antithesis was undertaken to derive the superior option. QOL was utilised for the purpose of initialising the population and generating novel solutions throughout the course of the evolutionary process.

3.4. MMNNS Machine Learning Algorithm

A medium filter may effectively separate low-frequency noise, often caused by baseline wander. The baseline augmentation signal is produced by subtracting the filtered signal from the individual ECG data after removing QRS complex waves, P waves, and T waves using 200 and 600 ms means and medium strain filters, respectively. Power-line pinging and high-frequency data noise are removed by the 12-tap low-pass strain [22].
The MMNNS method of ML techniques was used to classify the binary dataset according to the time interval between the peaks of the time interval QRS of the unbalanced signal, which change depending on the P to T time interval. Lastly, the stages were further categorized into two distinct groups. The analysis involved the examination of stages that were both predictable and unpredictable. Upon comparing the binary data signal of the ECG dataset with the appropriate range of the ECG signal, it can be inferred that any variation in the ECG wavelet range indicates the presence of heart diseases. Conversely, the absence of such variations suggests that the individual is not affected by these diseases. This study helps to improve classification findings, high accuracy, and analysis of feasible minimal time requirements.

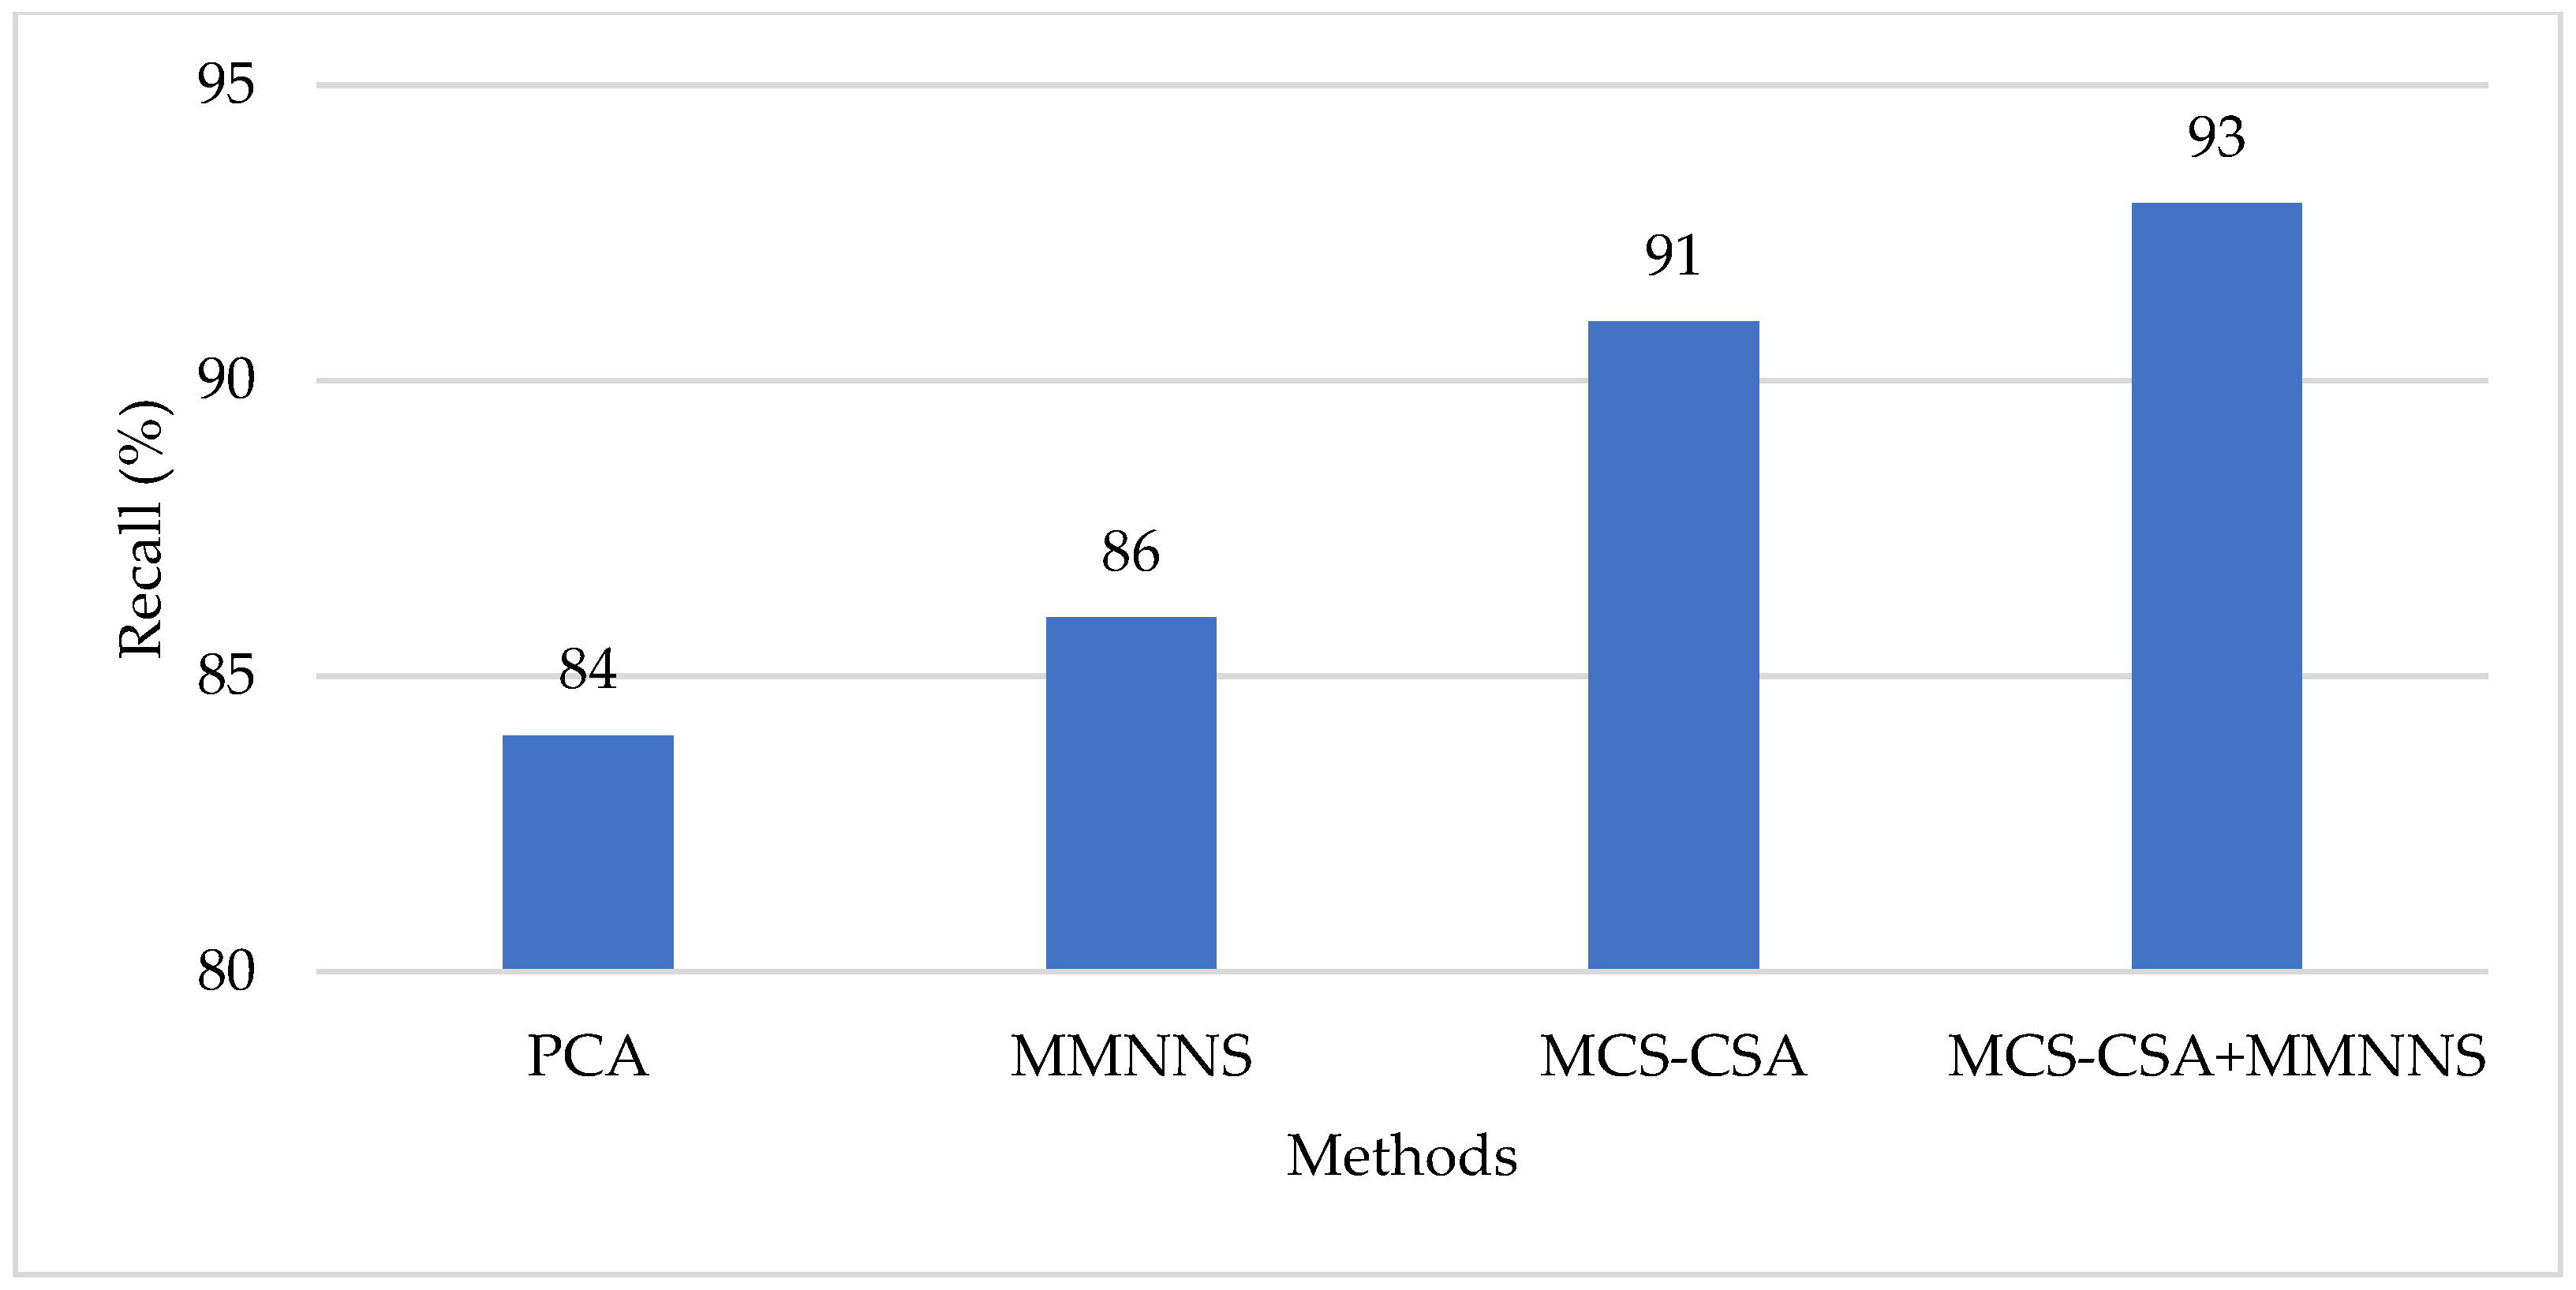
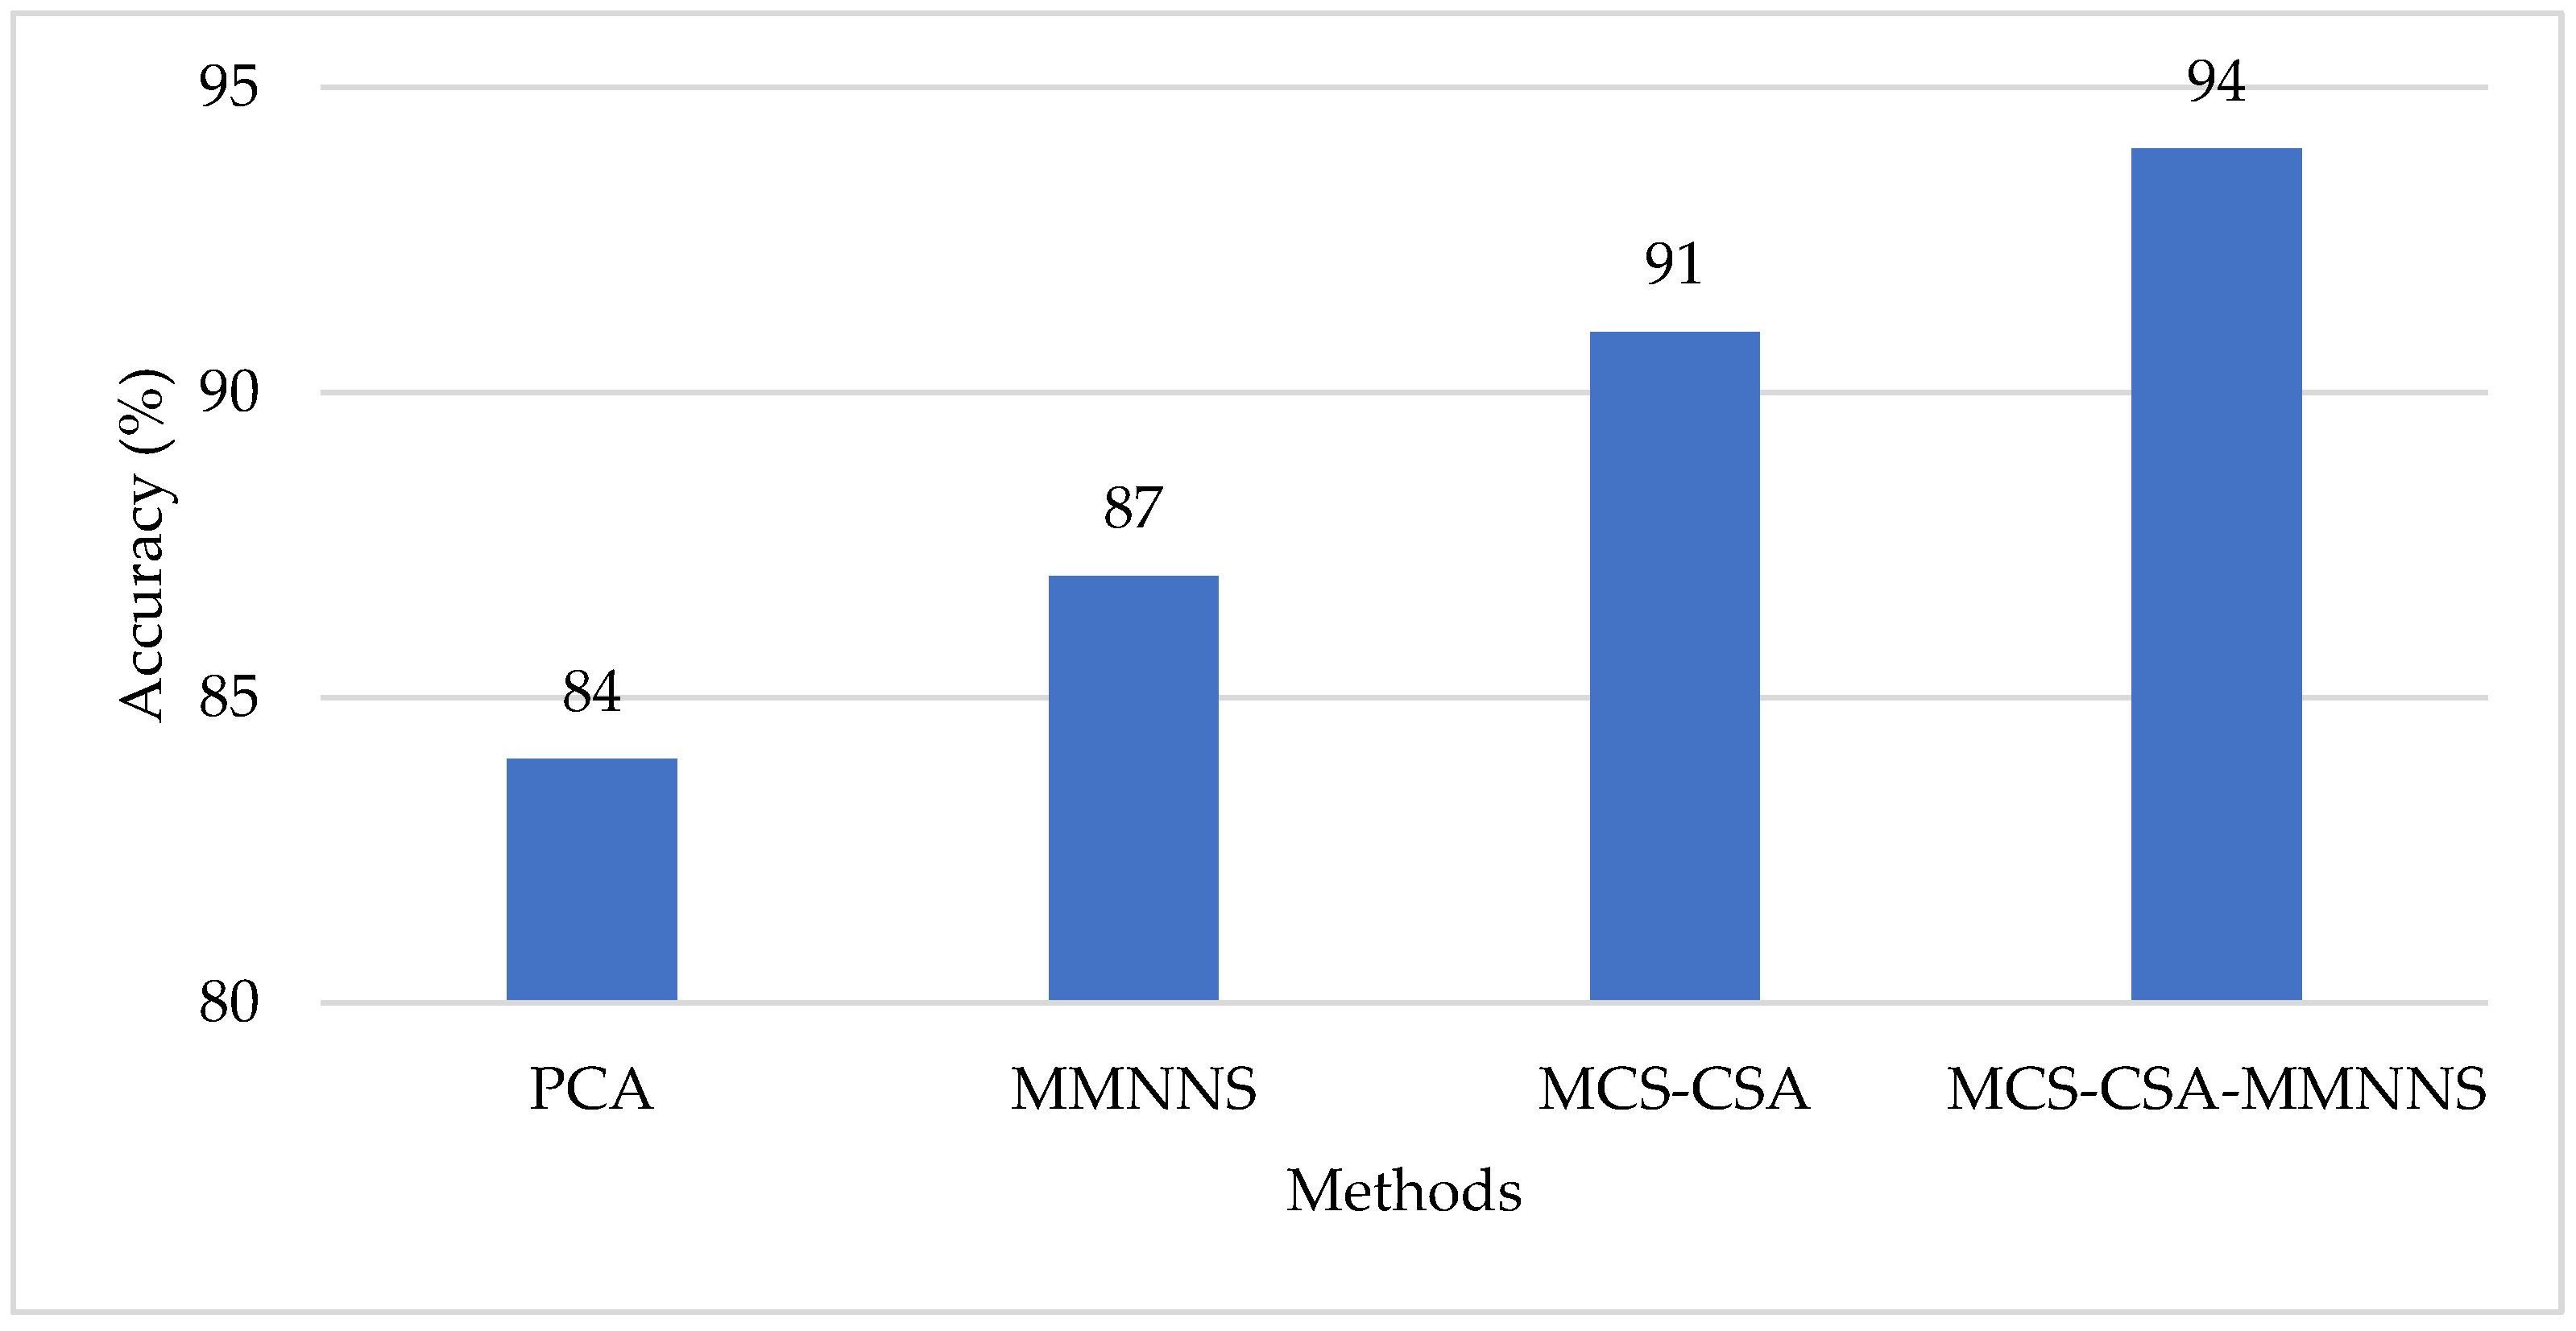
4. Results and Discussion

Performances of the MCS-CSA+MMNNS model and existing classifiers, namely MMNS and PCA, were compared. To assess the effectiveness of the classifier, the dataset acquired from https://archive.ics.uci.edu/ml/datasets/arrhythmia (accessed on 2 December 2023) was implemented in MATLAB 2.0. In addition to the accuracy of classifications, the performances of suggested MCS-CSA+MMNNS were evaluated using various evaluation metric values of precision, recall and F1scores. The graphical evaluated results are clearly depicted in the following graphs.
The performances of precision comparison results of the suggested MCS-CSA+MMNNS are displayed in Figure 4. As can be seen, the results show that the characteristics extracted using MCS-CSA+MMNNS may accurately predict the categorization of heart disease. It could be clearly observed from the graphical results that the proposed model outperformed the other approaches taken for comparison.
The suggested MCS-CSA+MMNNS-based classifier’s performance results based on recall comparison are shown in Figure 5. Thus, the suggested approach yielded 91.74% recall, compared to MMNNS’s 89.68% and PCA’s 87.25%. Performance comparisons of MCS-CSA+MMNNS are illustrated in graphical representations. The bar chart depicted in Figure 5 shows variations of performances in terms of recall metrics. The proposed framework is clear and well outperformed the other methods taken for comparison.
Figure 6 shows that the proposed MCS-CSA+MMNNS gave more accuracy than the existing classifier. The proposed MCS-CSA+MMNNS classifier performed poorly when applied to static data; all of the classifiers stated above performed poorly when compared to it, demonstrating the method’s efficacy in all relevant contexts for the categorization of cardiac disease. Consequently, compared to the other classifiers constructed on previously developed models, this classifiers’ accuracy will be greater.

5. Conclusions

Heart disease diagnosis in medicine often uses electrocardiogram (ECG) signals. It has proven difficult for computerized systems to automatically extract pertinent and trustworthy data from ECG readings. In this research work, an MMNNS-based ECG heartbeat classification model and an MCS-CSA based on intelligent feature selection were proposed. When a one-dimensional signal was input, the model produced categorization findings. The information that the model would extract would be different if the data points’ positions in the input data were altered. Continuous signals from ECG heartbeats are time sequence signals with local characteristics. An ECG-based classifier can precisely identify the traits present in the local signals. The findings also point to the possibility of using the suggested automated categorization approach to identify cardiac problems, which may help doctors avoid having to perform as much manual classification labor. The parameter optimization of the classifier built using MMNNS, however, has reduced this system’s accuracy. To improve the classifier utilizing cutting-edge optimization approaches, this study effort should be expanded further.

Author Contributions

Conceptualization, B.K., R.S., K.N. and R.M.S.; methodology, B.K. and R.S.; software, B.K.; validation, B.K.; formal analysis, R.S. and K.N.; investigation, R.M.S.; resources, R.M.S.; data curation, R.M.S.; writing—original draft preparation, B.K.; writing—review and editing, B.K.; visualization, R.S. and K.N.; supervision, R.S. and K.N. All authors have read and agreed to the published version of the manuscript.

Funding

This research received no external funding.

Institutional Review Board Statement

Not applicable.

Informed Consent Statement

Not applicable.

Data Availability Statement

The data can be obtained from the corresponding author on request.

Acknowledgments

We acknowledge the institutional management and family members for their immense support.

Conflicts of Interest

The authors and coauthors declare no conflicts of interest.

References

  1. Kamaruddin, N.H.; Murugappan, M.; Omar, M.I. Early prediction of Cardiovascular Diseases using ECG signal. In Proceedings of the IEEE Student Conference on Research and Development, Pulau Pinang, Malaysia, 5–6 December 2012. [Google Scholar]
  2. Tabassum, T.; Islam, M. An approach of cardiac disease prediction by analyzing ECG signal. In Proceedings of the 3rd International Conference on Electrical Engineering and Information Communication Technology, Dhaka, Bangladesh, 22–24 September 2016. [Google Scholar]
  3. Zhang, W.; Yu, L.; Ye, L.; Zhuang, W.; Ma, F. ECG signal classification with deep learning for heart disease identification. In Proceedings of the International Conference on Big Data and Artificial Intelligence, Beijing, China, 22–24 June 2018. [Google Scholar]
  4. Murukesan, L.; Murugappan, M.; Iqbal, M. Sudden cardiac death prediction using ECG signal derivative (heart rate variability): A review. In Proceedings of the IEEE 9th international colloquium on signal processing and its applications, Kuala Lumpur, Malaysia, 8–10 March 2013. [Google Scholar]
  5. Sakhare, P.B.; Ghongade, R. An approach for ECG beats classification using adaptive neuro fuzzy inference system. In Proceedings of the Annual IEEE India Conference, New Delhi, India, 17–20 December 2015. [Google Scholar]
  6. Anwar, T.; Zakir, S. Effect of image augmentation on ECG image classification using deep learning. In Proceedings of the International Conference on ArtifIntell, Islamabad, Pakistan, 5–7 April 2021. [Google Scholar]
  7. Nazmy, T.M.; El-Messiry, H.; Al-Bokhity, B. Adaptive neuro-fuzzy inference system for classification of ECG signals. In Proceedings of the 7th International Conference on Informatics and Systems (INFOS), Cairo, Egypt, 28–30 March 2010. [Google Scholar]
  8. Nagavelli, U.; Samanta, D.; Chakraborty, P. Machine learning technology-based heart disease detection models. J. Healthc. Eng. 2022, 2022, 7351061. [Google Scholar] [CrossRef] [PubMed]
  9. Muthuvel, K.; Suresh, L.P. Adaptive neuro-fuzzy inference system for classification of ECG signal. In Proceedings of the International Conference on Circuits, Power and Computing Technologies (ICCPCT), Nagercoil, India, 20–21 March 2013. [Google Scholar]
  10. Agarwal, S.; Krishnamoorthy, V.; Pratiher, S. ECG signal analysis using wavelet coherence and s-transform for classification of cardiovascular diseases. In Proceedings of the International Conference on Advances in Computing, Communications and Informatics (ICACCI), Jaipur, India, 21–24 September 2016. [Google Scholar]
  11. Ishaq, A.; Sadiq, S.; Umer, M.; Ullah, S.; Mirjalili, S.; Rupapara, V.; Nappi, M. Improving the prediction of heart failure patients’ survival using SMOTE and effective data mining techniques. IEEE Access 2021, 9, 39707–39716. [Google Scholar] [CrossRef]
  12. Thiyagarajan, C. A survey on diabetes mellitus prediction using machine learning techniques. Int. J. Appl. Eng. 2016, 11, 1810–1814. [Google Scholar]
  13. Acharya, U.R.; Fujita, H.; Lih, O.S.; Adam, M.; Tan, J.H.; Chua, C.K. Automated detection of coronary artery disease using different durations of ECG segments with convolutional neural network. Knowl. Based Syst. 2017, 132, 62–71. [Google Scholar] [CrossRef]
  14. Liang, Y.; Yin, S.; Tang, Q.; Zheng, Z.; Elgendi, M.; Chen, Z. Deep learning algorithm classifies heartbeat events based on electrocardiogram signals. Front. Physiol. 2020, 11, 569050. [Google Scholar] [CrossRef] [PubMed]
  15. Vafaie, M.H.; Ataei, M.; Koofigar, H.R. Heart diseases prediction based on ECG signals’ classification using a genetic-fuzzy system and dynamical model of ECG signals. Biomed. Signal Process. Control 2014, 14, 291–296. [Google Scholar] [CrossRef]
  16. Chen, J.; Valehi, A.; Razi, A. Smart heart monitoring: Early prediction of heart problems through predictive analysis of ECG signals. IEEE Access 2019, 7, 120831–120839. [Google Scholar] [CrossRef]
  17. Alarsan, F.I.; Younes, M. Analysis and classification of heart diseases using heartbeat features and machine learning algorithms. J. Big Data 2019, 6, 81. [Google Scholar] [CrossRef]
  18. Jahmunah, V.; Ng, E.Y.K.; San, T.R.; Acharya, U.R. Automated detection of coronary artery disease, myocardial infarction and congestive heart failure using GaborCNN model with ECG signals. Comput. Biol. Med. 2021, 134, 104–457. [Google Scholar] [CrossRef] [PubMed]
  19. Babu, K.; Marikkannu, P. Machine Learning Techniques Applied for Exploring Heart Disease and Classifying Stages through ECG Signal. Neuro Quantology 2022, 20, 473–482. [Google Scholar] [CrossRef]
  20. Rajabioun, R. Cuckoo optimization algorithm. Appl. Soft Comput. 2021, 11, 5508–5518. [Google Scholar] [CrossRef]
  21. Meng, X.; Liu, Y.; Gao, X.; Zhang, H. A new bio-inspired algorithm: Chicken swarm optimization. In Proceedings of the Advances in Swarm Intelligence: 5th International Conference, ICSI 2014, Hefei, China, 17–20 October 2014. [Google Scholar]
  22. Hafez, A.I.; Zawbaa, H.M.; Emary, E.; Mahmoud, H.A.; Hassanien, A.E. An innovative approach for feature selection based on chicken swarm optimization. In Proceedings of the 7th International Conference of Soft Computing and Pattern Recognition (SoCPaR), Fukuoka, Japan, 13–15 November 2015. [Google Scholar]
Figure 1. General ECG signal and fiducial points.
Engproc 59 00126 g001
Figure 2. The process of the proposed methodology.
Engproc 59 00126 g002
Figure 3. Classifying ECG curves by QRS interval.
Engproc 59 00126 g003
Figure 4. Precision comparison results of the proposed model.
Engproc 59 00126 g004
Figure 5. Recall comparison results of the proposed model.
Engproc 59 00126 g005
Figure 6. Accuracy comparison results.
Engproc 59 00126 g006
Disclaimer/Publisher’s Note: The statements, opinions and data contained in all publications are solely those of the individual author(s) and contributor(s) and not of MDPI and/or the editor(s). MDPI and/or the editor(s) disclaim responsibility for any injury to people or property resulting from any ideas, methods, instructions or products referred to in the content.

