Proceeding Paper

Optimization of Performance and Emission Responses of Common Rail Direct Injection Engine by Taguchi-Grey Relational Analysis Technique †

1
Department of Mechanical Engineering, Vidyavardhaka College of Engineering, Mysuru 570002, Karnataka, India
2
Department of Mechanical Engineering, National Institute of Engineering, Mysuru 570008, Karnataka, India
*
Author to whom correspondence should be addressed.
Presented at the International Conference on Recent Advances on Science and Engineering, Dubai, United Arab Emirates, 4–5 October 2023.
Eng. Proc. 2023, 59(1), 140; https://doi.org/10.3390/engproc2023059140
Published: 4 January 2024
(This article belongs to the Proceedings of Eng. Proc., 2023, RAiSE-2023)

Abstract

:
India imports fossil fuels to meet its energy needs, and the need is anticipated to increase over the coming years. The constant usage of crude fuel will initiate its depletion in due course, necessitating the hunt for substitute fuels. One of the most promising alternatives to fossil fuels is determined to be biofuels. Fuels made from second-generation feedstocks, particularly non-edible oils, may change the game in this situation. The use of Simarouba non-edible oil as a substitute for diesel in common rail direct injection (CRDI) engines is the subject of the current piece of research. Running a CRDI engine with Simarouba biodiesel blends may not be suitable under the same operating conditions as running a diesel engine. To optimize performance, the ideal conditions for operating a CRDI engine with Simarouba biodiesel mixes needs to be discovered. The control settings in this study that affect the engine’s performance viz., fuel temperature (FPT), fuel injection pressure (IP), and injection time (IT) are designed using the Taguchi technique. Under full load conditions of 12 kg, for the biodiesel blends viz., SB5, SB10, and SB20, studies were conducted using the Taguchi L9 orthogonal array (OA). Through experimentation, performance and emission responses were obtained. For analysis, six engine responses were considered. The analysis shows that each response is uniquely impacted by the engine control parameters. Therefore, it might be challenging to pinpoint the ideal circumstances that would improve performance and lower emissions. Thus, this presents an example of a multi-response optimization problem. For this reason, multiple response optimization uses Taguchi-Grey Relational Analysis (TGRA). According to TGRA, the ideal settings to increase engine performance while using Simarouba biodiesel blends as fuel are an FPT of 40 °C, an IT of 21° bTDC, and an IP of 600 bar.

1. Introduction

In India, the transportation sector is a key contributor to increased emissions. At present, the energy utilized in the transportation sector comes mostly from petroleum, and India sources most of its energy need from other countries. The climate is impacted by constant usage of petroleum. There is an urgent need to decrease greenhouse gas emissions [1]. India has set a target to reduce GHG emissions and is committed towards decarbonization of the transportation sector. Biofuels are being given substantial consideration because they may provide an answer to several challenges, including the exhaustion of petroleum resources, environmental concerns, problems with energy security, and rural unemployment. There are many non-edible oil seeds with commercial value, including neem, Simarouba, mahua, jojoba, rubber seed, and tobacco seed [2]. These oils can be used in diesel engines, which compresses air-fuel mix to produce the required power [3]. Recent studies and research have demonstrated that blending biodiesel with diesel has advantages including reduced viscosity, increased efficiency, and decreased emissions, among others [4]. Because energy costs can be reduced, the use of biodiesel has a big impact on the economy. Because biodiesel degrades more quickly and has virtually little sulfur when matched with diesel, using it is excellent for the environment. Biodiesel is less harmful and is biodegradable. In addition to significantly lowering energy costs, biodiesel also improves employment opportunities in rural areas.
In this study, a two-stage transesterification procedure was used to turn Simarouba oil into Simarouba biodiesel. To examine its impact on CRDI engines, neat Simarouba biodiesel was mixed with diesel in various amounts, namely 5%, 10%, and 20%. The fuel parameters of the mixes of Simarouba biodiesel were studied to assess their viability as an engine fuel. Using the Taguchi method, studies incorporating control variables that have an impact on the CRDI engine’s performance were planned. By conducting experiments according to the L9 orthogonal array for the biodiesel blends B5, B10, and B20, how the performance and emission reactions changed was noted. By adopting the grey relational method, the CRDI engine’s many responses were reduced to a single response, or GRG [5,6].
Deng created the Grey Relational Analysis (GRA), which uses the Grey System Theory. The GRA is exploited to solve difficult, grey-natured situations involving both known and unknowable information [4]. Since the Taguchi technique provides distinct ideal settings for every variable in response, it is appropriate to find the best values for single response problems. However, multi-response optimization utilizing GRA is the best approach when several responses have different properties [7,8,9,10,11]. GRA is employed to discover the most important factor impacting the response variable by ranking the experiments as per grey relational grade (GRG) value [10]. The best conditions for operating an engine by biodiesel blends are found using TGRA analysis, which combines the GRA and Taguchi techniques.

2. Methodology

Through a two-stage transesterification process, Simarouba oil was treated to make Simarouba biodiesel. To evaluate the impact on the engine, neat Simarouba biodiesel was mixed in varied amounts, i.e., 5%, 10%, and 20% with diesel. Fuel preheating temperature (FPT), injection pressure (IP), and injection time (IT) were the three engine control elements or engine variables taken while designing tests with an L9 orthogonal array, utilizing the Taguchi design of experiments (DOE) [12,13,14,15]. Regarding every one of these variables, three levels were chosen. Injection pressures of 600 bar, 500 bar, and 400 bar; timings of 21° bTDC, 23° bTDC, and 25° bTDC; and temperatures of 30 °C, 35 °C and 40 °C were all different. Based on the literature, the levels of the indicated engine variables were selected. The experiments were performed utilizing SB-5, SB-10, and SB-20 biodiesel blends on a CRDI engine in accordance with the specified conditions, as indicated in Table 1. The performance and emission outputs were documented by experimentation. To discover the optimal operating state for the CRDI engine, these responses were optimized by utilizing the Grey Relational Analysis technique.
The primary goal of employing the GRA in the TGRA method is to convert multi-response optimization into a single-response problem by considering the GRG value [16]. Following the acquisition of experimental data for all biodiesel blends, the TGRA is carried out as follows:
  • Experimental data’s normalization.
  • Grey relation coefficient (GRC) estimation for each response.
  • Grey relation grade calculation for each response.
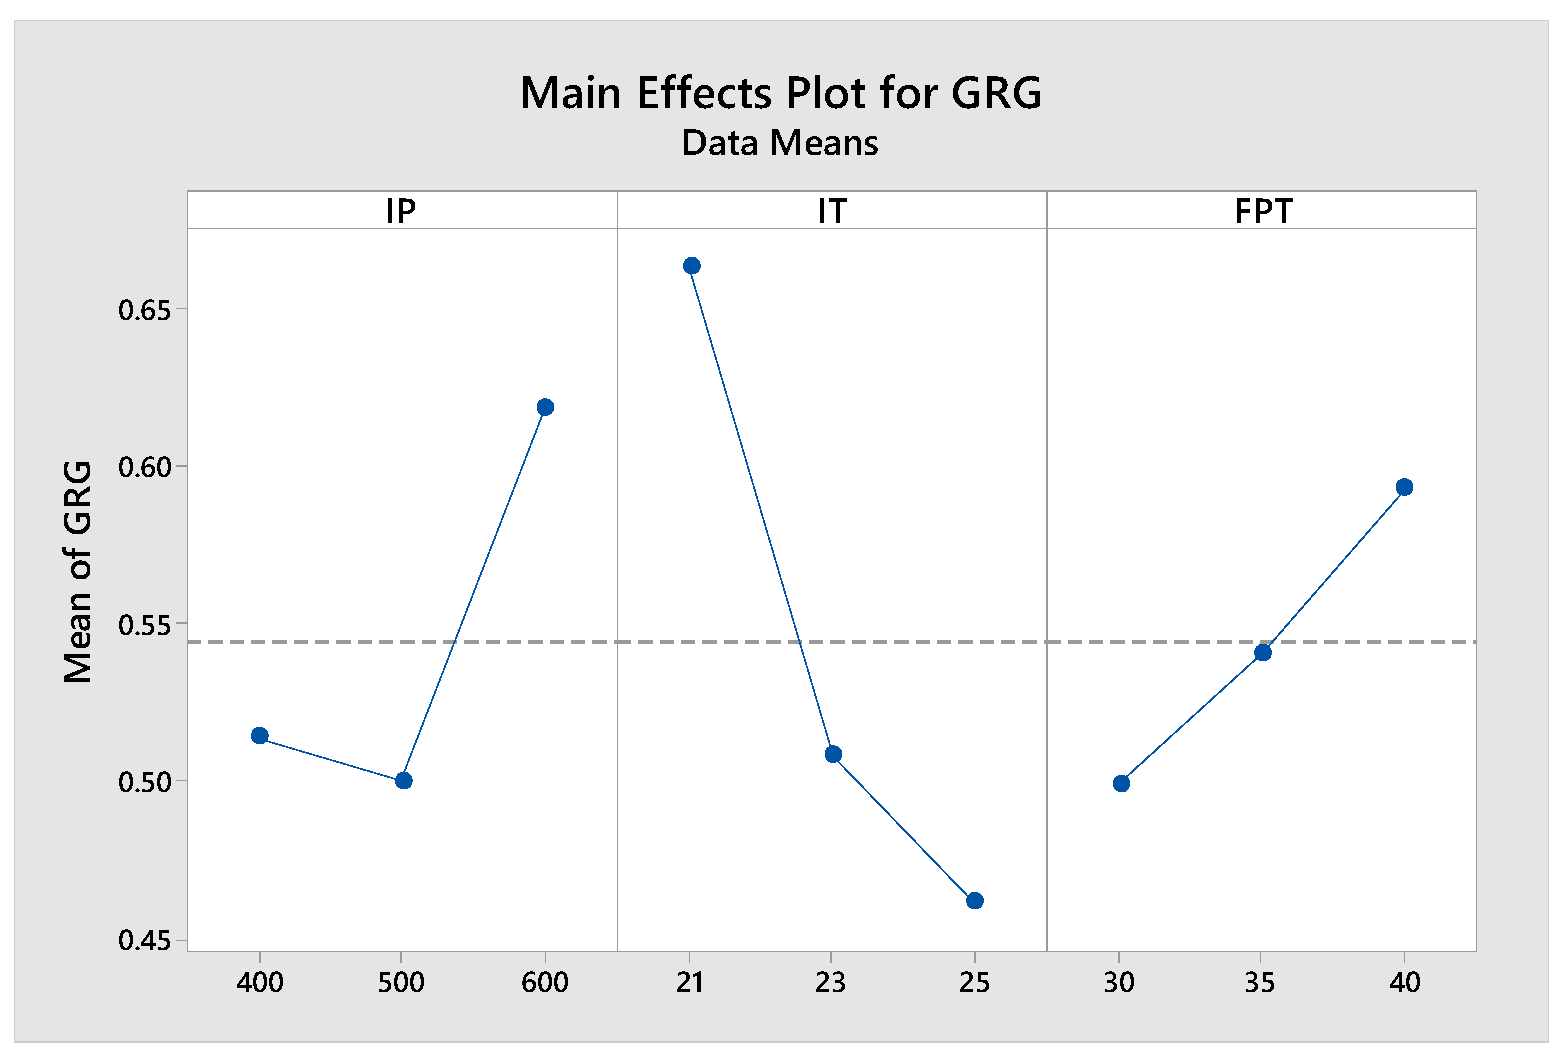
  • Choosing the best levels depending on the gray relation grade.
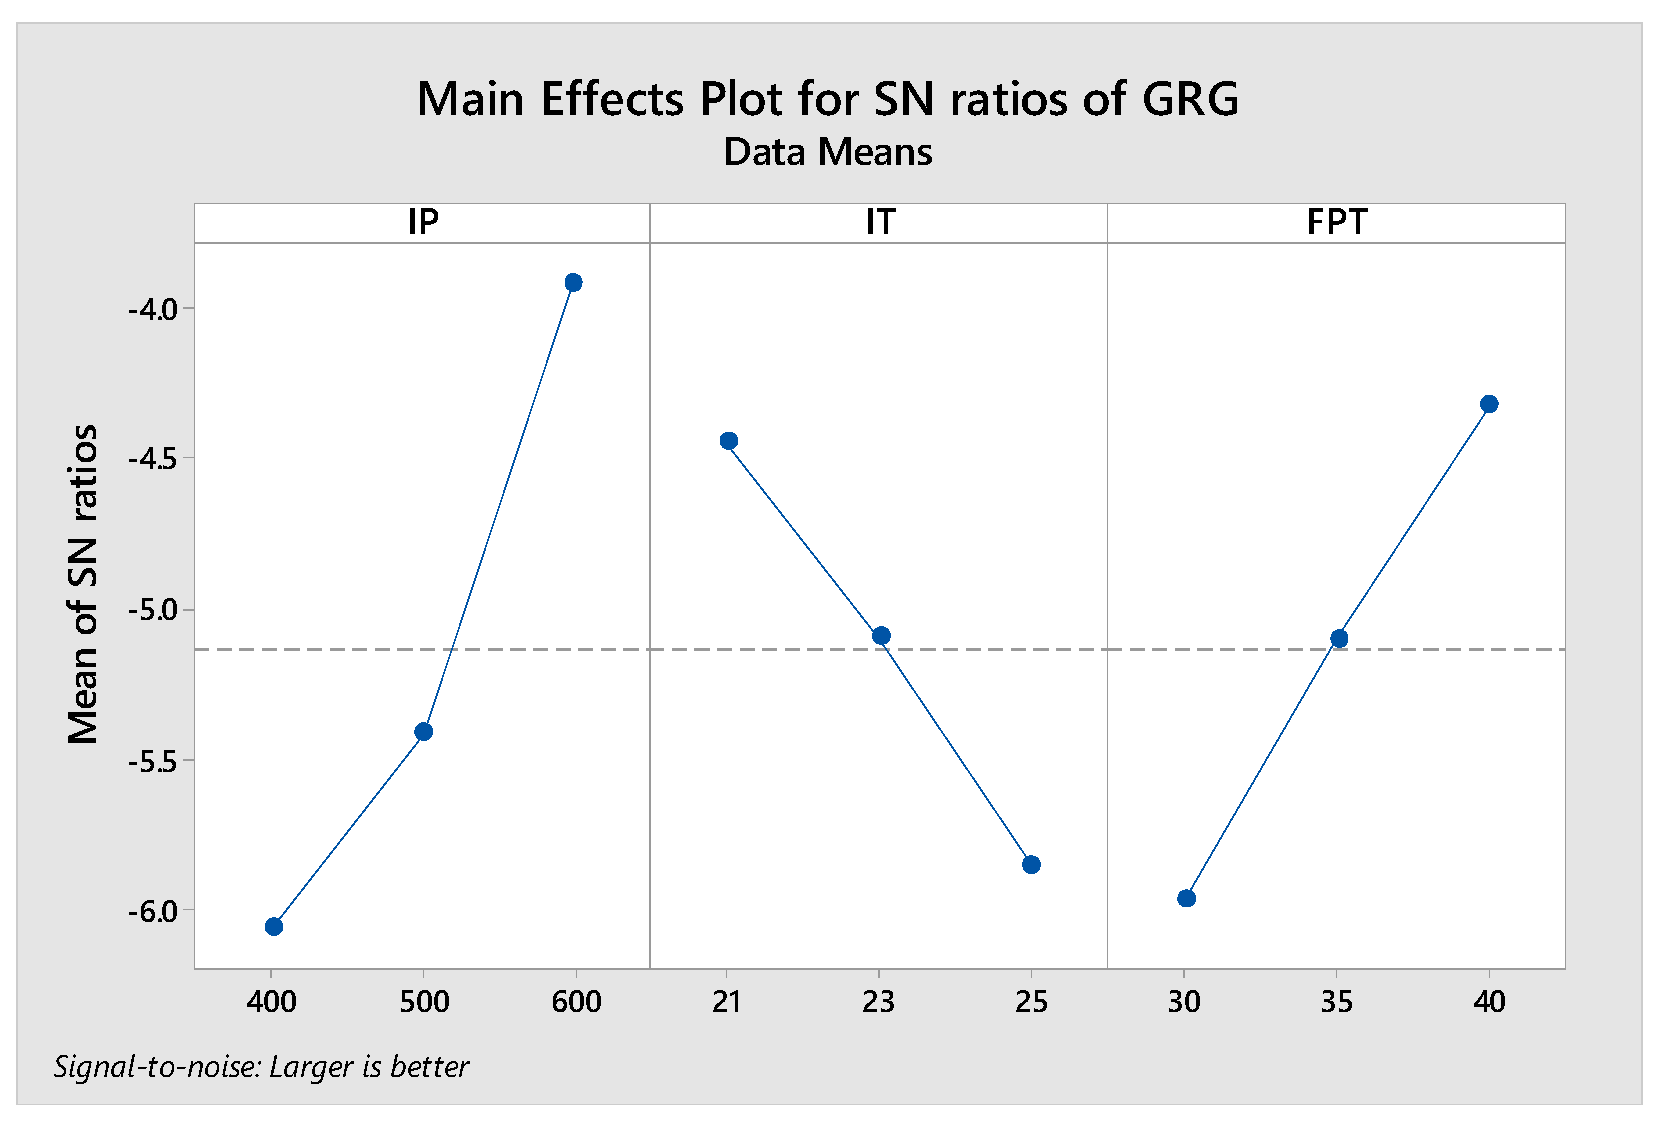
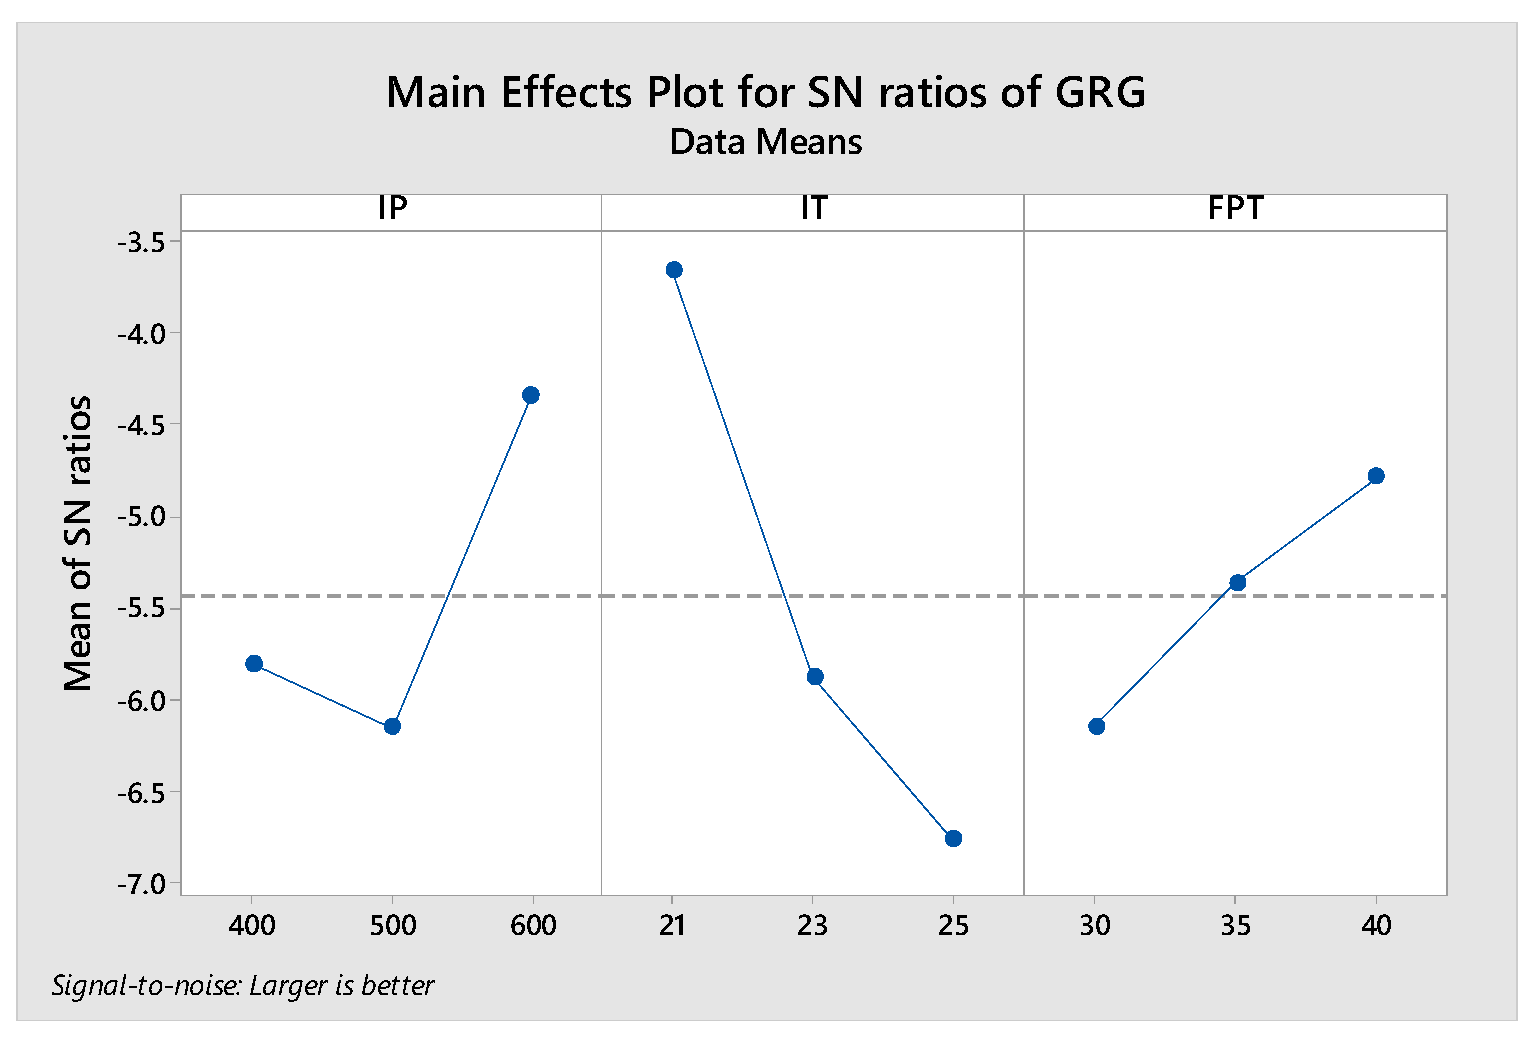
  • Employing the signal to noise ratio (S/N ratio) to analyze the GRG.
  • By using an ANOVA with the GRG, the importance of the engine control component is determined.
  • Verification of the best levels achieved by GRA [6,7,8,9,10,11].
The experiment-derived data were standardized in the array of 0 to 1 for GRA [17]. The term “grey relational generation” refers to this process. Based on normalizing values, the GRC, which determines a relationship between desired and actual values, is obtained. Then, the GRG is assessed by averaging the GRC for every response. According to a literature review, the distinguishing coefficient ψ is typically assumed to be 0.5 to give each parameter an equal amount of weight [4,5,7]. Therefore, ψ = 0.5 was taken for all responses in the current investigation. With the aim of obtaining the best value, GRA transforms multiple answer optimization into a single response [4,5]. The closest to optimal value of engine control parameters are opted for through enhanced performance and decreased emissions according to the greater GRG score. As a result, this methodology was utilized to optimize the control variables of a CRDI engine. The relevance of emission and performance responses is equivalent in this study. As a result, a 0.5 weight factor was allocated for each of the engine’s performance and emission reactions. All the responses’ weighting factors must add up to one. The weighting factor for a CRDI engine’s performance and emissions is presented in Table 2. According to the GRA approach, the experiment with a large GRG value is ranked first and shows which specific set of engine control parameters has a substantial impact on the engine’s responses and is thought to be closer to the optimal value.

Employing the Signal to Noise Ratio to Analyze GRG

The S/N ratio, which is employed in analysis as a performance metric, is the deviation of the measured value from the response variable’s desired value. The S/N ratio takes experimental value variability and mean into account [12]. In the S/N ratio, the signal term denotes the mean value and the noise term, with variation in the responses. This method aids in identifying the signal component that mitigates the impact of the noise component in the response. To lessen the impact of noise, a higher S/N ratio is needed [5].
The two types of criterions that are frequently utilized for S/N ratio analysis are “higher is better” and “smaller is better”. The ideal applications for the higher is better criterion are engine reactions like brake power and brake thermal efficiency. The smaller is better criterion is ideally suited for performance responses like BSFC, including emission responses like CO, CO2, NOx, and UHC. A higher S/N ratio generally means a better performance, since there is more useful information than there is unwanted data [18]. S/N ratio analysis was applied in this study to examine the GRG values of each response and determine the best combination of operating conditions. Considering the average GRG value, the best levels of control parameters were picked using the higher is better principle [18,19]. In the current study, an ANOVA was utilized to find out the degree to which each control factor, namely, injection pressure, fuel temperature, and injection time, influences the reactions of the CRDI engine [20].

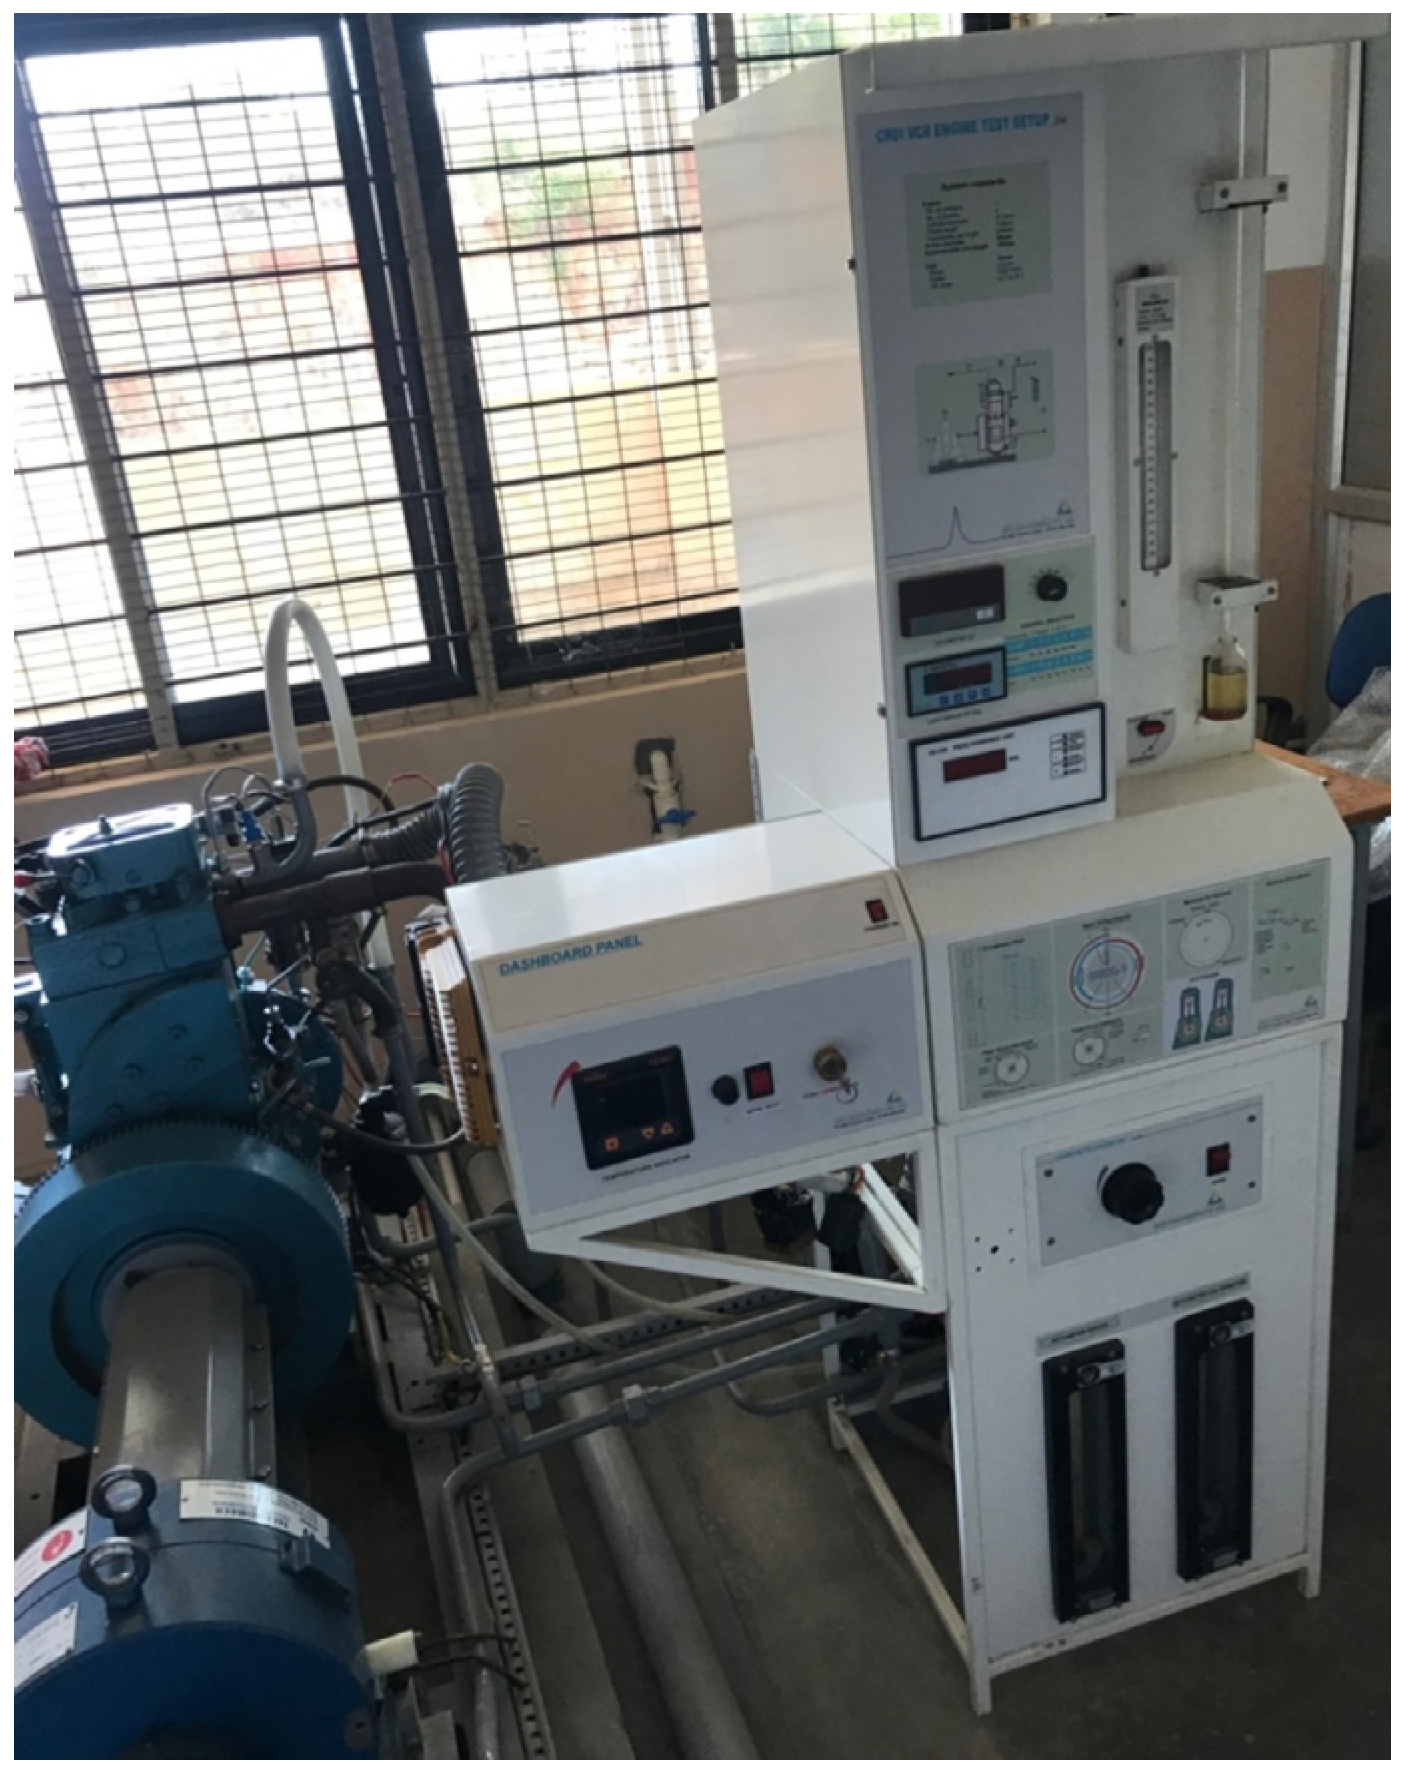
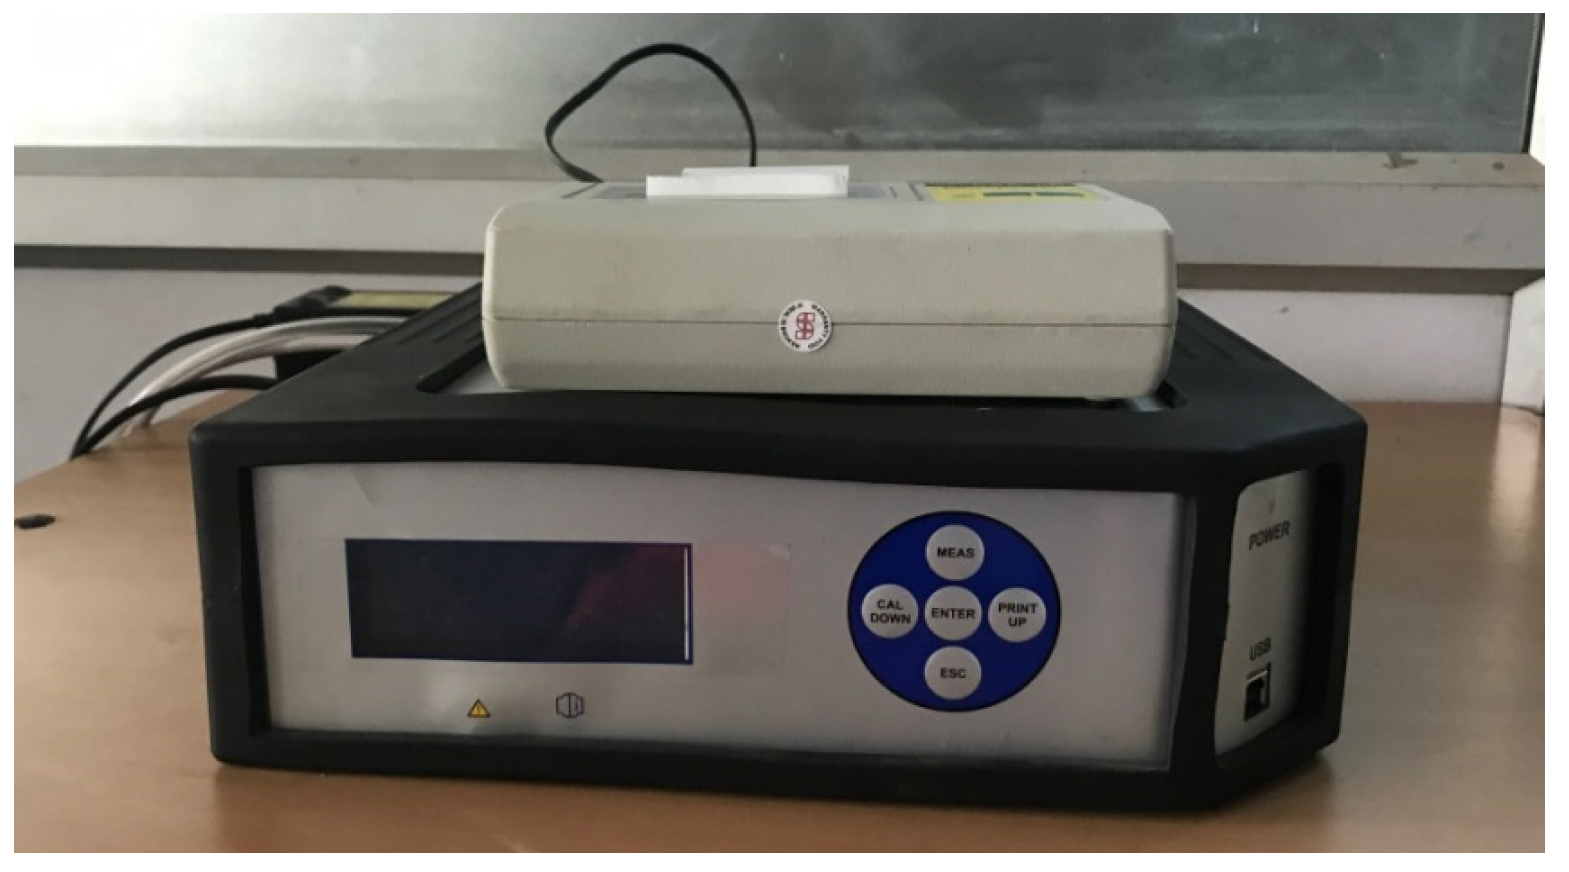
3. Experimental Setup

The CRDI engine configuration was used to assess the Simarouba biodiesel blends SB5, SB10, and SB20 at a full load of 12 kg. Figure 1 depicts the CRDI engine exploited for experimentation. Figure 2 depicts the AVL emissions analyzer that was utilized to evaluate the emission responses. Table 3 presents the CRDI engine’s technical specifications. To obtain baseline measurements, which serve as comparison points for biodiesel blends, the engine was initially loaded with 12 kg and tested for diesel fuel. As presented in Table 1, the studies were carried out using an L9 OA for the SB5, SB10, and SB20 blends.

4. Results and Discussion

Based on the trial findings of B-5, B-10, and B-20 Simarouba blends, the best operating factor conditions were selected. The GRG and the GRC for every reaction are presented for each test using the SB5, SB10, and SB20 biodiesel blends, respectively, in Table 4, Table 5 and Table 6.
To discover the best engine control parameters for increased performance, the resulting GRG data were examined [21]. Greater GRG data were the best choice since they indicated that the relevant outcomes were approaching optimal levels [22]. It is known from Table 4, Table 5 and Table 6 that experiment number 7 has a better GRG for SB-5, SB-10, and SB-20 blends with values 0.814, 0.793, and 0.803, respectively. Therefore, experiment 7 was rated first among all compared to other experiments. The engine control settings that correspond with experiment number seven are a fuel temperature of 40 °C, an injection pressure of 600 bar, and an injection timing of 21° bTDC. Consequently, the A3B1C3 was nearer to the ideal because of the GRA technique’s examination of experimental data.

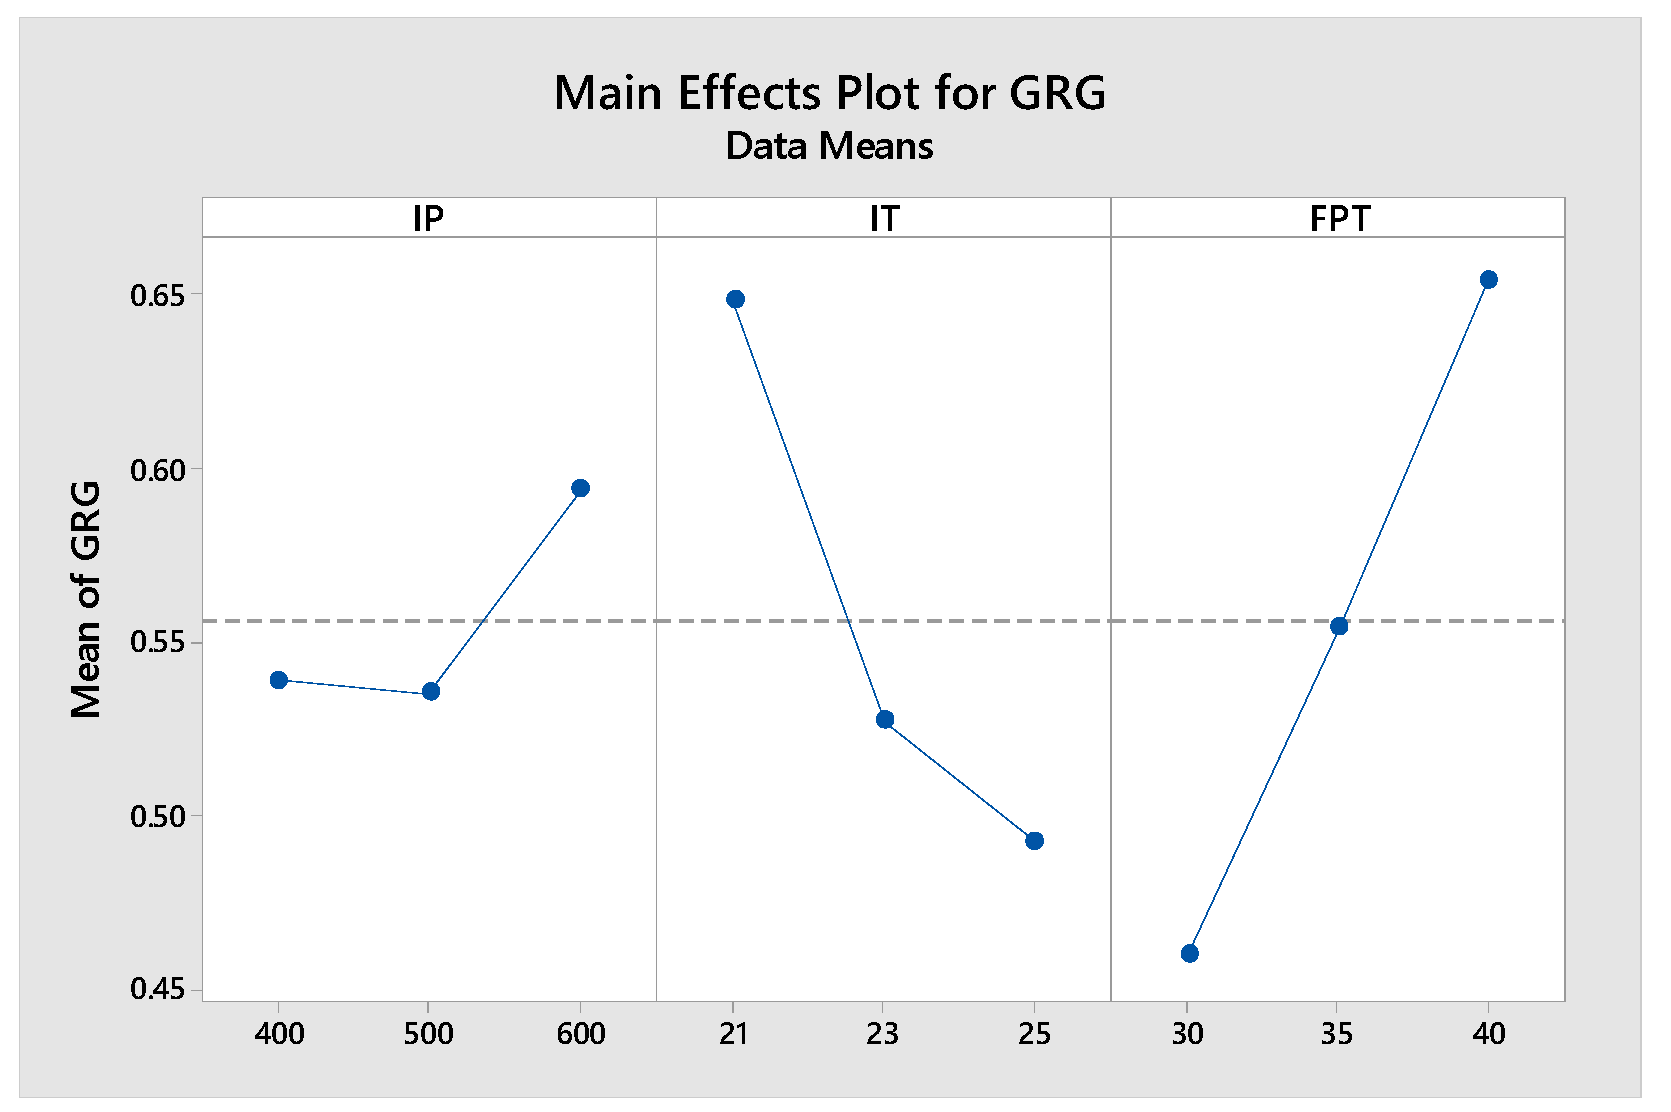
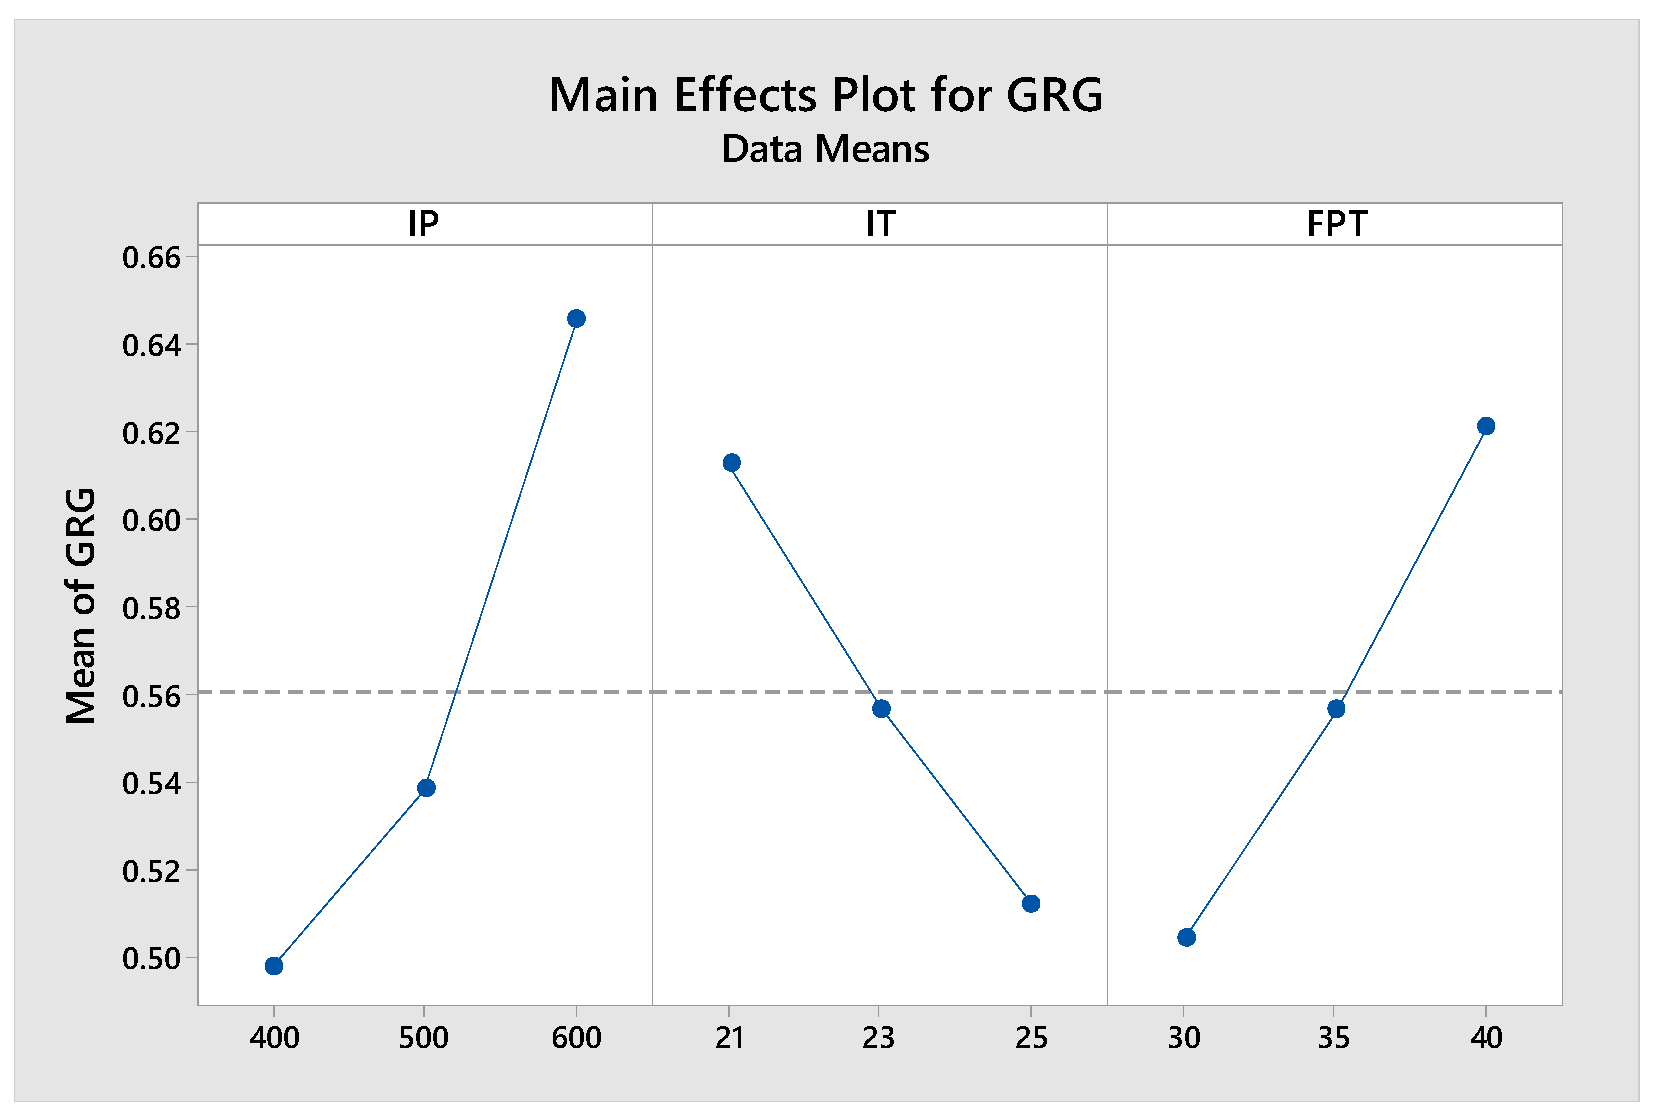
4.1. S/N Ratio Study

Figure 3 clearly illustrates how the GRG meant that the SB-5 blend increased as the temperature of the fuel preheating process rose. It started to modestly decline with a rise in IP before eventually rising. Figure 4 shows the S/N variation of GRG values for SB-5 blend. The improved atomization, vaporization, and efficient fuel–air mixing of the SB-5 blend are ascribed to the higher IP and fuel temperatures. This resulted in complete fuel combustion. The GRG was decreased by raising the IT value or by adopting more advanced IT. Longer delays resulted from longer injection times because fuel was sprayed into the combustion chamber, causing compressed air at a lower temperature and pressure. Additionally, the engine cylinder accumulated more fuel because of the extended delay period. Because of this the engine ran extremely loudly and the peak cycle pressure increased in the premixed combustion stage. The SB5 blend was significantly more closely pumped at a slowed IT or at 21° bTDC, compared to at other ITs. Since the air within was efficiently compressed before the SB5 biodiesel mix was introduced at a higher IP and was warmed at a temperature of 40 °C, higher pressure and temperature were present in the combustion chamber’s environment. The fuel atomized into finer droplets, evaporated more quickly, and mixed appropriately under these conditions. Complete combustion and a decrease in emissions resulted from the enhanced conditions inside the combustion chamber.
Figure 5 and Figure 6 display the primary effect graphs for the SB10 biodiesel, which show the GRG and S/N ratios. The data demonstrate that while the GRG value decreases as IT increases, IT rises when IP and FPT increase. Improved SB10 blend atomization, vaporization, and mixing in the cylinder resulted from the improved IP and FPT, which enhanced combustion. If the IT is started before the regular injection, there may be a lengthier delay. Figure 7 and Figure 8 demonstrate how a rise in fuel temperature raises the SB20 biodiesel’s GRG value. For IP, the GRG initially fell and subsequently rose. Additionally, a decline in IT value raised the GRG. Complete combustion happened because the conditions in the cylinder were better, which lowered pollutants. An increased engine output was reached for SB-5, SB-10, and SB-20 blends at injection pressures of 600 bar, timings of 21° bTDC, and temperatures of 40 °C for fuel preheating.

4.2. Analysis of Variance (ANOVA)

To find out how significantly engine control parameters affect engine responses, an ANOVA was used. It was employed to analyze the GRG data of the SB-5, SB-10, and SB-20 blends. Fuel temperature is the major factor that has the biggest effect on the GRG for the SB-5 blend. An injection timing of 37.01% and an injection pressure of 5.90% are the next best factors. Because it is close to unity, an R2 of 0.953 is acceptable for this model. IP contributes the most (45.59%) to the SB-10 biodiesel, followed by FPT with 26.74% and IT with 19.75%. The R2 of the ANOVA model for the SB-10 blend was discovered to be 0.944, which is closer to 1 and suggests that the model can be implemented. IT makes a big contribution to the SB-20 biodiesel, with a proportion of 62.65%, succeeded by IP at 23.64% and FPT at 12.41%. The R2 value for SB-20 blend was obtained as 0.987, which is nearer to 1 and shows a good degree of data fit for the model, allowing for it to be accepted.

4.3. Performance Analysis

The most helpful variables for engine combustion research are net heat release and cylinder pressure information. The pressure created by the fuel during combustion inside the chamber to achieve the desired work output in the piston is known as cylinder pressure. Figure 9 displays the changes in pressure in the cylinder for diesel and various combinations of Simarouba. The graph indicates that the Simarouba biodiesel blends’ pressure curve is comparable to that of diesel. A 63.2 bar cylinder pressure was attained for diesel. Greater cylinder pressures of 64.29 bar, 64.57 bar, and 64.08 bar, respectively, were reached for SB5, SB10, and SB20. From this, it can be said that diesel has a marginally lower cylinder pressure at 8° aTDC than the blends. The blends of Simarouba biodiesel were injected at 21° bTDC and fired a little bit later than diesel. The air in the cylinder was successfully compressed, increasing its pressure and temperature. The rapid burning of fuel–air combinations that built up over a delayed time released heat energy from the chemical energy of the fuel, resulting in net heat release.
Figure 10 demonstrates that both diesel and mixes of biodiesel exhibited identical trends in NHR. The maximal net heat production of the Simarouba blends was higher in contrast to diesel. Heat release was determined to be 64.6 J/oCA, 63.2 J/oCA, and 53.6 J/oCA for the SB-5, SB-10, and SB-20 blends, respectively.
Higher oxygen concentrations and correct blend mixing with air in the cylinder chamber are the causes of the biodiesel’s higher NHR. It is demonstrated that the SOC of all the blends started off marginally after diesel. This gave the droplets of biodiesel fuel and hot, pressurized, compressed air plenty of time to mix. So, compressed air effectively mixes with the blends.
Figure 11 compares the BTE of the various mixtures of Simarouba and diesel. A performance metric called BTE was utilized to quantify how effectively heat energy is converted into work energy. Comparing it with diesel’s, the BTE of the SB-5, SB-10, and SB-20 blends increased by 6%, 10.48%, and 6%, respectively. While the blends have a marginally greater viscosity and a lower energy content than standard fuel, the mixed effects of increased fuel injected pressure, delayed injection time, and elevated temperature of blends have an improved BTE.
The BSFC indication is used to determine how efficient any engine that consumes fuel and generates power is. Figure 12 illustrates a comparison of the BSFC for various mixtures of Simarouba and diesel. The energy contents of the biodiesel blends are somewhat lower than that of diesel. This demonstrates that when the engine is performing at its peak, in contrast to diesel, biodiesel uses less energy to generate the same amount of power. The SB5, SB10, and SB20 blends of biodiesel exhibit a reduction in BSFC of 6.45%, 10%, and 3.13 percent, respectively, in contrast to diesel.
In this research, mixes of biodiesel were preheated to examine their performance and emissions. The findings of this experimental study will be helpful for exploring the use of Simarouba biodiesel in diesel engines under chilly weather circumstances.

5. Conclusions

The two-stage transesterification of Simarouba yields Simarouba biodiesel, which is then mixed with diesel in amounts of 5%, 10%, and 20% to prepare the SB-5, SB-10, and SB-20 blends. An engine using blends or mixtures of Simarouba biodiesel is possibly incapable of operating under the same conditions as that of diesel engines. So, it is crucial to ascertain the optimal conditions for operating an engine powered by biodiesel blends. The data from these experiments with biodiesel blends were subjected to Taguchi-Grey Relational Analysis (TGRA). According to the findings, the ideal combination of injection pressure, timing, and fuel temperature enhances the atomization, vaporization, and appropriate mixing of blends and promotes better combustion. According to the TGRA, the A3B1C3 combination—IP of 600 bar, IT of 21° bTDC, and FPT of 40 °C—is the best combination for making use of various mixes of Simarouba biodiesel as an engine fuel to achieve enhanced performance and lower emissions. The findings of combustion analysis show that Simarouba blends have a slightly greater cylinder pressure than pure diesel and show better net heat release (NHR) than diesel. Additionally, compared to diesel, the thermal efficiency is confirmed to be is greater. Therefore, Simarouba biodiesel can be further investigated under cold start situations and is a prospective diesel substitute.

Author Contributions

Conceptualization, B.S.N., A.A. and G.V.N.P.; methodology and investigation, B.S.N. and G.V.N.P.; resources, N.A. and K.B.V.; writing—original draft preparation, B.S.N.; writing—review and editing, G.V.N.P., N.A. and K.B.V. All authors have read and agreed to the published version of the manuscript.

Funding

The research received no external funding.

Institutional Review Board Statement

Not Applicable.

Informed Consent Statement

Not Applicable.

Data Availability Statement

Data are unavailable due to privacy.

Conflicts of Interest

The authors declare no conflicts of interest.

References

  1. Perez, T.C. A Mini-Review of the Environmental Footprint of Lithium-Ion Batteries for Electric Vehicles. J. Comput. Mech. Manag. 2023, 2, 43–52. [Google Scholar] [CrossRef]
  2. Research and Development Report on Tree Born Oilseeds, National Oilseeds and Vegetable Oils Development Board; Government of India: New Delhi, India, 2009.
  3. Naik, N.; Kowshik, S.; Bhat, R.; Bawa, M. Failure analysis of governor in diesel engine using Shainin System™. Eng. Fail. Anal. 2019, 101, 456–463. [Google Scholar] [CrossRef]
  4. Jadhav, S.D.; Tandale, M.S. Multi-objective performance optimization of compression ignition engine operated on mangifera indica biodiesel by applying taguchi grey relational analysis. Waste Biomass Valorization 2016, 7, 1309–1325. [Google Scholar] [CrossRef]
  5. Pohit, G.; Misra, D. Optimization of performance and emission characteristics of diesel engine with biodiesel using grey-taguchi method. J. Eng. 2013, 2013, 915357. [Google Scholar] [CrossRef]
  6. Rao, N.D.; Sudheer Prem Kumar, B.; Srinath, C.; Patil, C. Optimization of engine operating parameters. Int. J. Mech. Eng. Technol. (IJMET) 2014, 5, 1–7. [Google Scholar]
  7. Geetha, N.K.; Sekar, P. Optimization of operating parameters on a diesel engine using grey relational analysis. Int. Res. J. Eng. Technol. (IRJET) 2017, 4, 701–707. [Google Scholar]
  8. Hussain, M.; Peethambaran, K.M.; Ushakumari, E.R. Performance optimization of diesel engine with chicken waste bio-diesel blend using grey relational analysis. Int. J. Eng. Res. Dev. 2014, 10, 9–15. [Google Scholar]
  9. Karthikayan, S.; Sankaranarayanan, G. Optimisation of engine performance variables using taguchi and grey relational analysis. Natl. J. Adv. Build. Sci. Mech. 2013, 4, 11–19. [Google Scholar]
  10. Ganesan, S.; Kumar, J.S.; Hemanandh, J. Optimisation of CI engine parameter using blends of biodiesel by the Taguchi method. Int. J. Ambient. Energy 2008, 41, 205–208. [Google Scholar] [CrossRef]
  11. Avinash, K.B.A. Gowreesh, Optimization of diesel engine parameters with blend of pongamia biodiesel and diesel using taguchi method. Int. J. Appl. Eng. Res. Dev. (IJAERD) 2015, 5, 13–20. [Google Scholar]
  12. Nayee, N.R.; Patel, T.M.; Patel, P.R.; Rathod, G.P. Parametric optimization of single cylinder diesel engine for karanja biodiesel & diesel blend for specific fuel consumption using taguchi method. IOSR J. Mech. Civ. Eng. (IOSR-JMCE) 2017, 14, 41–46. [Google Scholar]
  13. Modi, M.A.; Patel, T.M.; Rathod, G.P. Parametric optimization of single cylinder diesel engine for palm seed oil & diesel blend for brake thermal efficiency using taguchi method. IOSR J. Eng. (IOSRJEN) 2014, 4, 49–54. [Google Scholar]
  14. Sivaramakrishnan, K.; Ravikumar, P. Performance optimization of karanja biodiesel engine using taguchi approach and multiple regressions. ARPN J. Eng. Appl. Sci. 2012, 7, 506–516. [Google Scholar]
  15. Kökkülünk, G.; Parlak, A.; Bağci, E.; Aydin, Z. Application of taguchi methods for the optimization of factors affecting engine performance and emission of exhaust gas recirculation in steam-injected diesel engines. Acta Polytech. Hung. 2014, 11, 95–107. [Google Scholar]
  16. Kumar, S.; Navaneetha Krishnan, P.; Senthil Kumar, T.; Kumaragurubaran, B. Performance optimization of diesel engine with watermelon seed oil blend using taguchi-grey relational analysis. Int. J. Eng. Sci. Comput. 2016, 6, 5231–5234. [Google Scholar]
  17. Shailaja, M.; Sitarama Raju, A.V. Optimization of diesel engine parameters for performance, combustion and emission parameters using taguchi and grey relational analysis. Glob. J. Res. Eng. A Mech. Mech. Eng. 2016, 16, 37–50. [Google Scholar]
  18. Joshi, D.H.; Patel, T.M. Parametric optimization of single cylinder diesel engine for pyrolysis oil & diesel blend for mechanical efficiency using taguchi method. Int. J. Eng. Res. Technol. (IJERT) 2012, 1, 1–6. [Google Scholar]
  19. Kumar, R.S.; Sureshkumar, K. Data set of multi-objective optimization of diesel engine parameters. Data Brief 2019, 25, 104184. [Google Scholar] [CrossRef] [PubMed]
  20. Sukhdeve, V.; Ganguly, S.K. Utility of taguchi based grey relational analysis to optimize any process or system. Int. J. Adv. Eng. Res. Stud. 2015, 4, 242–250. [Google Scholar]
  21. Tandale, M.S.; Garjepatil, G.V.; Jadhav, S.D. Optimization of performance & emission characteristics of compressed ignition engine operated on mahua biodiesel using taguchi and multiple regression analysis. In Proceedings of the World Congress on Engineering, London, UK, 29 June–1 July 2016; Volume II. [Google Scholar]
  22. Karnwal, A.; Hasan, M.M.; Kumar, N.; Siddiquee, A.N.; Khan, Z.A. Multi-response optimization of diesel engine performance parameters using thumba biodiesel-diesel blends by applying the taguchi method and grey relational analysis. Int. J. Automot. Technol. 2011, 12, 599–610. [Google Scholar] [CrossRef]
Figure 1. Setup of CRDI Engine.
Engproc 59 00140 g001
Figure 2. Emission analyzer.
Engproc 59 00140 g002
Figure 3. SB5 blend: GRG variation.
Engproc 59 00140 g003
Figure 4. SB5 blend: S/N variation.
Engproc 59 00140 g004
Figure 5. SB10 blend: GRG variation.
Engproc 59 00140 g005
Figure 6. SB10 blend: S/N variation.
Engproc 59 00140 g006
Figure 7. SB20 blend: GRG variation.
Engproc 59 00140 g007
Figure 8. SB20 blend: S/N variation.
Engproc 59 00140 g008
Figure 9. Pressure variation in cylinder.
Engproc 59 00140 g009
Figure 10. NHR of biodiesel.
Engproc 59 00140 g010
Figure 11. Biodiesel blends: BTE.
Engproc 59 00140 g011
Figure 12. Biodiesel blends: BSFC.
Engproc 59 00140 g012
Table 1. Taguchi’s design.
TrialsIP (A)IT (B)FPT (C)
1.4002130
2.4002335
3.4002540
4.5002135
5.5002340
6.5002530
7.6002140
8.6002330
9.6002535
Table 2. Response weight factors.
ResponsesBTEBSFCCONOxUHCCO2
Weight factor0.250.250.10.20.10.1
Table 3. CRDI engine specifications.
PropertiesAl 6061
ProductCRDI VCR Engine
Type 1-cylinder 4-stroke Kirloskar make
Model244
CoolingWater cooled
Power3.5 kW
Compression ratio12:1 to 18:1
Standard IT23° bTDC
Bore87.5 mm
Capacity661 cc
Table 4. SB5 blend: GRC and GRG data.
RunBsfcBTECONOxUHCCO2GRGRank.
10.3330.3710.3331.0000.3330.9200.5356
20.3330.5080.4070.7120.4401.0000.5375
30.5000.6210.5360.4510.6470.5610.5454
40.5000.6770.5970.5810.5240.7420.5973
50.5000.7910.6830.4080.7330.5900.6052
60.3330.3330.6640.3920.5790.3540.4059
71.0001.0000.7380.4680.8460.6220.8141
80.3330.3490.7750.4020.7330.3770.4408
90.5000.4111.0000.3331.0000.3330.5287
Table 5. SB10 blend: GRC and GRG values.
RunBsfcBTECONOxUHCCO2GRGRank.
10.3330.3330.3331.0000.3330.5290.4867
20.4000.3430.4730.6880.5381.0000.5256
30.4000.4700.5450.5180.4120.6590.4828
40.5000.5220.4700.7310.5000.6000.5594
50.5000.5380.8410.4850.7000.7710.5882
60.4000.4090.6470.3990.7780.4430.4699
71.0001.0001.0000.4350.5830.4740.7931
80.5000.4730.9140.4091.0000.4150.5585
90.6670.5090.9200.3331.0000.3330.5863
Table 6. SB20 blend: GRC and GRG data.
RunBsfcBTECONOxUHCCO2GRGRank.
10.4290.4110.4071.0000.3330.9260.5763
20.4290.4170.3730.6680.3850.7140.4927
30.4290.4260.3330.5320.4050.8060.4748
40.6000.4170.7830.6080.5561.0000.6102
50.6000.4980.4840.4460.4840.4100.5016
60.3330.3330.5620.4020.4840.3850.3909
71.0001.0000.8110.4750.7140.5560.8031
80.4290.4911.0000.4010.8820.3330.5324
90.4290.4580.8590.3331.0000.4720.521 5
Disclaimer/Publisher’s Note: The statements, opinions and data contained in all publications are solely those of the individual author(s) and contributor(s) and not of MDPI and/or the editor(s). MDPI and/or the editor(s) disclaim responsibility for any injury to people or property resulting from any ideas, methods, instructions or products referred to in the content.

