Article

A Mixed-Methods Approach for Evaluating the Influence of Residential Practices for Thermal Comfort on Electricity Consumption in Auroville, India

by
Kumar Biswajit Debnath
1,*,
Olufolahan Osunmuyiwa
2,
David P. Jenkins
3 and
Andrew D. Peacock
3
1
Hub for Biotechnology in the Built Environment (HBBE), School of Architecture, Planning & Landscape, Newcastle University, Newcastle Upon Tyne NE1 7RU, UK
2
Institute for Management of Innovation and Technology (IMIT), Chalmers University of Technology, 412 96 Gothenburg, Sweden
3
School of Energy, Geoscience, Infrastructure and Society (EGIS), Heriot-Watt University, Edinburgh EH14 4AS, UK
*
Author to whom correspondence should be addressed.
Electricity 2024, 5(1), 112-133; https://doi.org/10.3390/electricity5010007
Submission received: 7 December 2023 / Revised: 16 January 2024 / Accepted: 19 January 2024 / Published: 1 March 2024

Abstract

:
With rapid global economic growth and a rise in disposable household income, particularly within a progressively warming planet, the escalating demand for energy to achieve thermal comfort has become a salient concern in the Global South, notably in emerging economies like India. This burgeoning need for cooling solutions has not only underscored the vital role of energy consumption but has also accentuated the imperative of comprehending the ensuing implications for electricity policy and strategic planning, particularly within the ambit of the Global South. This study explored the nuanced landscape of active cooling within an intentional community, Auroville, in southern India, aiming to discern the factors underpinning household preferences and practices in the pursuit of thermal comfort. Employing a mixed-methods approach, this study contributed empirically and methodologically to the interdisciplinary discourse by analysing residential electricity consumption patterns and cooling practices within selected households in the specified community. The study unfolded in three methodological stages: firstly, an analysis of climatic data coupled with an environmental stress index (ESI) assessment; secondly, the monitoring of end-user electricity consumption followed by rigorous data analysis; and lastly, the utilisation of qualitative in-depth interviews and observational techniques. This study’s outcome yielded empirical insights into the unprecedented shifts in the ESI for Auroville since 2014. Furthermore, the study unravelled the intricate complexities inherent in occupant behaviour within residential structures, thereby offering valuable insights into the practices that shape householders’ cooling preferences. This research enriched the understanding of the dynamics of energy consumption in the pursuit of thermal comfort and contributes to the broader discourse on sustainable development and energy policy in the context of climate change.

1. Introduction

India, with a population of 1.42 billion in 2022 [1], became the most populated country globally in 2023 [2]. According to the World Economic Forum, India will become the third-largest consumer market driven by a rising, affluent middle class—168 million upper-middle (44% of total households) and 132 million lower-middle (34% of total households)—by 2030 [3]. Furthermore, India has one of the highest cooling degree days (CDD) compared to the rest of the world [4]. Many of India’s major cities have an average annual CDD of over 3000 annually [5]. Furthermore, India’s megacities and inhabitants have suffered from elevated hours annually under dangerously high heat stress [6]. In 2017, there were 21.8 million Indian households (only 8% of the total) with air conditioners (A/Cs) [7]. The A/C ownership number was significantly lower than that of China (60%) and the USA (90%) [8]. However, demand for A/C was forecasted to grow substantially, with increasing temperatures due to climate change and household affluence. According to the International Energy Agency (IEA), India will have 240 million A/C units by 2030, reaching 1144 million by 2050 [8].
In 2019–2020, the residential and commercial sectors accounted for 25% and 8% of India’s 1248.1 TWh total electricity demand (Figure 1). Indian residential electricity consumption increased from 80 TWh in 2000 [9] to 288 TWh in 2017 [10] and 308 TWh in 2019–2020. With rising economic growth, higher income levels, and a projected construction of 20 billion m2 of new buildings by 2030 [9], a significant increase in energy demand and consumption at the household level is expected. India’s government has already recognised the state- and national-level necessity of cooling as a priority by adopting the India Cooling Action Plan (ICAP) 2019. Room A/C would dominate the building sector’s cooling energy consumption, with 50% of the 600 TWh by 2037–2038, according to ICAP [11]. Also, around 40% of the cooling demand would be met with non-refrigerant-based cooling from fans and air coolers by 2037–2038 [11]. ICAP set several ambitious goals, such as reducing refrigerant demand across sectors by 20–25% by 2037–2038 [11]. There had been a successful standard and labelling policy implementation by the Bureau of Energy Efficiency (BEE) to improve room A/C efficiencies by 35% between 2006 and 2016 (3% annually) [12]. Despite the A/C improvement targets, there might be an inevitable increase in cooling demand and associated electricity consumption due to the unprecedented effects of climate change.
Traditional approaches in evaluating thermal comfort relied on the relationship between outdoor environmental conditions and widely used predictors of comfort, such as the predicted mean vote [13]. These approaches should have paid more attention to the potential impact of environmental stress on household cooling preferences and thermal comfort thresholds by exclusively relying on mean votes. Also, most studies focus on quantitative or qualitative data and methods to evaluate thermal comfort. However, state-of-the-art research studies suggested using a combination of qualitative and quantitative data, which may improve evaluations in different fields, such as healthcare, biology, decision support, social science, urban planning, quality control and others, by supporting limitations of one type of datum with the strengths of another. Several studies used a mixed-methods approach, integrating quantitative and qualitative data collection to evaluate indoor thermal comfort and associated parameters comprehensively. Tweed et al. examined the thermal comfort practices and energy consumption with mixed methods in different dwellings in South Wales, UK [13]. Another study aimed at the inhabitants of vernacular houses in Alentejo, Portugal, used environmental monitoring—outdoor and indoor air temperature, relative humidity, globe and surface temperature, and air velocity—and occupant survey for evaluating thermal comfort [14]. Milando et al. adopted a mixed-method approach to monitoring (temperature, location, sleep, and physical activity data with low-cost sensors) and interviewed urban residents in the Boston area, Massachusetts, US. They examined personal heat exposure, sleep, physical activity, and heat adaptation strategies to evaluate heat adaptation interventions tailored to their challenges [15]. In the context of a university campus, Eslamirad et al. used mixed methods to explore improving the quality of cities by considering the relationship between microclimatic conditions, thermal sensation, and human preferences [16]. Eon et al. used a mixed-method approach to study daily practices—the routines, household configuration, technology, and varied occupant motivations—impacting ambient heating and cooling practices in ten Australian houses [17]. In the case of India, very few studies adopted the mixed-method approach. Sharmin et al. used a mixed-method socio-technical approach, which presents an in-depth qualitative assessment of the architectural design and homeowners’ use of and satisfaction with domestic spaces for a marginalised low-income community in Ahmedabad, India [18]. Therefore, most studies were aimed at megacities or major cities.
Figure 1. (AC) Sector-wise electricity demand in India in 1960–61, 2010–11, and 2019–20; (D) Sector-wise electricity demand in India from 2000–01 to 2019–20; data source [19,20].
Electricity 05 00007 g001
An observed trend in the attempt to promote electricity demand management strategies in India was that scholars and policymakers alike have often tilted towards the use of technical data or policy models—as evident in the India Energy Security Scenario 2047 (IESS, 2047) [7] and ICAP [11]—which aimed to promote technological substitution assuming bounded rationality. Technical data or a policy model approach informed many empirical studies in India, focused on long-term building energy demand modelling using the Global Change Assessment Model (GCAM) [21,22,23]. Despite the projected savings by models like GCAM, they remained limited as they were highly techno-centric and did not consider the impact of household energy behaviour in determining projected energy savings. Successfully managing electricity demand at the household level required understanding the prime factors that drove household consumption behaviour. Also, cooling preferences were cognitively embedded in and subject to multiple configurations of material, cultural and social processes that determine the ideas surrounding the notion of the “good life” [24,25]. Thus, merely estimating buildings as technological sites persistently ignored that buildings were sites of social contestations, and individuals exhibited cognitive biases in decision-making, which produced behaviours that deviated from rational choices that models such as GCAM could not incorporate. For householders, convenience, comfort, or practicality would likely play a critical role in electricity-related decisions. Therefore, research focusing solely on energy efficiency models or neo-classical incentives would probably ignore broader non-economic factors underlying electricity consumption behaviours. When attempting to address future patterns of behaviour and understanding a more contemporary “baseline”, the importance of including this level of understanding was more profound.
To address this knowledge gap, research within environmental sociology and energy studies increasingly deployed practice theory to understand energy consumption behaviours. According to practice theory, the individual could not be separated from the social milieu in which they operated as they were poised to learn and make choices based on their views of this social world [26]. Understanding the social world was reflected in people’s everyday actions and the longstanding practice structures that mediate and govern these actions. Practice structures were facilitated by and connected to material assemblages (technologies and actants), motivational and emotional elements (social values, meanings, and norms) and competencies (know-how) [25,27,28], which overlapped to guide bundles of practices that influence everyday behaviours. For instance, energy provision and its use were realised through complex technological artefacts co-constituted to accomplish social practices—examples may include cooling, watching TV and cooking [28,29,30]. Within this frame, the energy consumed was not the practice; it was the energy-related activities guided by practical and social understandings of knowing what, how, when, and where to consume energy that symbolised the accomplishment of the practice [28]. Thus, energy-related consumption practices were socially constructed and materially, technologically, emotively, and cognitively scripted.
In this study, while we did not discount the macroeconomic insights, large-scale technical data or single-case methodologies could provide thermal comforts; we believed such technical models must be linked with the qualitative exploration of household practices to understand patterns of change at the micro-level. Similarly, by taking this approach, we could investigate whether environmental stress/climate data would be visible and understood at the micro-level through energy data and householder feedback. Thus, this study combined quantitative data, such as household-level consumption data, with qualitative insight from practice theory to understand how technological materiality, know-how, and competencies shape household electricity consumption and cooling behaviours in a southern Indian intentional community, Auroville. This article addressed several questions: (1) Did climate change impact cooling preferences in Auroville? (2) if yes, what could household-level electricity consumption data convey about cooling preferences and behaviours in an Indian community (Auroville) under the evolving climate? (3) What other factors influenced observed cooling practices and behaviours outside climate change?
A considerable part of India had a warm-humid climate [31], often characterised by hot and humid summers and mild winters, leading to cooling-dominated energy demand. Therefore, for empirical illustration, the study was focused on electricity and cooling appliance consumption in selected Auroville households. The case study’s size and nature were not intended to generalise behaviour and practices across India (whether for cooling or other energy practices). Instead, the case study was used to demonstrate a mixed methods approach, where measured energy data combined with a knowledge of practices at the household level can enhance the understanding of potential cooling behaviour drivers. The study was the initial step in investigating the effect of different demand reduction scenarios.

2. Methodology

Auroville in southern India—with a population of 2667 residents from different parts of the world [32]—was selected for the study because it was an intentional eco-friendly community; the residents had shown greater assimilation of low-energy behaviours and lifestyles [33,34,35,36,37,38]. Furthermore, we wanted to understand the value and operation of low-carbon technology. Choosing a site with some of these technologies in a community already attempting to reach a low-carbon goal helped us understand potential actions and directions in the coming decades.

2.1. Environmental Stress Index (ESI) Analysis

Hourly weather data series of Auroville for 30 years (1989–2019) were obtained from the Meteoblue database [39] to investigate the climate. In addition to studying trends in individual climatic variables to investigate climate evolution over the last three decades, we used the data to estimate the Environmental Stress Index (ESI). ESI might be a more helpful parameter for discussing the intensification of cooling requirements as it represents a combined assessment involving ambient temperature ( T a ), relative humidity ( R H ) and solar radiation ( S R ). The methodology of ESI is described in [40], and the equation is as follows:
E S I = 0.63 T a 0.03 R H + 0.002 S R + 0.0054 T a × R H 0.073   ( 0.1 + S R ) 1
where T a is the ambient temperature (°C), R H the relative humidity (%), and S R the solar radiation (Wm−2); the output unit for ESI is °C. There were a significant number of studies that used ESI to analyse the climate in [41,42,43,44,45] along with different methods such as wet bulb globe temperature (WBGT) index, Temperature–humidity index (THI) and Heat index (HI).

2.2. Case Study Details

Among the residents contacted in different parts of Auroville, 30 households from three buildings agreed to participate in the demand monitoring study. The buildings with case study households were in the north of Matrimandir—a large golden sphere in the centre of Auroville that symbolises a new consciousness [46]—in Tamil Nadu, India. Two apartment buildings (Citadines and Inspiration) were selected as case studies (Figure 2), where we monitored 21 and 9 flats in Citadines and Inspiration, respectively. Of these 30 flats, ten participated in the qualitative exercise. Of these ten dwellings, we focused on two households as sample cases.
Most monitored Citadines occupants lived alone and had housekeepers who worked weekly for about 4–8 h. Most dwellings had single-phase meters for monitoring electricity consumption. The occupants used electric fans for mechanical ventilation (in 100% of dwellings) and room A/Cs for space cooling (9.1%) for thermal comfort. There were also some other appliances used in households for lighting (Incandescent, Compact fluorescent lamps, Light-emitting diode and T5 with Electronic Ballast), entertainment and IT (laptops, personal computers, televisions, router, modem, monitor, speakers, hard disk, set-top-box and music system), cooking and food-related (refrigerator, electric stove, mixer, blender, oven, coffee machine, kettle and toaster), and others (Vacuum cleaner, Iron, mixtape and hairdryer).
In Inspiration, ten occupants lived in the selected nine dwellings, where the household size and working destinations were like those of residents of Citadines. The dwellings have three-phase meters for monitoring electricity consumption. The difference between the occupants in Inspiration and Citadines was in the usage of types of appliances. In the case of Heating, Ventilation, and Air Conditioning (HVAC), households used electric fans for mechanical ventilation (100%) and room A/Cs for space cooling (11.1%) to attain thermal comfort. In the case of refrigerators, eight dwellings had one, and one household had two. Inspiration’s other appliances were like those of households in Citadines, except 88.9% of households use geysers for hot water in the bathrooms.
Regarding the building’s construction and materials, it was a beam-column structure constructed with reinforced concrete. The floor and roof slabs were also built with reinforced concrete. The buildings’ exterior walls were 10-inch brick masonry with cement plaster on the exterior and interior. The internal walls comprised 5-inch brick walls with cement plaster on both sides. In the case of windows, single-glazed panels with steel frames were used in the buildings.

2.3. Data Collection

The study collected data using three methodological approaches: (i) end-user metering and electricity consumption monitoring; (ii) the use of qualitative/ethnographic methods that included interviews and observations by the interviewer; and (iii) the measurement of Auroville’s Environmental Stress Index (ESI). This study combined consumption data with ethnographic insights from monitored households. These separate data streams were combined to cross-evaluate the interviewee’s self-reported consumption behaviours and understand the subjective realities underpinning the householders’ practice.

2.3.1. End-User Metering and Electricity Consumption Monitoring

The households had a conventional single or a three-phase meter for measuring their electricity consumption. The electricity meter usually showed the household’s Alternating Current (AC) static energy (Wh) consumption, and an external LED blinked each time a certain amount of energy was consumed. The single-phase meters comprised 16,000 blinks/kWh specification, i.e., 0.06 Wh/blink. In three-phase meters, the blink resolution was 800 blinks/kWh (1.25 Wh/blink). Temporally precise electricity consumption was monitored in each selected dwelling using blink meters mounted on the LED lights. The monitored data were sent to the cloud using the cellular network.

2.3.2. The Ethnographic Approach through Interviews and Observations

Both deductive and inductive approaches guided the qualitative aspect of this study. Using a deductive approach, we tested the applicability of the study’s theoretical framework (practice theory) in the case context. Practice theory, according to [26,48], was mainly hinged on three elements: material assemblages (technologies and actants), motivational and emotional elements (social values, meanings, and norms) and competencies (know-how). These three elements guided the development of the research questions and the interview guide. Ten households were selected for interviews—based on their willingness to participate in in-person face-to-face interviews—from the two communities (Inspiration and Citadines) where electricity consumption data were being monitored.
All ten interviewees lived in semi-passive apartments, and three had air conditioning units. Most of the occupant interviews were conducted in participants’ apartments, which allowed the interviewer to devote substantial time to observing how interviewees interacted with certain appliances (cooling technologies). The interviews were conducted over two weeks in September 2019 using semi-structured guides as the inquest’s primary form. Questions about everyday responsibilities were posed to understand factors underscoring participants’ performances of activities relating to electricity. Participants were also asked to discuss their appliance use patterns, general electricity experiences, understanding of thermal comfort, efficiency behaviour, and socio-economic factors. They were also asked to chronicle their daily activities on an hourly basis. Interview sessions with respondents were between 40–80 min. Audio recordings of interviews were made, which were subsequently transcribed, analysed and coded using NVivo (NVivo Release 1.0, also called NVivo 20) software. The coding followed an iterative process drawing on the study’s theoretical framework. The data underwent several iterations to examine the possible lack of fit with the theory. After this theory-driven coding, the second round of analysis ensued to understand the observed patterns in the interviews, which was the inductive process. The process began with watching the deductive analysis and demand data findings. Looking at both data sets, we matched people’s narratives of their daily routines and practices with the demand data to identify and confirm use patterns. The cross-checking was performed to evaluate the data’s explanatory strength and, more specifically, to examine to what extent the interview data supports or contradicts the demand data. The iterative process allowed us to understand the similarities and differences between the two cases discussed below.

2.3.3. Limitation

During the trial period, data collection was subject to several limitations. There were persistent outages in the monitored buildings due to insufficient electricity generation, a common incident in Auroville. The cellular network was also subject to periodic interruptions due to maintenance and local data package providers, causing an interruption during the data collection. Another major constraint was people’s human-related issue of disconnecting the cellular network power line for the blink meter without knowing. The details about the limitations and a data-filling methodology to circumvent the data gaps can be found in [49]. The study aimed to understand the occupancy practice to attain thermal comfort, so the unprocessed demand profiles were used. The weeks with the least data gaps were selected for the study’s analysis to minimise the missing data issue.

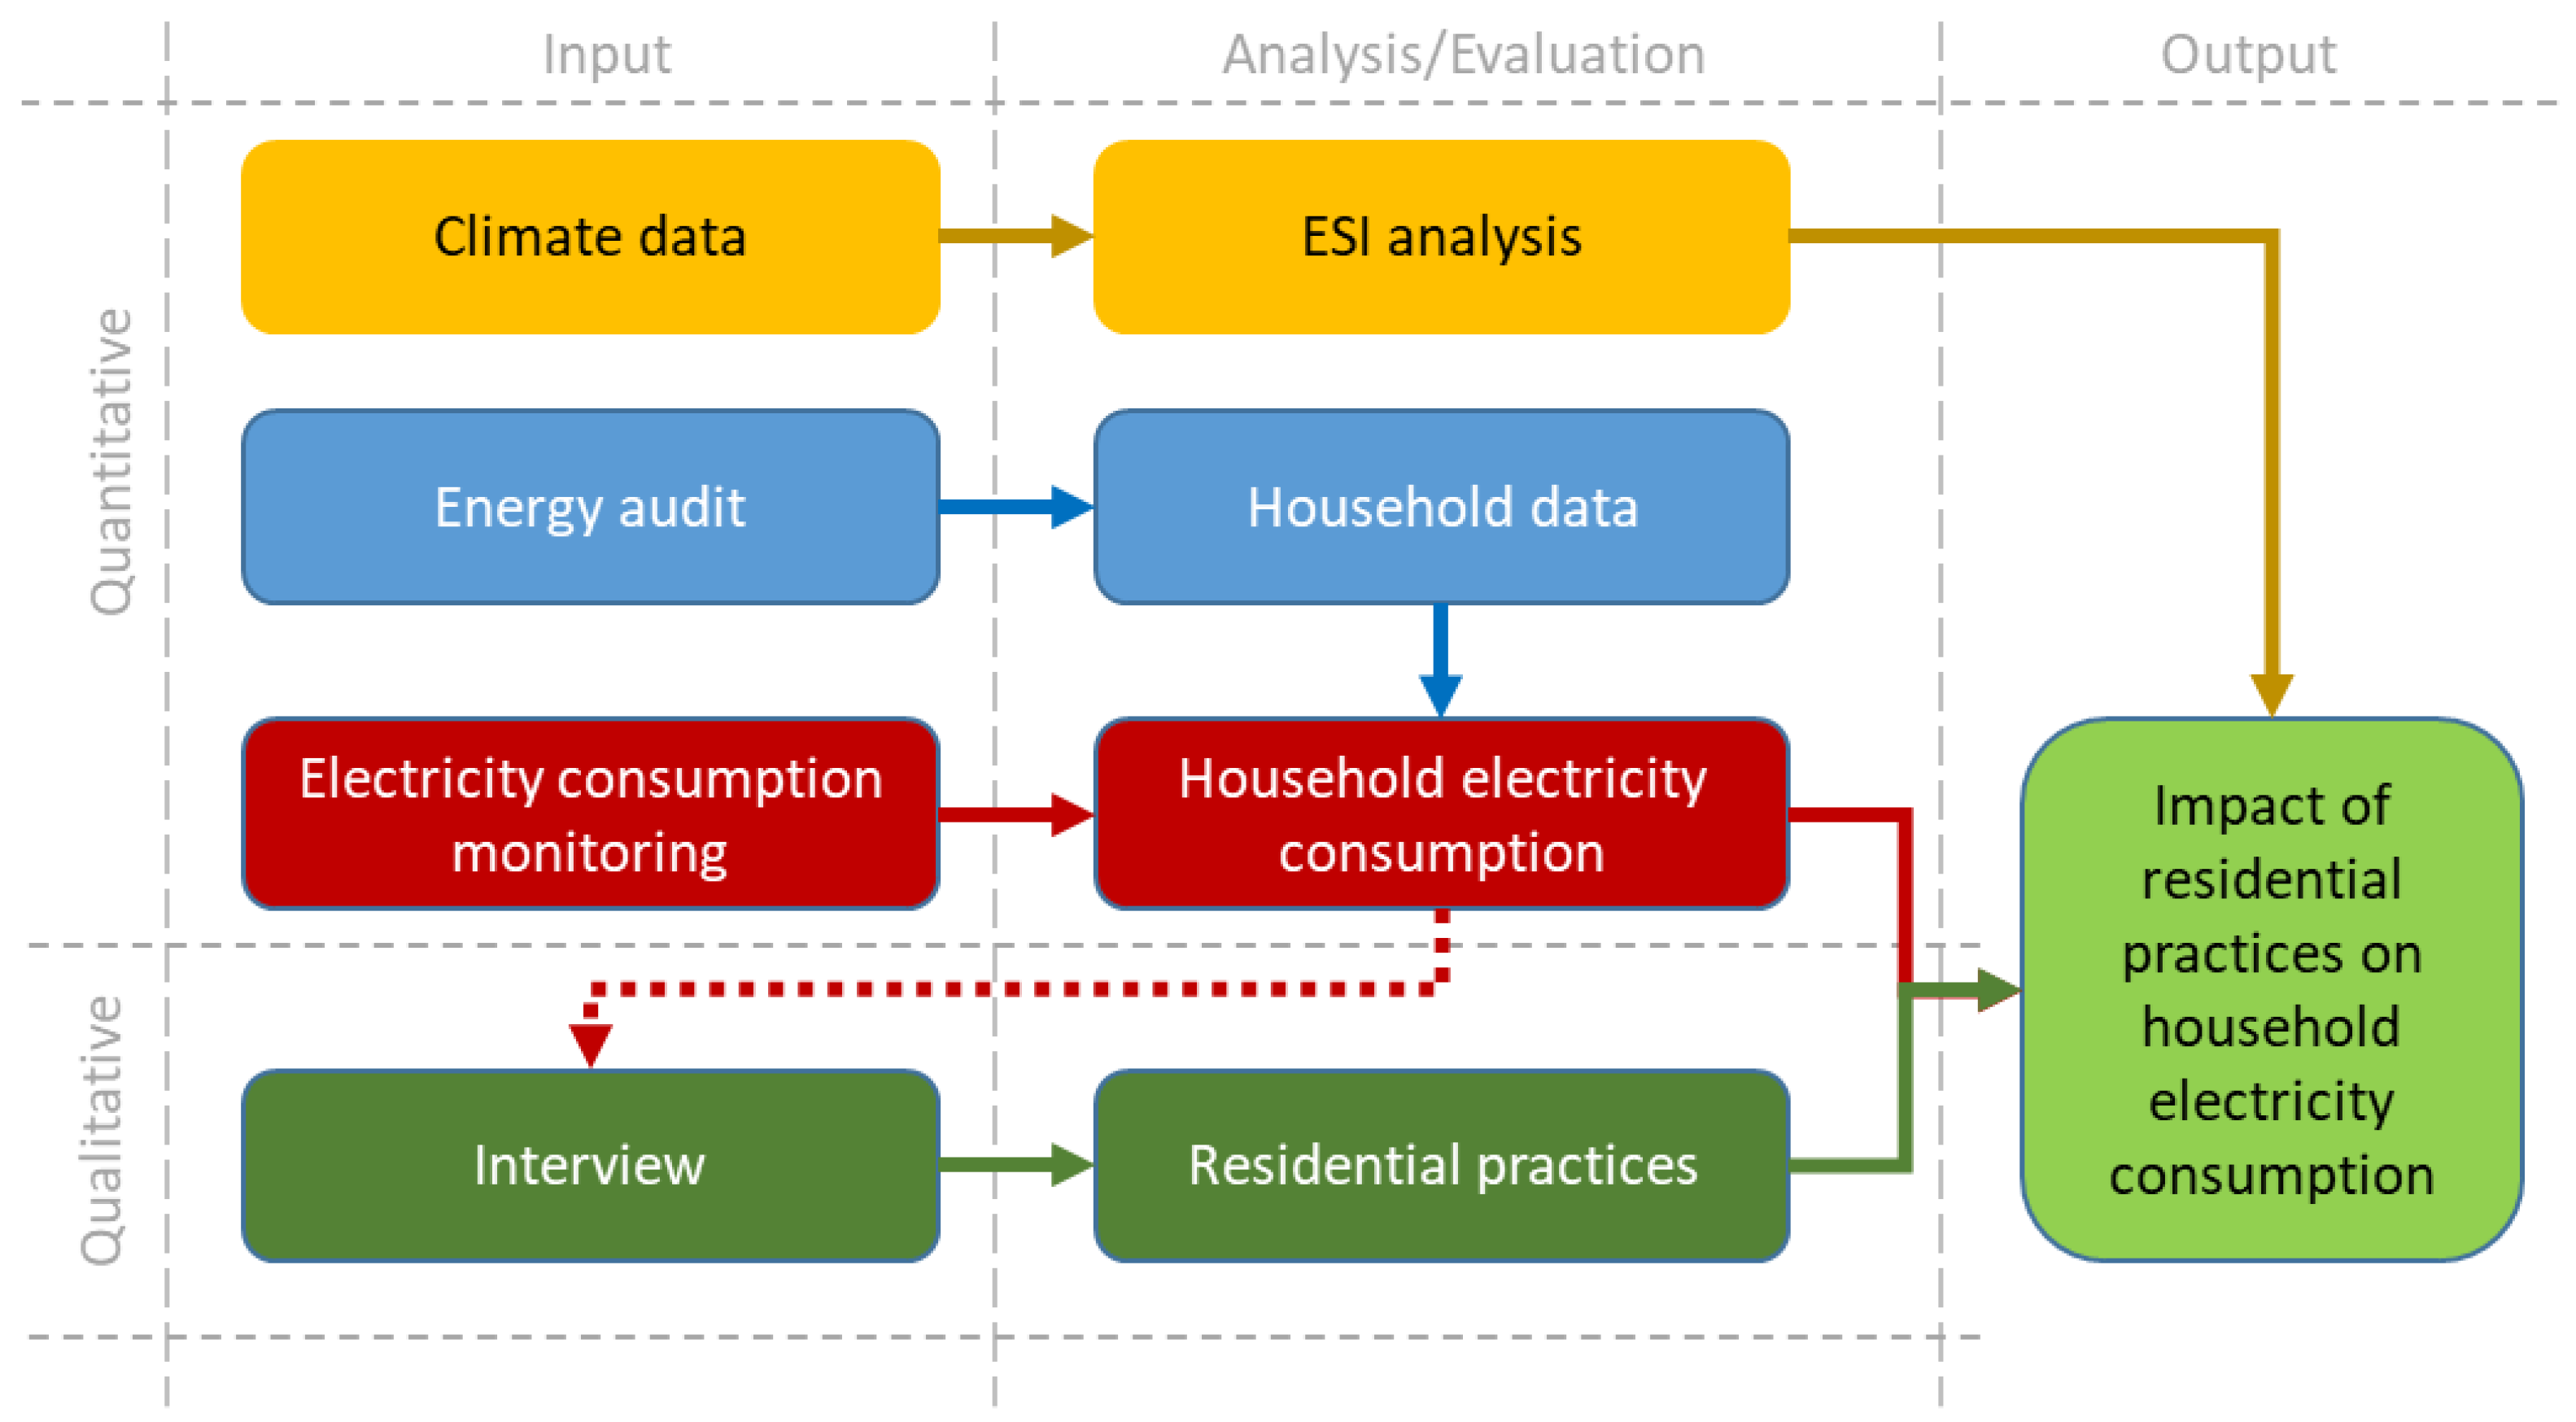
2.4. Mixed Method Approach

The study’s overall methodology (Figure 3) collected quantitative and qualitative data from the same selected households. The climate data (hourly data of 30 years) were used for the Environmental Stress Index (ESI) analysis to examine the change in heat-related stress in Auroville. An energy audit was conducted before starting data collection in the selected households. The energy audit collected detailed quantitative data on household appliances, HVAC, and lighting, such as the room area used, number, power consumption, and hours used for the appliance. A cross-evaluation exercise was conducted through an inductive process while analysing the monitored data. The energy audits conducted in each household were compared with appliances that participants self-reported during the interviews. The audit was also compared with what the interviewer observed during the interviews. A cross-evaluation was performed to compare the electricity consumption with the household’s energy audit to identify how much electricity each appliance consumed, as some appliances consume the same amount of energy, which could be misleading just by looking at the data. The process allowed us to identify two cases where appliances were misreported during the energy audit. Due to the relatively low number of appliances and clear visibility of cooling appliances, the study methodology was satisfactory in that one could identify when cooling appliances were being used (in a way that might be more difficult for a demand profile with a more diverse use of a more significant number of appliances).
Thus, a significant contribution would be to combine qualitative and quantitative data to understand electricity consumption and practice. Specifically, we applied deductive and inductive approaches through the combined methodology to identify errors and cross-check data findings. Furthermore, while most similar mixed-method studies are typically sequential, a concurrent approach was undertaken in this study. The quantitative electricity consumption data were collected and analysed for eight months. Concurrently, a qualitative exercise was conducted using a theory-driven deductive approach to understand general household electricity consumption and cooling practices. Themes generated deductively were further subjected to an inductive analysis influenced by the results from the demand data. Based on both analytical steps, the study could generate behavioural insights surrounding household cooling preferences and practices in the case study community.

3. Results and Discussion

3.1. Climate Change and Heat Stress in Auroville

In Auroville, the climate data demonstrated high temperatures, humidity, and solar radiation throughout the year. The climate analysis (Figure 4) showed daily average temperature, relative humidity, and total solar radiation in Auroville in 1989, 1999, 2009 and 2019. According to the Indian Meteorological Department (IMD), a heatwave should be declared in a coastal area such as Auroville when the maximum temperature is at or above 40 °C [50]. The maximum recorded temperature in Auroville crossed 40 °C for ten days (21 h) during the summer of 2019 (Figure 4). The analysis of temperature changes in 1989–2019 showed that the heatwave threshold was regularly exceeded over the last six years of the data series; 13 days (45 h), seven days (25 h), six days (11 h), 10 days (36 h) and one day (4 h) in 2014, 2015, 2016, 2017 and 2018, respectively. Before 2014, the heatwave threshold was never exceeded. Over 10% and 35% of the annual hours showed RH values at or above 90% and 80%, respectively (Figure 4). Regarding RH and solar radiation, the last 30 years’ evolution did not significantly increase, but there was evidence of elevated ambient temperature and attendant heat waves in Auroville since 2014.
ESI analysis of Auroville’s climate from 1989 to 2019 showed an increase in high ESI since 2014. There were two specific periods of high ESI visible (Figure 5): Summer or pre-monsoon (March–May) and autumn or post-monsoon (October and November) between 1989 and 2013. Also, there was comparatively lower ESI during the Monsoon (June–September) due to increased precipitation and winter (December–February). However, the ESI was found to increase after 2013, which included increased ESI levels during the Monsoon season. The ESI between 2014 and 2019 showed as high as around 35 °C during summer and a more widespread prevalence of ESI higher than 30 °C for three consecutive seasons (summer, monsoon, and autumn).

3.2. Electricity Consumption and Practices in Case Studies

Most of the monitored households showed a relatively low average annual electricity consumption—as compared to India’s average electricity consumption (1079 kWh/household) per electrified household in 2014 [51]—because of the low numbers of A/C and high-power consuming appliances such as hair dryers, electric kettles, and irons. Moreover, communal services (laundry and cooking) also reduce average electricity consumption per household. During early November 2018, nine households had more than 500 W of peak electricity consumption, of the 18 monitored households with single-phase meters (Figure 6A). Only one household (Home 1) among the nine households had an A/C and, therefore, the highest frequency of high electricity features (i.e., spikes in demand) in November. The other electricity consumption spikes in Figure 6A were from high electricity-consuming appliances in the other eight households. However, electricity consumption spikes after mid-December 2018 decreased significantly because the A/C usage in the ‘Home 1’ household was reduced due to lower air temperatures (Figure 6B). Figure 6A,B demonstrated some gaps in the data due to the limitations described in Section 2.3.3.
For detailed insights, the electricity profiles with high and low consumption patterns in a day (3 November) were separated from the 18 monitored households (Figure 7). The nine households with a high demand profile (Figure 7A) had varied types of electric appliances, such as A/C (Home 1), Iron (Home 1, 2), oven (Home 5, 10), mixer (Home 6), kettle (Home 8), hairdryer (Home 8) and toaster (Home 10). In Figure 7A, the household with A/C (Home 1) was dominated by high demand spikes, and the other high-consuming appliances from the other eight households had a minimal number of operations during the day. Figure 7B demonstrates households’ profiles with low-consuming appliances with similar consumption patterns, dominated mainly by refrigerators. The household energy audit cross-checked with the electricity demand profile showed fans used for thermal comfort. In contrast, only one household had A/C, which created distinctive differences in the electricity demand profile. As case studies for investigating the user behaviour for attaining thermal comfort, out of 18 households, we selected ‘Home 1’ (as the only household with A/C) and ‘Home 5’ (without A/C) for electricity consumption and behavioural analysis.
The average occupancy number in monitored households was 1.2, with most being single occupancy. The flats were also, on average, 47.6 m2, where the area ranged from 30–75 m2 (Table 1). Most of the apartments have an area of 50 m2. The selected households (‘Home 1’ and ‘Home 5’) for the study are single occupancy with a 50 m2 floor area. Also, in terms of appliance ownership for thermal comfort, all the flats had electric fans for mechanical ventilation, with a mean of 3.1 (Table 2 and Table 3). In the case of A/C ownership, only two flats had A/Cs. ‘Home 1’ was one of the two flats. Therefore, the study’s selection of ‘Home 1’ was evident. Furthermore, ‘Home 1’ and ‘Home 5’ had three electric fans. The study’s objective was to understand user behaviour for attaining thermal comfort; rather than looking into all the households with only electric fans to achieve thermal comfort, we selected ‘Home 5’ as a representative household without A/C.

3.2.1. Case Study: Home 1

  • Demand profile analysis
The ‘Home 1’ household had one of the highest frequencies of high electricity spikes among the combined profiles (Figure 6). The household had a bedroom, a living room, a bathroom, a kitchen, and a balcony for one person of 50 m2. The detailed analysis of appliances in the household showed five categories of appliances: lighting, HVAC, entertainment and IT, cooking and food-related, and others. The occupant used CFL and T5 with Electronic Ballast for lighting. The household had a 1000 W A/C unit in the bedroom for space cooling. Moreover, the bedroom had a 75 W ceiling fan for an increased air change rate. There was also a refrigerator (183 kWh/year from a Godrej Edge 100 litre), a television (78 W) and an Iron (1400 W) in the household.
In Figure 8A, the household showed three main periods with high electricity consumption: morning (07:00–11:15), afternoon (12:00–17:00) and night (19:00–01:00) during 3–4 November. However, on weekdays, the use of high-demand appliances increased at night. The households’ baseline electricity consumption was around 300 W (considering the peak demand when the refrigerator was operating, and no other appliances were operational), peaking at 1600–1700 W during periods of high demand. The electricity consumption profile and ownership of the household appliances analysis suggested that the increased consumption peaks might be caused by using A/C for space cooling to attain thermal comfort and an Iron for clothes. However, the frequency and periods of electricity use suggested that the three-star-rated A/C was the primary cause of high demand. This was also confirmed during the interview with this resident. Also, the demand profile during 22–28 December 2018 in Figure 8B showed only minimal use of A/C. During 22–28 December, the ambient temperature was 27.9 °C, 3 °C lower than 3–9 November 2018 when the A/C use was more pronounced. Simultaneously, the highest relative humidity value was 98% (during weekends), the lowest 84% (during weekdays), and, on average, 92%, which might have contributed to the truncated use of the A/C. There was only one high-demand spike in the weekend demand profile for a limited time, which might have been caused by using other appliances. If the high consumption were removed, the demand profile would resemble a household (e.g., Home 5) with only mechanical ventilation fans.
Two types of occupancy use patterns were observed in the ‘Home 1’ household for thermal comfort: (a) Electric fan only and (b) A/C with electric fan. During the warmer November, the space cooling was mainly conducted with a combination of A/C and electric fan. On 3–7th November, especially at night, the occupant might have used the A/C for some time and then used a fan to circulate the cooled air around the room to reduce the use of high electricity-intensive appliances (Figure 9A). The use of space cooling appliances in ‘Home 1’ was reduced in December (Figure 9B), probably due to lower temperature and humidity than in early November. In Figure 9B, an increase of under 100 W was observed at night (07:00 P.M.–02:00 A.M.), which may be caused by using an electric fan (75 W in the bedroom) for mechanical ventilation.
  • Householder account on observed electricity and cooling consumption patterns
A male in his mid-fifties occupied ‘Home 1’. He was the single occupant of the apartment. He had specific health requirements, and according to him, he used an A/C based on medical advice from his physician. His flexible job allowed him to work from home or return early to have lunch at home. According to the participant, his daily routine involved waking up around 6:30 in the morning. He reportedly turned on one light in the kitchen by 7:00 (if there was enough natural light), then turned it off. The participant started his daily activities by switching on his fan before and during breakfast, and sometimes, when it was hot, the A/C was used. The TV was turned on for about an hour in the morning while the computer was in use. The participant left the apartment around 10:00, or sometimes 11:00, and returned home for lunch in the afternoon. During lunch, he switched on the AC, fan, and his computer until about 17:00. He left the house at 17:00 and returned home around 20:00, switching on a few lights, the TV, and fan, and when it was reportedly “too hot,” he alternated between his A/C and fan. Probed further on why he operates his A/C and fans together, the participant reported that he was trying to conserve energy by first cooling the room with the A/C and circulating the air with his fan.
“I turn on the AC more, maybe for two hours, I run it, and then I shut it down, and I have the fan going after that until the morning.”
The above description matched the demand profile analysis observed in ‘Home 1’. During the warmer month of November, space cooling was mainly conducted with a combination of A/C and electric fan. On November 3–7, especially at night, the occupant might have used the A/C for some time and then used a fan to circulate the cooled air around the room to reduce electricity consumption (Figure 9A). The use of space cooling appliances in ‘Home 1’ was reduced in December (Figure 9B), probably due to lower temperature and humidity than in early November. There was a rise of approximately 100 W at night (19:00–02:00), which might be the electric fan’s use (75 W in the bedroom) for mechanical ventilation. According to the participant, he used an electric fan on cooler days. He further attributed his purchase and frequent use of A/C to his health conditions. In summary, the electricity and cooling consumption practices of the occupant were reportedly shaped by the following:
  • Technological choice: a belief that purchasing energy-efficient technology allowed the participant to run his A/C for as long as he wanted;
  • Know-how on A/C use: the participant developed an alternating system between his A/C and fanned to maintain comfort at home. The system allowed him to maintain a sense of energy conservation while still using his A/C when ‘needed’;
  • Physiological and passionate attachment to A/C: the participant connected his use of A/C to his health and placed a high emotional attachment to his ability to attain comfort using the system;
  • Changes in electricity system: The participant justified his frequent use of A/C because his community-generated electricity is from renewable sources, reducing his environmental footprint.

3.2.2. Case study: Home 5

  • Demand profile analysis
Although the ‘Home 5’ household did not have any A/C, it does have an oven (1300 W), a refrigerator (250 kWh/year), a laptop (120 W), a speaker (70 W), a hard disk (18 W), and a mix table for music. Figure 10 showed that the occupant did not use any appliances with a power consumption of over 300 W during the demonstrated week. The base demand appeared to exhibit a typical refrigerator profile. The household had a total floor area of 50 m2 and was single occupancy. The flat had a bedroom, living room, bathroom, kitchen, and balcony. The detailed analysis of appliances in the household showed five categories of appliances: lighting, HVAC, entertainment and IT, cooking and food-related, and others. CFL, T5 with Electronic Ballast and LED were used for lighting. The household had two 75 W ceiling fans in the bedroom and living space, providing mechanical ventilation to attain thermal comfort. Moreover, a 25 W extract fan was in the kitchen to exhaust warm air.
During 3–4 November in Figure 11A, household electricity consumption in ‘Home 5’ was only found to be higher than the baseline value of 260 W (determined by refrigerator operation only) between 18:00 and 21:00. However, during the weekdays, the use of high-consuming appliances was found to increase in the morning (04:00–06:00), midday (11:00–13:00) and evening (17:00–21:00). The housekeeper worked about 4 h weekly. According to Figure 11, the morning and night-time demand was from the householder, and the midday electricity consumption might occur while the housekeeper was in the dwelling carrying out housework. Electrical demand during these periods averaged 500 W, significantly higher than the baseline. Cross-checking the electricity consumption pattern with household appliance ownership suggested that the increased demand appliances, such as the oven, were not used during the week of 3–9 November. The frequency and periods of higher than baseline electricity consumption suggested that the three electric fans were the primary cause of increased demand. At night, after 09:00 P.M., the consumption reduced to less than 300 W, made up of a fan in the bedroom combined with typical refrigerator demand. The demand profile from 22–28 December 2018 in Figure 11B showed a similar electrical demand level. The timing of the high-demand period changed to include midday and evening. This period might coincide with the Christmas break and the increased household occupancy.
  • Householders account for observed electricity and cooling consumption patterns
A single male in his late thirties occupied ‘Home 5’. His flexible but spontaneous job made his energy-related practices dependent on his (job) schedule. Sometimes, he worked after 21:00 and returned in the early morning hours. The routine matched some of his electricity consumption profiles (Figure 11), which shows that electricity was used in the morning (04:00–06:00) and at night (17:00–21:00). According to the participant, the apartment was not designed to allow him to achieve or maintain adequate thermal comfort by using cross ventilation.
The apartment was built by splitting a larger apartment into two; therefore, ventilation needed to be adequately designed, with the participant often opening his front door to ventilate his living room. However, this ventilation method increased his risk of an influx of mosquitoes in the apartment. Therefore, the participants relied more on the use of fans to attain thermal comfort. The participant owned two ceiling fans, always on throughout the year except in January and February. He kept the fan in the living room on throughout the day. At night, he turned on both his living room and bedroom fans. Typically, the fan in the living room was left to operate at a lower speed throughout the night, with the windows open for fresh air. While the bedroom windows were also available, and the fan was switched on to operate at a higher speed. The occupant believed the entire flat would remain hot if these measures were not taken. The participant acknowledged that this ventilation approach worked for his bedroom but did not work in his living room, as ventilation remained poor.
“The problem is, if I leave the main door open, I have mosquitoes coming in, which is the issue. I would love to have everything open, but I cannot do that because if you leave the door open for not even five minutes and you have mosquitoes inside, it is just a pain.”
As the above quote shows, the participant’s practices were primarily dictated by his need for thermal comfort. Notably, he could not sleep properly at night due to poor ventilation, which affected the number and length of times he used his fans. However, despite his frequent use of fans, he seemed aware of how much electricity he consumed. He reportedly tried to avoid, for example, having the TV and the computer on simultaneously as he found this “illogical”. Furthermore, the participant took a monitoring device from a friend to identify which appliances consumed more electricity. By monitoring, the participant sought to understand patterns underlying his electricity consumption and found ways by which this consumption could be reduced. One potential change the participant discussed was purchasing a more energy-efficient fan that would inevitably reduce his energy footprint. In summary, the participants’ electricity and cooling consumption practices were primarily shaped by the following:
  • The materiality of building design: Although his apartment was semi-passive, it was poorly designed, failing to meet his thermal comfort requirement.
  • Know-how on maintaining ventilation: The participant developed a unique method of mixing mechanical and natural approaches to attain thermal comfort.
  • Physiological and emotive impacts: Sleep was the primary driver for the continual use of fans. The participants’ striving for emotional well-being shaped his cooling practices.
  • Know-how on electricity consumption: the participant started monitoring his consumption, which allowed him to identify that his current fans consume more. However, his choice to buy a more energy-efficient fan might also result in a rebound effect (i.e., using the fan more because of its presumed level of energy efficiency).
The residential space cooling user behaviour demonstrated some intriguing patterns, which contrasted with, for example, the UK’s domestic space-heating behaviour. User profiles for UK space heating have a certain degree of homogeneity across most households [52,53], where the heating is mainly centralised in the dwelling. The residential use of appliances for thermal comfort in monitored households in Auroville suggested that fans and A/Cs were separate, room-based appliances, mostly in bedrooms, which might mean more complex and subjective occupancy behaviour. Although the electricity demand profiles demonstrated some space cooling demand patterns, know-how on maintaining ventilation and electricity consumption, physiological and emotive impacts, the materiality of building design, and technology choice were found to have influenced occupant practice for attaining thermal comfort. Thus, combining monitored demand data and behavioural and practice analysis rendered a significant opportunity to understand the user-specific cooling practice and their motivation to use mechanical ventilation and A/C.
Insights from interviews and electricity consumption analysis offered valuable information on cooling preferences and technology adoption for thermal comfort in households. In the Global South, where demand was high and estimated to elevate significantly, these technologies could be used synergistically for demand management and energy flexibility. This would substantially reduce energy consumption and associated carbon emissions. Further exploring these insights could be critical in advancing sustainable cooling for the Global South.

4. Conclusions

The objective of the study was to adopt a mixed-method approach to understand occupancy practices for attaining thermal comfort in households of warm-humid climate —using Auroville in Southern India as a case study—through the quantitative analysis of climate data, electricity demand profiles, and qualitative analysis of in-depth interviews and observations. An hourly climate dataset for Auroville covering the last 30 years (1989–2019) was analysed to study climate evolution, predominantly using the derived Environmental Stress Index (ESI). Also, the electricity consumption profile of 18 households was collected and analysed, with two specific case studies selected for more detailed analysis. Furthermore, in-depth interviews were undertaken with case studies to investigate the occupants’ behaviour and generate insights into their cooling preferences and practices for the qualitative analysis. However, the case study size and nature of Auroville’s households were not intended to generalise behaviour and practices across India for cooling or other energy use.
The study demonstrated the benefit of a multidisciplinary approach, combining monitored demand data and behavioural and practice analysis to understand the user-specific localised cooling practice and their motivation towards the choice. Despite the limitations and uniqueness of the case community, this study’s analysis suggested three main findings. First, increasing environmental stress influenced household practices and adaptation techniques to attain thermal comfort. As seen from the climate data analysis for the past 30 years, temperatures have risen in Auroville, with a high occurrence of annual heat waves since 2014. The ESI increased significantly after 2013 and predominantly occurred during summer and the monsoon season, which may have influenced the adoption of A/Cs in both Citadines and Inspiration. Second, work flexibility and proximity were significant cooling routines and practice drivers. As seen in Home 1 and from other interviewees, proximity to home created a pattern where householders subconsciously use the A/C more while carrying out other domestic (e.g., eating) or office-related work. Third, technological know-how shaped how householders managed their electricity-related cooling consumption. As seen in Home 1 and from other interviewed participants, households with A/C and ceiling fans typically cool first with A/C, after which they used fans to circulate the cooled air. Air conditioners were switched on once the air exceeded a set temperature, and the cooling and fan circulation patterns were repeated. Thus, the interviews and electricity consumption data analytics rendered insights into the behaviours and practices shaping cooling preferences and the combined usage of cooling and ventilation technologies in households for thermal comfort. Such combined use of cooling and ventilation technologies might create scope for demand management to exploit the energy flexibility in residential communities, which would need further investigation.
In terms of further applications of this work, the observed appliance use behaviours—particularly those associated with cooling and ventilation for comfort—could be utilised to generate user profile schedules for appliances in simulated virtual environments. Also, understanding the bundles of practices that shape energy consumption patterns would assist with characterising opportunities and constraints for demand response options like time-shift programmes. The simulations would aid in investigating the effect of different demand reduction scenarios for various neighbourhoods. There was a substantial gap in understanding residential electricity consumption behaviours in India because of the significant diverse influence of demography, local geography/climate, economy, culture and technological variables and complexities. This study was an initial step towards identifying and understanding the behavioural drivers of electricity use in a warm-humid climate for comfort on a household scale. The constructed framework could be transferred to other communities to test its portability to more complex demand characteristics, where cooling may not be a dominant driver of demand behaviour.

Author Contributions

Conceptualization, K.B.D.; methodology, K.B.D. and O.O.; formal analysis, K.B.D. and O.O.; investigation, K.B.D. and O.O.; resources, D.P.J. and A.D.P.; data curation, K.B.D. and O.O.; writing—original draft preparation, K.B.D., O.O. and D.P.J.; writing—review and editing, K.B.D., O.O., D.P.J. and A.D.P.; visualisation, K.B.D.; supervision, D.P.J. and A.D.P.; project administration, D.P.J.; funding acquisition, D.P.J. and A.D.P. All authors have read and agreed to the published version of the manuscript.

Funding

This research was funded by the CEDRI project (Grant reference EP/R008655/1) and is supported by the Engineering and Physical Sciences Research Council (EPSRC) and the Indian Department of Science and Technology as part of the Newton-Bhabha programme.

Institutional Review Board Statement

Not applicable.

Informed Consent Statement

Not applicable.

Data Availability Statement

Data is contained within the article.

Acknowledgments

The authors also wish to acknowledge the technical support from Martin Scherfler, Jaswanth Yaddala and others of Auroville Consulting (AVC) for the data collection process.

Conflicts of Interest

The authors declare no conflicts of interest.

References

  1. WB. World Development Indicators (WDI). 2023. Available online: http://databank.worldbank.org/data/source/world-development-indicators (accessed on 5 December 2023).
  2. UN. UN DESA Policy Brief No. 153: India Overtakes China as the World’s Most Populous Country. 24 April 2023. Available online: https://www.un.org/development/desa/dpad/publication/un-desa-policy-brief-no-153-india-overtakes-china-as-the-worlds-most-populous-country/ (accessed on 31 October 2023).
  3. WEF. Future of Consumption in Fast-Growth Consumer Markets: INDIA; World Economic Forum: Colony, Switzerland, 2019. [Google Scholar]
  4. Biardeau, L.T.; Davis, L.W.; Gertler, P.; Wolfram, C. Heat exposure and global air conditioning. Nat. Sustain. 2020, 3, 25–28. [Google Scholar] [CrossRef]
  5. Sivak, M. Potential energy demand for cooling in the 50 largest metropolitan areas of the world: Implications for developing countries. Energy Policy 2009, 37, 1382–1384. [Google Scholar] [CrossRef]
  6. Debnath, K.B.; Jenkins, D.; Patidar, S.; Peacock, A.D.; Bridgens, B. Climate change, extreme heat, and South Asian megacities: Impact of heat stress on inhabitants and their productivity. ASME J. Eng. Sustain. Build. Cities 2023, 4, 041006. [Google Scholar] [CrossRef]
  7. GoI. India Energy Security Scenarios 2047. 2015. Available online: http://iess2047.gov.in/ (accessed on 20 October 2019).
  8. IEA. Energy Efficiency: Cooling. 2019. Available online: https://www.iea.org/topics/energyefficiency/buildings/cooling/ (accessed on 20 October 2019).
  9. GBPN; CEPT. Residential Buildings in India: Energy Use Projections and Savings Potentials; Global Buildings Performance Network (GBPN): Ahmedabad, India, 2014. [Google Scholar]
  10. IEA. Electricity Final Consumption by Sector, India 1990–2017. 2020. Available online: https://www.iea.org/data-and-statistics?country=INDIA&fuel=Energy%20consumption&indicator=Electricity%20final%20consumption%20by%20sector (accessed on 5 December 2020).
  11. GoI. India Cooling Action Plan; Government of India: New Delhi, India, 2019.
  12. Abhyankar, N.; Shah, N.; Park, W.Y.; Phadke, A. Accelerating Energy Efficiency Improvements in Room Air Conditioners in India: Potential, Costs-Benefits, and Policies; Ernest Orlando Lawrence Berkeley National Laboratory: Berkeley, CA, USA, 2017.
  13. Tweed, C.; Dixon, D.; Hinton, E.; Bickerstaff, K. Thermal comfort practices in the home and their impact on energy consumption. Archit. Eng. Des. Manag. 2014, 10, 1–24. [Google Scholar] [CrossRef]
  14. Costa-Carrapiço, I.; González, J.N.; Raslan, R.; Sánchez-Guevara, C.; Marrero, M.D.R. Understanding thermal comfort in vernacular dwellings in Alentejo, Portugal: A mixed-methods adaptive comfort approach. Build. Environ. 2022, 217, 109084. [Google Scholar] [CrossRef]
  15. Milando, C.W.; Black-Ingersoll, F.; Heidari, L.; López-Hernández, I.; de Lange, J.; Negassa, A.; McIntyre, A.M.; Martinez, M.P.B.; Bongiovanni, R.; Levy, J.I.; et al. Mixed methods assessment of personal heat exposure, sleep, physical activity, and heat adaptation strategies among urban residents in the Boston area, MA. BMC Public Health 2022, 22, 2314. [Google Scholar] [CrossRef] [PubMed]
  16. Eslamirad, N.; Sepúlveda, A.; De Luca, F.; Lylykangas, K.S. Evaluating outdoor thermal comfort using a mixed-method to improve the environmental quality of a university campus. Energies 2022, 15, 1577. [Google Scholar] [CrossRef]
  17. Eon, C.; Morrison, G.M.; Byrne, J. The influence of design and everyday practices on individual heating and cooling behaviour in residential homes. Energy Effic. 2018, 11, 273–293. [Google Scholar] [CrossRef]
  18. TSharmin, T.; Khalid, R. Post occupancy and participatory design evaluation of a marginalized low-income settlement in Ahmedabad, India. Build. Res. Inf. 2022, 50, 574–594. [Google Scholar] [CrossRef]
  19. GoI. Consumption of Electricity (From Utility) by Sectors. 1 November 2023. Available online: https://data.gov.in/catalog/consumption-electricity-utility-sectors (accessed on 4 November 2023).
  20. GoI. Growth of Electricity Sector in India 1947–2013; Government of India: New Delhi, India, 2013.
  21. Chaturvedi, V.; Eom, J.; Clarke, L.E.; Shukla, P.R. Long term building energy demand for India: Disaggregating end use energy services in an integrated assessment modeling framework. Energy Policy 2014, 64, 226–242. [Google Scholar] [CrossRef]
  22. Verma, A.; Jaiswal, Y.K.; Wani, K.A. Energy consumption behaviour of an urban residential sector in the northern province of Madhya Pradesh (India). Indoor Built Environ. 2012, 21, 703–709. [Google Scholar] [CrossRef]
  23. Yu, S.; Evans, M.; Kyle, P.; Vu, L.; Tan, Q.; Gupta, A.; Patel, P. Implementing nationally determined contributions: Building energy policies in India’s mitigation strategy. Environ. Res. Lett. 2018, 13, 034034. [Google Scholar] [CrossRef]
  24. Jensen, C.L.; Goggins, G.; Fahy, F.; Grealis, E.; Vadovics, E.; Genus, A.; Rau, H. Towards a practice-theoretical classification of sustainable energy consumption initiatives: Insights from social scientific energy research in 30 European countries. Energy Res. Soc. Sci. 2018, 45, 297–306. [Google Scholar] [CrossRef]
  25. Shove, E.; Walker, G. Governing transitions in the sustainability of everyday life. Res. Policy 2010, 39, 471–476. [Google Scholar] [CrossRef]
  26. Schatzki, T.R. The Site of the Social: A Philosophical Account of the Constitution of Social Life and Change; Penn State Press: University Park, PA, USA, 2002. [Google Scholar]
  27. Gram-Hanssen, K. Understanding change and continuity in residential energy consumption. J. Consum. Cult. 2011, 11, 61–78. [Google Scholar] [CrossRef]
  28. Shove, E.; Watson, M.; Spurling, N. Conceptualizing connections: Energy demand, infrastructures and social practices. Eur. J. Soc. Theory 2015, 18, 274–287. [Google Scholar] [CrossRef]
  29. Warde, A. Consumption and theories of practice. J. Consum. Cult. 2005, 5, 131–153. [Google Scholar] [CrossRef]
  30. Winther, T.; Wilhite, H. An analysis of the household energy rebound effect from a practice perspective: Spatial and temporal dimensions. Energy Effic. 2015, 8, 595–607. [Google Scholar] [CrossRef]
  31. Chandel, S.; Sarkar, A. Performance assessment of a passive solar building for thermal comfort and energy saving in a hilly terrain of India. Energy Build. 2015, 86, 873–885. [Google Scholar] [CrossRef]
  32. AVC. Analysis of Auroville’s Electricity 2010–2017; Auroville Consulting: Auroville, India, 2018. [Google Scholar]
  33. AF. The Line of Goodwill—An Urban Hillscape for Coexistence. 2017. Available online: https://www.auroville.org/page/the-line-of-goodwill-an-urban-hillscape-for-coexistence (accessed on 10 September 2019).
  34. AF. Auroville Green Practices. 2020. Available online: https://auroville.org/category/green-practices (accessed on 1 April 2020).
  35. Kundoo, A. Auroville: An Architectural Laboratory. Archit. Des. 2007, 77, 50–55. [Google Scholar] [CrossRef]
  36. Kapoor, R. Auroville: A spiritual-social experiment in human unity and evolution. Futures 2007, 39, 632–643. [Google Scholar] [CrossRef]
  37. Nagy, B. Experimented methods to moderate the impact of climate change in Auroville. Ecocycles 2018, 4, 20–31. [Google Scholar] [CrossRef]
  38. LLoret, S.; Martin, S.; Sarkhot, D. Sustainable Energy in Auroville the Vision and the Reality; IIT Madras, India, Auroville; Ecole Polytechnique Federale de Lausanne: Guy Brown, Switzerland, 2002. [Google Scholar]
  39. Meteoblue. Meteoblue. 2023. Available online: www.meteoblue.com (accessed on 23 March 2023).
  40. Moran, D.; Pandolf, K.; Shapiro, Y.; Heled, Y.; Shani, Y.; Mathew, W.; Gonzalez, R. An environmental stress index (ESI) as a substitute for the wet bulb globe temperature (WBGT). J. Therm. Biol. 2001, 26, 427–431. [Google Scholar] [CrossRef]
  41. Liang, C.; Zheng, G.; Zhu, N.; Tian, Z.; Lu, S.; Chen, Y. A new environmental heat stress index for indoor hot and humid environments based on Cox regression. J. Affect. Disord. 2011, 46, 2472–2479. [Google Scholar] [CrossRef]
  42. Zare, S.; Shirvan, H.E.; Hemmatjo, R.; Sarebanzadeh, K.; Hasheminejad, N.; Faridan, M.; Zare, K. Investigating the levels of thermal stress in kerman city in 2016 using thermal indices: WBGT, ESI, HI, HSI, and SWreq. J. Kerman Univ. Med. Sci. 2018, 25, 339–354. [Google Scholar]
  43. Taleghani, M.; Tenpierik, M.; Kurvers, S.; van den Dobbelsteen, A. A review into thermal comfort in buildings. Renew. Sustain. Energy Rev. 2013, 26, 201–215. [Google Scholar] [CrossRef]
  44. Moran, D.; Pandolf, K.; Shapiro, Y.; Laor, A.; Heled, Y.; Gonzalez, R. Evaluation of the environmental stress index for physiological variables. J. Therm. Biol. 2003, 28, 43–49. [Google Scholar] [CrossRef]
  45. Moran, D.S.; Pandolf, K.B.; Vitalis, A.; Heled, Y.; Parker, R.; Gonzalez, R.R. Evaluation of the environmental stress index (ESI) for the southern hemisphere. J. Therm. Biol. 2004, 29, 535–538. [Google Scholar] [CrossRef]
  46. Auroville. Auroville in Brief. 2017. Available online: https://auroville.org/page/brief (accessed on 10 May 2019).
  47. Google Earth. Map showing Location of Auroville. 2019. Available online: https://www.google.com/maps (accessed on 24 December 2019).
  48. Shove, E.; Walker, G. What Is Energy For? Social Practice and Energy Demand. Theory Cult. Soc. 2014, 31, 41–58. [Google Scholar] [CrossRef]
  49. Debnath, K.B.; Jenkins, D.P.; Patidar, S.; Peacock, A.D. Understanding Residential Occupant Cooling Behaviour through Electricity Consumption in Warm-Humid Climate. Buildings 2020, 10, 78. [Google Scholar] [CrossRef]
  50. Guleria, S.; Gupta, A.K. Heat Wave in India Documentation of State of Telangana and Odisha (2016); National Institute of Disaster Management: New Delhi, India, 2018.
  51. WEC. Average Electricity Consumption per Electrified Household. 2020. Available online: https://wec-indicators.enerdata.net/household-electricity-use.html (accessed on 28 June 2020).
  52. McCallum, P.; Jenkins, D.P.; Peacock, A.D.; Patidar, S.; Andoni, M.; Flynn, D.; Robu, V. A multi-sectoral approach to modelling community energy demand of the built environment. Energy Policy 2019, 132, 865–875. [Google Scholar] [CrossRef]
  53. Jenkins, D.; Patidar, S.; McCallum, P.; Debnath, K. Modelling community electricity demand for UK and India. Sustain. Cities Soc. 2020, 55, 102054. [Google Scholar] [CrossRef]
Figure 2. Monitored buildings (Auroville); map source: [47].
Electricity 05 00007 g002
Figure 3. Methodology (mixed method) of the study.
Electricity 05 00007 g003
Figure 4. Weather analysis for Auroville in 1989, 1999, 2009 and 2019.
Electricity 05 00007 g004
Figure 5. Environmental stress index (ESI) analysis for Auroville from 1989 to 2019.
Electricity 05 00007 g005
Figure 6. (A) Electricity consumption in 3–9 November 2018; (B) Electricity consumption in 22–28 December 2018.
Electricity 05 00007 g006
Figure 7. (A) Households with high electricity demand profiles; (B) with comparatively lower electricity demand profiles.
Electricity 05 00007 g007
Figure 8. Daily electricity demand profile for ‘Home 1’ with A/C ((A) 3–9 November 2018, (B) 22–28 December 2018). The weekends were 3 November (Saturday), 4 November, 22 December (Saturday), and 23 December.
Electricity 05 00007 g008
Figure 9. Daily electricity demand profile for ‘Home 1’ household with A/C ((A) 3–9 November 2018, (B) 22–28 December 2018); Red is for weekends, and blue is for weekdays. The missing data may have been due to the reasons explained in Section 2.3.3.
Electricity 05 00007 g009
Figure 10. Daily electricity demand profile for ‘Home 5’ without A/C ((A) 3–9 November 2018, (B) 22–28 December 2018). The weekends were 3 November (Saturday), 4 November, 22 December (Saturday), and 23 December.
Electricity 05 00007 g010
Figure 11. Daily electricity demand profile for ‘Home 5’ without A/C ((A) 3–9 November 2018, (B) 22–28 December 2018); Red and blue are for weekends and weekdays, respectively. The missing data may have been due to the reasons explained in Section 2.3.3.
Electricity 05 00007 g011
Table 1. Descriptive statistics of the monitored households’ occupants and area (unit of area was m2).
OccupantArea
Mean1.247.6
Standard Error0.12.6
Median1.050.0
Mode1.050.0
Standard Deviation0.411.5
Sample Variance0.1132.6
Kurtosis2.81.1
Skewness2.10.8
Range1.045.0
Minimum1.030.0
Maximum2.075.0
Sum23.0952.0
Count20.020.0
Table 2. Descriptive statistical analysis of appliance ownership in the monitored households for lighting, HVAC and hot water, entertainment, and IT.
LightingHVAC and Hot WaterEntertainment and IT
Tungsten
Filament (5–15 W)
CFL (5–18 W)T5 with Electronic Ballast (5–15W)LED (2–15 W)Fan (25–75 W)A/C (1000 W)Geyser (3000 W)Laptop (20–60 W)CPU (72.5 W)Monitor (17.6 W)Modem (12 W)Router (7.65–21.6 W)Hard disk (18 W)Speakers (0.07–15 W)Television (200 W)Set-top boxMusic system (150 W)Phone
Mean1.05.41.72.33.10.10.40.60.20.20.10.10.10.10.20.10.10.1
Standard Error0.40.70.51.10.20.10.10.10.10.10.10.10.10.10.10.10.10.1
Median0.06.00.51.03.00.00.01.00.00.00.00.00.00.00.00.00.00.0
Mode050030010000000000
Standard Deviation1.83.32.04.71.00.30.50.60.40.40.20.30.20.30.40.20.20.2
Sample Variance3.310.94.122.21.00.10.30.40.10.20.10.10.10.10.10.10.10.1
Kurtosis6.0−0.4−1.414.6−0.47.0−2.0−0.62.80.720.07.020.07.02.820.020.020.0
Skewness2.4−0.30.63.7−0.12.90.40.42.11.64.52.94.52.92.14.54.54.5
Range71252141121111111111
Minimum000010000000000000
Maximum71252151121111111111
Sum1910834456128123412123111
Count202020202020202020202020202020202020
Table 3. Descriptive statistical analysis of appliance ownership in the monitored households for cooking, food-related, and others.
Cooking and Food RelatedOthers
Refrigerator (100–548 kWh/year)Oven (1200–1300 W)Electric Stove (1000–1200 W)Coffee Machine (800 W)Mixer (800 W)Blender (500 W)Kettle [Water Heater] (180–1800 W)Toaster (800 W)Vacuum Cleaner (1400 W)Iron (750–1400 W)Mix TableHairdryer (2500 W)
Mean1.00.10.10.10.20.20.30.10.10.20.10.1
Standard Error0.10.10.10.10.10.10.10.10.10.10.10.1
Median1.00.00.00.00.00.00.00.00.00.00.00.0
Mode100000000000
Standard Deviation0.30.30.30.20.40.40.40.30.20.40.20.2
Sample Variance0.10.10.10.10.10.20.20.10.10.10.10.1
Kurtosis9.57.07.020.02.80.7−0.57.020.02.820.020.0
Skewness0.02.92.94.52.11.61.32.94.52.14.54.5
Range211111111111
Minimum000000000000
Maximum211111111111
Sum2022134521311
Count202020202020202020202020
Disclaimer/Publisher’s Note: The statements, opinions and data contained in all publications are solely those of the individual author(s) and contributor(s) and not of MDPI and/or the editor(s). MDPI and/or the editor(s) disclaim responsibility for any injury to people or property resulting from any ideas, methods, instructions or products referred to in the content.

