
Spatial and Temporal Dynamics of Key Water Quality Parameters in a Thermal Stratified Lake Ecosystem: The Case Study of Lake Mead


Department of Civil and Environmental Engineering and Construction, University of Nevada Las Vegas, Las Vegas, NV 89154, USA
*
Author to whom correspondence should be addressed.
Earth 2023, 4(3), 461-502; https://doi.org/10.3390/earth4030025
Submission received: 5 May 2023
/
Revised: 27 June 2023
/
Accepted: 28 June 2023
/
Published: 30 June 2023
Abstract
:Lake Mead located in the Arizona–Nevada region of the Mohave Dessert is a unique and complex water system whose flow follows that of a warm monomictic lake. Although monomictic lakes experience thermal stratification for almost the entire year with a period of complete mixing, the lake on occasion deviates from this phenomenon, undergoing incomplete turnovers categorized with light stratifications every other year. The prolonged drought and growing anthropogenic activities have the potential to considerably impact the quality of the lake. Lake Mead and by extension the Boulder Basin receive cooler flow from the Colorado River and flow with varying temperatures from the Las Vegas Wash (LVW), which impacts its stratification and complete turnovers. This study analyzes four key water quality parameters (WQPs), namely, total dissolved solids (TDS), total suspended solids (TSS), temperature, and dissolved oxygen (DO), using statistical and spatial analyses to understand their variations in light of the lake stratifications and turnovers to further maintain its overall quality and sustainability. The study also evaluates the impacts of hydrological variables including in and out flows, storage, evaporation, and water surface elevation on the WQPs. The results produced from the analysis show significant levels of TDS, TSS, and temperature from the LVW and Las Vegas Bay regions compared with the Boulder Basin. LVW is the main channel for conveying effluents from several wastewater treatment facilities into the lake. We observed an increase in the levels of TDS, TSS, and temperature water quality in the epilimnion compared with the other layers of the lake. The metalimnion and the hypolimnion layer, however, showed reduced DO due to depletion by algal blooms. We observed statistically significant differences in the WQPs throughout various months, but not in the case for season and year, an indication of relatively consistent variability throughout each season and year. We also observed a no clear trend of influence of outflows and inflows on TDS, temperature, and DO. TSS concentrations in the lake, however, remained constant, irrespective of the inflows and outflows, possibly due to the settling of the sediments and the reservoir capacity.
1. Introduction
Out of the 3% of potable water resources, only less than 1% is available for human consumption. Water is a scarce natural resource needed for everyday activities. About 25% of the world’s population does not have access to a satisfactory quantity and or quality of freshwater [1,2]. Humans and living organisms, including aquatic animals, depend on water for their existence. Waterbodies such as lakes are the main source of water for agricultural activities, domestic use, transportation, electricity, power generation, recreational activities, industrial cooling, ecosystem services, supporting biodiversity, and wastewater disposal, among many others [3,4,5,6,7,8,9,10]. These water bodies are under intense stress due to environmental and ecological changes caused by rapid population growth and development. Increased population growth and urbanization are global phenomena of concern to stakeholders in the water sector. A greater part of the world’s population is found in urban areas. With the current rate of population growth, there is a projected 2.2 billion increment in the world’s population by 2030, with approximately 95.5% expected in urban areas [11,12]. Not only does urbanization impact the quantity of runoff resulting in downstream flooding and endangering the environment, but it also impacts the quality of water in the downstream receiving waterbodies [13,14,15].
Lake Mead, which is located in the Black Canyon and about 48.28 km east of the city of Las Vegas, NV, USA (Southwestern US) [16], is one of such waterbodies at the receiving end of water quality impairment due to anthropogenic activities in and around its watershed. The lake, which is located on the Colorado River, specifically in the Southwestern US, is a source of water for domestic, irrigation, recreation, and electricity generation for millions of people. The lake is however facing mega-drought, increase water quality impairment due to anthropogenic activities resulting from increased urbanization and population growth over the last few decades [17,18,19]. There is a suggestion that the current condition is the driest it has been in at least 1200 years [20]. This trend is estimated to probably continue due to the effects of climate change and population growth [20]. With the current drought and uncontrolled wildfires burning millions of acres of land in the watersheds, the quality of water in the lake is in jeopardy, which requires constant monitoring [20].
Las Vegas Valley has seen a huge growth in population over the years, with an expected population of 2.94 million by 2040 from its 1.96 million value in 2010 [21]. Increments in the population and associated development are linked to environmental and ecological changes in water bodies. Population growth in the valley is projected to continue [12,21,22].
Waterbodies such as Lake Mead continually face stress resulting from the effects of development, urbanization, and contamination caused by nutrient pollution, drought, and changes in land use and land cover, which results in negative impacts, including the proliferation of toxic blue-green algae, turbidity, eutrophication, and dissolved solids, among others, which impacts the sustainability of the water resources [12,23,24,25,26,27]. To monitor and protect the quality of stressed water resources, there is a need to effectively characterize the water quality parameters (WQPs). WQPs are characterized as having physical, chemical, biological, and radiological properties [28,29]. Physical parameters include total suspended solids (TSS), pH, dissolved oxygen (DO), salinity or total dissolved solids (TDS), temperature, and electrical conductivity (EC), while chemical parameters include cations and anions. Examples of biological parameters are algae, total coliforms, and bacteria [2,5,30].
TDS and TSS are two components of total solids separable using 2.0 µm pore sizes. While TDS passes through this sieve or pore size, TSS is retained on the pore size [31,32]. Mineral and energy resource extraction has been established to potentially increase the TDS and TSS loadings to the surrounding watersheds [31].
TDS is composed of organic and inorganic substances in water [27,33,34,35], consisting of metalloids, metals, or infinitesimal ions such as Ca2+, Na+, Mg2+, and Cl−, which pose issues in drinking and wastewater systems, owing to the fact they are usually removed through the mechanical methods of treatment [36]. Causes of elevated TDS in water are categorized as natural (i.e., flood, evaporation, and storm surge) and poor management practices (i.e., excess use of fertilizers) [37]. TDS is also generated due to the release of organic molecules during the growth and decomposition of biological matter, including microbes and roots in waterbodies. Several factors include the desorption of ions solids, atmospheric precipitation, and soil mineral dissolution. TDS is therefore related to the EC of water due to the charged ions [38]. Salinity in waterbodies is a widespread phenomenon of great concern [39], influenced by chemical and biological processes including pH, dissolved oxygen concentration, temperature, organic carbon, and rock decompositions [31]. Additionally, the river basin that houses the lake is known to be a repository of naturally occurring and abundant salts that were deposited during prehistoric marine conditions. Salts containing sedimentary rocks are easily erodible, dissolved, and transported into the basin river system [27,40]. An estimated 8 billion kg are said to be transported past the Hoover Dam below Lake Mead annually [40,41]. The Colorado River Basin Salinity Forum outlines human activities such as livestock grazing, logging, mining, oil exploration, road construction, urbanization, and wildlife management as various factors that influence the rate of natural salt transportation from soils and rock formations in the river basin system [40]. The US Environmental Protection Agency (EPA) estimated that 53% of the salinity arriving at the Hoover Dam are accounted for by agriculture (3%), agricultural irrigation (37%), reservoir evaporation and phreatophyte use (12%), and municipal and industrial uses (1%) [40]. The remaining 47% are accounted for by natural sources [42]. Salinity-related issues in the river basin have resulted in annual economic damage exceeding USD 300 million [27,43,44]. High levels of TDS in the lake may result in disrupting, delaying, and shifting the timings of spring mixings and the stratification of lakes. An increase in TDS concentration may cause instability in water columns due to the density difference between the less dense (fresh) and denser saline water [45]. The increased TDS concentration has a direct impact on surface and groundwaters and has the possibility of causing toxicity to aquatic organisms [35]. The rise in the ionic constituents of water and the associated toxicity of those ions can elevate the salinity of the water, which has the potential to cause shifts in biotic ecosystems, hence limiting their biodiversity [46]. Limitation in the biodiversity abundance of aquatic species in rivers in the North American Great Plains has been linked to several factors, including increased levels of TDS concentrations [47,48].
TSS is used as an indicator of sediment pollution in water bodies. They consist of organic and inorganic solids suspended in the water columns [49]. Specifically, TSS in the waterbody may be composed of sand, biological materials, silts, mineral precipitates, and clay and are mostly influenced by physical processes such as erosion of stream banks, surface soils, as well as the aggregation of dissolved organic materials, which are heavily aided by the watershed hydrology [31,47]. Hydrological activities including rainfall and runoff coupled with forest fire events in the upper portion of the lower Virgin River (tributary to Lake Mead) are said to influence the erosions of sediments into the lake [50].
The average tolerance level of TSS in waterbodies is limited to 13 and 90 mg/L, respectively, for bottom invertebrates and fishes [27]. TSS concentration in the water bodies has the potential to increase the turbidity of the waterbody, resulting in a decrease in light penetration to the waterbody required by aquatic plans for photosynthesis, which ultimately results in the depletion of dissolved oxygen for the survival of aquatic organisms [31]. Increased TSS in the waterbody can also impact the efficiency of filtration and plumbing systems and capital equipment [51]. Additionally, excessive TSS loadings or concentrations in the waterbody may cause clogging in the gills of fish and cause their death [31,50,52,53].
The temperature of the water plays a crucial role in the growth, metabolic activities, and functioning of aquatic organisms. Water temperature increases intensify the drying of streams resulting in a rise in TDS concentration [47]. In water, temperature controls physical, chemical, and biological processes. The solubility and availability of various chemical components in water are also influenced by the temperature of the water. Temperature ultimately affects the dissolved oxygen concentrations in the water as the solubility of oxygen declines with the rising water temperature [54]. Studies have associated increased nutrients and chemical loads to waterbodies from agriculture and runoffs to climate change linked to high temperatures and rainfall irregularities [49]. Temperature also plays a huge role in the stratification of lakes. Temperature influences the density of water in the lake and can thus impact its stratification. A rise in the lake water temperature can result in the variation of biochemical rates of reaction of organizations causing thermal stratification, reducing the lake mixing, and subsequently affecting the DO concentrations [2,45,55,56].
DO in the waterbody measures the amount of concentration of oxygen, which is a vital parameter for assessing the overall quality and health of aquatic organisms. DO is utilized by invertebrates and fish for respiration and by aquatic plants for photosynthesis. A decreased amount of DO could result in oxygen depletion, resulting in a hypoxic or anoxic water environment, hampering the overall aquatic ecosystems [57,58]. Changes in DO concentrations in the water system may be caused by an increase in TDS concentration, temperature, and biological activities, as well as changes in atmospheric pressure. Eutrophication from excessive algae blooms, organic matter, nutrients, and decaying plants may result in increased oxygen consumption in the water and subsequently affect the DO in the waterbody. Algae blooms may also block sunlight and create anoxic conditions [56,57,59,60,61]. Stratification of Lake Mead caused temperature differences in the flows in the lake, causing variations in the DO in the layers of the lake [62].
The relationship and influence of these WQPs on the quality of water, as well as their spatiotemporal variations and effects on aquatic ecosystems, have well been studied [27,31,44,63,64]. An increase in TDS concentration in water means increased conductivity of charged ions in the water system and may also mean a decrease in DO concentration [65]. Elevated concentrations of TSS may lead to an increased water temperature, which lowers the DO concentrations. Increased TSS in the waterbody may also lead to greater absorption of heat and a reduction in light penetration into the water, impacting photosynthesis and also resulting in the warming of the water causing depletion of oxygen and aquatic organism [51,66]. A study by [45] to investigate the impact of salinization on lake stratification and spring mixing Mendota and Monona lakes located in Wisconsin, US, found that increased winter salt loading causes a delay in spring turnover, prolonging summer stratification.
Increased TDS, TSS, and water temperature of the lake and the associated effects in the lake, including eutrophication and algae growth, have the potential to reduce the DO in the water, thereby impacting the lake’s ecosystem [51,56,57,65,66,67].
The main objective of the study is thus to examine and unravel the spatiotemporal variability of key WQPs, namely TDS, TSS, temperature, and DO in Lake Mead to better understand the underlying causes of their changes and to guide strategies for water resource management and conservation. The study addresses the following research questions.
- How do TDS, TSS, temperature, and DO vary across different months, seasons, and years?
- How do reservoir inflow, outflow, storage, and elevation impact the changes in the water quality dynamics of Lake Mead?
- How do the TDS, EC, and temperature levels differ spatially in Lake Mead?
- How do lake stratification and mixing impact the distribution of key WQPs in Lake Mead?
2. Materials and Methods
2.1. Study Area
Lake Mead, which lies on the Colorado River, is the area of study for this research. The lake is the largest reservoir on the Colorado River and the largest reservoir by volume in the entire US. It is located in the Mohave Desert, Arizona–Nevada region [68,69], and provides a vital ecosystem for the federally listed endangered razorback sucker called Xyrauchen texanus [70]. The area is a semi-arid region with an estimated average yearly precipitation for the lake of 14.58 cm and a mean annual evaporation of 162.56 cm [69,70]. The average annual evaporation of Lake Mead is about 10% more than that of its neighboring Lake Mohave due to the difference in available energies in these lakes, driven by the variation in the advected heat between the lakes. Lake Mead’s annual energy is about 139 W/m2 compared with that of Lake Mohave, which is 116 W/m2. Due to colder inflows and warmer outflows, the amount of advected heat at Lake Mohave is lower compared with that in Lake Mead [69]. The average temperature for the lake is estimated to range from 7 to 29 °C [71]. Temperature is said to be a driving factor of the lake’s evaporation, with average evaporation ranging from 0.33 ft recorded in February to 0.85 ft recorded in August [69]. The temperature of the lake’s water follows a pattern depicted by monomictic lakes (i.e., lakes with thermal stratifications for almost the entire year and only a single time of complete mixing). On some occasions, the lake deviates slightly from this pattern by undergoing incomplete mixing. On average, the lake experiences considerable but incomplete mixing once every 2 years [70].
Lake Mead is the largest reservoir in terms of water capacity, with a maximum capacity of 35 million km3 within the United States, and it was formed after Hoover Dam was constructed in the 1930s. The Las Vegas Valley (LVV) sources about 90% of its water supply from the lake [17,72]. Lake Mead is a source of water for more than 25 million in the Southwestern US for their domestic, municipal, industrial, and agricultural needs [17,18,70,73]. Lake Mead also serves as a source of water for irrigating more than 2.5 million acres of land, as well as providing recreational benefits for over 8 million people. Additionally, the lake serves as a source of electricity generation for major cities in the Southwestern US including Las Vegas, Los Angeles, San Diego, Phoenix, and Tucson [18]. The Lake is however experiencing intense water stress and at a decline as a result of drought and imbalances between supplies and demands caused by climate change and the effects of rapid population growth [74]. The lake has seen a significant decline in its water level over the years. The lake level fell to about 131 ft from 2000 to 2010, raising concerns among industrial players and water managers about future water shortages [69]. Other reports put the lake level as dropping to about 170 ft since 2000, owing to a mega drought in the lake, causing its coastline to rapidly recede and exposing vast areas of dry lakebed [19].
Lake Mead is made of four connected basins, namely, the Gregg, Temple, Virgin, and Boulder Basins. Flow into the lake comes from the Colorado River, the Las Vegas Wash (LVW), the Muddy River, and the Virgin River, as shown in Figure 1 [17,72,75]. Almost all the inflows (98%) into Lake Mead are said to originate from the Upper Colorado River Basin (UCRB), which is a conduit of a significant amount of possibly dissolved salts and sediment transport from the UCRB. Only 1% of inflow comes from the Virgin River, with just 0.6% from the LVV Wash and the remaining 0.34% from the Muddy River [76]. The LVW flows into the lake at Las Vegas Bay located at the western portion of the Boulder Basin [16]. Flows in the LVW are said to have increased more than twice over the last 30+ years due to the rapid population growth in Las Vegas [17,77]. Flows from the LVW encompass runoff from the Las Vegas metropolis, wastewater effluents from WWTPs in Las Vegas and Henderson, and discharges from nonpoint sources and groundwater discharges [17,78].
TDS loadings into the Lake are from the mainstem Colorado River, Little Colorado River, Virgin, Muddy Rivers, and the LVW [74]. The natural TDS content of Lake Mead is around 610 mg/L. This is, however more than the EPA’s recommended value of 500 mg/L in drinking water [40].
TSS loadings into the lake vary from tributary location to another. All the tributaries providing flow to the lake transport heavier sediment loads and higher nutrient concentrations than the ones already in the lake hence lake’s overall water quality and productivity are impacted by the inflows, dissolved solids, temperatures, and sediments. inflow [70]. Lake sedimentation is a key and likely issue that impacts its sustainability [17]. Lakes or reservoirs have a known quantity of water storage capacity when they were first incepted. However, this is reduced by the mechanism of reservoir siltation caused by sediments in reservoirs that impede the continuous flow of sediment via rivers [79,80]. Lake sedimentation could reduce their design life and further deprive downstream of the sediments needed for the sustenance of aquatic life [43,80]. The main source of sedimentation and potential inorganic TSS into the lake includes the Colorado, Virgin, and Muddy Rivers. An estimated sediment of 44 million m3 per year was eroded into the lake as of 2001 [81].
2.2. Data Collection and Preprocessing
The data used in this study were provided by the city of Las Vegas. The cities of Las Vegas, North Las Vegas, Clark County Water Reclamation District, and Henderson sample the LVW and Lake Mead annually for their water quality parameters, including TDS, TSS, DO, and temperature. The monitoring efforts are conducted by the Las Vegas Valley Dischargers (LVVD) to ensure compliance with the Nevada Division of Environmental Protection (NDEP) yearly National Pollutant Discharge Elimination System (NPDES) permits (NDEP).
The City of Las Vegas maintains a master database that contains up-to-date data required for monitoring operations. TDS and TSS concentrations are determined in the laboratory at the Clark County Wastewater facility using physical filtering (i.e., gravimetric) and drying methods, while the temperature and dissolved oxygen concentration measurements were performed using a YSI EXO data sonde. The frequency and measuring station were chosen based on the background information, location, and relevance of these locations. The sampling frequency also varies from season to season due to the environmental conditions, according to Scott H. Schiefer, an official of the City of Las Vegas who provided the authors with these data. For example, sampling is monthly during the winter seasons as there is less activity due to the cold water and less light. The Lake Mead sample locations and frequency of collection are summarized in Table 1. The stations in the Las Vegas Wash and Las Vegas Bay (LWLVB) of the lake are described as ‘movable’, as the location of these stations continually changes with the location of a reference point, the confluence of the Las Vegas Bay, and the Las Vegas Wash. The confluence is designated at a secure position where the depth of the Wash/Lake interface is between 2–4 m [82], which occurs at varying but a close referencing location of coordinates of 36.11XXX° N, 114.8XXXX° W, where X varies. The approximate location of Lake Mead and Las Vegas is presented in Figure 2 [82]. Sampling was taken at the three zones of the lake, namely the epilimnion, metalimnion, and hypolimnion. The epilimnion sample is usually at a depth of 0–5 m, while the hypolimnion sampling is usually at the depth of 1 m from the bottom of the lake or at 70 m maximum depth. The metalimnion sampling is often done at the thermocline when present or mid-way between the surface and the hypolimnion when the thermocline is not present [82].
Data prepared and available as of the time of the data collection phase of this study were only up to 2021. All sampled stations and data received for the WQPs considered in this study were used for the analysis. We merged the physical and chemical data sheets based on the dates to ensure we had all the WQPs in one comma-separated values (csv) sheet for analysis. We obtained 2964 samples for the TDS, DO, and temperature. There were only 1553 samples for TSS. The reduced amount of TSS samples was due to reasons including the fact that TSS measurements are not carried out across all the stations. There was no sampling for TSS at Station 9 (CR342.5) over the entire studied period. Sampling data for Station 5 (IPS3) were from 2017. Additionally, there were missing rows for the TSS data, which could be because the TSS measurements recorded at instances where the flow at the date of sampling was more than 100% of the average flow were not used or applicable [82]. All of the missing values within the stations with values for TSS were filled using the linear interpolation imputation methods. The linear interpolation technique is used to estimate unsampled WQPs based on the information before and after the sampling dates of a particular parameter to generate its value. Linear interpolation was selected due to its computing efficiency and simplicity [83]. After the interpolation, the TSS data obtained and used for this data rose to 2757.
In addition, the WQPs obtained data on the inflows, outflows, storage, and reservoir elevation from the US Bureau of Reclamation to assess their impact on the lake’s water quality. The reservoir total outflows (releases), elevation, and storage are measured at Hoover Dam and Powerplant location with the coordinates 36.0163° N, 114.7374° W, which is around the location of Station 9 (CR342.5) for the WQP measurements and can be accessed via [84]. According to an official of the US Bureau of Reclamation, the lake’s evaporation is computed using monthly coefficients and the surface area of the lake, which is estimated based on the elevation of the water surface using values established and published by the Bureau of Reclamation [85]. The inflow into the lake is computed using mass balance equations using the outflows, evaporation, and storage [86], and is available for access via [87]. The total inflow into the lake is the sum of the inflow and the side flow, which includes the tributary inflows and groundwater inflows into the river basin between Lake Mead and Lake Powell.
2.3. Spatiotemporal Variability of WQPs
We assessed the temporal variability and dynamics in the WQPs using a statistical approach and spatial analysis. Statistical techniques used in this study include descriptive statistics, graphical, and inferential analysis. These approaches are described in the following subsections. Analysis was done separately for the LWLVB wash and Lake stations, as well as for the entire Lake stations. Spatial analysis was carried out to assess the spatial distribution of the WQPs across the stations in the lake.
All analyses in this study were conducted using the Python programming version 3.9.12 language utilizing various libraries and packages, including Pandas version 1.4.2, NumPy version 1.21.5, and SciPy version 1.7.3. The approximate sampling stations were mapped in the Google Earth Pro version 7.3.6.9345 software and saved as a Keyhole Markup Language (kml) file, which was imported into the ESRI ArcGIS Pro software version 3.1.1 for mapping and further analysis. We also used the ESRI ArcGIS Pro to create and analyze the spatial distribution of the WQPs.
Descriptive statistics such as the measures of central tendency, i.e., mean, and dispersion, i.e., the standard deviation are useful in the description of the range of variation in the data, which aids in understanding the variability of the data, but it offers no insight into the distribution of the data [14].
Graphical representations, including time series, were used to assess the change in TDS. Time series analyses are used to examine the patterns and trends in your data across time. Time series analyses are used to find seasonal variations, trends, and patterns that could be caused by environmental factors or other variables [14].
Inferential statistics including analysis of variance (ANOVA) was performed to check if there were significant differences in the WQPs over the studied period. ANOVA is a parametric test that compares the means among these WQPs to check for statistical significance differences in the means. Before conducting the ANOVA test, the assumptions underlying the test were first assessed to ensure that the test was valid. The assumptions include homogeneity of variance, independence of the observations, and normality. Violations of these assumptions may result in inaccurate interpretations, bringing into question the reliability of the results [14,88,89]. In any significance test, the derived significance or p-value is compared to a set or predetermined alpha (α) value to check for significance and rejection or otherwise of a null hypothesis. The α value is the measure of the likelihood of rejecting the null hypothesis when it is true. When the p-value is less than the α value, it means the difference observed is statistically significant and hence the null hypothesis can be rejected; we failed to reject the null hypothesis when the p-value was greater than the α value. This situation arises when there is no statistically significant difference in the observed values. The most frequent values used for the statistical test were 0.01 and 0.05 with a value of 0.01 used for a more rigorous analysis [88,90,91]. This study used a α value of 0.05.
Spatial analysis. The spatial interpolation function within ArcGIS Pro software was used to spatially distribute the WQPs across the studied area. The two widely used spatial interpolation methods for environmental and water quality studies are inverse distance weighted (IDW) and kriging. These interpolation methods are spatial and 3D analyst tools used in converting the vector data (point values) to raster maps to simulate the entire distribution of the study area [30,92,93,94,95]. IDW is the simplest and most computationally effective approach for interpolation techniques, which assumes that values at unsampled localities are more significantly influenced by sample points nearby [94]. Kriging, on the other hand, performed spatial interpolation by taking into consideration the spatial autocorrelation and variability in the data. This algorithm uses a variogram that captures the spatial dependence of the data for producing optimal estimations by reducing estimation errors and effectively dealing with irregularly spaced data. Several types of kriging techniques, such as universal, ordinary, and indicator, exist [96,97]. Our study used ordinary kriging interpolation, which assumes autocorrelation and is said to be a good option for spatial interpolations. Kriging interpolation offers superiority in handling data uncertainty and producing accurate results [96,97]. To carry out the spatial interpolation, we computed the average WQPs at each station, with the approximate coordinates of the stations, we imported the csv. containing these values into ArcGIS using the XY Table to point (data management tool), we performed the kriging interpolation and then extracted the boundary to the lake boundary using the Extract by Mask tool (Spatial Analyst tool).
2.4. Impact of the Environmental and Hydrological Parameters on the WQPs
We assessed the impact of hydrological and environmental factors such as total inflow and outflows, reservoir storage, evaporation, and water surface elevation on the lake’s water quality using scatter plot analysis to check for trends and relationships. Several studies have outlined the effects of either or some of these variables on water quality. Researchers in [27] found reservoir storage to impact the variability of WQPs, including TDS and TSS. TDS and TSS concentration significantly impacted water flows along river channels containing lakes. Reservoirs can cause settlement of suspended sediments resulting in a reduction in water turbidity. High temperatures particularly during the summer and fall time result in an increment in the rate of evaporation from the lake surface, which could impact water qualities such as TDS concentrations [98].
2.5. Impact of Stratification and Lake Mixing on the WQPs
Lake stratification occurs because of temperature gradient, leading to the separation of the lake into warmer surface layers and a denser and colder bottom layer. Flows into the lake from receiving waters will enter the lake’s column at levels at which their density as governed by temperature and concentrations of TDS and TSS is equivalent to the receiving water density may result in the impairment of WQPs. Stratification of lakes has been linked to the depletion of oxygen concentrations and increased concentrations of hydrogen sulfide, iron, and manganese in the bottom layer of the lake [27,70,99]. We carried out a stratification analysis to analyze the impacts of stratification and lake mixing on WQPs. We categorized the data based on the zones to perform descriptive analysis to explore the impact of stratification. Additionally, we performed vertical profile analyses using the relationships between depth and WQPs to identify possible trends in WQPs.
3. Results and Discussion
This section presents a thorough analysis of the results along with a discussion of the results obtained in the investigations of the spatiotemporal variation of TDS, TSS, temperature, and DO in Lake Mead. The results shed useful insight into the changes that have been occurring in the lake. This section of the paper is grouped into a summary of the entire study area results and station-specific analysis.
3.1. Spatiotemporal Dynamics of WQPs
This subsection describes the spatiotemporal variation of the studied WQPs in Lake Mead. WQPs in the lake are largely influenced by combinations of anthropogenic activities such as urbanization, discharge of untreated wastewater into the lake, agriculture activities in and around the lake’s watershed, and natural processes such as hydrological cycles, climate changes, and abiotic and biotic interactions in the lake ecosystem. These activities have a huge influence on the overall water quality of the lake’s water and the sustainability of the lake’s ecosystem. Investigating the spatiotemporal trends in these WQPs will offer managers, researchers, and decision and policy-makers invaluable insights into the driving forces, catalyzing the changes and dynamics in the lake’s water quality.
The analysis presented here includes monthly, seasonal, and yearly variations to aid in understanding the dynamics of Lake Mead’s aquatic ecosystems and the possible effects of human activity and environmental changes in the lake.
The summary descriptive statistics of the TDS, TSS, temperature, and DO concentration are presented in Table 2. These analyses offer insight into the overall and time variations in the studied WQPs. We see from the summary statistics that the amount of data for TSS (2757) compared with other parameters (2964), because sampling was not carried out at the temporary station (Station 9) co-operated by LVVD and SNWA.
Overall, the average TDS concentration at the sampling locations was 635 mg/L, which is a little bit higher than the reported 610 mg/L natural TDS of the lake [22], and higher than the EPA-recommended TDS of 500 mg/L [40]. Although TDS is non-enforceable federal regulations, it has cosmetic and aesthetic effects including the decoration of skin and teeth, as well as affecting the taste, color, and order of the water [100,101,102]. To reduce the TDS contents in their drinking water, many businesses and residents in the LVV employ ion-exchange-based water softeners that contain brines of sodium or potassium chloride (KCl or NaCl). It is possible that the regenerant salt created by the ion exchange process will not be removed during wastewater treatment and will instead be released into sewer pipes, where it will then be released into Lake Mead [22]. Over the past three decades, LVV has had a significant rise in population, which has led to an increase in commercial, residential, and industrial discharges. TDS concentration release into Lake Mead may likely continue to increase throughout the period as the population in the LVV continues to increase and with the existing pattern of drought in the Colorado River [103] making it a parameter of concern. The TDS concentration in the LVW will increase to approximately 14% in the year 2035, and a 10% population reduction with water softeners will also reduce the TDS concentration by 126 mg/L, according to a study by [103] to assess the TDS contribution to the Colorado River associated with the growth in population in LVV.
The overall mean TSS on the lake is estimated to be around 5.2 mg/L, an indication of low levels of TSS concentrations in the lake, which was in agreement with the reported values for 2005–2007 [50]. The reported values were slightly higher in the Colorado River and Overton Arm of the Lake [50], meaning the tributaries are conduits of sediment transport to the lake. Forest and wildfires have been reported to have caused devastating changes to the land cover of the upper part of the lower Virgin River Watershed. These changes coupled with higher rainfall and runoff induced by climate change may lead to a substantial amount of erosion, which could impact the TSS concentration in Lake Mead from the Virgin River, which was categorized as part of the Overton Arms of the lake [50]. Researchers in [104] estimated that 6.6 million m3 of the sediment was eroded from the Las Vegas Wash within 25 years (an estimated 263,965 m3 per year representing about 0.59% of the total sediments into the lake) and deposited in the Las Vegas Bay in Lake Mead. The amount of sediment in the lake is said to have declined drastically following the completion of the Glen Canyon Dam (Lake Powell) in 1963, located a few hundred miles upstream [20,50], which could be the reason for the decline in TSS in the lake [16,50].
The average temperature of the lake has been reported to range from 11–12 °C during the winter months (December–February). Temperatures stay at about 12 °C throughout the water column during the years of complete mixing. During the period of incomplete mixing, the top half of the lake stays at 12 °C, while the bottom stays at around 11 °C [70]. Starting from March, the lake warms at different rates and with tributaries being warmer than the deeper open-water areas due to their shallowness. Stratification in the lake is first noticed in early April or late May, and starts from the shallower bays and top areas of 10 m regions for the open-water region of the lake column through the lake water column by mid-July when temperatures are above 25 °C. The lake remains stratified till late November and early December when the water surface temperatures decrease to about 16 °C with temperature differences decreased to an average of 5 °C. The region of the water column with the highest temperature change known as the thermocline is located between depths of 20 and 30 m [70]. A stratified lake is divided into three layers, namely the epilimnion, which is the uppermost layer and is exposed to direct light, the middle layer called metalimnion, and the bottom layer called hypolimnion, which often has a lower DO concentration [2,70,82].
The average temperature obtained under the studied period was 18.3 °C, which is greater than the reported 2001–2009 value of 13.66 °C recorded at the USGS Station 09421500 located below the Hoover Dam, about the same location as Station 9 in this study [16]. Other studies have reported average temperatures for the Lake Mead National Recreation Area, which consist of the lakes Mead and Mohave to range from 4 °C in the winter months (December) to 43 °C in the summer months (July) [69]. These temperature variations drive the evaporation from the lake water surface, exposing it to severe droughts, leading to stratification and water quality improvements as warmer temperature increases biological reactions in the waterbodies, stimulating the growth and proliferation of algal, which compete with aquatic organisms for oxygen potentially creating an anoxic condition in the lake water ecosystem. This algal release to waterbodies impacts the quality of the lake water ecosystem. Thermal stratification could also disrupt lake mixing and further circulation of the water, leading to restrictions in oxygen transfer from the epilimnion to the hypolimnion layer. The temperature may also affect the solubility of the salts in the water and the water pH [2,45,51,55,70].
The overall average of DO obtained in this study was 7.7 mg/L, which was less than the 7.93 mg/L value recorded between 2001–2009 at the USGS station 09421500 below the Hoover Dam as Station 9 in this study [16]. Although the reduction in DO over the period appeared to be marginal, it could be a result of the influx of nutrients in the lake leading to the eutrophication of nutrients, which implies the overall health and quality of the lake’s water [38]. Recent increases in population growth and anthropogenic activities in the LVV could increase the load of wastewater treatment discharges into the lake, which has a potential impact on the DO concentration in the lake [50,105]. Additionally, thermal stratification and reduced and incomplete mixing coupled with the negative impact of climate change could be driving forces controlling and impacting the DO concentrations in the lake. The lake is facing a record-high drought event resulting in deep drops in the water level [19,20,22,50,70].
The time series of the studied WQPs is presented in Figure 3 and Figure 4, respectively for Station 1 (LWLVB1.2) representing the LWLVB stations and Station 6 (BB3) representing the Boulder Basin stations. Temporal variations in WQPs in the LWLVB stations and Boulder Basin stations each follow a similar trend, hence the reason for representing each of these parts of the lake with one station is to aid in the temporal assessment of the variabilities in the WQPs in each of these regions. The time series analyses presented in Figure 3 and Figure 4 aid in gaining an understanding of the changes in the lake over the period and serve as a foundation for protecting, managing, and preserving the lake’s water. The results shown indicate the greater impairment of water quality in the LWLVB stations compared with the basin stations due to the associated impact of discharges from the wastewater treatment into the lake, as described in Section 3.2.
It can be seen from the figures that all the TDS and temperatures showed a similar trend with values rising around the start of the year and dropping after the middle of the year. During the middle of the year, around summertime, temperatures are higher, which results in evaporation coupled with a reduced amount of precipitation, causing a rise in the contents of dissolved ions and hence increased TDS in the lake [40]. Warmer water temperatures can cause a rise in the rate of metabolisms of aquatic organisms to promote increased organic matter and nutrient cycling, which can raise TDS levels. Additionally, temperature increases intensify the drying of streams, resulting in a rise in TDS concentration [47]. The temperatures of the driest desert valleys on the Colorado River Basin, like areas occupied by Lake Mead, have been reported to have a maximum daily temperature of 48.9 °C. On the other hand, increased precipitation and decreased evaporation during colder months may result in greater water dilution and lower TDS levels. The rate of metabolism in aquatic environments can also be slowed by colder temperatures, which can result in less organic matter and nutrient cycling as well as lower TDS levels. TSS, on the other hand, showed varying distribution across the period, with values fairly constant around 5.0 mg/L, which is less than the average tolerance level of 13 and 90 mg/L, respectively, for bottom invertebrates and fishes [27]. The patterns behave a little differently from that of TDS and TSS with spikes around the mid to end of the year. Changes in the TSS in the lake could be attributed to the hydrological processes including precipitation and runoff events, topography, and the process of sedimentation [27,50,104]. Snowmelt and precipitation events occurring around the middle of the year could be the driving force behind the sedimentation of the lake. Human activities such as agriculture activities and recreational events in and around the lake, including boating and fishing in the lake during the period of summertime, could also be a potential cause for the rise in TSS [71]. Swimming, boating, and fishing activities in the lake could disturb the sediments settled at the hypolimnion and shorelines [16]. The activities could cause resuspension bottom deposits which are propelled by hydrology and sediment motions in the lake, leading to increased TSS concentrations in the lake [106].
The DO concentration behaves in the opposite pattern as that of TDS and temperature, and almost in the opposite pattern as TSS. This confirms the impact of increased TDS, temperature, and TSS on DO concentrations in the lake. Increased TDS concentration, temperature, biological activities, TSS, and nutrient proliferations may result in excessive growth of algae, leading to increased oxygen consumption in the water, creating anoxic conditions and subsequently reducing the DO in the waterbody. Algae blooms may also block sunlight and create anoxic conditions [31,56,57,59,60,61].
We utilized the kriging spatial interpolation, as described in Section 2.3, to create a spatial distribution map of the WQPs using the average sampled WQPs for all of the stations (TSS was not sampled at Station 9) and presented the results in Figure 5 with coordinates of 36°3′45.27″ N, 114°45′41.25″ W. It is seen from the images that all the WQPs except DO showed a reduced concentrations from the LVW area to the Boulder Basin regions of the studied area. The increase in DO in the Boulder Basin also indicates an improvement in the water quality in the basin. Variations in the quality of water throughout the studied area (between the LVW and Boulder Basin region) could be due to varied reasons, including the fact that LVW is the main channel for draining the LVV and conveying effluent flows from various wastewater treatment facilities into the lake. The wastewater treatments return over 719,228 m3/d of wastewater effluents to the Boulder Basin of the lake. Because of this significant amount of wastewater received by the lake, the lake is continually and intensively monitored by various agencies at various levels, ranging from local to state and federal levels [70]. The transported treated wastewater effluent into the lake impacts the lake water quality. The lower LVW was at a point in time added to the Clean Water Act’s 303(d) list of waters that are impaired in Nevada due to the high TSS concentrations [50]. Rivers and streams in this list require monitoring and assessment every other year. The section was however removed from the list in 2004, but efforts still need to be put in place to ensure overall protection of the reach and the lake water ecosystems [50]. Before urbanization, the LVV drainage system into the Colorado River was only composed of a few marshes and natural springs, and a series of merging dry washes. The drainage systems increased significantly with wastewater volumes in commensuration with the faster population growth by the late 20th century which has created negative feedback consequences on the floodplain and the Lake Mead water quality [22,103,104].
In addition to the state of water received through the LVW into the Boulder Basin, the basin also received water from the other tributaries of the lake, namely the Colorado River, which supplies about 97% of the flow, Muddy, and Virgin Rivers [16,62]. The limnology of Lake Mead is largely controlled by the magnitude and rate of inflow from the Colorado River into the Boulder Basin [76]. Each of the sources of inflow into the lake has its distinctive qualities in terms of DO, temperature, and nutrient concentrations, among other parameters that determine the lake’s quality as water enters and moves through the entire lake [62]. Flows from the Colorado River are colder and carry less TDS than the lake’s preconditions, making the water flowing in the sink and flowing into the bottom of the lake as the cooler flow is denser than the warmer water of the lake [62]. Conversely, the temperature of the water from the Las Vegas Wash into the lake varies all year round. During the winter month when temperatures are low, it flows into the lake along the lake’s bottom, but the reverse occurs in the spring, summer, and fall seasons when it is fairly and usually warm. The water flows through the basins high up in the water column [62]. The lakes undergo stratification due to these temperature gradients. The mixing of the lake may be impacted by wind-related instability and the water currents. On a large scale, the land undergoes complete mixing (top to bottom) once every other year, which occurs when the lake’s depth, surrounding air temperatures, and magnitude of flow from the Colorado River are just ideal to maintain a constant lake temperature. Drought could however alter how likely it is for different strata or layers of stratification to mix. Changes in the lake due to water level and lake mixing could have an impact on the survival and growth of native fish, algae, and other species in these reservoirs [62].
The monthly variations in the WQPs for the period under study are presented in Table 3 and Figure 6. The findings demonstrate distinct seasonal fluctuations in the WQPs in Lake Mead throughout the studied period.
TDS concentrations generally rise from the beginning of the year and peak around May to July (with the maximum values). The higher water demand during the summer months and subsequent evaporation, which causes the concentration of dissolved solids, is most likely the driving factor for the rise in TDS. TDS levels start to steadily decline after July/August, until the end of the year. TSS levels remain constant in the lake, with levels spiking around July to October, which could be explained by the increased monsoon precipitations in the summer and the increased recreational activities including boating, swimming, skiing, and fishing in the lake around these periods. These recreational activities disturb the water and trigger the rise in settled sediments. An increase in human activities such as mining, construction, and agricultural activities around these months could also lead to contributing to the rise in TSS as the sediments of these activities are transported by monsoon storms to the lake. Temperatures vary in the lake, with the highest values obtained around June–September. Peak temperature of >31 °C obtained in August–September, which is consistent with a study carried out by [69]. This study reported the maximum near-surface temperature of the lake to have occurred in August and in correlation with the maximum air temperature. The authors also reported January and February as the months with minimum near-surface temperatures, which our work corroborated, as seen in Table 3. The variations in temperatures are explained by the yearly rise in solar radiation and air temperature that occurs in the summer. The Las Vegas area experiences high temperatures and moderate humidity levels of about 11 to 34% during the summertime [107]. The average DO rises from the beginning of the year (January to March) when the lake is probably mixed and declines continuously until September when it is stratified, and peaks in December, a clear indication of the impact of stratification and lake mixing on the DO [70]
All WQPs have relatively low standard deviation values, with few months showing significant deviations. The high standard deviations could be attributed to the impact of seasonal changes resulting in temperature variations, precipitations, and the change in the lake’s ecology.
These findings show WQPs are vulnerable to considerable temporal fluctuations, which has significant implications for the management of Lake Mead and the ecosystems that surround it. Hence, to ensure sustainable water use and maintain the biological integrity of the lake and its environment, monitoring and management efforts should take these oscillations into account.
The spatial distribution of the seasonal variability in WQPs for the period under study is presented in Figure 7. The seasons have been categorized as winter (1 December–28/29 February), spring (1 March–31 May), summer (1 June–31 August), and fall (September 1–November 30).
From the results presented in Figure 7, there is a significant change in the water quality from the LVW area and the Boulder Basin across all seasons. The Las Vegas Wash and Bay regions of the lake are said to have great concentrations of nutrients due to the discharge of nitrogen and phosphorus from the three wastewater effluents into the lake through the bay. Water quality impairment in the bay and the boulder basin are also said to be influenced by other human-induced and natural changes in and around the lake. Although stormwater events are sporadic occurrences, they are linked to increased phosphorus concentration and are thus described as acute contributors to the algal growth in the lake [70]. The concentration of these WQPs is influenced by the discharge volumes and the flow velocity. The velocity of flow determines the capacity of wash-offs and the roughness of the surface transporting the water [12] changing the level of impairment from the LVW area to the Boulder Basin. The continuous growth in population in the LVV will likely result increased wastewater discharges from highly developed watersheds within the valley and a plausible increased in nutrient loading leading to algal production, water contaminations by industrial and disinfection byproducts, pesticides, endocrine disrupting compounds (i.e., pharmaceuticals), heavy metals, personal care products, volatile organic compounds, human and animal pathogens, and influx of non-point source pollutants including pesticides and herbicides, as well as nutrients used in treating golf courses and lawns [70].
Winter periods in the lake are characterized by quiet activities. Less recreational opportunities occurred in the lake. The occurrence of winter storms, however, may cause more sediment and nutrient runoff from nearby areas, which may influence the water quality. Spring periods are characterized by increased hiking and camping activities. Increased human activities in this season have the potential to pollute water with trash and human waste. Snowmelt and more rain during the spring can raise water levels and increase runoff, which can affect the WQPs studied. Summer periods in the lake are characterized by boating, swimming, and fishing activities. Boating can cause waves and sediment to be stirred up, increasing turbidity, which can affect the levels of TDS, TSS, and DO. While fishing can introduce organic matter and other pollutants, swimming can enrich the water with nutrients and bacteria. Fall periods in the lake are characterized by fishing. Fish become more active and water temperatures start to cool off in the fall, making it a popular time to go fishing. Increased fishing activity has the potential to pollute the water with organic matter and other pollutants. As leaves and other organic matter fall into lakes during the fall, nutrient levels may rise, possibly impacting the levels of the studied WQPs.
The seasonal variability results presented in Table 4 and Figure 8 (located at 36°3′45.27″ N, 114°45′41.25″ W), show a moderate mean level of WQPs (value of 597.9 mg/L, 5.0 9 mg/L, and 11.80 °C) in the winter season compared with spring, summer, and fall seasons, except for DO, which exhibit a lower mean value of 7.5 mg/L in the summer, which is a direct implication of stratification. Changes in these WQPs could be attributed to several factors including evaporation due to warmer air temperatures and solar radiation and increased runoff and precipitation associated with monsoon seasons. Increased evaporation rates and decreased precipitation and runoff throughout the spring and summer may increase the concentration of dissolved solids and minerals in the lake, causing a rise in TD. Monsoon rainfalls may result in increased runoff and surface water flow into the lake [108,109]. This increase in water flow has the potential to raise the levels of TDS by transporting more dissolved solids, such as minerals and other pollutants. In addition, increased temperatures during monsoon periods may result in increased evaporation rates, which would concentrate dissolved solids even more and possibly raise TDS concentrations in the lake [43]. Increased rainfall and runoff during the monsoon season may also result in a rise in soil erosion and the transportation of sediments from construction, mining, and agriculture sites into the lake, increasing the concentration and loads of TSS in the lake. This may also result in increased turbidity, destroying the aquatic species. Temperature varies during the monsoon period [110]. Increased monsoon rainfall could lower water temperatures, particularly during heavy rain storms and cloud cover [79,111]. Conversely, the runoff generated from these storm events may cause the mixing of warmer surfaces and colder groundwater resulting in changes in water temperature. Additionally, increased rainfall and runoff could be conveyance of an influx of organic compositions including debris, algae, and leaves into the lake, which aid in microbial decomposition and oxygen consumption ultimately reducing the DO contents in the lake. Rainfall and runoff on the other side could also add oxygen-rich flows from nearby rivers and streams into the lake, rising the DO concentrations in the lake [31,56,57,59,60,61].
The yearly variations in the WQPs for the period under study are presented in Figure 9 and Table 5. Each WQP has a distinct range of values, with minimum and maximum values that are largely consistent across the time of the study.
Although the standard deviations indicate that there is some variability in the WQPs, it appears that generally, the mean values of TDS show some slight decrease over the years. TSS, temperature, and DO remain constant over the years, with mean values of about 5 mg/L, 18 °C, and 8 mg/L for TSS, temperature, and DO, respectively. There appears to be a spike in the TSS in the year 2020 to about 50 mg/L, which could be from reasons including the increased snowmelts channeling a significant number of sediments into the lake. A record snowpack that was estimated to be 140% of the mean average in the UCRB as of April 2019 led to a significant 128% above mean inflow into Lake Powell and a subsequent significant discharge and rise in Lake Mead’s level to about 332.38 m, which was about 3 m above the projected level. In April 2020, the lake level stood above 334 m due to the inflow of the above-average (107% of the mean value) mountainous snowpacks from the UCRB [112]. These flows may be conduits of sediments into the lake, as seen in the spike recorded in 2020.
There appears to be a reduction in TDS and a steady trend in TSS due to the combined efforts put in place by the US Bureau of Reclamation, US Bureau of Land Management, and US Department of Agriculture, Natural Resources Conservation Service including the construction of salinity control measures and implementation of non-point source management plans [40].
3.2. Station-Specific Analysis
The summary of descriptive statistics for the station-specific analysis are presented in this section. The measures of central tendency and dispersion are presented for each station to aid in understanding the spatiotemporal variations of each WQP across these stations and in the identification of possible environmental factors causing the variations.
The findings are presented in the appendices. The results are presented in Appendix A (Table A1, Table A2, Table A3, Table A4, Table A5 and Table A6), Appendix B (Table A7, Table A8, Table A9, Table A10, Table A11 and Table A12), Appendix C (Table A13, Table A14, Table A15, Table A16, Table A17 and Table A18), and Appendix D (Table A19, Table A20, Table A21, Table A22, Table A23 and Table A24) for TDS, TSS, Temperature, and DO, respectively.
The results presented in the appendices demonstrate that the WQPs levels are very variable between stations in the LVW area to the Boulder Basin. The changes in the WQPs between Boulder Basin and LWLVB stations are likely to be complicated and multifaceted. Specific reasons for the changes in the WQPs in the LWLVB stations include the source of water in the LVW. The wash is a conduit of water from stormwater runoff, groundwater, and wastewater treatment plants that can cause a spike in WQPs. In contrast, the Boulder Basin stations receive much of the flow from the Colorado River. The water quality received from these sources varies. The amount of TDS that enters the lake from the Lake Powell region of the Colorado River is approximately 500–550 mg/L, while approximately 600–650 mg/L is contained in the water drawn from the lake [74].
LVW drains much of the flows and open valley of an area of about 1520 sq. mi through a distance of approximately 6.8 mi. into Las Vegas Bay in Lake Mead [104,107]. Since the establishment of Las Vegas, Nevada, in 1905, LVW has been characterized by intermittent flood deposition with a low volume of wastewater effluent discharged into the wash over the first three decades. By the late 20th century, wastewater volumes surged in line with faster population growth, which had a series of feedback consequences on Lake Mead’s WQP [104]. LVW is close to Las Vegas city compared with Boulder Basin. The land use of the LVV area is 85% undeveloped, with the remainder making up residential, roads, commercial, industrial, park, and public areas, as reported in a 2003 study [107]. Both the developed and undeveloped areas are a significant source of runoff, with a spike in water quality. LVV has seen a continued expansion. The continued expansion of the valley has seen an increase in salinity released from urban areas in the wastewater effluents released into the lake through the LVW. The rising use of ion-exchange-based water softeners (i.e., salt brines) in homes and businesses to treat the water contributes significantly to the TDS in wastewater effluents [22].
The spatial variation of WQPs in the measured stations is largely consistent with the reported studies. For example, researchers in [18] reported total organic carbon (TOC) concentrations of about 3.0 mg/L in the Boulder Basin (CR346.4) close to the Hoover Dam compared with the 6.0 mg/L LWLVB stations located in LVW. Additionally, researchers in [50] reported a mean TSS concentration of 6.95 mg/L at station LVB2.70 located in LVW compared with the 5.0 mg/L recorded at CR346.4. LVW is a conduit of wastewater containing elevated chemicals including disinfection-by-products (DBPs) such as trihalomethanes (THMs) in the lake [18]. LVW is a conduit of wastewater effluents, seepage water, and urban runoff into the lake [18]. The residents of LVV employ ion-exchange methods to soften their water due to the elevated salt content. The by-products of the salt brines are discharged into the lake through the wastewater treatment plants with no treatment raising the levels of the WQPs in the lake, as evident in the LVW section of the lake [22]. All of the wastewater generated from the indoor water used in LVV is directed to three wastewater treatment plants, namely the City of Henderson, the City of Las Vegas, and the Clark County Water Reclamation District (CCWRD) treatment plants. Effluents with impaired quality from these wastewater treatment plants are channeled into LVW and subsequently into the lake [103].
3.3. Detection of Significance Levels in the Trend of WQPs
We utilized inferential statistics to check for the monthly, seasonal, and yearly variability in the WQPs.
3.3.1. ANOVA Test
The results from the assumption test are presented in Table 6 and Table 7. The Shapiro– Wilk Normality Test was performed to check if the WQPs were normally distributed while the Levene Homogeneity Test was performed to check for homogeneity of variance in the WQPs. The test statistic of the Shapiro–Wilks Normality Test is a measure of the amount of departure from normality. The values of test statistics closer to 1 indicate a normal distribution. The test statistic for the Levene Homogeneity of Variance Test on the other hand is a measure of the differences in the variations between groups here the WQPs that are being compared. Larger statistical values are an indication of higher significant differences [113].
The data collected meets the independence of the observations assumption, as the data were collected at different locations (stations), with each observation distinct from the others. To check for the normality, the null hypothesis (H0) is that each WQP data is normally distributed, and the alternate hypothesis (H1) is that each WQP data are not normally distributed. The H0 for the Levene’s homogeneity of variance test is that the variances of the groups (TDS, TSS, temperature, and DO) are equal, while H1 is that the variances of these WQP groups are not equal [14,88,90,114,115].
From the results presented in Table 6 and Table 7, it is seen that the p-values for the WQPs are less than 0.05, showing that the null hypothesis for the existence of normality and the homogeneity of variance (variances being equal) was not met and hence the null hypothesis is rejected, which is an indication that the data do not meet the assumptions for performing ANOVA test.
3.3.2. Kruskal–Wallis Test
As the assumptions of the parametric ANOVA were not met, a non-parametric analysis called Kruskal–Wallis Test was performed to check if there was a statistically significant difference in the WQPs collected monthly, seasonally, and yearly. The Kruskal–Wallis test compares the groups using rank sums instead of the means and has been applied in several studies including engineering and social sciences. The test computes the sum of ranks for each group after ranking the observations within each group to determine any significant difference in the medians. The test statistic of the Kruskal measures the number of variations in the distribution of the rankings among the values of the groups under comparison [14,116,117].
The results of the analysis for WQPs are presented in Table 8, Table 9 and Table 10. From the results presented in Table 8, it is observed that there are at least months with a p-value < 0.05 indicating a substantial variation in the WQPs at those months. For TDS, the months of February, August–October, and December had p-values lower than 0.05. This shows that at least two of these months’ had a median TDS level which differed significantly from others. Similarly, TSS shows statistically significant monthly variations in June and September–November, an indication of impact of the seasonal influx of sediments into the lake possibly due to water management practices, runoff, and variability in weather patterns. There were no temperature variations in each month, an indication that temperature values remained constant within each month. There were also statistically significant differences in DO for each month, except for March and September, which could be due to lake mixing during these months [70].
The results presented in Table 9 and Table 10 show that there was no statistically significant difference in WQP levels in each season and year measured within the studied period at the sampling locations, an indication that the variability in these WQPs in Lake Mead is relatively consistent throughout each season and year based on the Kruskal–Wallis Significance Test.
Further analyses were performed to assess the level of variations in the WQPs across each month (month to month), season (season to season), and year (year to year), each as a single unit observation data, as shown in Table 11. The results reveal statistically significant differences in median values throughout different periods. All of the WQPs show statistically significant differences month to month, season to season, and year and year. These differences are largely due to the changes in weather patterns, seasonal activities, anthropogenic activities such as farming and industrial activity, natural changes such as urban growth, and activities of aquatic organisms in the lake.
3.4. Impact of the Hydrological Parameters on the WQPs
We assessed the impacts of hydrological parameters such as evaporation, outflow, storage, and lake water surface elevation, and the inflows on the studied WQPs using the BB3 (Station 6) station. This station is in the Boulder Basin not far from where the outflow, storage, and water surface elevation were measured. Station 6 was chosen for this analysis as it contained data for all of the WQPs analyzed for the years under study.
The total inflow into the lake in the 1975/1976 water year (October–September) was about 11 billion m3 with 98% coming from the Colorado River and 0.6% from the LVW [76]. The lake has, however, seen a significant reduction in storage, with the level standing at 26.63% of its capacity as of 31 May 2022, after dropping to a record low level in June 2021. The lake level fell below full capacity since 1983 due to intense drought and a rise in water demand [112]. Evaporation in the lake is on an extreme record, leading to significant water loss. The annual evaporation losses from the lake are estimated to be about 10% of the average annual inflow [16]. Studies have also linked reservoir storage to the changes in WQPs. Reservoirs alter the TDS variability in the downstream rivers due to their storage. There are month to month variations in the TDS concentration below dams due to the combination of high-concentration low flow waters and low-concentration spring runoff [42]. There is a reduction in TDS after the construction of dams. This is evident at the Glen Canyon Dam where the pre and post-dam monthly TDS has been reduced to about 600 mg/L. Similar traits are found below the Flaming Gorge, Hover Dams, and Navajo, which have significantly improved water quality during the winter, summer, and fall seasons [42].
Despite the reported impact of flows, storage, and water surface elevation on WQPs, our study found a no clear trend in changes in these hydrological parameters on the lake’s water quality. The results of the hydrological assessment are presented in Figure 10, Figure 11 and Figure 12. Although there is no clear pattern in the relationship between the hydrological factors and WQPs, we found the lowest values of TDS and temperature with the highest values of inflow. The reverse was observed with DO due to the depletion by chemicals associated with inflows into the lake. TSS concentrations, however, remained constant with the hydrological factors as the values themselves did not vary for station BB3 and was thus not presented as one of the figures. The opposite variations in these WQPs were seen with the outflow rates. The results also show relatively low values of TDS and temperature with increased storage and reservoir water surface elevation. The opposite phenomenon was observed for DO, as shown in the figures. DO concentration in the water is reported to be impacted by the volume and velocity of the water sources [65]. Trends and cycles of DO concentration have been found to have some relations with reservoir drawdown and hydrology [64]. An increase in temperature influences the biological processes in the water including growth, reproduction, and metabolism, leading to a reduction in DO levels. For every 10 °C rise in water temperature, there is a corresponding doubling in metabolism by two folds. A rise in the water temperature could decrease the viscosity and density of the water, hastening the settling process of suspended solids. The resulting sedimentation reduces the design and operational life span of reservoirs [56].
3.5. Impact of Stratification and Lake Mixing on the WQP
We assessed the impact of stratification and lake mixing on the WQPs in the lake ecosystem. The lake’s stratification has an impact on the lake’s general water quality, biosystems, and nutrient cycling.
Salinization of aquatic environments could disrupt their biological function, initiate trophic cascades, and impede plant growth. Lake stratification and mixing are influenced by the density profile of its water column, which is controlled by the temperature of the freshwater. In freshwater systems, the addition of salt ions leads to an increase in water density, making salinity overtake the temperature in regulating the water density. The buildup of anthropogenic salts in the lake can thus increase the density gradients leading to disruption and delay of lake mixing [45]. The results from the stratification analysis in Table 12 and Figure 13 show distinct variations in the WQPs in the zones of the lake, with the epilimnion (top layer) showing a high amount of TDS, TSS, and temperature compared with the hypolimnion. The opposite is seen for DO, indicating the impacts of stratification on these WQPs. Stratification of the lake leads to nutrient cycling, accumulation of sediments, and oxygen depletion, impacting light penetration, and thermal distribution of the lake water. Intense stratification is witnessed in the summer months. TSS in the surface is likely to increase because of less mixing and improved settling. Conversely, TSS is higher and distributed uniformly during the period of lake mixing. From the figures, we see an amount equal amount of these parameters around December and January, indicating a period of complete turnover of the lakes resulting in top to bottom mixing of the WQPs. The epilimnion often has a higher temperature due to exposure to sunlight and wind-actuated mixing. The metalimnion functions as a thermal barrier resulting in quick temperature changes. As a result of oxygen exchange with the atmosphere, the epilimnion, which is exposed to the atmosphere and undergoes mixing, often has greater dissolved oxygen levels compared with the hypolimnion, which is isolated and receives less oxygen from the air. In contrast with the metalimnion and hypolimnion, where particles can build up, the epilimnion may have lower amounts of suspended sediments due to its better mixing. TDS may vary at different strata as the metalimnion could be a barrier preventing the vertical mixing of the lake, leading to the buildup of dissolved solids in the epilimnion, as seen in Figure 13 [45,62,70].
4. Conclusions
Lake Mead is a complex waterbody with unique hydrodynamic and water quality dynamics. The lake is almost always stratified and does not always undergo complete mixing. The incomplete mixing of the lake could lead to an erroneous inference on the dynamics and the conveyance of the fate of water sediments and dissolved solids transported into the lake [16]. A significant amount of the lake’s bioavailable nutrients from the discharge received from the LVW is retained in the Boulder Basin, making it the region of highest productivity in the lake. It is uncommon for a reservoir to have its highest production in the basin farther downstream, as seen in the case of Lake Mead. This is in contrast with the more commonly seen diminishing productivity gradient from upstream to downstream [16]. The lake is impacted by elevated spikes of dissolved solids and increased temperatures and increased biological activities, leading to the depletion of DO required for the growth of aquatic organisms.
This study monitored and analyzed the spatiotemporal variation of key WQPs impacting the quality and sustenance of the lake water resources. Effective monitoring of these WQPs requires a multifaceted approach, as no single known approach could efficiently reduce the number of sediments and dissolved solids in one single waterbody.
The results obtained from the spatiotemporal analysis show a significant number of contaminants from the Las Vegas Wash in the lake. An elevated TDS concentration of up to over 1000 mg/L and TSS of almost 50 mg/L were observed in the lake, which has the potential to disrupt the biological function, initiate trophic cascades, and impede plant growth, as observed by the depleted DO in the oxygen. Stratification of the lake is also enhanced by the building of anthropogenic salts in the lake, leading to increased density gradients and subsequently disrupting, diminishing, and delaying the mixing of the lake for oxygenations [45].
Statistically significant variations in the WQPs were observed throughout various months, with some parameters exhibiting greater variance than others. This is largely due to the changes in weather patterns, seasonal activities, and anthropogenic activities such as farming, urban growth, and biotic activities in the lake. Further analysis performed with the Kruskal–Wallis Significance Test shows no statistically significant difference in the WQPs in each season and year, an indication that the variability in these WQPs in Lake Mead is relatively consistent throughout each season and year. We also found a link between hydrological parameters, including the reservoir inflows and releases and WQPs, although there was no clear pattern in the change. We observed no clear trend of influence of outflows and inflows on TDS, temperature, and DO. TSS concentrations in the lake, however, remain constant, irrespective of the inflows and outflows, possibly due to the settling of the sediments and the reservoir capacity.
The findings from this study could be utilized in understanding the spatiotemporal dynamics of the WQPs in Lake Mead in the face of stratification and turnovers for making crucial, educated decisions about water usage, treatment, and conservation.
Further studies will need to be carried out to quantify the impact of anthropogenic activities, including releases from the wastewater treatment plants and analysis of the nutrient dynamics in the lake. Studies may also be conducted to quantify the impact of these WQPs on the overall ecology and ecosystem of the lake.
Author Contributions
G.E.A. contributed to the conceptualization, methodology, analysis, and original and final writing of the manuscript. H.S. and S.A. both contributed to the conceptualization and writing—review and editing, and supervision of the manuscript. All authors have read and agreed to the published version of the manuscript.
Funding
This research received no external funding.
Data Availability Statement
Data and codes used for this study are available upon request.
Acknowledgments
The authors acknowledge Captain Scott H. Schiefer of the city of Las Vegas for providing the water quality data and the help in understanding the key operations regarding the data and the dynamics of the lake. We extend our gratitude to the Bureau of Reclamation for providing us with hydrological data. We are also thankful to David James of the Department of Civil and Environmental Engineering and Construction at the University of Nevada, Las Vegas (UNLV), for his help in obtaining the water quality data used for this study.
Conflicts of Interest
The authors declare no conflict of interest.
Appendix A. TDS Variations for the Stations Sampled from 2016–2021: All Values Are in mg/L

Table A1.
Monthly variations in TDS across each sampled station (LWLVB stations).
| LWLVB1.2 | LWLVB1.85 | LWLVB2.7 | LWLVB3.5 | |||||||||||||
|---|---|---|---|---|---|---|---|---|---|---|---|---|---|---|---|---|
| Year | Min | Mean | Max | Std | Min | Mean | Max | Std | Min | Mean | Max | Std | Min | Mean | Max | Std |
| 1 | 568.0 | 637.6 | 854.0 | 71.2 | 580.0 | 616.7 | 657.0 | 29.1 | 581.0 | 615.3 | 681.0 | 26.0 | 552.0 | 609.1 | 686.0 | 32.1 |
| 2 | 576.0 | 643.6 | 783.0 | 50.9 | 568.0 | 622.3 | 708.0 | 39.0 | 552.0 | 600.6 | 685.0 | 34.0 | 541.0 | 594.3 | 657.0 | 27.0 |
| 3 | 579.0 | 709.7 | 995.0 | 97.1 | 565.0 | 652.5 | 836.0 | 59.2 | 551.0 | 611.8 | 679.0 | 33.7 | 535.0 | 597.0 | 699.0 | 34.1 |
| 4 | 578.0 | 740.7 | 963.0 | 105.7 | 561.0 | 658.9 | 821.0 | 61.8 | 459.0 | 619.0 | 727.0 | 56.4 | 538.0 | 597.9 | 699.0 | 31.7 |
| 5 | 587.0 | 746.6 | 1030.0 | 126.5 | 559.0 | 681.2 | 865.0 | 77.9 | 554.0 | 627.2 | 803.0 | 55.8 | 546.0 | 604.4 | 715.0 | 37.6 |
| 6 | 555.0 | 748.9 | 1010.0 | 131.0 | 552.0 | 698.2 | 957.0 | 97.0 | 533.0 | 634.9 | 766.0 | 60.0 | 493.0 | 609.8 | 733.0 | 50.6 |
| 7 | 593.0 | 752.7 | 1030.0 | 113.4 | 560.0 | 703.6 | 933.0 | 87.4 | 556.0 | 654.3 | 748.0 | 58.5 | 550.0 | 621.5 | 697.0 | 42.1 |
| 8 | 579.0 | 730.7 | 996.0 | 103.6 | 565.0 | 695.3 | 921.0 | 77.7 | 548.0 | 647.3 | 771.0 | 60.0 | 534.0 | 626.0 | 784.0 | 53.5 |
| 9 | 575.0 | 701.5 | 931.0 | 96.2 | 546.0 | 680.3 | 894.0 | 73.8 | 547.0 | 625.8 | 746.0 | 52.1 | 535.0 | 609.8 | 781.0 | 49.1 |
| 10 | 574.0 | 681.6 | 936.0 | 71.7 | 523.0 | 642.6 | 793.0 | 49.8 | 550.0 | 620.7 | 751.0 | 41.9 | 551.0 | 592.8 | 647.0 | 25.4 |
| 11 | 606.0 | 679.6 | 851.0 | 80.9 | 580.0 | 621.8 | 731.0 | 40.6 | 563.0 | 608.7 | 698.0 | 38.7 | 542.0 | 593.4 | 649.0 | 30.3 |
| 12 | 593.0 | 622.9 | 716.0 | 35.9 | 584.0 | 608.7 | 628.0 | 13.9 | 573.0 | 603.3 | 644.0 | 19.2 | 530.0 | 588.8 | 640.0 | 28.9 |
Table A2.
Monthly variations in TDS across each sampled station (Boulder Basin stations).
| IPS3 | BB3 | CR350.0SE0.5 | CR346.4 | CR342.5 | ||||||||||||||||
|---|---|---|---|---|---|---|---|---|---|---|---|---|---|---|---|---|---|---|---|---|
| Year | Min | Mean | Max | Std | Min | Mean | Max | Std | Min | Mean | Max | Std | Min | Mean | Max | Std | Min | Mean | Max | Std |
| 1 | 540.0 | 582.9 | 624.0 | 24.7 | 557.0 | 594.2 | 633.0 | 23.9 | 551.0 | 592.6 | 629.0 | 19.9 | 527.0 | 589.7 | 632.0 | 27.6 | 535.0 | 540.0 | 582.9 | 624.0 |
| 2 | 536.0 | 572.8 | 598.0 | 19.2 | 546.0 | 595.2 | 652.0 | 35.5 | 550.0 | 589.5 | 644.0 | 35.0 | 543.0 | 594.5 | 648.0 | 33.5 | 533.0 | 536.0 | 572.8 | 598.0 |
| 3 | 521.0 | 578.9 | 630.0 | 29.7 | 541.0 | 587.0 | 653.0 | 33.3 | 540.0 | 579.8 | 626.0 | 27.3 | 549.0 | 584.3 | 625.0 | 24.9 | 529.0 | 521.0 | 578.9 | 630.0 |
| 4 | 546.0 | 586.0 | 616.0 | 20.5 | 550.0 | 594.3 | 645.0 | 30.8 | 539.0 | 579.7 | 652.0 | 33.7 | 397.0 | 569.5 | 655.0 | 78.6 | 524.0 | 546.0 | 586.0 | 616.0 |
| 5 | 547.0 | 586.8 | 611.0 | 19.8 | 553.0 | 611.8 | 789.0 | 49.1 | 542.0 | 585.9 | 629.0 | 23.2 | 525.0 | 594.1 | 641.0 | 30.4 | 532.0 | 547.0 | 586.8 | 611.0 |
| 6 | 530.0 | 583.9 | 629.0 | 27.4 | 554.0 | 609.1 | 677.0 | 37.0 | 548.0 | 588.3 | 652.0 | 31.6 | 528.0 | 590.7 | 645.0 | 35.2 | 526.0 | 530.0 | 583.9 | 629.0 |
| 7 | 541.0 | 588.6 | 661.0 | 30.2 | 564.0 | 609.3 | 686.0 | 32.8 | 545.0 | 596.9 | 700.0 | 39.1 | 552.0 | 602.6 | 667.0 | 32.6 | 552.0 | 541.0 | 588.6 | 661.0 |
| 8 | 545.0 | 589.8 | 632.0 | 26.5 | 536.0 | 612.4 | 680.0 | 37.1 | 538.0 | 592.9 | 658.0 | 32.1 | 542.0 | 597.9 | 661.0 | 32.9 | 527.0 | 545.0 | 589.8 | 632.0 |
| 9 | 528.0 | 581.4 | 629.0 | 26.9 | 542.0 | 597.0 | 657.0 | 30.9 | 539.0 | 588.1 | 665.0 | 31.0 | 552.0 | 592.7 | 630.0 | 22.5 | 546.0 | 528.0 | 581.4 | 629.0 |
| 10 | 542.0 | 575.3 | 598.0 | 17.8 | 556.0 | 583.0 | 625.0 | 21.1 | 549.0 | 576.9 | 599.0 | 15.7 | 546.0 | 582.9 | 633.0 | 25.6 | 527.0 | 542.0 | 575.3 | 598.0 |
| 11 | 545.0 | 573.7 | 599.0 | 18.4 | 559.0 | 588.2 | 632.0 | 21.8 | 548.0 | 575.1 | 617.0 | 18.4 | 549.0 | 578.9 | 631.0 | 21.0 | 546.0 | 545.0 | 573.7 | 599.0 |
| 12 | 543.0 | 575.5 | 602.0 | 16.4 | 552.0 | 593.2 | 638.0 | 22.0 | 532.0 | 568.7 | 620.0 | 23.4 | 549.0 | 581.3 | 619.0 | 20.8 | 552.0 | 543.0 | 575.5 | 602.0 |
Table A3.
Seasonal variations in TDS across each sampled station (LWLVB stations).
| LWLVB1.2 | LWLVB1.85 | LWLVB2.7 | LWLVB3.5 | |||||||||||||
|---|---|---|---|---|---|---|---|---|---|---|---|---|---|---|---|---|
| Year | Min | Mean | Max | Std | Min | Mean | Max | Std | Min | Mean | Max | Std | Min | Mean | Max | Std |
| Winter | 568.0 | 634.7 | 854.0 | 54.0 | 568.0 | 615.9 | 708.0 | 29.2 | 552.0 | 606.4 | 685.0 | 27.3 | 530.0 | 597.4 | 686.0 | 30.1 |
| Spring | 578.0 | 730.8 | 1030.0 | 110.4 | 559.0 | 663.9 | 865.0 | 67.5 | 459.0 | 618.9 | 803.0 | 48.8 | 535.0 | 599.7 | 715.0 | 34.4 |
| Summer | 555.0 | 743.8 | 1030.0 | 115.5 | 552.0 | 699.0 | 957.0 | 86.7 | 533.0 | 645.6 | 771.0 | 59.5 | 493.0 | 619.5 | 784.0 | 49.2 |
| Fall | 574.0 | 690.0 | 936.0 | 84.0 | 523.0 | 658.1 | 894.0 | 65.1 | 547.0 | 620.5 | 751.0 | 45.6 | 535.0 | 599.3 | 781.0 | 37.5 |
Table A4.
Seasonal variations in TDS across each sampled station (Boulder Basin stations).
| IPS3 | BB3 | CR350.0SE0.5 | CR346.4 | CR342.5 | ||||||||||||||||
|---|---|---|---|---|---|---|---|---|---|---|---|---|---|---|---|---|---|---|---|---|
| Year | Min | Mean | Max | Std | Min | Mean | Max | Std | Min | Mean | Max | Std | Min | Mean | Max | Std | Min | Mean | Max | Std |
| Winter | 536.0 | 577.1 | 624.0 | 20.4 | 546.0 | 594.2 | 652.0 | 27.3 | 532.0 | 583.6 | 644.0 | 28.5 | 527.0 | 588.5 | 648.0 | 27.8 | 533.0 | 587.8 | 650.0 | 28.2 |
| Spring | 521.0 | 583.5 | 630.0 | 24.0 | 541.0 | 597.9 | 789.0 | 39.8 | 539.0 | 581.9 | 652.0 | 27.6 | 397.0 | 582.8 | 655.0 | 49.4 | 524.0 | 585.4 | 648.0 | 30.0 |
| Summer | 530.0 | 587.4 | 661.0 | 27.6 | 536.0 | 610.3 | 686.0 | 35.0 | 538.0 | 593.3 | 700.0 | 34.6 | 528.0 | 597.4 | 667.0 | 33.2 | 526.0 | 594.3 | 667.0 | 33.2 |
| Fall | 528.0 | 576.8 | 629.0 | 21.2 | 542.0 | 589.5 | 657.0 | 25.4 | 539.0 | 580.0 | 665.0 | 23.0 | 546.0 | 584.8 | 633.0 | 23.4 | 527.0 | 585.6 | 654.0 | 26.0 |
Table A5.
Yearly variations in TDS across each sampled station (LVW stations).
| LWLVB1.2 | LWLVB1.85 | LWLVB2.7 | LWLVB3.5 | |||||||||||||
|---|---|---|---|---|---|---|---|---|---|---|---|---|---|---|---|---|
| Year | Min | Mean | Max | Std | Min | Mean | Max | Std | Min | Mean | Max | Std | Min | Mean | Max | Std |
| 2016 | 607.0 | 761.3 | 1030.0 | 115.4 | 593.0 | 706.6 | 957.0 | 71.7 | 576.0 | 657.8 | 803.0 | 51.4 | 580.0 | 637.2 | 733.0 | 37.8 |
| 2017 | 599.0 | 732.6 | 980.0 | 108.0 | 589.0 | 692.1 | 921.0 | 76.2 | 568.0 | 642.6 | 753.0 | 45.7 | 530.0 | 623.3 | 784.0 | 44.9 |
| 2018 | 574.0 | 698.6 | 896.0 | 95.8 | 523.0 | 655.4 | 878.0 | 68.8 | 557.0 | 612.8 | 728.0 | 43.1 | 559.0 | 597.6 | 697.0 | 30.3 |
| 2019 | 578.0 | 692.8 | 963.0 | 108.3 | 546.0 | 657.2 | 847.0 | 78.0 | 459.0 | 617.4 | 752.0 | 56.2 | 543.0 | 594.2 | 689.0 | 31.3 |
| 2020 | 575.0 | 712.2 | 996.0 | 111.3 | 563.0 | 666.1 | 849.0 | 74.8 | 562.0 | 620.2 | 751.0 | 47.7 | 493.0 | 590.7 | 685.0 | 36.8 |
| 2021 | 555.0 | 707.4 | 972.0 | 95.9 | 552.0 | 647.2 | 824.0 | 68.6 | 533.0 | 602.1 | 690.0 | 38.7 | 534.0 | 585.3 | 671.0 | 34.2 |
Table A6.
Yearly variations in TDS across each sampled station (Boulder Basin stations).
| IPS3 | BB3 | CR350.0SE0.55 | CR346.4 | CR342.5 | ||||||||||||||||
|---|---|---|---|---|---|---|---|---|---|---|---|---|---|---|---|---|---|---|---|---|
| Year | Min | Mean | Max | Std | Min | Mean | Max | Std | Min | Mean | Max | Std | Min | Mean | Max | Std | Min | Mean | Max | Std |
| 2016 | No Data | 560.0 | 633.6 | 789.0 | 31.0 | 579.0 | 620.6 | 700.0 | 28.9 | 591.0 | 625.9 | 667.0 | 21.0 | 582.0 | 619.5 | 667.00 | 20.47 | |||
| 2017 | 570.0 | 602.9 | 632.0 | 18.2 | 569.0 | 610.1 | 674.0 | 23.9 | 551.0 | 598.6 | 644.0 | 24.3 | 566.0 | 609.9 | 648.0 | 21.6 | 559.0 | 610.2 | 654.0 | 25.0 |
| 2018 | 550.0 | 577.9 | 605.0 | 15.4 | 541.0 | 582.6 | 608.0 | 16.1 | 532.0 | 574.4 | 599.0 | 14.6 | 397.0 | 579.8 | 612.0 | 34.6 | 527.0 | 581.6 | 611.0 | 16.4 |
| 2019 | 540.0 | 581.4 | 661.0 | 22.5 | 547.0 | 579.0 | 642.0 | 21.8 | 538.0 | 569.5 | 603.0 | 18.8 | 401.0 | 571.2 | 611.0 | 34.1 | 537.0 | 577.2 | 621.0 | 20.5 |
| 2020 | 528.0 | 575.0 | 615.0 | 22.6 | 542.0 | 575.3 | 623.0 | 17.9 | 539.0 | 573.5 | 608.0 | 22.0 | 549.0 | 576.2 | 603.0 | 17.3 | 551.0 | 577.4 | 608.0 | 18.7 |
| 2021 | 521.0 | 567.6 | 611.0 | 23.5 | 536.0 | 580.1 | 620.0 | 22.7 | 535.0 | 568.5 | 604.0 | 19.7 | 525.0 | 564.5 | 611.0 | 23.2 | 524.0 | 560.9 | 612.0 | 23.7 |
Appendix B. TSS Variations for the Stations Sampled from 2016–2021: All Values Are in mg/L
Table A7.
Monthly variations in TSS across each sampled station (LVW stations).
| LWLVB1.2 | LWLVB1.85 | LWLVB2.7 | LWLVB3.5 | |||||||||||||
|---|---|---|---|---|---|---|---|---|---|---|---|---|---|---|---|---|
| Year | Min | Mean | Max | Std | Min | Mean | Max | Std | Min | Mean | Max | Std | Min | Mean | Max | Std |
| 1 | 5.0 | 5.4 | 11.0 | 1.6 | 5.0 | 5.0 | 5.0 | 0.0 | 5.0 | 5.0 | 5.0 | 0.0 | 5.0 | 5.0 | 5.0 | 0.0 |
| 2 | 5.0 | 5.3 | 8.5 | 0.9 | 5.0 | 5.0 | 5.0 | 0.0 | 5.0 | 5.0 | 5.0 | 0.0 | 5.0 | 5.0 | 5.0 | 0.0 |
| 3 | 5.0 | 5.1 | 7.3 | 0.3 | 5.0 | 5.1 | 12.0 | 0.8 | 5.0 | 5.0 | 5.0 | 0.0 | 5.0 | 5.0 | 5.0 | 0.0 |
| 4 | 5.0 | 5.1 | 7.2 | 0.4 | 5.0 | 5.0 | 5.0 | 0.0 | 5.0 | 5.0 | 5.0 | 0.0 | 5.0 | 5.0 | 5.0 | 0.0 |
| 5 | 5.0 | 5.3 | 13.0 | 1.3 | 5.0 | 5.0 | 5.0 | 0.0 | 5.0 | 5.0 | 5.0 | 0.0 | 5.0 | 5.0 | 5.0 | 0.0 |
| 6 | 5.0 | 5.2 | 8.9 | 0.7 | 5.0 | 5.0 | 5.3 | 0.0 | 5.0 | 5.0 | 5.0 | 0.0 | 5.0 | 5.0 | 5.0 | 0.0 |
| 7 | 5.0 | 5.7 | 14.0 | 1.7 | 5.0 | 5.2 | 11.0 | 0.9 | 5.0 | 5.0 | 5.0 | 0.0 | 5.0 | 5.0 | 5.0 | 0.0 |
| 8 | 5.0 | 5.6 | 17.0 | 1.7 | 5.0 | 5.0 | 8.3 | 0.4 | 5.0 | 5.0 | 5.0 | 0.0 | 5.0 | 5.0 | 5.0 | 0.0 |
| 9 | 5.0 | 5.9 | 19.0 | 2.3 | 5.0 | 5.2 | 12.0 | 1.1 | 5.0 | 5.0 | 5.0 | 0.0 | 5.0 | 5.0 | 5.0 | 0.0 |
| 10 | 5.0 | 8.0 | 49.0 | 8.0 | 5.0 | 5.4 | 16.0 | 1.6 | 5.0 | 5.0 | 5.0 | 0.0 | 5.0 | 6.5 | 17.0 | 3.2 |
| 11 | 5.0 | 7.2 | 20.0 | 4.7 | 5.0 | 5.8 | 11.0 | 1.8 | 5.0 | 5.0 | 5.0 | 0.0 | 5.0 | 5.0 | 5.0 | 0.0 |
| 12 | 5.0 | 5.3 | 7.2 | 0.7 | 5.0 | 5.0 | 5.0 | 0.0 | 5.0 | 5.0 | 5.0 | 0.0 | 5.0 | 5.0 | 5.0 | 0.0 |
Table A8.
Monthly variations in TSS across each sampled station (Boulder Basin stations).
| IPS3 | BB3 | CR350.0SE0.5 | CR346.4 | CR342.5 | ||||||||||||||||
|---|---|---|---|---|---|---|---|---|---|---|---|---|---|---|---|---|---|---|---|---|
| Year | Min | Mean | Max | Std | Min | Mean | Max | Std | Min | Mean | Max | Std | Min | Mean | Max | Std | Min | Mean | Max | Std |
| 1 | 5.0 | 5.0 | 5.0 | 0.0 | 5.0 | 5.0 | 5.0 | 0.0 | 5.0 | 5.0 | 5.0 | 0.0 | 5.0 | 5.0 | 5.0 | 0.0 | No Data | |||
| 2 | 5.0 | 5.0 | 5.0 | 0.0 | 5.0 | 5.0 | 5.0 | 0.0 | 5.0 | 5.0 | 5.0 | 0.0 | 5.0 | 5.0 | 5.0 | 0.0 | ||||
| 3 | 5.0 | 5.0 | 5.0 | 0.0 | 5.0 | 5.0 | 5.0 | 0.0 | 5.0 | 5.0 | 5.0 | 0.0 | 5.0 | 5.0 | 5.0 | 0.0 | ||||
| 4 | 5.0 | 5.0 | 5.0 | 0.0 | 5.0 | 5.0 | 5.0 | 0.0 | 5.0 | 5.0 | 5.0 | 0.0 | 5.0 | 5.0 | 5.0 | 0.0 | ||||
| 5 | 5.0 | 5.0 | 5.0 | 0.0 | 5.0 | 5.0 | 5.0 | 0.0 | 5.0 | 5.0 | 5.0 | 0.0 | 5.0 | 5.0 | 5.0 | 0.0 | ||||
| 6 | 5.0 | 5.0 | 5.0 | 0.0 | 5.0 | 5.0 | 5.0 | 0.0 | 5.0 | 5.0 | 5.0 | 0.0 | 5.0 | 5.0 | 5.0 | 0.0 | ||||
| 7 | 5.0 | 5.0 | 5.0 | 0.0 | 5.0 | 5.0 | 5.0 | 0.0 | 5.0 | 5.0 | 5.0 | 0.0 | 5.0 | 5.0 | 5.0 | 0.0 | ||||
| 8 | 5.0 | 5.0 | 5.0 | 0.0 | 5.0 | 5.0 | 5.0 | 0.0 | 5.0 | 5.0 | 5.0 | 0.0 | 5.0 | 5.0 | 5.0 | 0.0 | ||||
| 9 | 5.0 | 5.0 | 5.0 | 0.0 | 5.0 | 5.0 | 5.0 | 0.0 | 5.0 | 5.0 | 5.0 | 0.0 | 5.0 | 5.0 | 5.0 | 0.0 | ||||
| 10 | 5.0 | 5.0 | 5.0 | 0.0 | 5.0 | 5.0 | 5.0 | 0.0 | 5.0 | 5.0 | 5.0 | 0.0 | 5.0 | 5.0 | 5.0 | 0.0 | ||||
| 11 | 5.0 | 5.0 | 5.0 | 0.0 | 5.0 | 5.0 | 5.0 | 0.0 | 5.0 | 5.0 | 5.0 | 0.0 | 5.0 | 5.0 | 5.0 | 0.0 | ||||
| 12 | 5.0 | 5.0 | 5.0 | 0.0 | 5.0 | 5.0 | 5.0 | 0.0 | 5.0 | 5.0 | 5.0 | 0.0 | 5.0 | 5.0 | 5.0 | 0.0 | ||||
Table A9.
Seasonal variations in TSS across each sampled station (LWLVB Stations).
| LWLVB1.2 | LWLVB1.85 | LWLVB2.7 | LWLVB3.5 | |||||||||||||
|---|---|---|---|---|---|---|---|---|---|---|---|---|---|---|---|---|
| Year | Min | Mean | Max | Std | Min | Mean | Max | Std | Min | Mean | Max | Std | Min | Mean | Max | Std |
| Winter | 5.0 | 7.0 | 49.0 | 5.9 | 5.0 | 5.4 | 16.0 | 1.4 | 5.0 | 5.0 | 5.0 | 0.0 | 5.0 | 5.6 | 17.0 | 2.2 |
| Spring | 5.0 | 5.1 | 13.0 | 0.8 | 5.0 | 5.0 | 12.0 | 0.5 | 5.0 | 5.0 | 5.0 | 0.0 | 5.0 | 5.0 | 5.0 | 0.0 |
| Summer | 5.0 | 5.5 | 17.0 | 1.5 | 5.0 | 5.1 | 11.0 | 0.6 | 5.0 | 5.0 | 5.0 | 0.0 | 5.0 | 5.0 | 5.0 | 0.0 |
| Fall | 5.0 | 5.3 | 11.0 | 1.1 | 5.0 | 5.0 | 5.0 | 0.0 | 5.0 | 5.0 | 5.0 | 0.0 | 5.0 | 5.0 | 5.0 | 0.0 |
Table A10.
Seasonal variations in TSS across each sampled station (Boulder Basin stations).
| IPS3 | BB3 | CR350.0SE0.5 | CR346.4 | CR342.5 | ||||||||||||||||
|---|---|---|---|---|---|---|---|---|---|---|---|---|---|---|---|---|---|---|---|---|
| Year | Min | Mean | Max | Std | Min | Mean | Max | Std | Min | Mean | Max | Std | Min | Mean | Max | Std | Min | Mean | Max | Std |
| Winter | 5.0 | 5.0 | 5.0 | 0.0 | 5.0 | 5.0 | 5.0 | 0.0 | 5.0 | 5.0 | 5.0 | 0.0 | 5.0 | 5.0 | 5.0 | 0.0 | No Data | |||
| Spring | 5.0 | 5.0 | 5.0 | 0.0 | 5.0 | 5.0 | 5.0 | 0.0 | 5.0 | 5.0 | 5.0 | 0.0 | 5.0 | 5.0 | 5.0 | 0.0 | ||||
| Summer | 5.0 | 5.0 | 5.0 | 0.0 | 5.0 | 5.0 | 5.0 | 0.0 | 5.0 | 5.0 | 5.0 | 0.0 | 5.0 | 5.0 | 5.0 | 0.0 | ||||
| Fall | 5.0 | 5.0 | 5.0 | 0.0 | 5.0 | 5.0 | 5.0 | 0.0 | 5.0 | 5.0 | 5.0 | 0.0 | 5.0 | 5.0 | 5.0 | 0.0 | ||||
Table A11.
Yearly variations in TSS across each sampled station (LWLVB stations).
| LWLVB1.2 | LWLVB1.85 | LWLVB2.7 | LWLVB3.5 | |||||||||||||
|---|---|---|---|---|---|---|---|---|---|---|---|---|---|---|---|---|
| Year | Min | Mean | Max | Std | Min | Mean | Max | Std | Min | Mean | Max | Std | Min | Mean | Max | Std |
| 2016 | 5.0 | 6.1 | 20.0 | 2.5 | 5.0 | 5.3 | 12.0 | 1.3 | 5.0 | 5.0 | 5.0 | 0.0 | 5.0 | 5.3 | 12.2 | 1.3 |
| 2017 | 5.0 | 6.0 | 45.0 | 4.9 | 5.0 | 5.0 | 9.3 | 0.4 | 5.0 | 5.0 | 5.0 | 0.0 | 5.0 | 5.2 | 17.0 | 1.5 |
| 2018 | 5.0 | 5.3 | 16.0 | 1.5 | 5.0 | 5.0 | 5.2 | 0.0 | 5.0 | 5.0 | 5.0 | 0.0 | 5.0 | 5.0 | 5.0 | 0.0 |
| 2019 | 5.0 | 5.3 | 10.0 | 1.0 | 5.0 | 5.2 | 16.0 | 1.2 | 5.0 | 5.0 | 5.0 | 0.0 | 5.0 | 5.4 | 15.8 | 2.0 |
| 2020 | 5.0 | 5.4 | 10.0 | 1.2 | 5.0 | 5.0 | 8.4 | 0.4 | 5.0 | 5.0 | 5.0 | 0.0 | 5.0 | 5.1 | 8.6 | 0.6 |
| 2021 | 5.0 | 6.3 | 49.0 | 4.8 | 5.0 | 5.1 | 12.0 | 0.8 | 5.0 | 5.0 | 5.0 | 0.0 | 5.0 | 5.0 | 5.0 | 0.0 |
Table A12.
Yearly variations in TSS across each sampled station (Boulder Basin stations).
| IPS3 | BB3 | CR350.0SE0.55 | CR346.4 | CR342.5 | ||||||||||||||||
|---|---|---|---|---|---|---|---|---|---|---|---|---|---|---|---|---|---|---|---|---|
| Year | Min | Mean | Max | Std | Min | Mean | Max | Std | Min | Mean | Max | Std | Min | Mean | Max | Std | Min | Mean | Max | Std |
| 2016 | No Data | 5.0 | 5.0 | 5.0 | 0.0 | 5.0 | 5.0 | 5.0 | 0.0 | 5.0 | 5.0 | 5.0 | 0.0 | No Data | ||||||
| 2017 | 5.0 | 5.0 | 5.0 | 0.0 | 5.0 | 5.0 | 5.0 | 0.0 | 5.0 | 5.0 | 5.0 | 0.0 | 5.0 | 5.0 | 5.0 | 0.0 | ||||
| 2018 | 5.0 | 5.0 | 5.0 | 0.0 | 5.0 | 5.0 | 5.0 | 0.0 | 5.0 | 5.0 | 5.0 | 0.0 | 5.0 | 5.0 | 5.0 | 0.0 | ||||
| 2019 | 5.0 | 5.0 | 5.0 | 0.0 | 5.0 | 5.0 | 5.0 | 0.0 | 5.0 | 5.0 | 5.0 | 0.0 | 5.0 | 5.0 | 5.0 | 0.0 | ||||
| 2020 | 5.0 | 5.0 | 5.0 | 0.0 | 5.0 | 5.0 | 5.0 | 0.0 | 5.0 | 5.0 | 5.0 | 0.0 | 5.0 | 5.0 | 5.0 | 0.0 | ||||
| 2021 | 5.0 | 5.0 | 5.0 | 0.0 | 5.0 | 5.0 | 5.0 | 0.0 | 5.0 | 5.0 | 5.0 | 0.0 | 5.0 | 5.0 | 5.0 | 0.0 | ||||
Appendix C. Temperature Variations for the Stations Sampled from 2016–2021: All Values Are in °C
Table A13.
Monthly variations in temperature across each sampled station (LWLVB stations).
| LWLVB1.2 | LWLVB1.85 | LWLVB2.7 | LWLVB3.5 | |||||||||||||
|---|---|---|---|---|---|---|---|---|---|---|---|---|---|---|---|---|
| Year | Min | Mean | Max | Std | Min | Mean | Max | Std | Min | Mean | Max | Std | Min | Mean | Max | Std |
| 1 | 13.0 | 13.8 | 15.0 | 0.6 | 13.0 | 13.7 | 14.6 | 0.4 | 12.8 | 13.6 | 14.4 | 0.4 | 12.4 | 13.5 | 14.4 | 0.6 |
| 2 | 12.5 | 13.2 | 14.9 | 0.8 | 12.6 | 13.1 | 14.6 | 0.6 | 12.1 | 13.0 | 14.3 | 0.5 | 12.5 | 12.9 | 14.1 | 0.4 |
| 3 | 12.2 | 14.1 | 19.7 | 1.4 | 11.9 | 13.6 | 18.0 | 1.2 | 11.8 | 13.2 | 18.0 | 1.2 | 11.6 | 13.1 | 17.2 | 1.2 |
| 4 | 12.2 | 15.8 | 20.9 | 2.7 | 12.0 | 15.1 | 20.2 | 2.4 | 11.7 | 14.6 | 20.1 | 2.4 | 11.5 | 14.4 | 19.2 | 2.4 |
| 5 | 12.4 | 18.0 | 24.7 | 4.2 | 11.7 | 17.6 | 24.4 | 4.0 | 11.8 | 17.1 | 24.3 | 4.0 | 11.7 | 16.9 | 23.8 | 3.9 |
| 6 | 12.9 | 21.0 | 29.1 | 5.6 | 12.3 | 20.5 | 28.3 | 5.7 | 11.8 | 20.1 | 28.1 | 5.9 | 11.7 | 20.0 | 27.6 | 5.9 |
| 7 | 14.3 | 23.1 | 31.2 | 6.4 | 12.6 | 22.6 | 30.6 | 6.7 | 11.8 | 22.2 | 30.2 | 7.1 | 11.8 | 21.7 | 30.0 | 7.0 |
| 8 | 15.4 | 24.1 | 31.2 | 5.7 | 13.0 | 23.4 | 31.3 | 6.6 | 12.0 | 22.9 | 31.3 | 7.4 | 11.8 | 22.5 | 31.1 | 7.5 |
| 9 | 15.9 | 23.4 | 30.2 | 4.1 | 13.0 | 22.2 | 30.1 | 5.3 | 12.1 | 21.4 | 29.8 | 6.4 | 11.9 | 21.2 | 29.6 | 6.5 |
| 10 | 18.6 | 21.8 | 26.2 | 1.6 | 14.0 | 20.6 | 26.0 | 3.1 | 12.6 | 19.3 | 25.8 | 4.2 | 12.1 | 18.3 | 25.5 | 4.5 |
| 11 | 18.8 | 20.7 | 21.8 | 0.9 | 14.7 | 19.0 | 21.8 | 2.5 | 12.6 | 17.9 | 21.5 | 3.6 | 12.2 | 17.3 | 21.4 | 3.5 |
| 12 | 15.4 | 16.4 | 17.1 | 0.6 | 15.4 | 16.6 | 17.2 | 0.6 | 12.7 | 15.7 | 17.1 | 1.5 | 12.0 | 15.2 | 17.2 | 2.0 |
Table A14.
Monthly variations in temperature across each sampled station (Boulder Basin stations).
| IPS3 | BB3 | CR350.0SE0.5 | CR346.4 | CR342.5 | ||||||||||||||||
|---|---|---|---|---|---|---|---|---|---|---|---|---|---|---|---|---|---|---|---|---|
| Year | Min | Mean | Max | Std | Min | Mean | Max | Std | Min | Mean | Max | Std | Min | Mean | Max | Std | Min | Mean | Max | Std |
| 1 | 12.4 | 13.3 | 14.5 | 0.6 | 12.5 | 13.4 | 14.4 | 0.4 | 12.3 | 13.2 | 14.4 | 0.5 | 12.3 | 13.3 | 14.3 | 0.5 | 12.4 | 13.3 | 14.4 | 0.6 |
| 2 | 12.1 | 12.8 | 14.2 | 0.5 | 12.2 | 12.9 | 13.8 | 0.5 | 12.1 | 12.8 | 13.8 | 0.4 | 11.9 | 12.8 | 13.8 | 0.5 | 11.8 | 12.8 | 13.8 | 0.5 |
| 3 | 11.6 | 13.1 | 15.7 | 1.2 | 11.8 | 13.1 | 15.2 | 1.0 | 11.7 | 12.9 | 15.3 | 1.1 | 11.5 | 13.0 | 15.4 | 1.1 | 11.7 | 12.7 | 15.1 | 0.8 |
| 4 | 11.5 | 15.0 | 18.6 | 2.8 | 11.9 | 14.2 | 17.6 | 2.0 | 11.5 | 13.9 | 17.2 | 2.2 | 11.4 | 14.9 | 18.3 | 2.7 | 11.4 | 13.6 | 17.9 | 2.0 |
| 5 | 11.7 | 16.7 | 21.6 | 4.0 | 11.7 | 17.0 | 23.3 | 3.9 | 11.6 | 17.4 | 23.0 | 4.3 | 11.6 | 16.7 | 21.9 | 3.9 | 11.5 | 15.0 | 19.7 | 2.9 |
| 6 | 11.7 | 20.2 | 26.3 | 6.0 | 12.0 | 19.7 | 27.4 | 5.4 | 11.6 | 18.9 | 26.4 | 5.6 | 11.7 | 19.0 | 26.6 | 5.5 | 11.7 | 17.9 | 24.2 | 4.9 |
| 7 | 11.8 | 22.3 | 29.5 | 7.5 | 12.5 | 21.7 | 30.1 | 6.5 | 11.7 | 21.4 | 28.7 | 7.0 | 11.8 | 21.2 | 28.5 | 6.8 | 11.8 | 20.0 | 27.0 | 6.0 |
| 8 | 12.1 | 22.2 | 29.6 | 7.3 | 12.6 | 22.4 | 30.3 | 6.7 | 11.9 | 21.8 | 30.3 | 7.1 | 11.9 | 21.7 | 29.0 | 7.0 | 11.9 | 21.3 | 29.3 | 6.8 |
| 9 | 12.0 | 21.3 | 29.3 | 6.7 | 12.7 | 21.2 | 28.0 | 5.5 | 12.0 | 20.9 | 29.1 | 6.4 | 11.9 | 21.6 | 29.2 | 6.9 | 12.0 | 21.5 | 28.9 | 6.9 |
| 10 | 12.0 | 18.2 | 23.9 | 4.5 | 12.6 | 19.4 | 24.6 | 3.6 | 12.1 | 18.3 | 24.8 | 4.6 | 12.0 | 19.4 | 25.5 | 5.3 | 12.0 | 18.7 | 25.5 | 5.0 |
| 11 | 12.1 | 17.0 | 20.6 | 3.4 | 13.4 | 17.9 | 21.2 | 2.5 | 12.1 | 16.7 | 21.2 | 3.2 | 12.1 | 16.9 | 21.1 | 3.3 | 12.1 | 17.0 | 21.0 | 3.4 |
| 12 | 12.3 | 15.0 | 16.9 | 1.8 | 13.3 | 15.6 | 16.6 | 0.9 | 12.3 | 14.9 | 16.6 | 1.8 | 12.2 | 15.0 | 16.5 | 1.8 | 12.3 | 15.0 | 16.5 | 1.8 |
Table A15.
Seasonal variations in temperature across each sampled station (LWLVB stations).
| LWLVB1.2 | LWLVB1.85 | LWLVB2.7 | LWLVB3.5 | |||||||||||||
|---|---|---|---|---|---|---|---|---|---|---|---|---|---|---|---|---|
| Year | Min | Mean | Max | Std | Min | Mean | Max | Std | Min | Mean | Max | Std | Min | Mean | Max | Std |
| Winter | 12.5 | 14.5 | 17.1 | 1.5 | 12.6 | 14.4 | 17.2 | 1.6 | 12.1 | 14.1 | 17.1 | 1.5 | 12.0 | 13.9 | 17.2 | 1.5 |
| Spring | 12.2 | 15.9 | 24.7 | 3.3 | 11.7 | 15.4 | 24.4 | 3.2 | 11.7 | 14.9 | 24.3 | 3.2 | 11.5 | 14.7 | 23.8 | 3.1 |
| Summer | 12.9 | 22.8 | 31.2 | 6.0 | 12.3 | 22.3 | 31.3 | 6.4 | 11.8 | 21.8 | 31.3 | 6.9 | 11.7 | 21.5 | 31.1 | 6.9 |
| Fall | 15.9 | 22.4 | 30.2 | 3.1 | 13.0 | 21.1 | 30.1 | 4.4 | 12.1 | 19.9 | 29.8 | 5.2 | 11.9 | 19.2 | 29.6 | 5.4 |
Table A16.
Seasonal variations in temperature across each sampled station (Boulder Basin stations).
| IPS3 | BB3 | CR350.0SE0.5 | CR346.4 | CR342.5 | ||||||||||||||||
|---|---|---|---|---|---|---|---|---|---|---|---|---|---|---|---|---|---|---|---|---|
| Year | Min | Mean | Max | Std | Min | Mean | Max | Std | Min | Mean | Max | Std | Min | Mean | Max | Std | Min | Mean | Max | Std |
| Winter | 12.1 | 13.7 | 16.9 | 1.5 | 12.2 | 13.9 | 16.6 | 1.3 | 12.1 | 13.7 | 16.6 | 1.4 | 11.9 | 13.7 | 16.5 | 1.5 | 11.8 | 13.7 | 16.5 | 1.5 |
| Spring | 11.5 | 14.8 | 21.6 | 3.1 | 11.7 | 14.8 | 23.3 | 3.1 | 11.5 | 14.8 | 23.0 | 3.5 | 11.4 | 14.8 | 21.9 | 3.1 | 11.4 | 13.7 | 19.7 | 2.2 |
| Summer | 11.7 | 21.6 | 29.6 | 6.9 | 12.0 | 21.4 | 30.3 | 6.3 | 11.6 | 20.9 | 30.3 | 6.7 | 11.7 | 20.7 | 29.0 | 6.5 | 11.7 | 19.8 | 29.3 | 6.1 |
| Fall | 12.0 | 18.8 | 29.3 | 5.3 | 12.6 | 19.6 | 28.0 | 4.3 | 12.0 | 18.7 | 29.1 | 5.1 | 11.9 | 19.3 | 29.2 | 5.6 | 12.0 | 19.1 | 28.9 | 5.5 |
Table A17.
Yearly variations in temperature across each sampled station (LWLVB stations).
| LWLVB1.2 | LWLVB1.85 | LWLVB2.7 | LWLVB3.5 | |||||||||||||
|---|---|---|---|---|---|---|---|---|---|---|---|---|---|---|---|---|
| Year | Min | Mean | Max | Std | Min | Mean | Max | Std | Min | Mean | Max | Std | Min | Mean | Max | Std |
| 2016 | 12.2 | 19.7 | 30.0 | 5.3 | 11.9 | 18.6 | 29.7 | 5.5 | 11.8 | 18.0 | 29.3 | 5.8 | 11.6 | 17.5 | 29.1 | 5.7 |
| 2017 | 13.0 | 20.2 | 31.2 | 5.4 | 12.5 | 19.2 | 30.7 | 5.9 | 12.6 | 18.2 | 29.9 | 5.6 | 12.2 | 18.0 | 29.9 | 5.9 |
| 2018 | 12.9 | 19.5 | 31.2 | 5.7 | 12.7 | 19.4 | 30.6 | 5.8 | 12.5 | 18.4 | 30.3 | 5.9 | 12.5 | 18.2 | 30.0 | 5.9 |
| 2019 | 12.4 | 19.2 | 30.4 | 5.4 | 11.7 | 18.7 | 30.1 | 5.6 | 11.7 | 17.6 | 29.8 | 5.7 | 11.5 | 17.3 | 30.0 | 5.6 |
| 2020 | 12.5 | 21.0 | 30.5 | 5.6 | 12.7 | 20.0 | 30.2 | 6.1 | 12.2 | 18.9 | 30.3 | 6.4 | 12.1 | 18.3 | 30.1 | 6.4 |
| 2021 | 12.2 | 19.8 | 31.2 | 5.6 | 12.0 | 19.0 | 31.3 | 6.0 | 11.8 | 18.0 | 31.3 | 6.1 | 11.8 | 17.9 | 31.1 | 6.2 |
Table A18.
Yearly variations in temperature across each sampled station (Boulder Basin stations).
| IPS3 | BB3 | CR350.0SE0.55 | CR346.4 | CR342.5 | ||||||||||||||||
|---|---|---|---|---|---|---|---|---|---|---|---|---|---|---|---|---|---|---|---|---|
| Year | Min | Mean | Max | Std | Min | Mean | Max | Std | Min | Mean | Max | Std | Min | Mean | Max | Std | Min | Mean | Max | Std |
| 2016 | No Data | 11.8 | 18.1 | 28.7 | 5.4 | 11.7 | 17.0 | 28.0 | 5.4 | 11.6 | 17.1 | 29.0 | 5.4 | 11.6 | 16.1 | 27.0 | 4.8 | |||
| 2017 | 12.2 | 17.5 | 29.3 | 5.7 | 12.4 | 17.6 | 30.3 | 5.4 | 12.3 | 17.5 | 30.3 | 5.8 | 12.2 | 17.3 | 29.2 | 5.5 | 12.2 | 16.9 | 29.2 | 5.5 |
| 2018 | 12.4 | 17.6 | 29.5 | 5.6 | 12.5 | 18.0 | 30.1 | 5.3 | 12.5 | 17.5 | 28.7 | 5.4 | 12.5 | 17.5 | 28.5 | 5.4 | 12.4 | 16.9 | 29.3 | 5.2 |
| 2019 | 11.5 | 17.2 | 28.3 | 5.6 | 11.7 | 17.3 | 27.9 | 5.1 | 11.5 | 16.9 | 28.2 | 5.5 | 11.4 | 16.7 | 27.6 | 5.4 | 11.4 | 16.2 | 28.7 | 5.1 |
| 2020 | 12.0 | 17.5 | 29.6 | 6.2 | 12.5 | 17.2 | 28.1 | 5.5 | 12.1 | 17.1 | 28.3 | 6.0 | 12.2 | 17.2 | 27.7 | 5.8 | 12.2 | 16.9 | 27.8 | 5.4 |
| 2021 | 11.6 | 16.8 | 29.2 | 5.6 | 12.1 | 17.3 | 28.6 | 5.6 | 11.7 | 16.9 | 29.1 | 5.7 | 11.7 | 17.0 | 28.3 | 5.7 | 11.7 | 16.7 | 28.1 | 5.4 |
Appendix D. DO Concentration Variations for the Stations Sampled from 2016–2021: All Values Are in mg/L
Table A19.
Monthly variations in DO concentration across each sampled station (LWLVB stations).
| LWLVB1.2 | LWLVB1.85 | LWLVB2.7 | LWLVB3.5 | |||||||||||||
|---|---|---|---|---|---|---|---|---|---|---|---|---|---|---|---|---|
| Year | Min | Mean | Max | Std | Min | Mean | Max | Std | Min | Mean | Max | Std | Min | Mean | Max | Std |
| 1 | 8.4 | 8.9 | 9.5 | 0.3 | 8.5 | 8.9 | 9.5 | 0.3 | 6.0 | 8.5 | 9.3 | 0.9 | 5.7 | 8.4 | 9.3 | 1.0 |
| 2 | 7.3 | 9.0 | 9.8 | 0.6 | 7.4 | 8.9 | 9.8 | 0.6 | 6.0 | 8.8 | 9.8 | 0.8 | 5.8 | 8.8 | 9.6 | 0.9 |
| 3 | 7.5 | 9.2 | 11.0 | 0.8 | 7.8 | 9.2 | 10.8 | 0.7 | 8.2 | 9.2 | 10.0 | 0.5 | 7.9 | 9.2 | 10.0 | 0.5 |
| 4 | 6.4 | 9.0 | 11.9 | 1.2 | 7.7 | 9.1 | 11.4 | 0.9 | 7.8 | 9.2 | 10.1 | 0.6 | 8.3 | 9.2 | 10.0 | 0.5 |
| 5 | 6.5 | 8.4 | 12.0 | 1.1 | 7.0 | 8.7 | 11.6 | 1.0 | 7.5 | 9.0 | 10.9 | 0.8 | 8.2 | 9.2 | 10.7 | 0.7 |
| 6 | 4.9 | 7.6 | 13.8 | 1.7 | 6.0 | 7.9 | 10.2 | 1.0 | 6.7 | 8.3 | 9.7 | 0.7 | 6.1 | 8.4 | 10.3 | 0.7 |
| 7 | 3.0 | 6.7 | 10.2 | 2.1 | 3.2 | 7.0 | 9.5 | 1.5 | 6.3 | 7.9 | 9.2 | 0.8 | 6.7 | 8.1 | 9.8 | 0.6 |
| 8 | 0.6 | 5.8 | 11.3 | 3.1 | 2.6 | 6.2 | 11.7 | 2.2 | 4.1 | 7.0 | 9.9 | 1.4 | 5.8 | 7.5 | 9.0 | 0.7 |
| 9 | 0.7 | 5.0 | 11.1 | 3.3 | 2.3 | 5.3 | 9.8 | 2.3 | 3.3 | 6.1 | 9.1 | 1.6 | 3.5 | 6.7 | 9.0 | 1.2 |
| 10 | 0.5 | 6.1 | 8.7 | 2.4 | 2.1 | 5.9 | 8.4 | 2.0 | 3.4 | 6.0 | 8.2 | 1.6 | 3.5 | 6.2 | 8.3 | 1.3 |
| 11 | 6.1 | 7.7 | 8.2 | 0.5 | 2.3 | 6.4 | 8.1 | 2.2 | 4.0 | 6.4 | 7.9 | 1.6 | 4.1 | 6.5 | 7.9 | 1.3 |
| 12 | 8.1 | 8.4 | 8.7 | 0.2 | 6.8 | 8.2 | 8.6 | 0.4 | 3.9 | 7.4 | 8.5 | 1.6 | 5.0 | 7.4 | 8.5 | 1.3 |
Table A20.
Monthly variations in DO concentration across each sampled station (Boulder Basin stations).
Table A20.
Monthly variations in DO concentration across each sampled station (Boulder Basin stations).
| IPS3 | BB3 | CR350.0SE0.5 | CR346.4 | CR342.5 | ||||||||||||||||
|---|---|---|---|---|---|---|---|---|---|---|---|---|---|---|---|---|---|---|---|---|
| Year | Min | Mean | Max | Std | Min | Mean | Max | Std | Min | Mean | Max | Std | Min | Mean | Max | Std | Min | Mean | Max | Std |
| 1 | 5.8 | 7.9 | 9.1 | 1.3 | 6.2 | 8.5 | 9.3 | 0.9 | 5.6 | 7.9 | 9.1 | 1.3 | 5.7 | 7.9 | 9.1 | 1.1 | 5.7 | 7.7 | 8.9 | 1.2 |
| 2 | 5.8 | 8.4 | 9.5 | 1.0 | 7.2 | 8.8 | 9.8 | 0.7 | 6.7 | 8.8 | 9.5 | 0.7 | 6.2 | 8.7 | 9.8 | 0.8 | 5.7 | 8.6 | 9.8 | 1.0 |
| 3 | 8.3 | 9.2 | 9.9 | 0.5 | 8.6 | 9.2 | 10.2 | 0.5 | 7.5 | 9.1 | 10.0 | 0.6 | 7.8 | 9.1 | 9.9 | 0.5 | 7.2 | 9.0 | 10.0 | 0.7 |
| 4 | 8.6 | 9.3 | 10.2 | 0.4 | 8.4 | 9.2 | 9.8 | 0.5 | 8.5 | 9.2 | 9.7 | 0.4 | 8.5 | 9.3 | 10.0 | 0.5 | 8.6 | 9.2 | 9.9 | 0.5 |
| 5 | 8.3 | 9.3 | 11.3 | 0.9 | 6.1 | 9.2 | 11.4 | 1.1 | 8.4 | 9.4 | 10.5 | 0.6 | 8.3 | 9.2 | 10.4 | 0.6 | 8.4 | 9.1 | 10.2 | 0.5 |
| 6 | 8.1 | 8.6 | 9.6 | 0.4 | 7.2 | 8.6 | 10.4 | 0.8 | 8.0 | 8.8 | 10.1 | 0.5 | 8.0 | 8.7 | 9.8 | 0.5 | 8.1 | 8.8 | 10.1 | 0.6 |
| 7 | 7.6 | 8.0 | 8.7 | 0.3 | 6.5 | 7.9 | 9.5 | 0.7 | 7.6 | 8.1 | 8.9 | 0.3 | 7.6 | 8.3 | 9.4 | 0.5 | 7.7 | 8.4 | 9.3 | 0.5 |
| 8 | 6.9 | 7.6 | 8.1 | 0.4 | 5.6 | 7.2 | 8.9 | 1.0 | 6.1 | 7.6 | 8.6 | 0.6 | 6.6 | 7.6 | 8.1 | 0.4 | 7.1 | 7.6 | 8.3 | 0.3 |
| 9 | 5.5 | 7.2 | 8.5 | 0.9 | 4.6 | 6.4 | 8.3 | 1.2 | 5.4 | 7.0 | 8.2 | 1.0 | 5.5 | 7.3 | 8.3 | 0.9 | 5.8 | 7.2 | 8.2 | 0.7 |
| 10 | 4.2 | 6.4 | 7.7 | 1.2 | 4.3 | 6.3 | 7.8 | 1.2 | 4.3 | 6.5 | 7.8 | 1.2 | 4.3 | 6.6 | 8.3 | 1.2 | 4.4 | 6.4 | 8.3 | 1.4 |
| 11 | 4.7 | 6.9 | 8.2 | 1.1 | 4.9 | 7.0 | 8.1 | 1.2 | 4.8 | 6.8 | 8.1 | 1.0 | 4.3 | 6.7 | 8.1 | 1.1 | 4.5 | 6.5 | 8.0 | 1.1 |
| 12 | 6.1 | 7.6 | 8.5 | 0.9 | 5.4 | 7.6 | 8.5 | 1.0 | 5.9 | 7.5 | 8.4 | 1.0 | 6.2 | 7.6 | 8.4 | 0.9 | 6.2 | 7.5 | 8.3 | 0.8 |
Table A21.
Seasonal variations in DO concentration across each sampled station (LWLVB stations).
| LWLVB1.2 | LWLVB1.85 | LWLVB2.7 | LWLVB3.5 | |||||||||||||
|---|---|---|---|---|---|---|---|---|---|---|---|---|---|---|---|---|
| Year | Min | Mean | Max | Std | Min | Mean | Max | Std | Min | Mean | Max | Std | Min | Mean | Max | Std |
| Winter | 7.3 | 8.8 | 9.8 | 0.5 | 6.8 | 8.7 | 9.8 | 0.6 | 3.9 | 8.3 | 9.8 | 1.3 | 5.0 | 8.2 | 9.6 | 1.2 |
| Spring | 6.4 | 8.9 | 12.0 | 1.1 | 7.0 | 9.0 | 11.6 | 0.9 | 7.5 | 9.1 | 10.9 | 0.7 | 7.9 | 9.2 | 10.7 | 0.6 |
| Summer | 0.6 | 6.6 | 13.8 | 2.5 | 2.6 | 7.0 | 11.7 | 1.8 | 4.1 | 7.7 | 9.9 | 1.1 | 5.8 | 8.0 | 10.3 | 0.8 |
| Fall | 0.5 | 5.8 | 11.1 | 2.8 | 2.1 | 5.7 | 9.8 | 2.2 | 3.3 | 6.1 | 9.1 | 1.6 | 3.5 | 6.4 | 9.0 | 1.3 |
Table A22.
Seasonal variations in DO concentration across each sampled station (Boulder Basin stations).
Table A22.
Seasonal variations in DO concentration across each sampled station (Boulder Basin stations).
| IPS3 | BB3 | CR350.0SE0.5 | CR346.4 | CR342.5 | ||||||||||||||||
|---|---|---|---|---|---|---|---|---|---|---|---|---|---|---|---|---|---|---|---|---|
| Year | Min | Mean | Max | Std | Min | Mean | Max | Std | Min | Mean | Max | Std | Min | Mean | Max | Std | Min | Mean | Max | Std |
| Winter | 5.8 | 8.0 | 9.5 | 1.1 | 5.4 | 8.3 | 9.8 | 1.0 | 5.6 | 8.1 | 9.5 | 1.1 | 5.7 | 8.1 | 9.8 | 1.0 | 5.7 | 7.9 | 9.8 | 1.1 |
| Spring | 8.3 | 9.3 | 11.3 | 0.6 | 6.1 | 9.2 | 11.4 | 0.8 | 7.5 | 9.2 | 10.5 | 0.6 | 7.8 | 9.2 | 10.4 | 0.5 | 7.2 | 9.1 | 10.2 | 0.6 |
| Summer | 6.9 | 8.1 | 9.6 | 0.5 | 5.6 | 7.8 | 10.4 | 1.0 | 6.1 | 8.1 | 10.1 | 0.7 | 6.6 | 8.2 | 9.8 | 0.6 | 7.1 | 8.2 | 10.1 | 0.7 |
| Fall | 4.2 | 6.8 | 8.5 | 1.1 | 4.3 | 6.5 | 8.3 | 1.2 | 4.3 | 6.8 | 8.2 | 1.1 | 4.3 | 6.8 | 8.3 | 1.1 | 4.4 | 6.7 | 8.3 | 1.1 |
Table A23.
Yearly variations in DO concentration across each sampled station (LWLVB stations).
| LWLVB1.2 | LWLVB1.85 | LWLVB2.7 | LWLVB3.5 | |||||||||||||
|---|---|---|---|---|---|---|---|---|---|---|---|---|---|---|---|---|
| Year | Min | Mean | Max | Std | Min | Mean | Max | Std | Min | Mean | Max | Std | Min | Mean | Max | Std |
| 2016 | 1.4 | 7.3 | 13.8 | 2.6 | 2.1 | 7.3 | 10.6 | 2.0 | 4.0 | 7.7 | 9.9 | 1.6 | 4.1 | 8.0 | 10.3 | 1.4 |
| 2017 | 0.6 | 7.5 | 12.0 | 2.8 | 2.3 | 7.6 | 11.7 | 2.3 | 3.7 | 7.7 | 10.4 | 1.8 | 4.1 | 7.9 | 10.2 | 1.5 |
| 2018 | 0.9 | 7.3 | 10.8 | 2.4 | 2.3 | 7.3 | 10.8 | 2.1 | 3.6 | 7.6 | 10.9 | 1.7 | 4.5 | 7.8 | 10.7 | 1.4 |
| 2019 | 1.9 | 7.6 | 11.1 | 2.3 | 2.8 | 7.8 | 10.7 | 1.8 | 4.1 | 8.1 | 10.1 | 1.4 | 4.5 | 8.2 | 10.0 | 1.2 |
| 2020 | 1.5 | 6.7 | 10.9 | 2.6 | 3.1 | 7.0 | 10.8 | 2.1 | 3.9 | 7.4 | 9.7 | 1.6 | 3.5 | 7.6 | 9.7 | 1.4 |
| 2021 | 0.5 | 7.4 | 10.2 | 2.4 | 2.8 | 7.6 | 10.3 | 2.0 | 3.3 | 7.9 | 10.3 | 1.7 | 3.5 | 8.1 | 10.0 | 1.4 |
Table A24.
Yearly variations in DO concentration across each sampled station (Boulder Basin stations).
Table A24.
Yearly variations in DO concentration across each sampled station (Boulder Basin stations).
| IPS3 | BB3 | CR350.0SE0.55 | CR346.4 | CR342.5 | ||||||||||||||||
|---|---|---|---|---|---|---|---|---|---|---|---|---|---|---|---|---|---|---|---|---|
| Year | Min | Mean | Max | Std | Min | Mean | Max | Std | Min | Mean | Max | Std | Min | Mean | Max | Std | Min | Mean | Max | Std |
| 2016 | No Data | 4.5 | 7.9 | 10.3 | 1.4 | 4.8 | 8.0 | 10.2 | 1.3 | 4.3 | 8.0 | 10.4 | 1.3 | 4.5 | 7.9 | 10.1 | 1.3 | |||
| 2017 | 4.2 | 7.9 | 9.8 | 1.3 | 4.6 | 8.0 | 10.4 | 1.4 | 4.3 | 8.1 | 10.1 | 1.3 | 4.3 | 8.0 | 9.6 | 1.2 | 4.5 | 8.0 | 9.7 | 1.3 |
| 2018 | 4.7 | 7.8 | 11.3 | 1.4 | 5.2 | 7.9 | 11.4 | 1.5 | 4.8 | 7.8 | 9.9 | 1.2 | 5.1 | 7.9 | 10.0 | 1.2 | 4.6 | 7.9 | 10.2 | 1.2 |
| 2019 | 4.9 | 8.2 | 9.9 | 1.1 | 5.2 | 8.2 | 10.2 | 1.4 | 5.4 | 8.2 | 10.2 | 1.2 | 5.2 | 8.2 | 9.9 | 1.1 | 4.9 | 8.2 | 10.0 | 1.1 |
| 2020 | 4.9 | 7.9 | 9.7 | 1.0 | 4.3 | 7.7 | 9.7 | 1.4 | 5.4 | 7.8 | 9.6 | 1.1 | 4.7 | 7.9 | 9.4 | 1.1 | 4.4 | 7.7 | 9.4 | 1.3 |
| 2021 | 5.1 | 8.1 | 9.9 | 1.2 | 4.7 | 8.1 | 10.1 | 1.2 | 4.6 | 8.2 | 10.5 | 1.3 | 4.3 | 8.1 | 10.0 | 1.3 | 4.6 | 8.0 | 9.9 | 1.2 |
References
- Karagiannis, I.C.; Soldatos, P.G. Water Desalination Cost Literature: Review and Assessment. Desalination 2008, 223, 448–456. [Google Scholar] [CrossRef]
- Adjovu, G.E.; Stephen, H.; James, D.; Ahmad, S. Overview of the Application of Remote Sensing in Effective Monitoring of Water Quality Parameters. Remote Sens. 2023, 15, 1938. [Google Scholar] [CrossRef]
- Dey, J.; Vijay, R. A Critical and Intensive Review on Assessment of Water Quality Parameters through Geospatial Techniques. Environ. Sci. Pollut. Res. 2021, 28, 41612–41626. [Google Scholar] [CrossRef] [PubMed]
- Dörnhöfer, K.; Oppelt, N. Remote Sensing for Lake Research and Monitoring—Recent Advances. Ecol. Indic. 2016, 64, 105–122. [Google Scholar] [CrossRef]
- Dube, T.; Mutanga, O.; Seutloali, K.; Adelabu, S.; Shoko, C. Water Quality Monitoring in Sub-Saharan African Lakes: A Review of Remote Sensing Applications. Afr. J. Aquat. Sci. 2015, 40, 1–7. [Google Scholar] [CrossRef]
- Karaoui, I.; Arioua, A.; Boudhar, A.; Hssaisoune, M.; El Mouatassime, S.; Ouhamchich, K.A.; Elhamdouni, D. Evaluating the Potential of Sentinel-2 Satellite Images for Water Quality Characterization of Artificial Reservoirs: The Bin El Ouidane Reservoir Case Study (Morocco). Meteorol. Hydrol. Water Manag. Res. Oper. Appl. 2019, 7, 31–39. [Google Scholar]
- Nath, R.K.; Deb, S.K. Water-Body Area Extraction From High Resolution Satellite Images-An Introduction, Review, and Comparison. Int. J. Image Process. 2010, 3, 353–372. [Google Scholar]
- Palmer, S.C.J.; Kutser, T.; Hunter, P.D. Remote Sensing of Inland Waters: Challenges, Progress and Future Directions. Remote Sens. Environ. 2015, 157, 1–8. [Google Scholar] [CrossRef] [Green Version]
- Song, K. Water Quality Monitoring Using Landsat Themate Mapper Data with Empirical Algorithms in Chagan Lake, China. J. Appl. Remote Sens. 2011, 5, 053506. [Google Scholar] [CrossRef]
- Zhou, Y.; Dong, J.; Xiao, X.; Xiao, T.; Yang, Z.; Zhao, G.; Zou, Z.; Qin, Y. Open Surface Water Mapping Algorithms: A Comparison of Water-Related Spectral Indices and Sensors. Water 2017, 9, 256. [Google Scholar] [CrossRef]
- Prabhukumar, G.; Pagilla, K. Polycyclic Aromatic Hydrocarbons in Urban Runoff—Sources, Sinks and Treatment: A Review; Environmental Engineering Program; Illinois Institute of Technology: Chicago, IL, USA, 2010; pp. 1–81. [Google Scholar]
- Shaikh, T.A.; Adjovu, G.E.; Stephen, H.; Ahmad, S. Impacts of Urbanization on Watershed Hydrology and Runoff Water Quality of a Watershed: A Review. In Proceedings of the World Environmental and Water Resources Congress 2023, Henderson, NV, USA, 21–24 May 2023; Volume 1, pp. 1271–1283. [Google Scholar]
- Miller, J.D.; Hutchins, M. The Impacts of Urbanisation and Climate Change on Urban Flooding and Urban Water Quality: A Review of the Evidence Concerning the United Kingdom. J. Hydrol. Reg. Stud. 2017, 12, 345–362. [Google Scholar] [CrossRef] [Green Version]
- Adjovu, G.E. Evaluating the Performance of A GIS-Based Tool for Delineating Swales Along Two Highways in Tennessee; ProQuest LLC: Ann Arbor, MI, USA, 2020. [Google Scholar]
- Adjovu, G.E.; Gamble, R. Development of HEC-HMS Model for the Cane Creek Watershed. In Proceedings of the 28th Tennessee Water Resources Symposium, Burns, TN, USA, 10–12 April 2019; Tennessee Section of the American Water Resources Association: Burns, TN, USA, 2019; pp. 1C-2–1C-6. [Google Scholar]
- National Park Service Overview of Lake Mead. Available online: https://www.nps.gov/lake/learn/nature/overview-of-lake-mead.htm (accessed on 8 June 2023).
- Edalat, M.M.; Stephen, H. Socio-Economic Drought Assessment in Lake Mead, USA, Based on a Multivariate Standardized Water-Scarcity Index. Hydrol. Sci. J. 2019, 64, 555–569. [Google Scholar] [CrossRef]
- Imen, S.; Chang, N.-B.; Yang, Y.J. Monitoring Spatiotemporal Total Organic Carbon Concentrations In Lake Mead With Integrated Data Fusion And Mining (IDFM) Technique. Int. Conf. Hydroinform. 2014, 35, 1064–1093. [Google Scholar]
- Wolfe, E. Beached Boats and Sinking Shorelines: See What Extreme Drought Has Exposed at Lake Mead Beached Boats and Sinking Shorelines. Available online: https://www.cbsnews.com/news/lake-mead-water-level-historic-low-drought-heres-what-that-means/ (accessed on 8 June 2023).
- Czachor, E.M. Lake Mead’s Water Level Has Never Been Lower. Here’s What That Means. Available online: https://www.cbsnews.com/news/lake-mead-water-level-historic-low-drought-heres-what-that-means/ (accessed on 8 June 2023).
- Center for Business and Economic Research 2020–2060 Population Forecasts. 2020. Available online: https://files.clarkcountynv.gov/clarknv/2020 CBER Population Forecasts.pdf (accessed on 8 June 2023).
- Venkatesan, A.K.; Ahmad, S.; Johnson, W.; Batista, J.R. Systems Dynamic Model to Forecast Salinity Load to the Colorado River Due to Urbanization within the Las Vegas Valley. Sci. Total Environ. 2011, 409, 2616–2625. [Google Scholar] [CrossRef]
- Buma, W.G.; Lee, S. Il Evaluation of Sentinel-2 and Landsat 8 Images for Estimating Chlorophyll-a Concentrations in Lake Chad, Africa. Remote Sens. 2020, 12, 2437. [Google Scholar] [CrossRef]
- Ogashawara, I.; Mishra, D.R.; Gitelson, A.A. Remote Sensing of Inland Waters: Background and Current State-of-the-Art; Elsevier Inc.: Amsterdam, The Netherlands, 2017; ISBN 9780128046548. [Google Scholar]
- Vakili, T.; Amanollahi, J. Determination of Optically Inactive Water Quality Variables Using Landsat 8 Data: A Case Study in Geshlagh Reservoir Affected by Agricultural Land Use. J. Clean. Prod. 2020, 247, 119134. [Google Scholar] [CrossRef]
- Zhang, X.; Fichot, C.G.; Baracco, C.; Guo, R.; Neugebauer, S.; Bengtsson, Z.; Ganju, N.; Fagherazzi, S. Determining the Drivers of Suspended Sediment Dynamics in Tidal Marsh-Influenced Estuaries Using High-Resolution Ocean Color Remote Sensing. Remote Sens. Environ. 2020, 240, 111682. [Google Scholar] [CrossRef]
- Adjovu, G.E.; Stephen, H.; Ahmad, S. Spatiotemporal Variability in Total Dissolved Solids and Total Suspended Solids along the Colorado River. Hydrology 2023, 10, 125. [Google Scholar] [CrossRef]
- Chen, X.; Liu, L.; Zhang, X.; Li, J.; Wang, S.; Liu, D.; Duan, H.; Song, K. An Assessment of Water Color for Inland Water in China Using a Landsat 8-Derived Forel-Ule Index and the Google Earth Engine Platform. IEEE J. Sel. Top. Appl. Earth Obs. Remote Sens. 2021, 14, 5773–5785. [Google Scholar] [CrossRef]
- Kumar, D.N.; Reshmidevi, T.V. Remote Sensing Applications in Water Resources. J. Indian Inst. Sci. 2013, 93, 163–188. [Google Scholar]
- Mondal, K.C.; Rathod, K.G.; Joshi, H.M.; Mandal, H.S.; Khan, R.; Rajendra, K.; Mawale, Y.K.; Priya, K.; Jhariya, D.C. Impact of Land-Use and Land-Cover Change on Groundwater Quality and Quantity in the Raipur, Chhattisgarh, India: A Remote Sensing and GIS Approach. IOP Conf. Ser. Earth Environ. Sci. 2020, 597, 012011. [Google Scholar] [CrossRef]
- Butler, B.A.; Ford, R.G. Evaluating Relationships between Total Dissolved Solids (TDS) and Total Suspended Solids (TSS) in a Mining-Influenced Watershed. Mine Water Environ. 2018, 31, 18–30. [Google Scholar] [CrossRef] [PubMed]
- American Public Health Association; American Water Works Association; Water Environment Federation. Standard Methods for the Examination of Water and Wastewater; Baird, R.B., Eaton, A.D., Rice, E.W., Eds.; American Public Health Association: Washington, DC, USA, 2017; ISBN 9788578110796. [Google Scholar]
- Hossain, A.K.M.A.; Chao, X.; Jia, Y. Development of Remote Sensing Based Index for Estimating/Mapping Suspended Sediment Concentration in River and Lake Environments. In Proceedings of the 8th International Symposium on Ecohydraulics, Seoul, Republic of Korea, 12–16 September 2010; pp. 578–585. [Google Scholar]
- Adjovu, G.E.; Stephen, H.; Ahmad, S. Monitoring of Total Dissolved Solids Using Remote Sensing Band Reflectance and Salinity Indices: A Case Study of the Imperial County Section, AZ-CA, of the Colorado River. In Proceedings of the World Environmental and Water Resources Congress 2022, Atlanta, GA, USA, 5–8 June 2022. [Google Scholar] [CrossRef]
- Adjovu, G.E.; Ali Shaikh, T.; Stephen, H.; Ahmad, S. Utilization of Machine Learning Models and Satellite Data for the Estimation of Total Dissolved Solids in the Colorado River System. In World Environmental and Water Resources Congress 2023; American Society of Civil Engineers: Henderson, NV, USA, 2023; Volume 1, pp. 1147–1160. [Google Scholar]
- Crotts, A. An Experimental Technique in Lowering Total Dissolved Solids in Wastewater. Bachelor’s Thesis, University of Nevada, Las Vegas, NV, USA, 1996. [Google Scholar] [CrossRef]
- Maliki, A.A.A.; Chabuk, A.; Sultan, M.A.; Hashim, B.M.; Hussain, H.M.; Al-Ansari, N. Estimation of Total Dissolved Solids in Water Bodies by Spectral Indices Case Study: Shatt Al-Arab River. Water. Air. Soil Pollut. 2020, 231, 482. [Google Scholar] [CrossRef]
- Hossain, A.K.M.A.; Mathias, C.; Blanton, R. Remote Sensing of Turbidity in the Tennessee River Using Landsat 8 Satellite. Remote Sens. 2021, 13, 3785. [Google Scholar] [CrossRef]
- Rhoades, J.D.; Corwin, D.L.; Lesch, S.M. Geospatial Measurements of Soil Electrical Conductivity to Assess Soil Salinity and Diffuse Salt Loading from Irrigation. Geophys. Monogr. Ser. 1998, 108, 197–215. [Google Scholar] [CrossRef]
- Colorado River Basin Salinity Control Forum 2020 Review: Water Quality Standards for Salinity, Colorado River System. Available online: https://coloradoriversalinity.org/docs/2020%20REVIEW%20-%20Final%20w%20appendices.pdf (accessed on 8 June 2023).
- Tillman, F.D.; Anning, D.W. A Data Reconnaissance on the Effect of Suspended-Sediment Concentrations on Dissolved-Solids Concentrations in Rivers and Tributaries in the Upper Colorado River Basin. J. Hydrol. 2014, 519, 1020–1030. [Google Scholar] [CrossRef]
- Bureau of Reclamation Quality of Water Progress Report No. 24. Available online: https://www.usbr.gov/uc/progact/salinity/pdfs/PR24final.pdf (accessed on 8 June 2023).
- Nauman, T.W.; Ely, C.P.; Miller, M.P.; Duniway, M.C. Salinity Yield Modeling of the Upper Colorado River Basin Using 30-m Resolution Soil Maps and Random Forests. Water Resour. Res. 2019, 55, 4954–4973. [Google Scholar] [CrossRef]
- Tillman, F.D.; Day, N.K.; Miller, M.P.; Miller, O.L.; Rumsey, C.A.; Wise, D.R.; Longley, P.C.; McDonnell, M.C. A Review of Current Capabilities and Science Gaps in Water Supply Data, Modeling, and Trends for Water Availability Assessments in the Upper Colorado River Basin. Water 2022, 14, 3813. [Google Scholar] [CrossRef]
- Ladwig, R.; Rock, L.A.; Dugan, H.A. Impact of Salinization on Lake Stratification and Spring Mixing. Limnol. Oceanogr. Lett. 2021, 8, 93–102. [Google Scholar] [CrossRef]
- Weber-Scannell, P.K.; Duffy, L.K. Effects of Total Dissolved Solids on Aquatic Organisms: A Review of Literature and Recommendation for Salmonid Species. Am. J. Environ. Sci. 2007, 3, 1–6. Available online: https://thescipub.com/abstract/ajessp.2007.1.6 (accessed on 8 June 2023).
- Mueller, J.S.; Grabowski, T.B.; Brewer, S.K.; Worthington, T.A. Effects of Temperature, Total Dissolved Solids, and Total Suspended Solids on Survival and Development Rate of Larval Arkansas River Shiner. J. Fish Wildl. Manag. 2017, 8, 79–88. [Google Scholar] [CrossRef] [Green Version]
- Sallam, G.A.H.; Elsayed, E.A. Estimating Relations between Temperature, Relative Humidity as Independent Variables and Selected Water Quality Parameters in Lake Manzala, Egypt. Ain Shams Eng. J. 2018, 9, 1–14. [Google Scholar] [CrossRef] [Green Version]
- Sagan, V.; Peterson, K.T.; Maimaitijiang, M.; Sidike, P.; Sloan, J.; Greeling, B.A.; Maalouf, S.; Adams, C. Monitoring Inland Water Quality Using Remote Sensing: Potential and Limitations of Spectral Indices, Bio-Optical Simulations, Machine Learning, and Cloud Computing. Earth-Sci. Rev. 2020, 205, 103187. [Google Scholar] [CrossRef]
- Imen, S.; Chang, N.-B.; Yang, Y.J. Developing the Remote Sensing-Based Early Warning System for Monitoring TSS Concentrations in Lake Mead. J. Environ. Manag. 2015, 160, 73–89. [Google Scholar] [CrossRef]
- Hach Solids (Total & Dissolved). Available online: https://www.hach.com/parameters/solids (accessed on 8 June 2023).
- Hajigholizadeh, M.; Moncada, A.; Kent, S.; Melesse, A.M. Land–lake Linkage and Remote Sensing Application in Water Quality Monitoring in Lake Okeechobee, Florida, Usa. Land 2021, 10, 147. [Google Scholar] [CrossRef]
- Sanjoto, T.B.; Elwafa, A.H.; Tjahjono, H.; Sidiq, W.A.B.N. Study of Total Suspended Solid Concentration Based on Doxaran Algorithm Using Landsat 8 Image in Coastal Water between Bodri River Estuary up to East Flood Canal Semarang City. IOP Conf. Ser. Earth Environ. Sci. 2020, 561, 0120530. [Google Scholar] [CrossRef]
- Gholizadeh, M.H. Water Quality Modelling Using Multivariate Statistical Analysis and Remote Sensing in South Florida. Ph.D. Dissertation, Florida International University, Miami, FL, USA, 2016. [Google Scholar] [CrossRef]
- Fant, C.; Srinivasan, R.; Boehlert, B.; Rennels, L.; Chapra, S.C.; Strzepek, K.M.; Corona, J.; Allen, A.; Martinich, J. Climate Change Impacts on US Water Quality Using Two Models: HAWQS and US Basins. Water 2017, 9, 118. [Google Scholar] [CrossRef] [Green Version]
- Malian, A.; Rezayan, H.; Sakkizadeh, M.; Farhang, Z. Reservoir Water Temperature Modeling by Geostatistical Analysis of ASTER Images (Case Study: Dez Dam, Iran). Int. J. Energ. Water Resour. 2017, 1, 27–36. [Google Scholar]
- Hafeez, S.; Wong, M.S.; Ho, H.C.; Nazeer, M.; Nichol, J.; Abbas, S.; Tang, D.; Lee, K.H.; Pun, L. Comparison of Machine Learning Algorithms for Retrieval of Water Quality Indicators in Case-II Waters: A Case Study of Hong Kong. Remote Sens. 2019, 11, 617. [Google Scholar] [CrossRef] [Green Version]
- Mesa-Marín, J.; Redondo-Gómez, S.; Rodríguez-Llorente, I.D.; Pajuelo, E.; Mateos-Naranjo, E. Seasonal Phytoplankton Succession in Netravathi—Gurupura Estuary, Karnataka, India: Study on a Three Tier Hydrographic Platform. Estuar. Coast. Shelf Sci. 2020, 242, 106830. [Google Scholar] [CrossRef]
- Harvey, E.T.; Kratzer, S.; Philipson, P. Satellite-Based Water Quality Monitoring for Improved Spatial and Temporal Retrieval of Chlorophyll-a in Coastal Waters. Remote Sens. Environ. 2015, 158, 417–430. [Google Scholar] [CrossRef]
- Ondrusek, M.; Stengel, E.; Kinkade, C.S.; Vogel, R.L.; Keegstra, P.; Hunter, C.; Kim, C. The Development of a New Optical Total Suspended Matter Algorithm for the Chesapeake Bay. Remote Sens. Environ. 2012, 119, 243–254. [Google Scholar] [CrossRef] [Green Version]
- Barrett, D.C.; Frazier, A.E. Automated Method for Monitoring Water Quality Using Landsat Imagery. Water 2016, 8, 257. [Google Scholar] [CrossRef] [Green Version]
- National Park Service Mixing It up in Lakes Mead & Mohave. Available online: https://www.nps.gov/lake/learn/hydrology.htm (accessed on 8 June 2023).
- Bureau of Reclamation Windy Gap Firming Project Water Resources Technical Report. Available online: https://www.usbr.gov/gp/ecao/wgfp_eis/water_resources_tech_report.pdf (accessed on 8 June 2023).
- Appendix F:Water Quality Modeling Documentation. Available online: https://www.usbr.gov/lc/region/programs/strategies/FEIS/AppF.pdf (accessed on 8 June 2023).
- Hayden, L.; Wood, J.; Hassell, S.; Jones, A.; Deese, A. Water-Quality Assessment of the Pasquotank River Watershed; Analysis of Dissolved Oxygen, PH, Salt, Total Dissolved Solids, and Conductivity. Available online: http://nia.ecsu.edu/ureomps2011/teams/ptank/PQT%20IEEE%20PAPER.pdf (accessed on 8 June 2023).
- Woodside, J. What Is the Difference among Turbidity, TDS, and TSS? Available online: https://www.ysi.com/ysi-blog/water-blogged-blog/2022/05/understanding-turbidity-tds-and-tss (accessed on 8 June 2023).
- Zhang, K.; Amineh, R.K.; Dong, Z.; Nadler, D. Microwave Sensing of Water Quality. IEEE Access 2019, 7, 69481–69493. [Google Scholar] [CrossRef]
- Venkatesan, A.K.; Ahmad, S.; Johnson, W.; Batista, J.R. Salinity Reduction and Energy Conservation in Direct and Indirect Potable Water Reuse. Desalination 2011, 272, 120–127. [Google Scholar] [CrossRef]
- Earp, K.J.; Moreo, M.T. Evaporation from Lake Mead and Lake Mohave, Nevada and Arizona, 2010–2019; United States Geological Survey: Reston, VA, USA, 2021. [CrossRef]
- Rosen, M.R.; Turner, K.; Goodbred, S.L.; Miller, J.M. A Synthesis of Aquatic Science for Management of Lakes Mead and Mohave; United States Geological Survey: Reston, VA, USA, 2012; ISBN 9781411335271.
- National Park Service Sun, More Sun and a Bit of Rain. Available online: https://www.nps.gov/lake/planyourvisit/weather.htm (accessed on 9 June 2023).
- Adjovu, G.E.; Ahmad, S.; Stephen, H. Analysis of Suspended Material in Lake Mead Using Remote Sensing Indices. In Proceedings of the World Environmental and Water Resources Congress 2021, Virtual Conference, 7–11 June 2021. [Google Scholar] [CrossRef]
- Sierks, M.D.; Kalansky, J.; Cannon, F.; Ralph, F.M. Characteristics, Origins, and Impacts of Summertime Extreme Precipitation in the Lake Mead Watershed. J. Clim. 2020, 33, 2663–2680. [Google Scholar] [CrossRef]
- Morfín, O. Effects of System Conservation on Salinity in Lake Mead. Available online: https://www.multi-statesalinitycoalition.com/wp-content/uploads/2017-Morfin.pdf (accessed on 8 June 2023).
- Darvishi, M.; Destouni, G.; Aminjafari, S.; Jaramillo, F. Multi-Sensor InSAR Assessment of Ground Deformations around Lake Mead and Its Relation to Water Level Changes. Remote Sens. 2021, 13, 406. [Google Scholar] [CrossRef]
- USBR. Colorado River Interim Surplus Criteria Draft Environmental Impact Statement. 2020. Available online: https://www.usbr.gov/lc/region/g4000/surplus1/pdf/Chapters/Chapter_3/Chapter_3.05.pdf (accessed on 8 June 2023).
- Li, Y.; Acharya, K.; Chen, D.; Stone, M. Modeling Water Ages and Thermal Structure of Lake Mead under Changing Water Levels. Lake Reserv. Manag. 2010, 26, 258–272. [Google Scholar] [CrossRef]
- Bai, X.; Acharya, K. Algae-Mediated Removal of Selected Pharmaceutical and Personal Care Products (PPCPs) from Lake Mead Water. Sci. Total Environ. 2017, 581–582, 734–740. [Google Scholar] [CrossRef]
- Bid, S.; Siddique, G. Identification of Seasonal Variation of Water Turbidity Using NDTI Method in Panchet Hill Dam, India. Model. Earth Syst. Environ. 2019, 5, 1179–1200. [Google Scholar] [CrossRef]
- Kondolf, G.M.; Gao, Y.; Annandale, G.W.; Morris, G.L.; Jiang, E.; Zhang, J.; Cao, Y.; Carling, P.; Fu, K.; Guo, Q.; et al. Sustainable Sediment Management in Reservoirs and Regulated Rivers: Experiences from Five Continents. Earth’s Future 2014, 2, 256–280. [Google Scholar] [CrossRef]
- Ferrari, R.L. 2001 Lake Mead Sedimentation Survey 2001; U.S. Department of the Interior, Bureau of Reclamation, Technical Service Center, Water Resources Services Division, Sedimentation and River Hydraulics Group: Washington, DC, USA, 2008.
- Dunbar, M.; Harney, S.; Morgan, D.; LaRance, D.; Speaks, F. Lake Mead and Las Vegas Wash 2019 Annual Report. City of Las Vegas, Clark County Water Reclamation District, City of Henderson City, City of North Las Vegas. 2020. Available online: https://drive.google.com/file/d/1XSWvEf74XX2KULmsYQ3ZHRAsOo8RsXN8/view (accessed on 8 June 2023).
- Robinson, A.P.; Hamann, J.D. Forest Analytics with R; Springer: Berlin/Heidelberg, Germany, 2011; ISBN 9781441977618. [Google Scholar]
- US Bureau of Reclamation Reclamation Information Sharing Environment (RISE). Available online: https://data.usbr.gov/ (accessed on 10 June 2023).
- Boulder Canyon Operations Office; River Operations Group; Tighi, S.; Callejo, R. Lake Mead Area and Capacity Tables. Available online: https://www.usbr.gov/lc/region/g4000/LM_AreaCapacityTables2009.pdf (accessed on 9 June 2023).
- Riverware Mathematical Basis for Reservoir Simulation. Available online: https://www.riverware.org/HelpSystem/9.0-Help/index.html#page/SolutionApproaches/Solutions_Simulation.2.2.html%23 (accessed on 9 June 2023).
- US Bureau of Reclamation USBR Hydrologic Database (HDB) System Data Access. Available online: https://www.usbr.gov/pn-bin/hdb/hdb.pl?svr=lchdb&sdi=2091,1776,2093&tstp=MN&t1=2013-01-01&t2=2023-05-01&table=R&mrid=0&format=2 (accessed on 10 June 2023).
- Kim, H. Analysis of Variance (ANOVA) Comparing Means of More than Two Groups. Restor. Dent. Endod. 2014, 7658, 74–77. [Google Scholar] [CrossRef] [PubMed] [Green Version]
- Hidayati, N.F.; Rahman, M.; Fauzana, N.A.; Aisiah, S. Effectiveness of Chitosan To Reduce the Color Value, Turbidity, and Total Dissolved Solids in Shrimp-Washing Wastewater. Russ. J. Agric. Socio-Econ. Sci. 2021, 115, 82–88. [Google Scholar] [CrossRef]
- Kim, T.K. Understanding One-Way Anova Using Conceptual Figures. Korean J. Anesthesiol. 2017, 70, 22–26. [Google Scholar] [CrossRef] [Green Version]
- Suharini, E.; Ariyadi, M.H.; Kurniawan, E. Google Earth pro as a Learning Media for Mitigation and Adaptation of Landslide Disaster. Int. J. Inf. Educ. Technol. 2020, 10, 820–825. [Google Scholar] [CrossRef]
- Koparan, C.; Koc, A.B.; Privette, C.V.; Sawyer, C.B. In Situ Water Quality Measurements Using an Unmanned Aerial Vehicle (UAV) System. Water 2018, 10, 264. [Google Scholar] [CrossRef] [Green Version]
- Poudel, U.; Stephen, H.; Ahmad, S. Evaluating Irrigation Performance and Water Productivity Using EEFlux ET and NDVI. Sustainability 2021, 13, 7967. [Google Scholar] [CrossRef]
- ESRI IDW (Spatial Analyst). Available online: https://pro.arcgis.com/en/pro-app/latest/tool-reference/spatial-analyst/idw.htm (accessed on 9 June 2023).
- Arulbalaji, P.; Padmalal, D.; Sreelash, K. GIS and AHP Techniques Based Delineation of Groundwater Potential Zones: A Case Study from Southern Western Ghats, India. Sci. Rep. 2019, 9, 2082. [Google Scholar] [CrossRef] [Green Version]
- Scheeres, A. Kriging: Spatial Interpolation in Desktop GIS. Available online: https://www.azavea.com/blog/2016/09/12/kriging-spatial-interpolation-desktop-gis/ (accessed on 9 June 2023).
- ESRI Kriging (Spatial Analyst). Available online: https://pro.arcgis.com/en/pro-app/latest/tool-reference/spatial-analyst/kriging.htm (accessed on 9 June 2023).
- O’Connor, D.J. Seasonal and Long-Term Variations of Dissolved Solids in Lakes and Reservoirs. J. Environ. Eng. 1989, 115, 1213–1234. [Google Scholar] [CrossRef]
- Bengtsson, L.; Fortin, V.; Gronewold, A.D.; Tanino, Y.; Surridge, B.; Watson, N.; Herschy, R.W. Water Quality in Lakes and Reservoirs; Springer: Dordrecht, The Netherlands, 2012; ISBN 9781402044106. [Google Scholar]
- EPA 2018 Edition of the Drinking Water Standards and Health Advisories Tables. In Drinking Water Standards and Health Advisories; EPA: Washington, DC, USA, 2018. Available online: https://www.epa.gov/system/files/documents/2022-01/dwtable2018.pdf (accessed on 8 June 2023).
- Epa 816-F-09-004; National Primary Drinking Water Guidelines. U.S. EPA, United States Environmental Protection Agency: Washington, DC, USA, 2009; 7p.
- Mejía Ávila, D.; Torres-Bejarano, F.; Martínez Lara, Z. Spectral Indices for Estimating Total Dissolved Solids in Freshwater Wetlands Using Semi-Empirical Models. A Case Study of Guartinaja and Momil Wetlands. Int. J. Remote Sens. 2022, 43, 2156–2184. [Google Scholar] [CrossRef]
- Venkatesan, A.K.; Ahmad, S.; Batista, J.R.; Johnson, W.S. Total Dissolved Solids Contribution to the Colorado River Associated with the Growth of Las Vegas Valley. In Proceedings of the World Environmental and Water Resources Congress 2010, Providence, RI, USA, 16 May 2010; pp. 3376–3385. [Google Scholar] [CrossRef]
- Whitney, J.W.; Glancy, P.A.; Buckingham, S.E.; Ehrenberg, A.C. Effects of Rapid Urbanization on Streamflow, Erosion, and Sedimentation in a Desert Stream in the American Southwest. Anthropocene 2015, 10, 29–42. [Google Scholar] [CrossRef]
- Joshi, N.; Tamaddun, K.; Parajuli, R.; Kalra, A.; Maheshwari, P.; Mastino, L.; Velotta, M. Future Changes in Water Supply and Demand for Las Vegas Valley: A System Dynamic Approach based on CMIP3 and CMIP5 Climate Projections. Hydrology 2020, 7, 16. [Google Scholar] [CrossRef] [Green Version]
- Giardino, C.; Bresciani, M.; Braga, F.; Cazzaniga, I.; De Keukelaere, L.; Knaeps, E.; Brando, V.E. Bio-Optical Modeling of Total Suspended Solids; Elsevier Inc.: Amsterdam, The Netherlands, 2017; ISBN 9780128046548. [Google Scholar]
- Albuquerque, S. A System Model for Source Water Assessment in the Las Vegas Valley. Master’s Thesis, University of Nevada, Las Vegas, NV, USA, 2004. [Google Scholar]
- Pereira, O.J.R.; Merino, E.R.; Montes, C.R.; Barbiero, L.; Rezende-Filho, A.T.; Lucas, Y.; Melfi, A.J. Estimating Water PH Using Cloud-Based Landsat Images for a New Classification of the NhecolâNdia Lakes (Brazilian Pantanal). Remote Sens. 2020, 12, 1090. [Google Scholar] [CrossRef] [Green Version]
- Mukherjee, A.; Bhanja, S.N.; Wada, Y. Groundwater Depletion Causing Reduction of Baseflow Triggering Ganges River Summer Drying. Sci. Rep. 2018, 8, 12049. [Google Scholar] [CrossRef] [PubMed] [Green Version]
- Khan, N.M.; Rastoskuev, V.V.; Sato, Y.; Shiozawa, S. Assessment of Hydrosaline Land Degradation by Using a Simple Approach of Remote Sensing Indicators. Agric. Water Manag. 2005, 77, 96–109. [Google Scholar] [CrossRef]
- Poddar, S.; Chacko, N.; Swain, D. Estimation of Chlorophyll-a in Northern Coastal Bay of Bengal Using Landsat-8 OLI and Sentinel-2 MSI Sensors. Front. Mar. Sci. 2019, 6, 598. [Google Scholar] [CrossRef]
- Wikipedia Lake Mead. Available online: https://en.wikipedia.org/wiki/Lake_Mead (accessed on 8 June 2023).
- Zach How to Interpret the F-Value and P-Value in ANOVA. Available online: https://www.statology.org/anova-f-value-p-value/ (accessed on 10 June 2023).
- Ghasemi, A.; Zahediasl, S. Normality Tests for Statistical Analysis: A Guide for Non-Statisticians. Int. J. Endocrinol. Metab. 2012, 10, 486–489. [Google Scholar] [CrossRef] [Green Version]
- Mishra, P.; Pandey, C.M.; Singh, U.; Gupta, A.; Sahu, C.; Keshri, A. Descriptive Statistics and Normality Tests for Statistical Data. Ann. Card. Anaesth. 2019, 22, 67–72. [Google Scholar] [CrossRef]
- Pérez-Gutiérrez, J.D.; Paz, J.O.; Tagert, M.L.M. Seasonal Water Quality Changes in On-Farm Water Storage Systems in a South-Central U.S. Agricultural Watershed. Agric. Water Manag. 2017, 187, 131–139. [Google Scholar] [CrossRef] [Green Version]
- Giao, N.T.; Van Cong, N.; Nhien, H.T.H. Using Remote Sensing and Multivariate Statistics in Analyzing the Relationship between Land Use Pattern and Water Quality in Tien Giang Province, Vietnam. Water 2021, 13, 1093. [Google Scholar] [CrossRef]
Figure 1.
Map of Lake Mead located in the Colorado River Basin (green boundary). The small blue boundary indicates the position of the lake in the Colorado River Basin. Lake Mead boundary is indicated by the red boundary. The blue arrows indicate the flow directions in and out of the lake with the study area shown in the yellow square boundary.

Figure 2.
Map showing the locations of the stations indicated in yellow numbers on Lake Mead. Red arrows indicate the flow directions in and out of the study area. The blue arrow identifies the Colorado River through Lake Mead.
Figure 2.
Map showing the locations of the stations indicated in yellow numbers on Lake Mead. Red arrows indicate the flow directions in and out of the study area. The blue arrow identifies the Colorado River through Lake Mead.
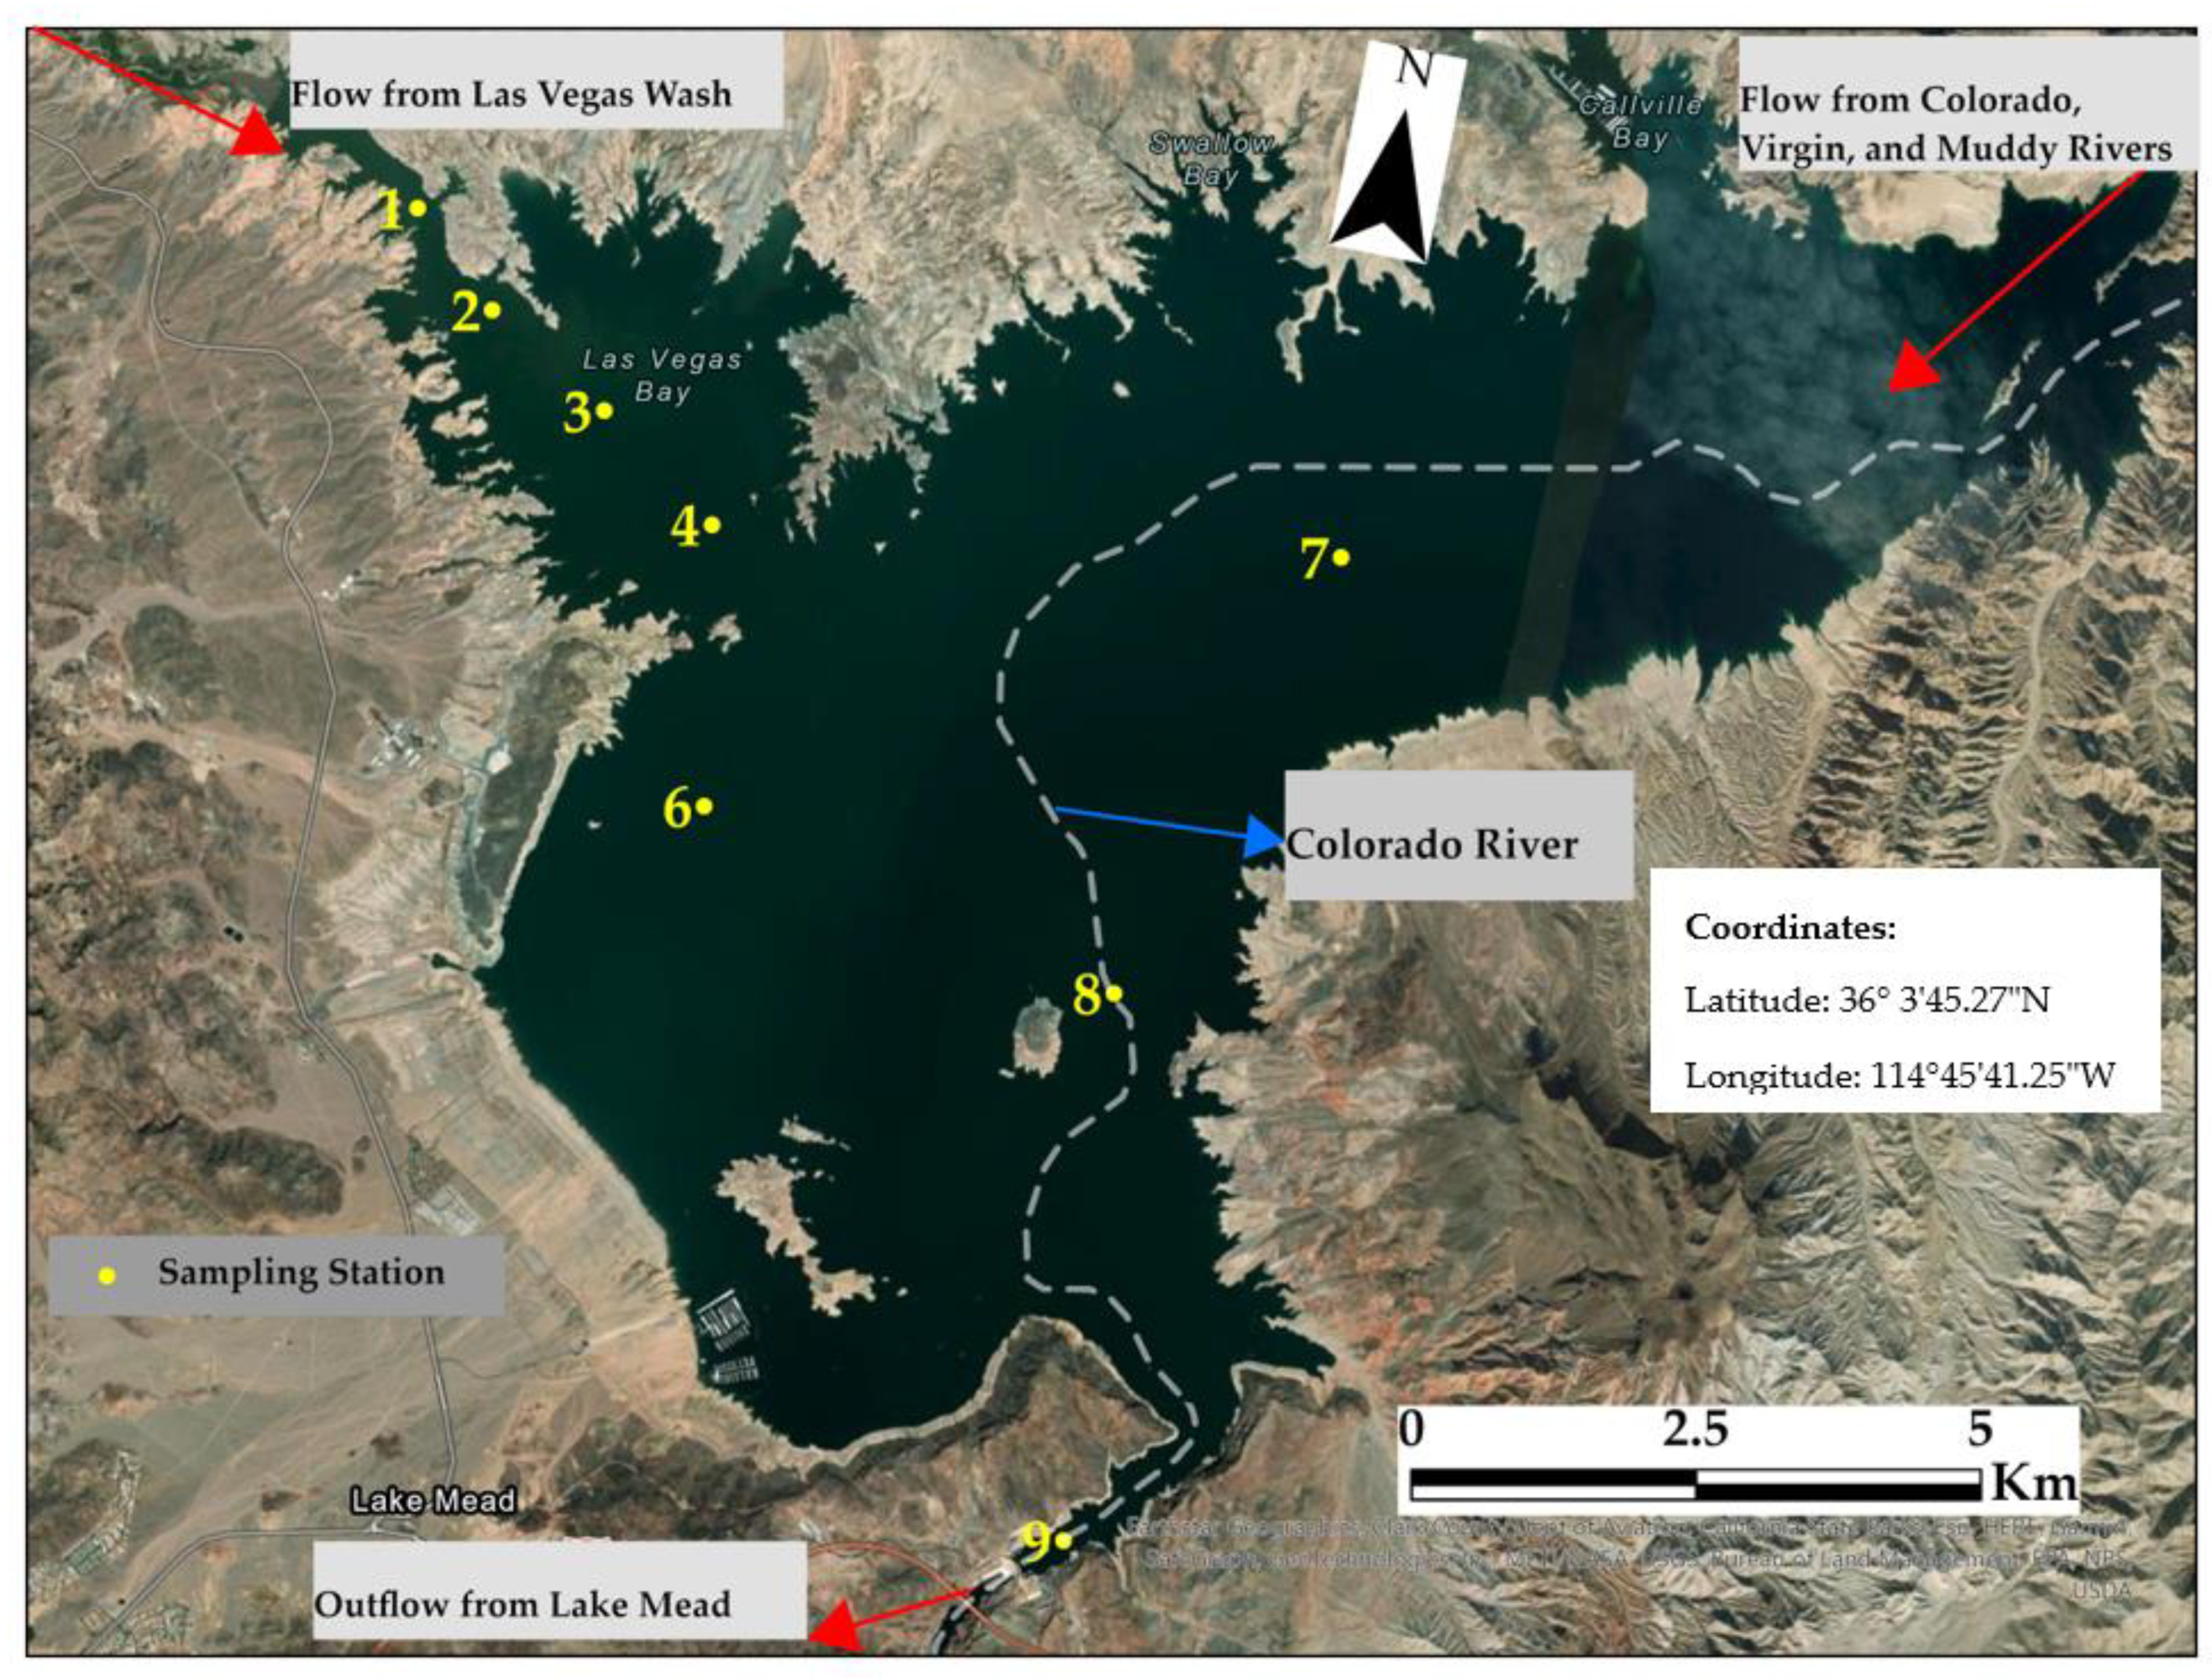
Figure 3.
Time series variations of key WQPs for Station 1 from 2016–2021.
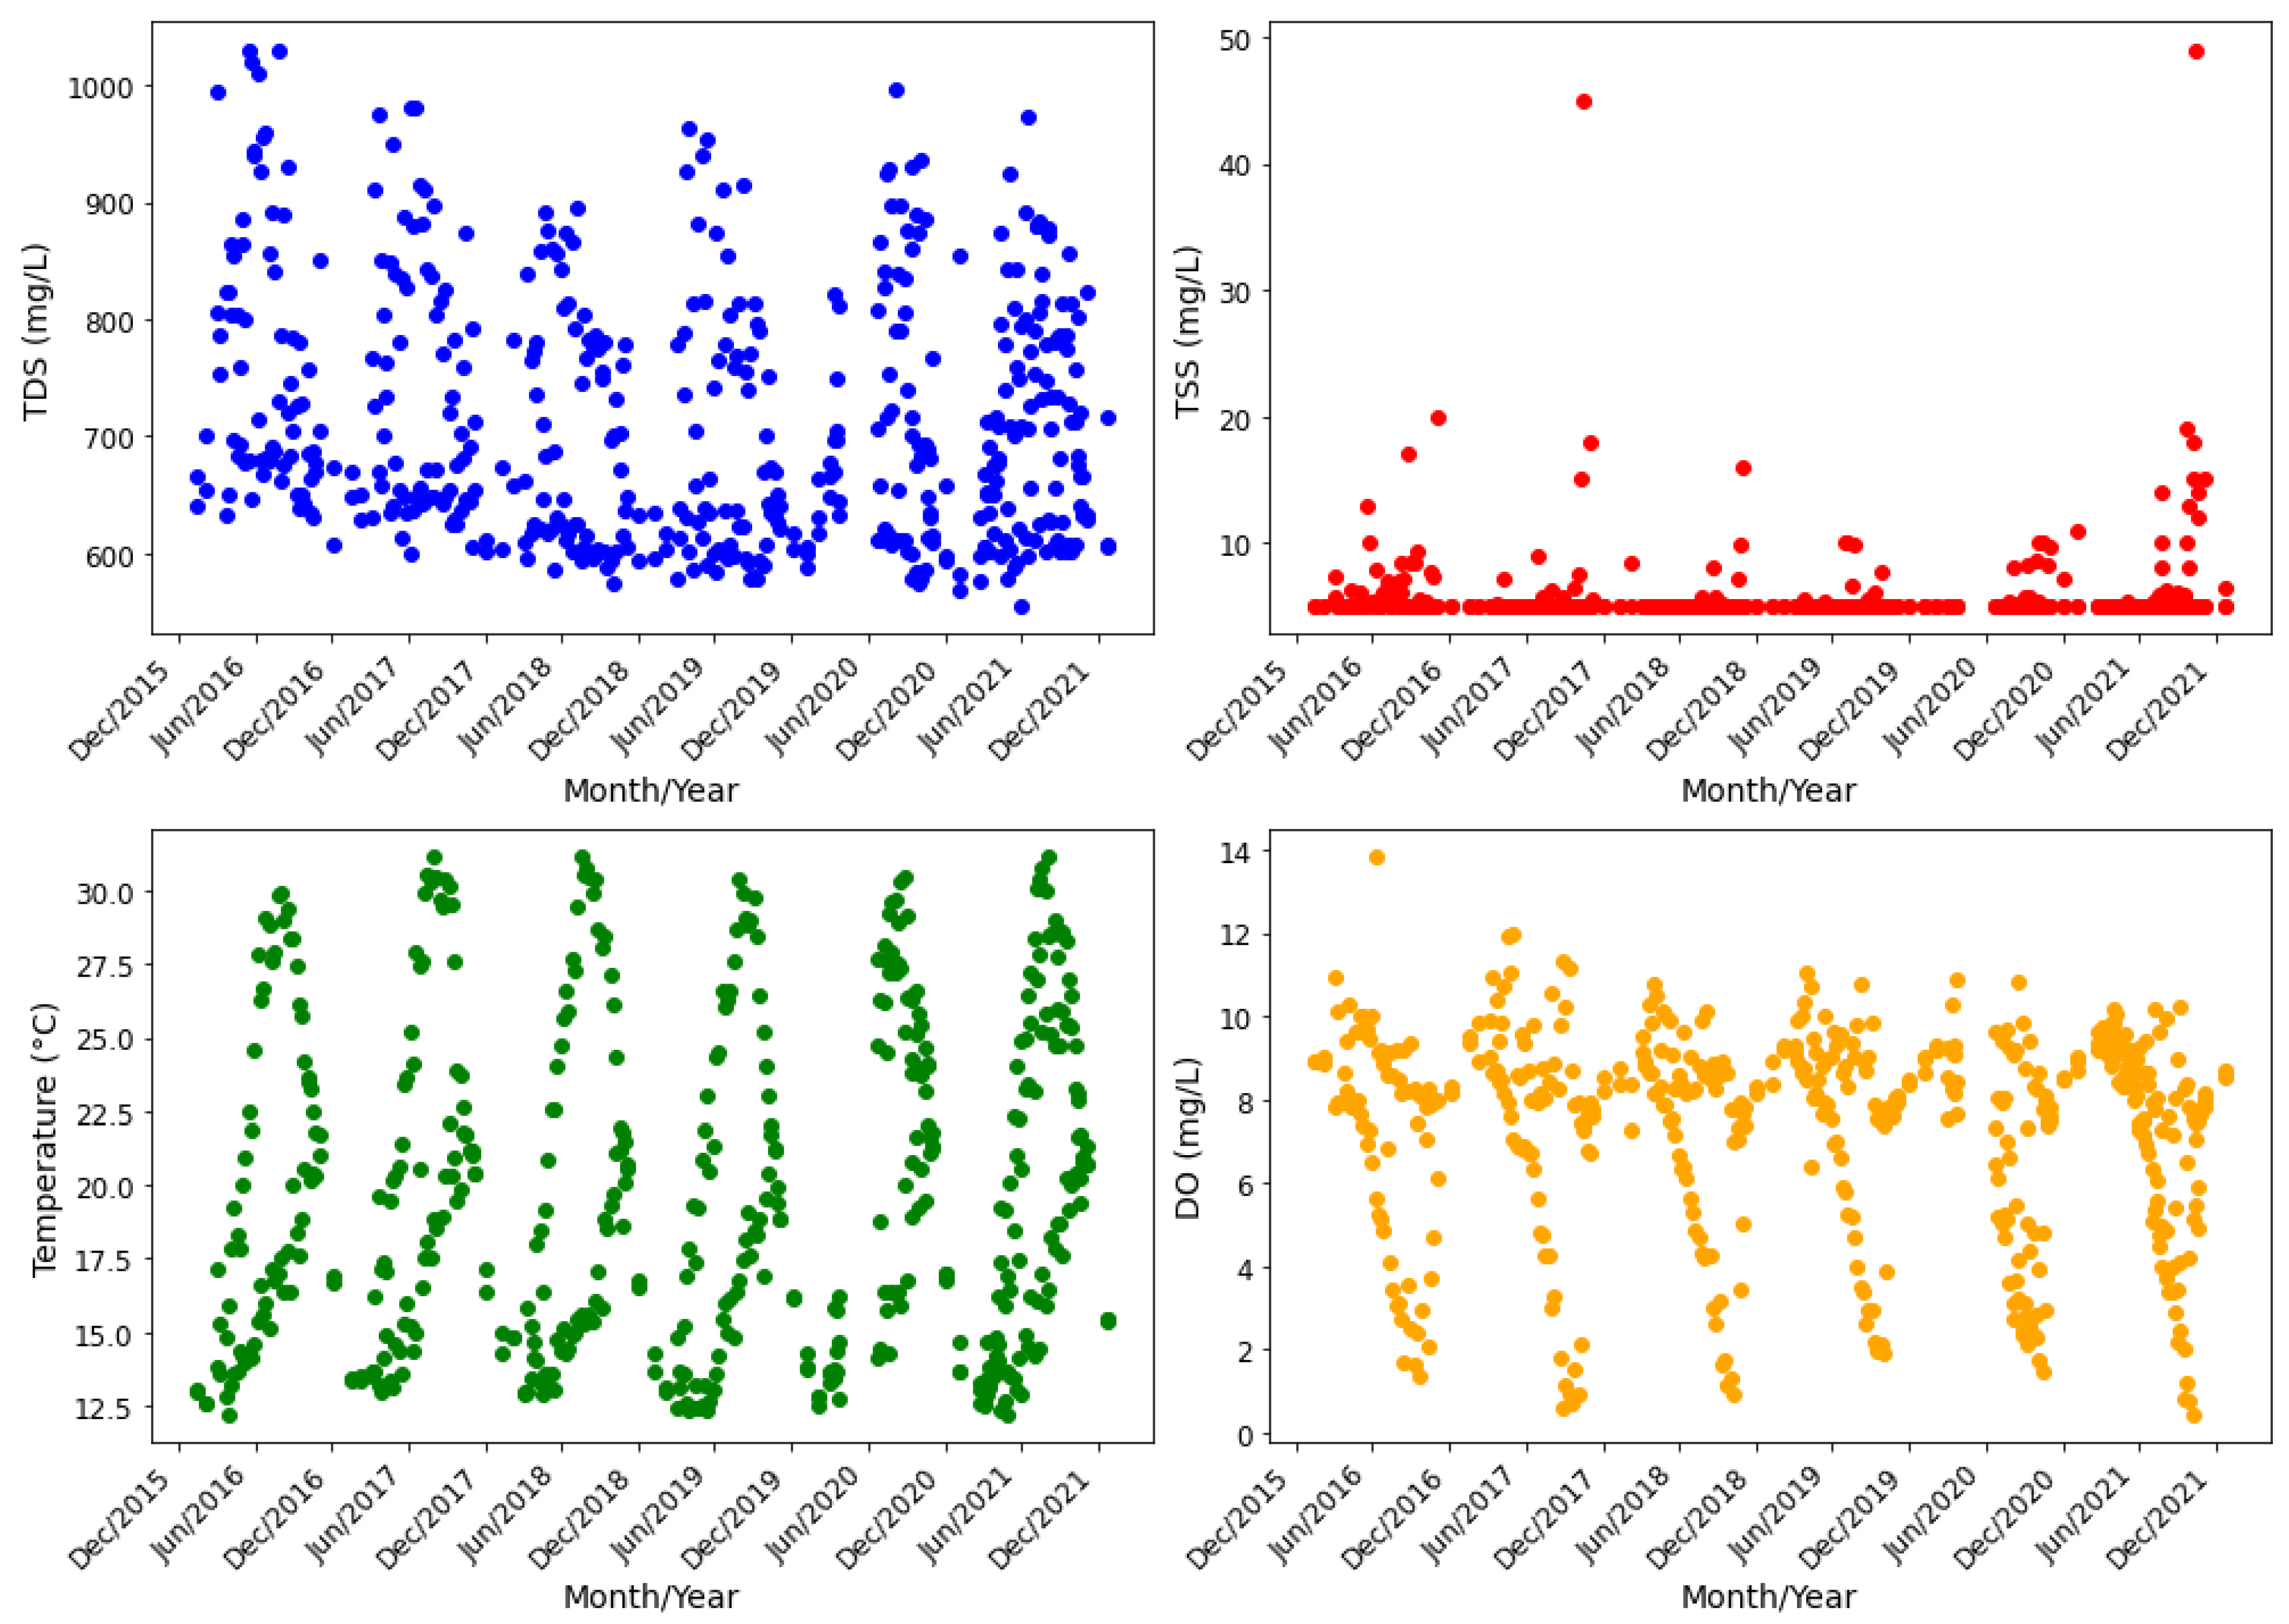
Figure 4.
Time series variations of key WQPs for Station 6 from 2016–2021.
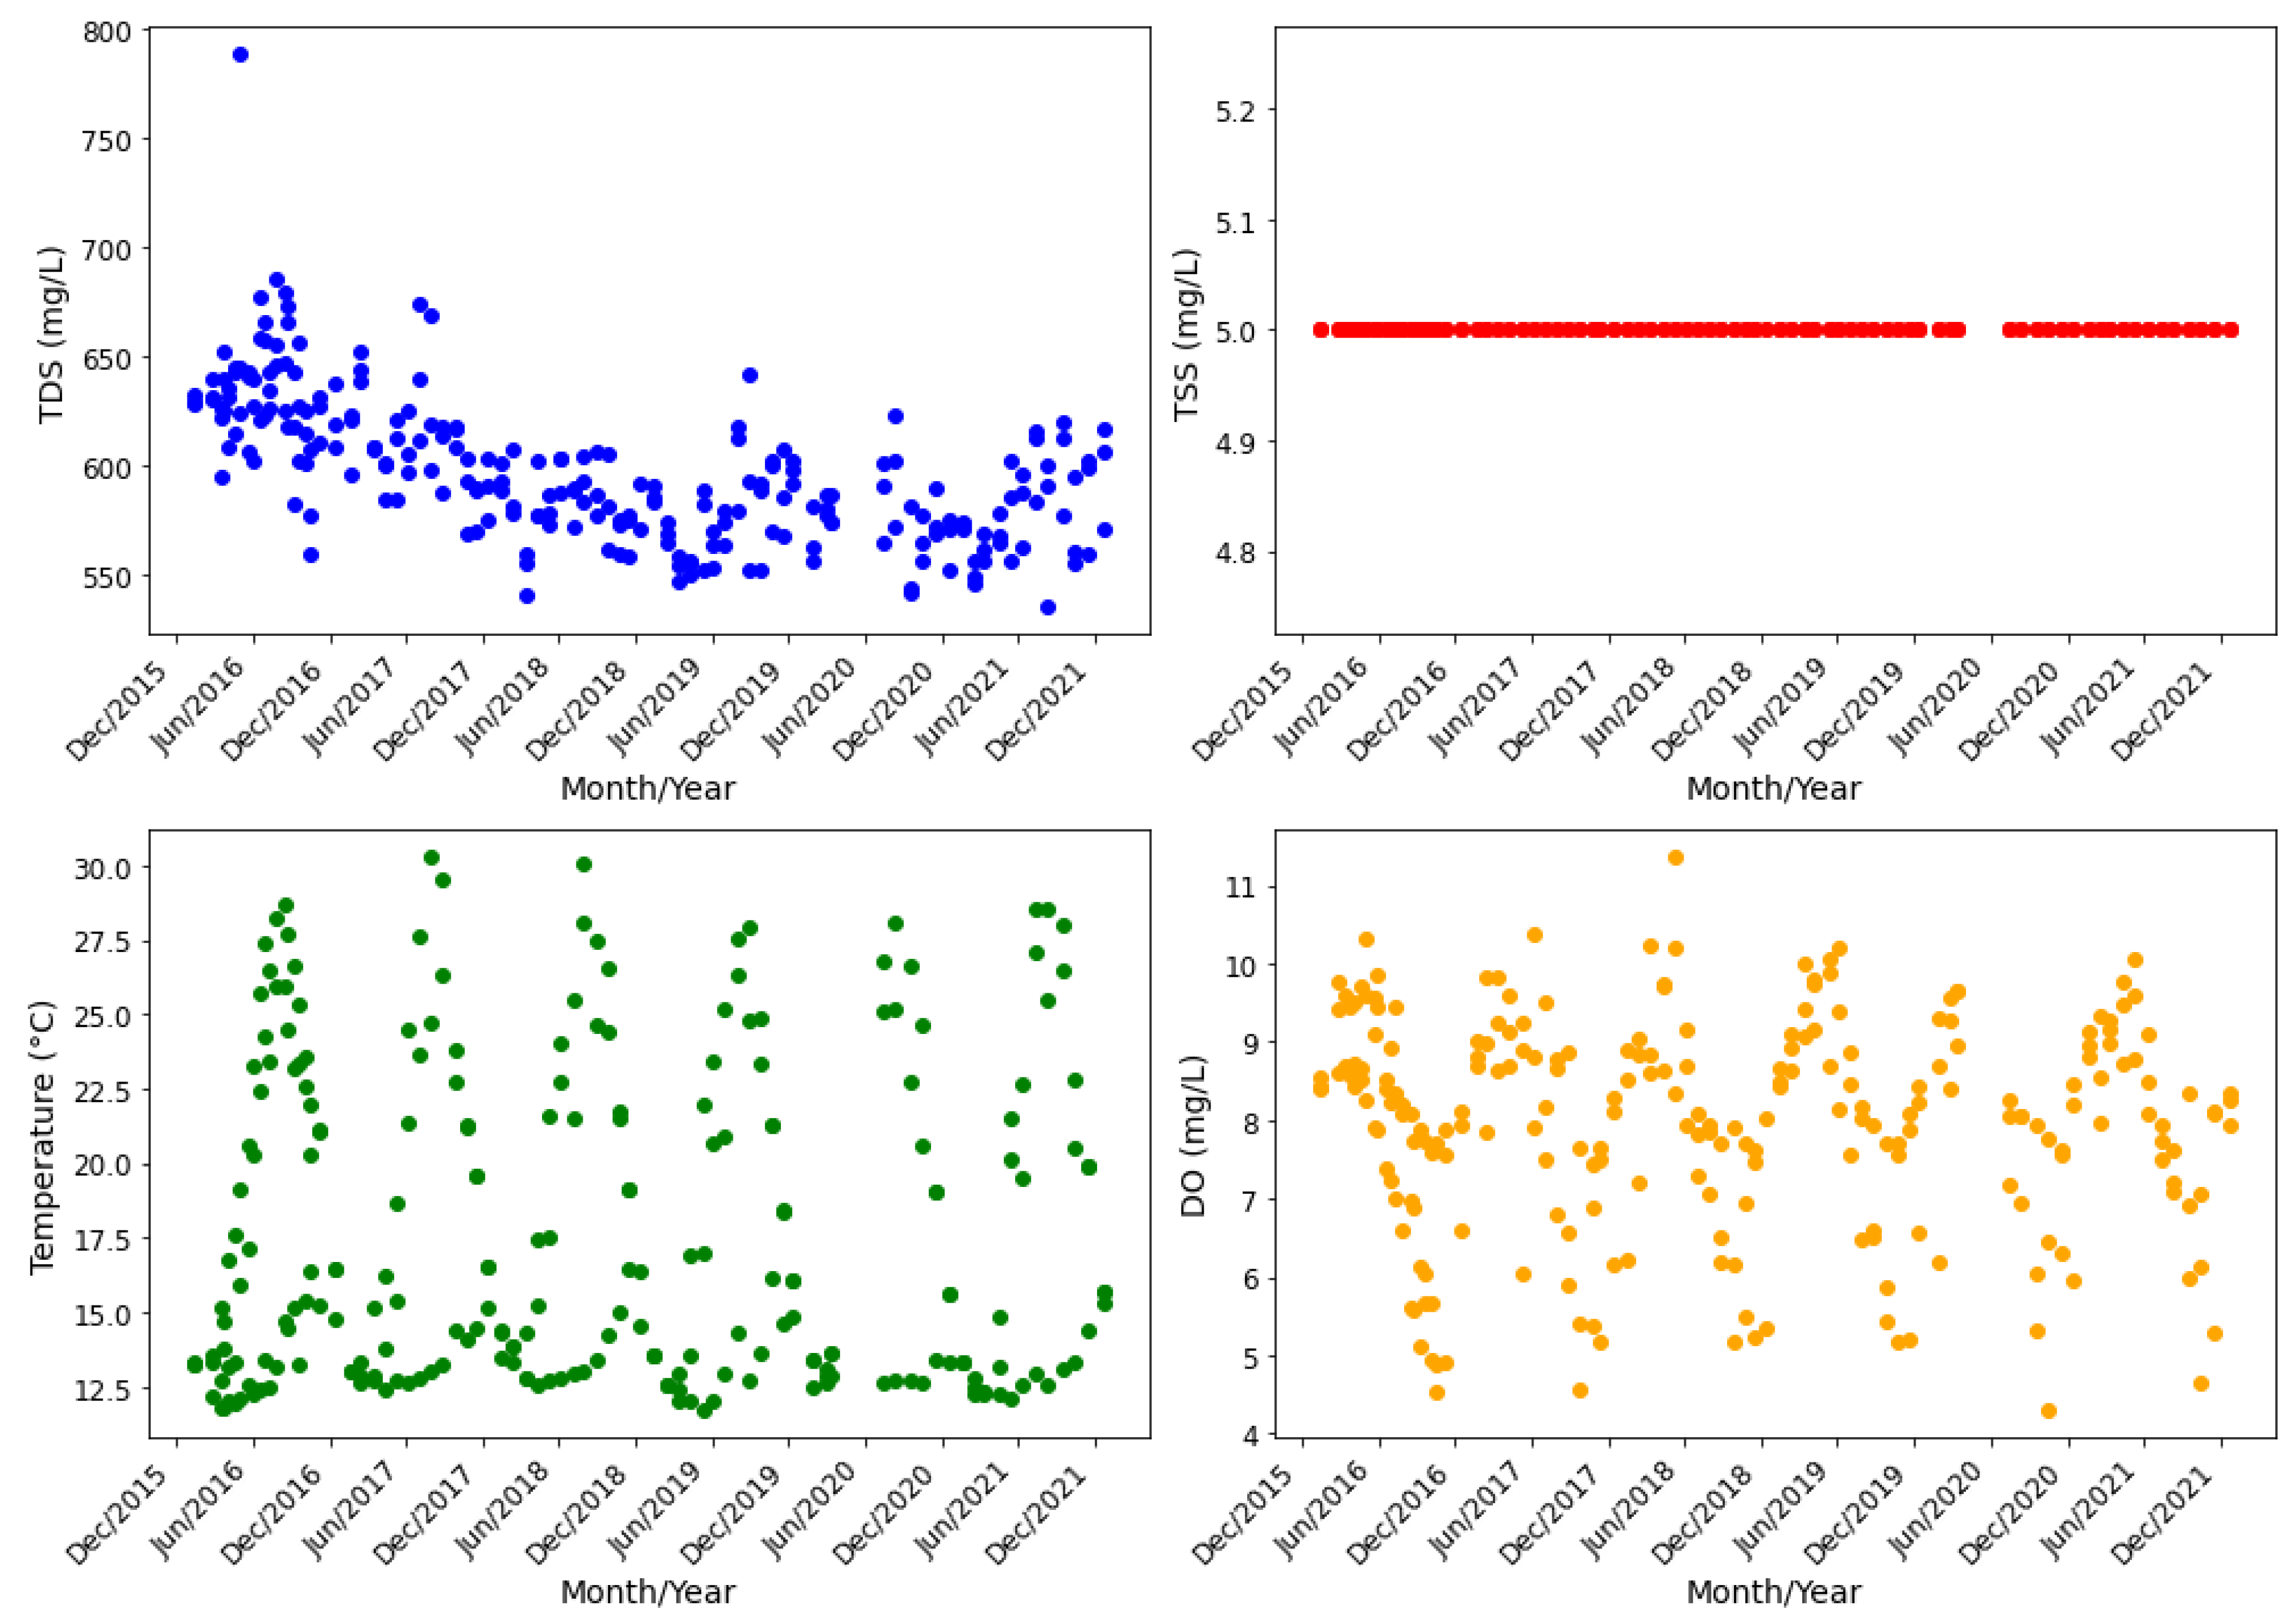
Figure 5.
Spatial distribution of the key WQPs along the study area for 2016–2021.
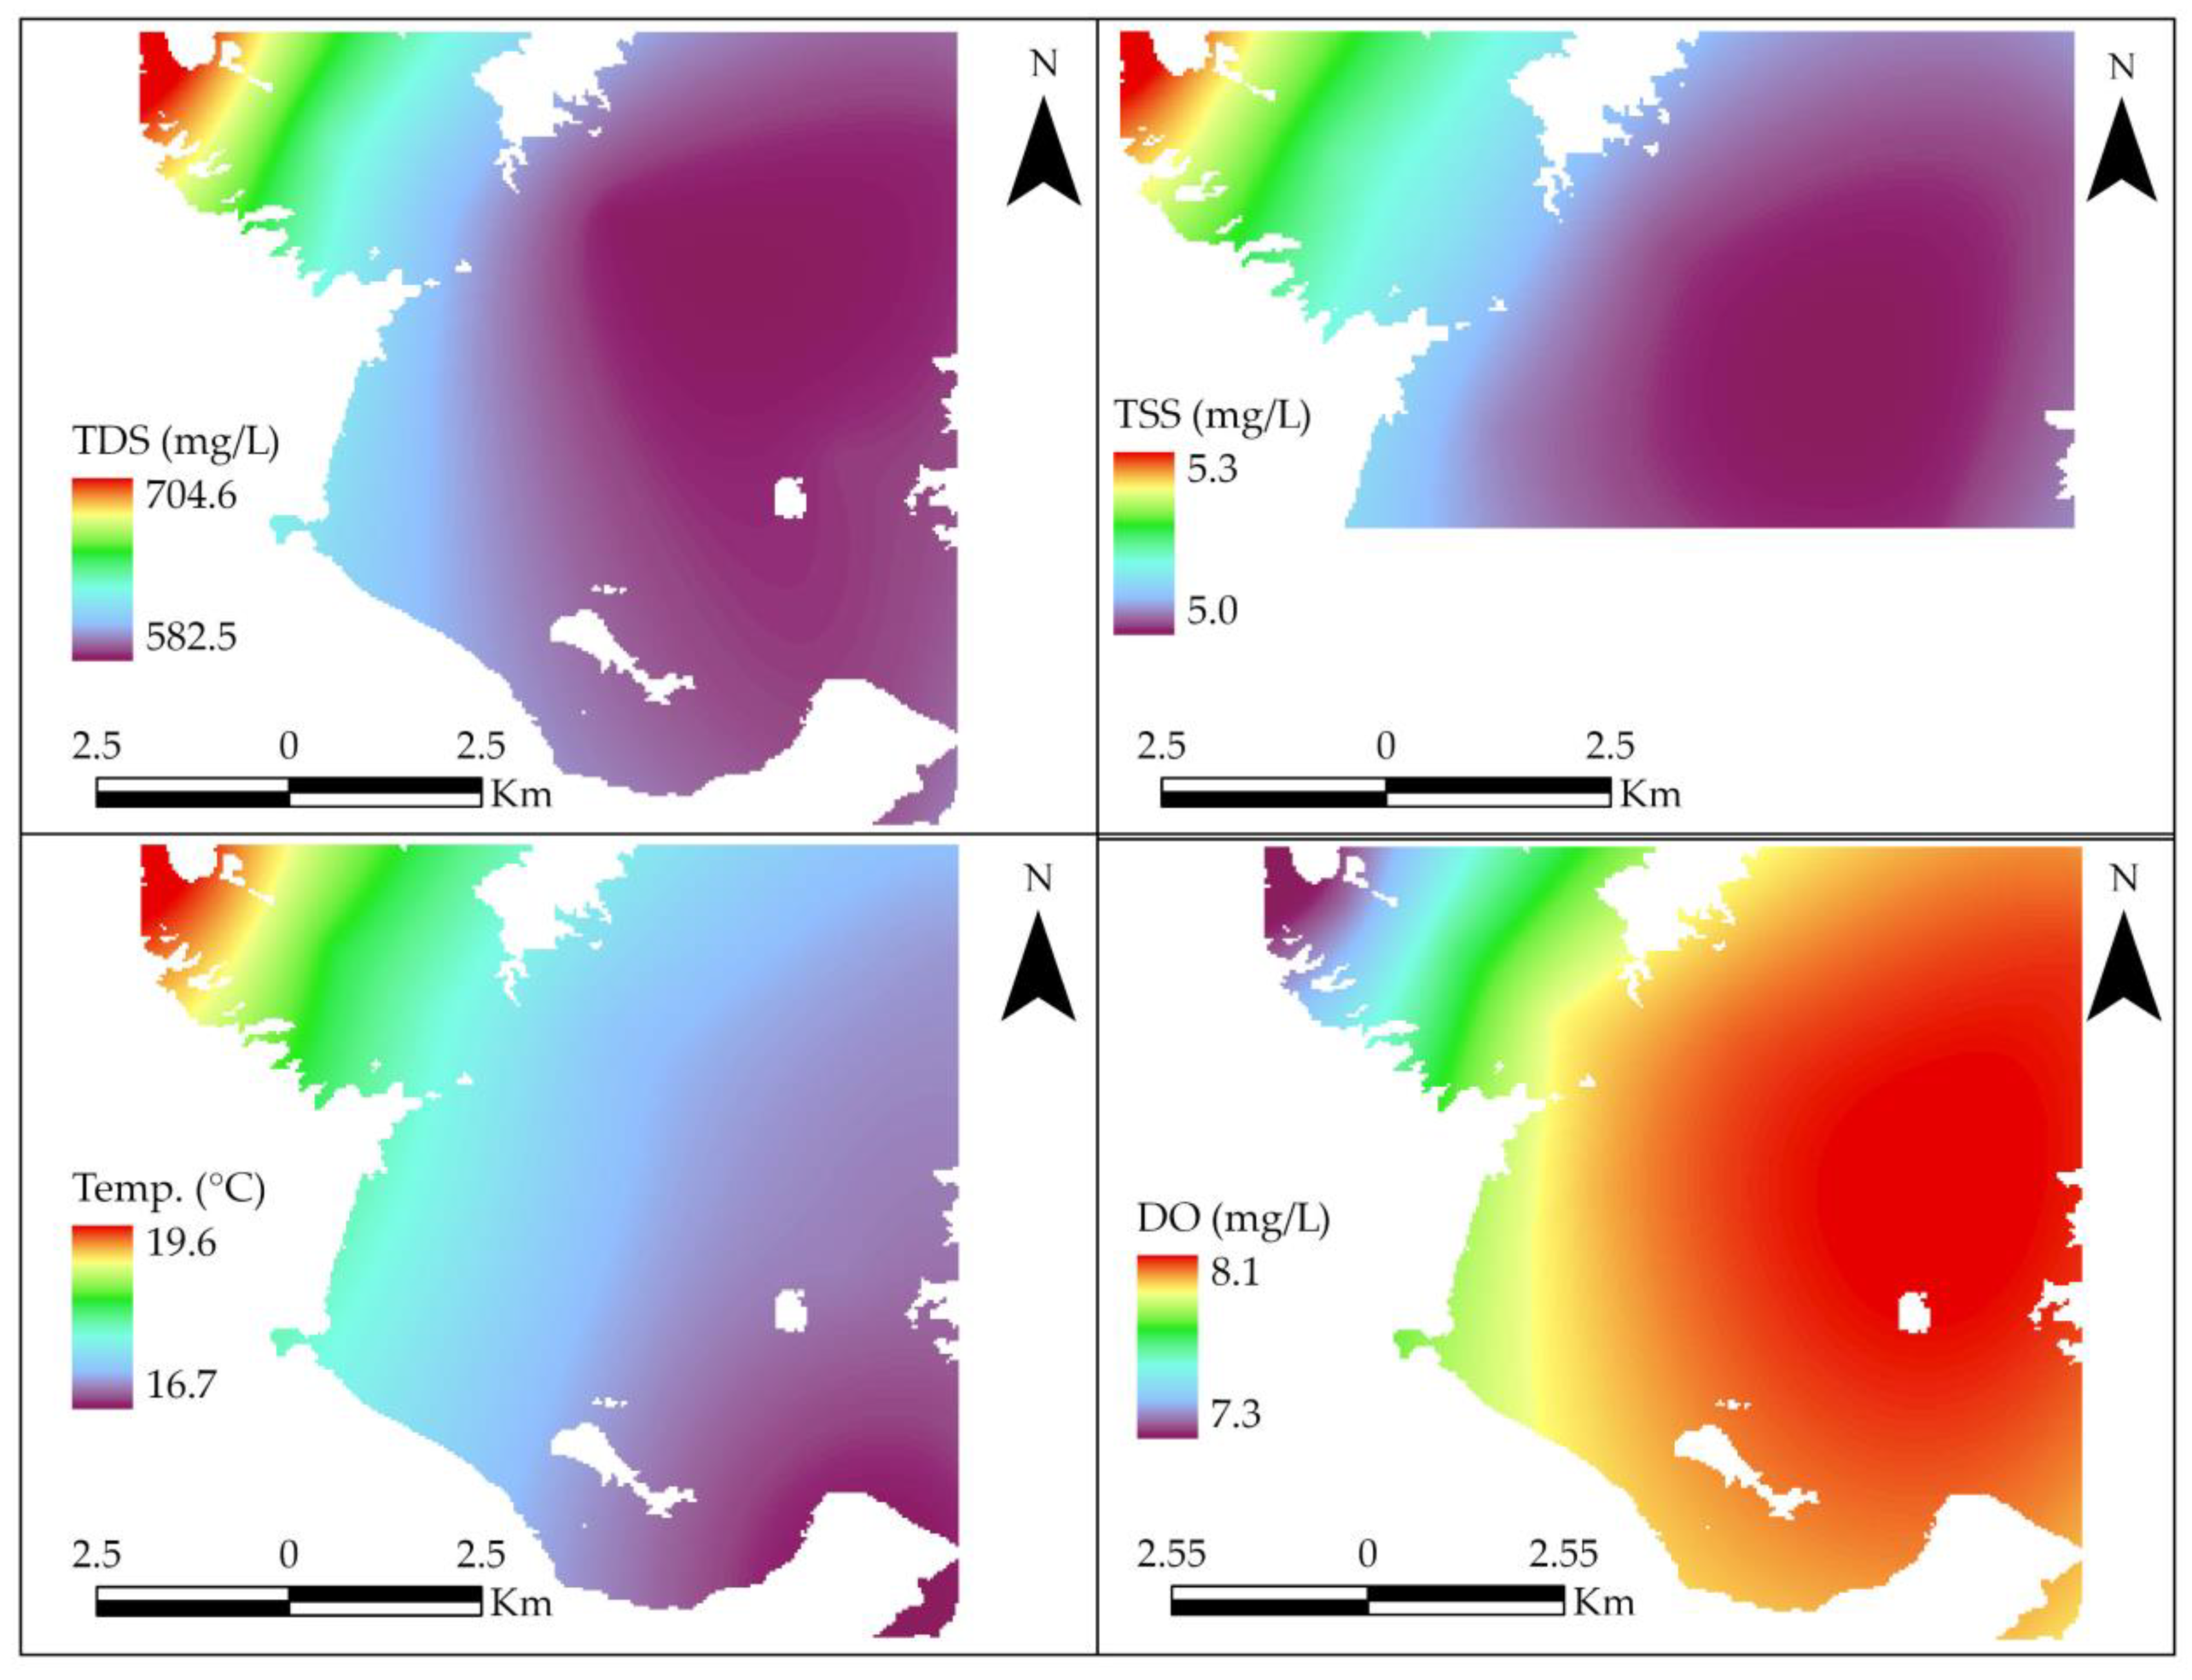
Figure 6.
Monthly variations of key WQPs in Lake Mead from 2016–2021.
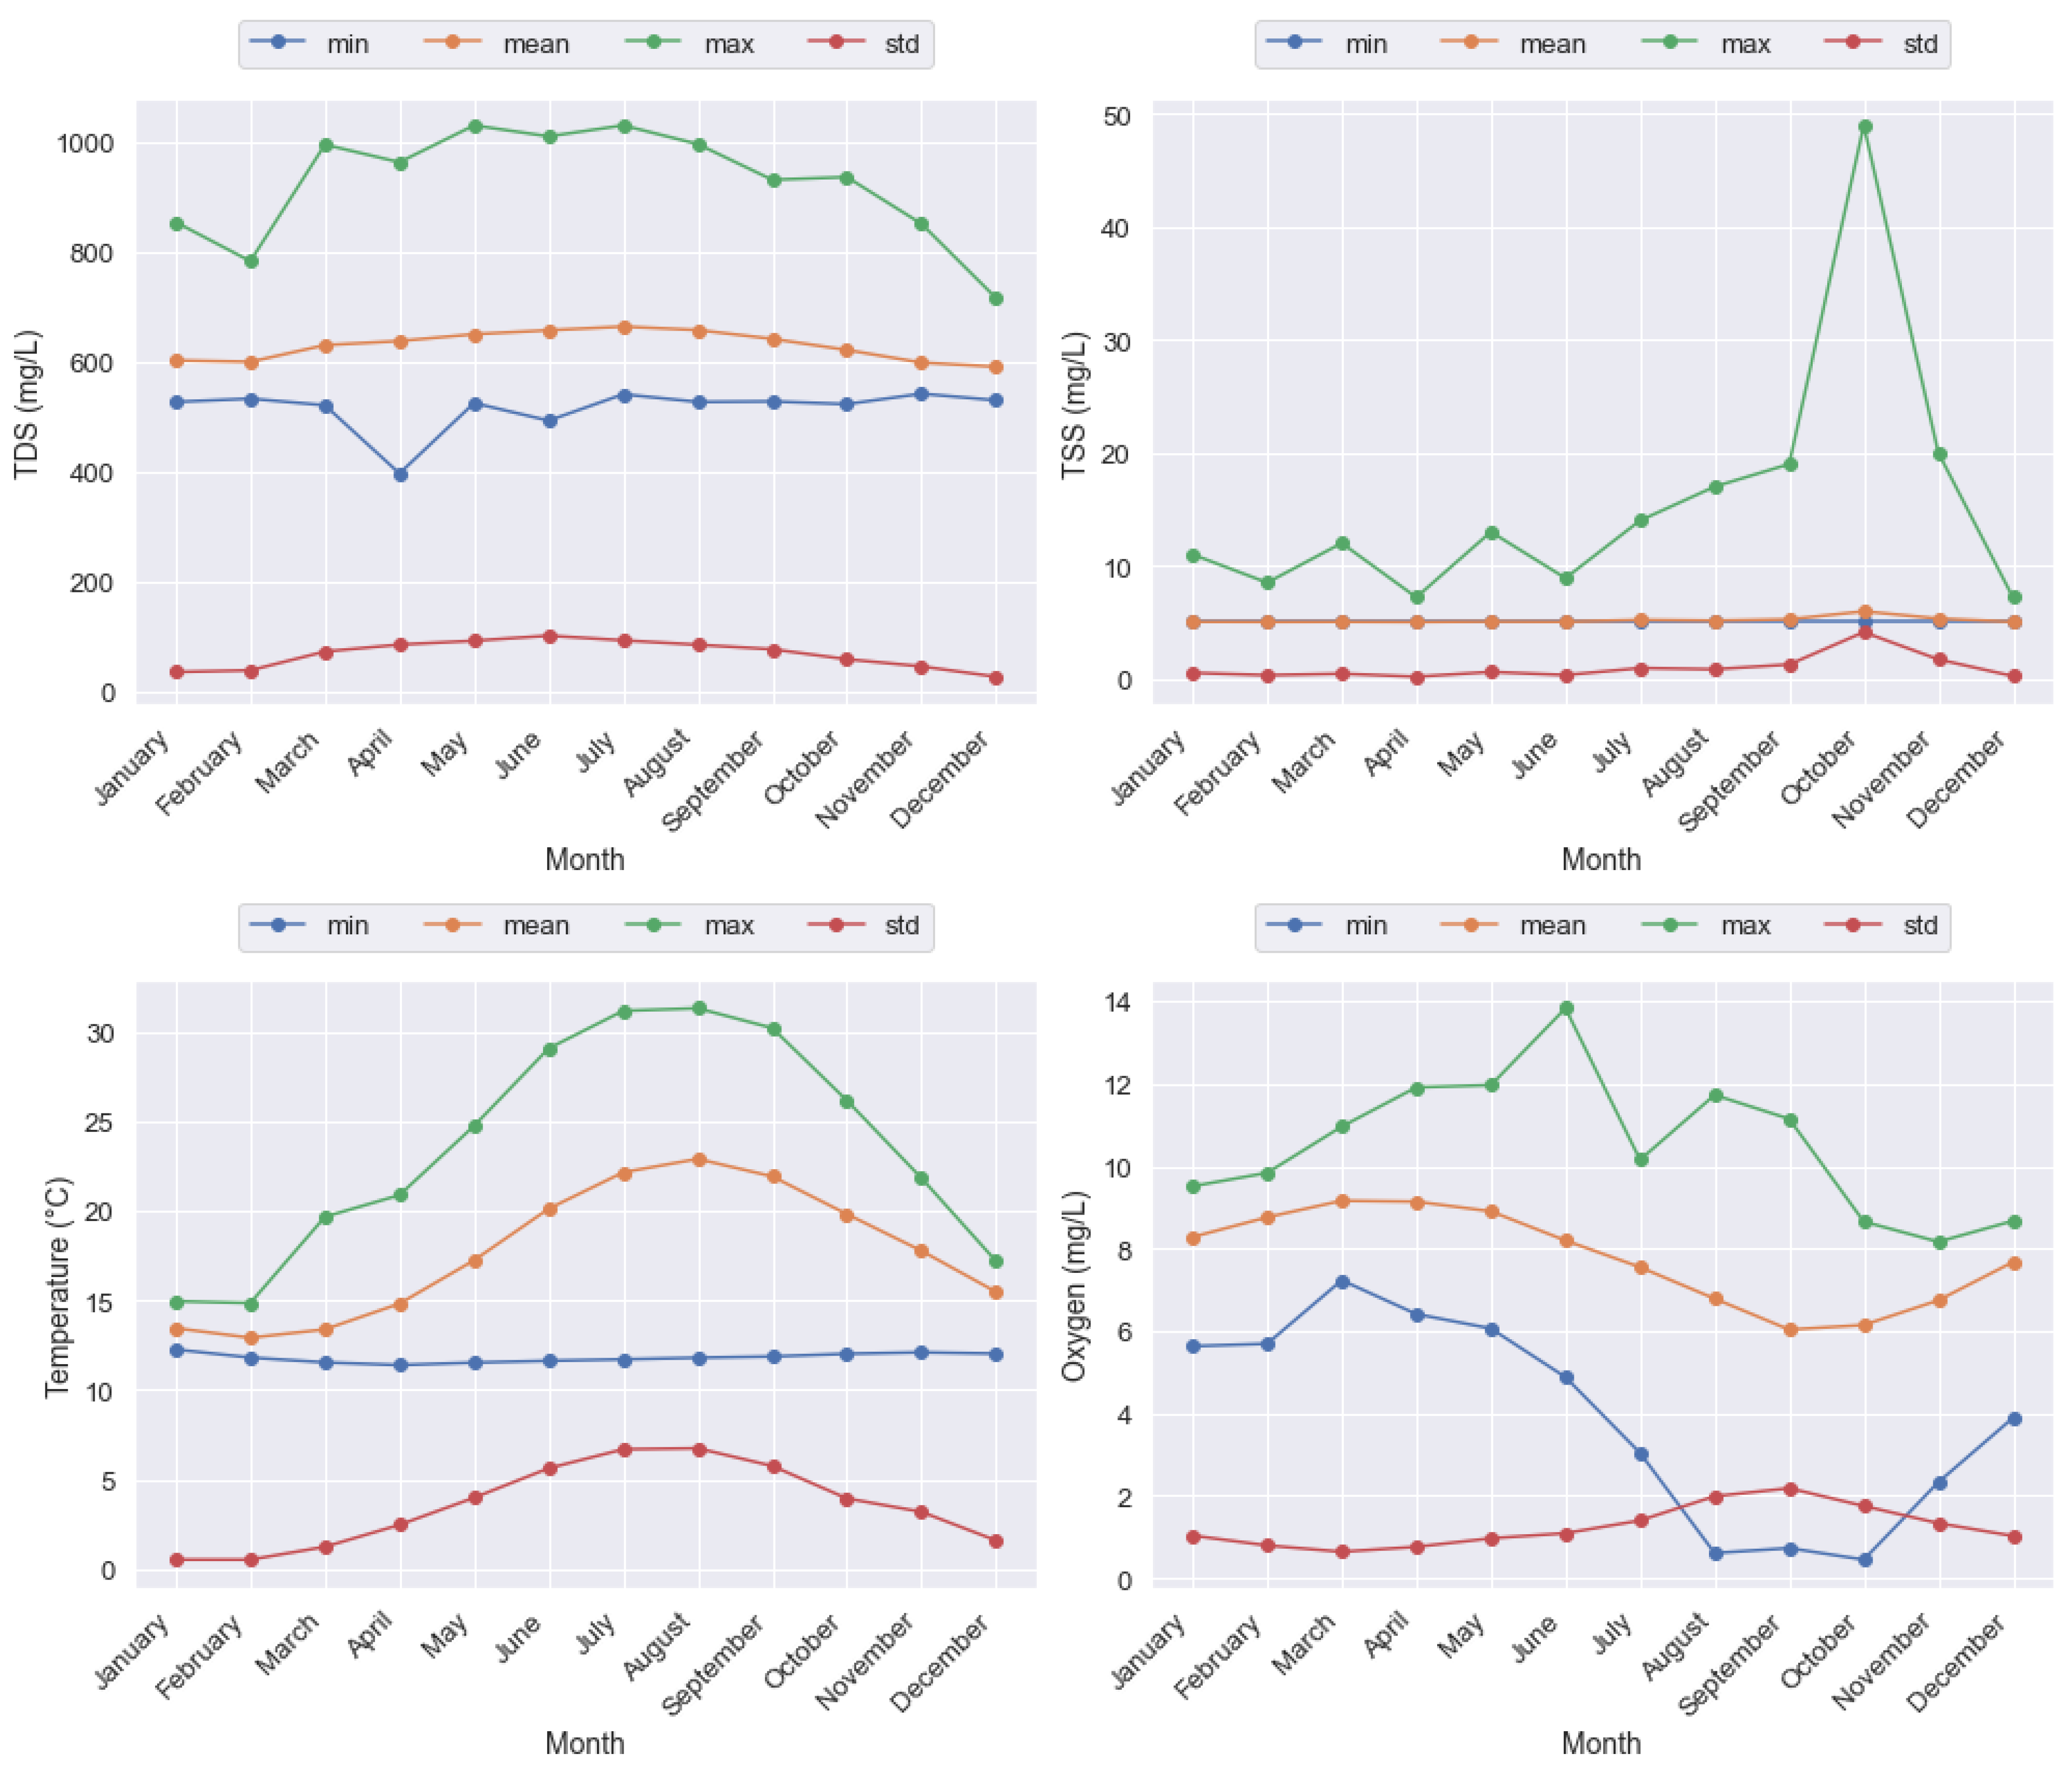
Figure 7.
Seasonal spatial distribution of key WQPs in Lake Mead from 2016–2021.

Figure 8.
Seasonal variability of key WQPs in Lake Mead from 2016–2021.

Figure 9.
Yearly variability of key WQPs in Lake Mead from 2016–2021.

Figure 10.
Impact of the hydrological factors on TDS concentration in Lake Mead from 2016–2021.
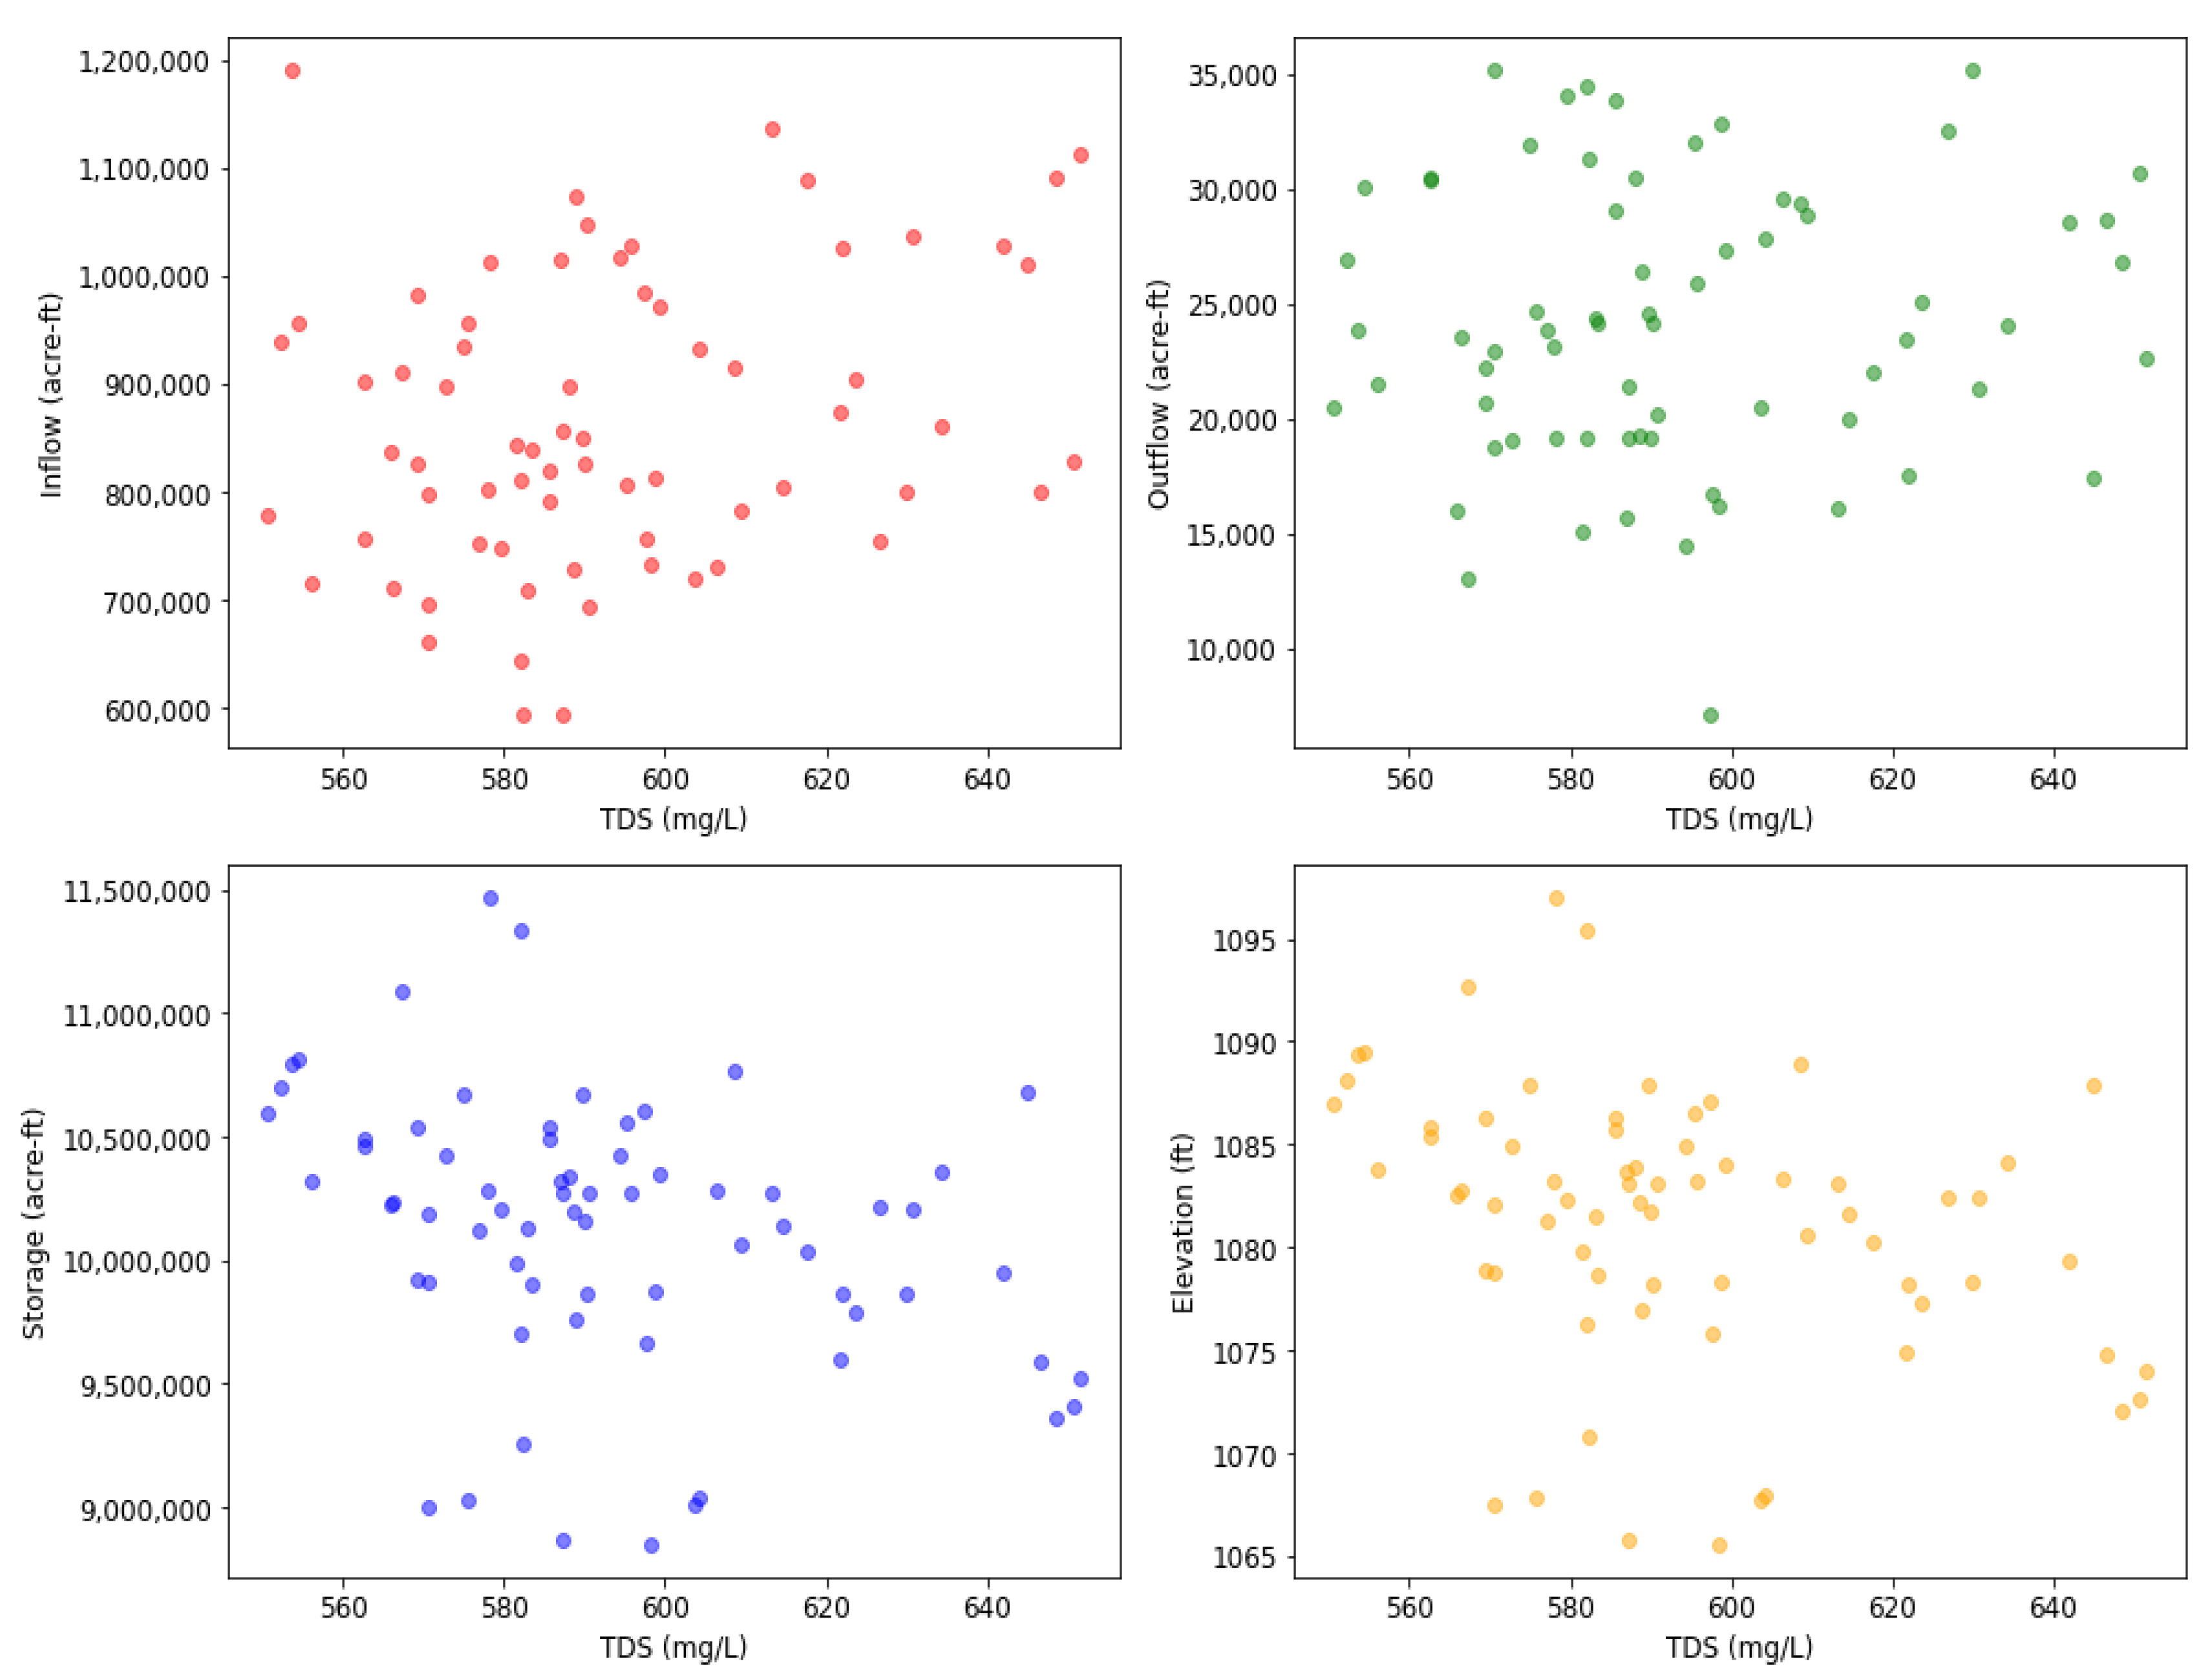
Figure 11.
Impact of the hydrological factors on temperature in Lake Mead from 2016–2021.

Figure 12.
Impact of the hydrological factors on DO concentration in Lake Mead from 2016–2021.
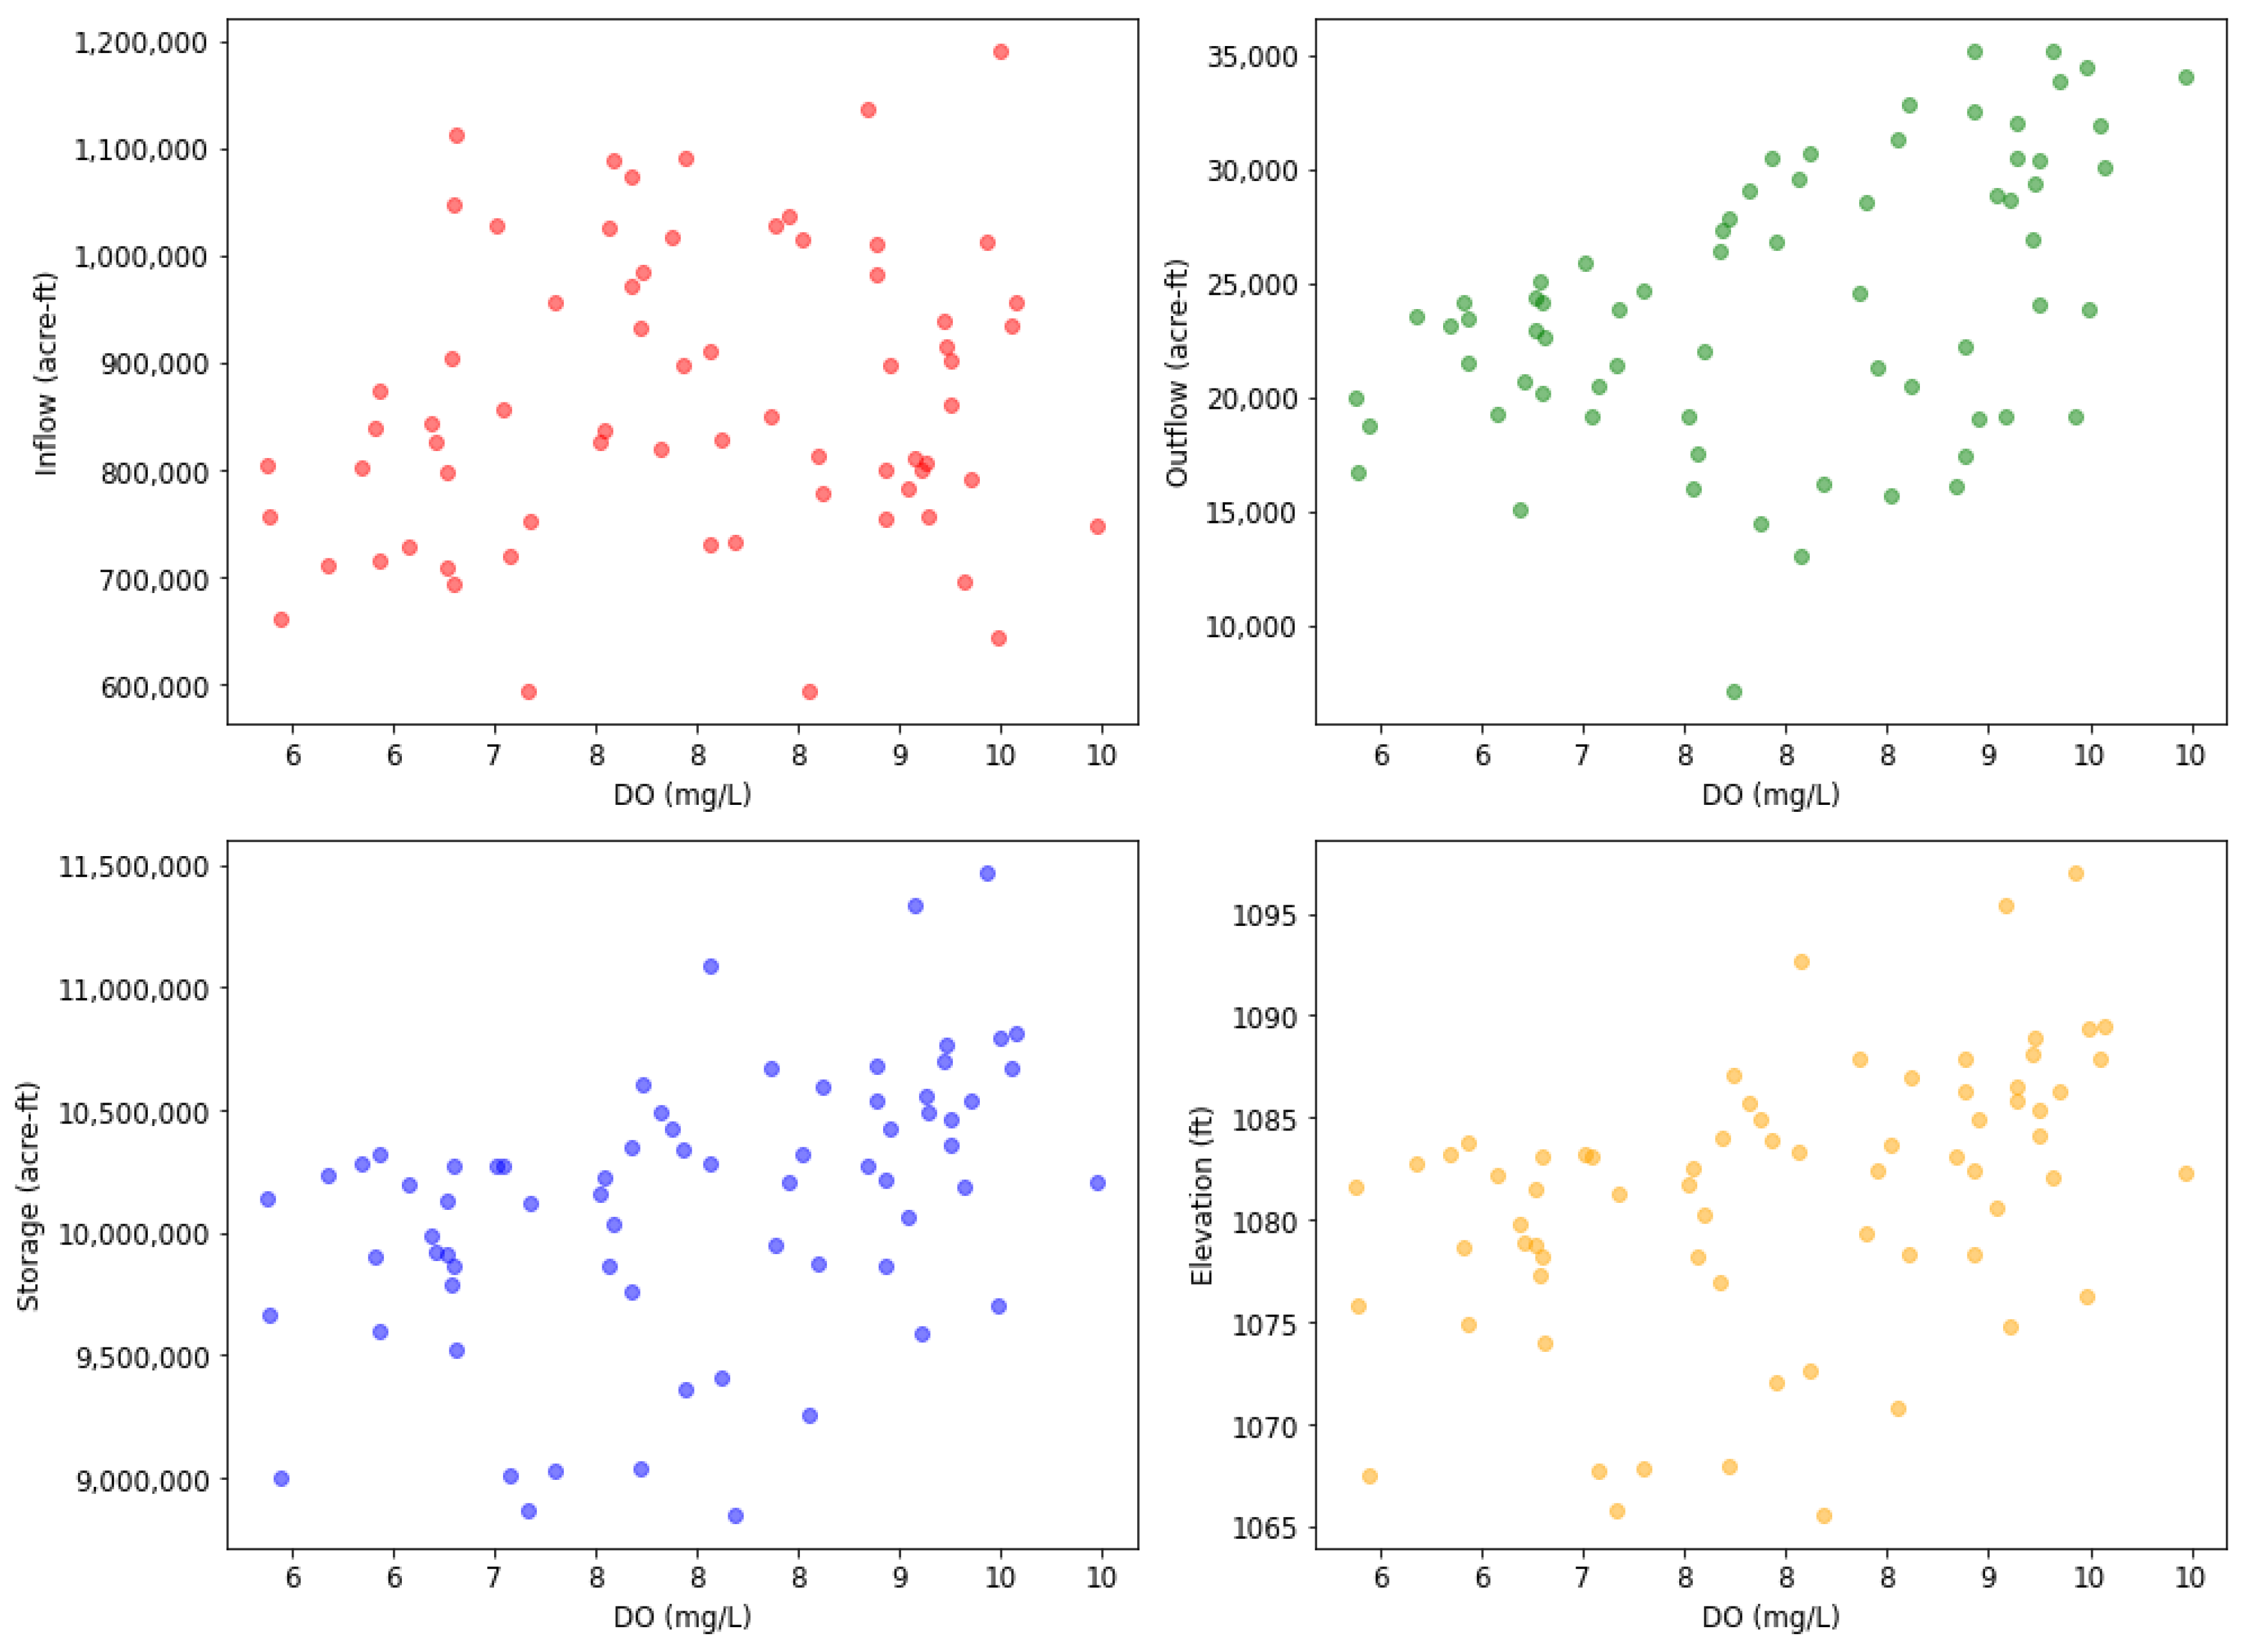
Figure 13.
Time series variations of the WQPs at the three depth zones of the Lake Mead from 2016–2021.
Figure 13.
Time series variations of the WQPs at the three depth zones of the Lake Mead from 2016–2021.
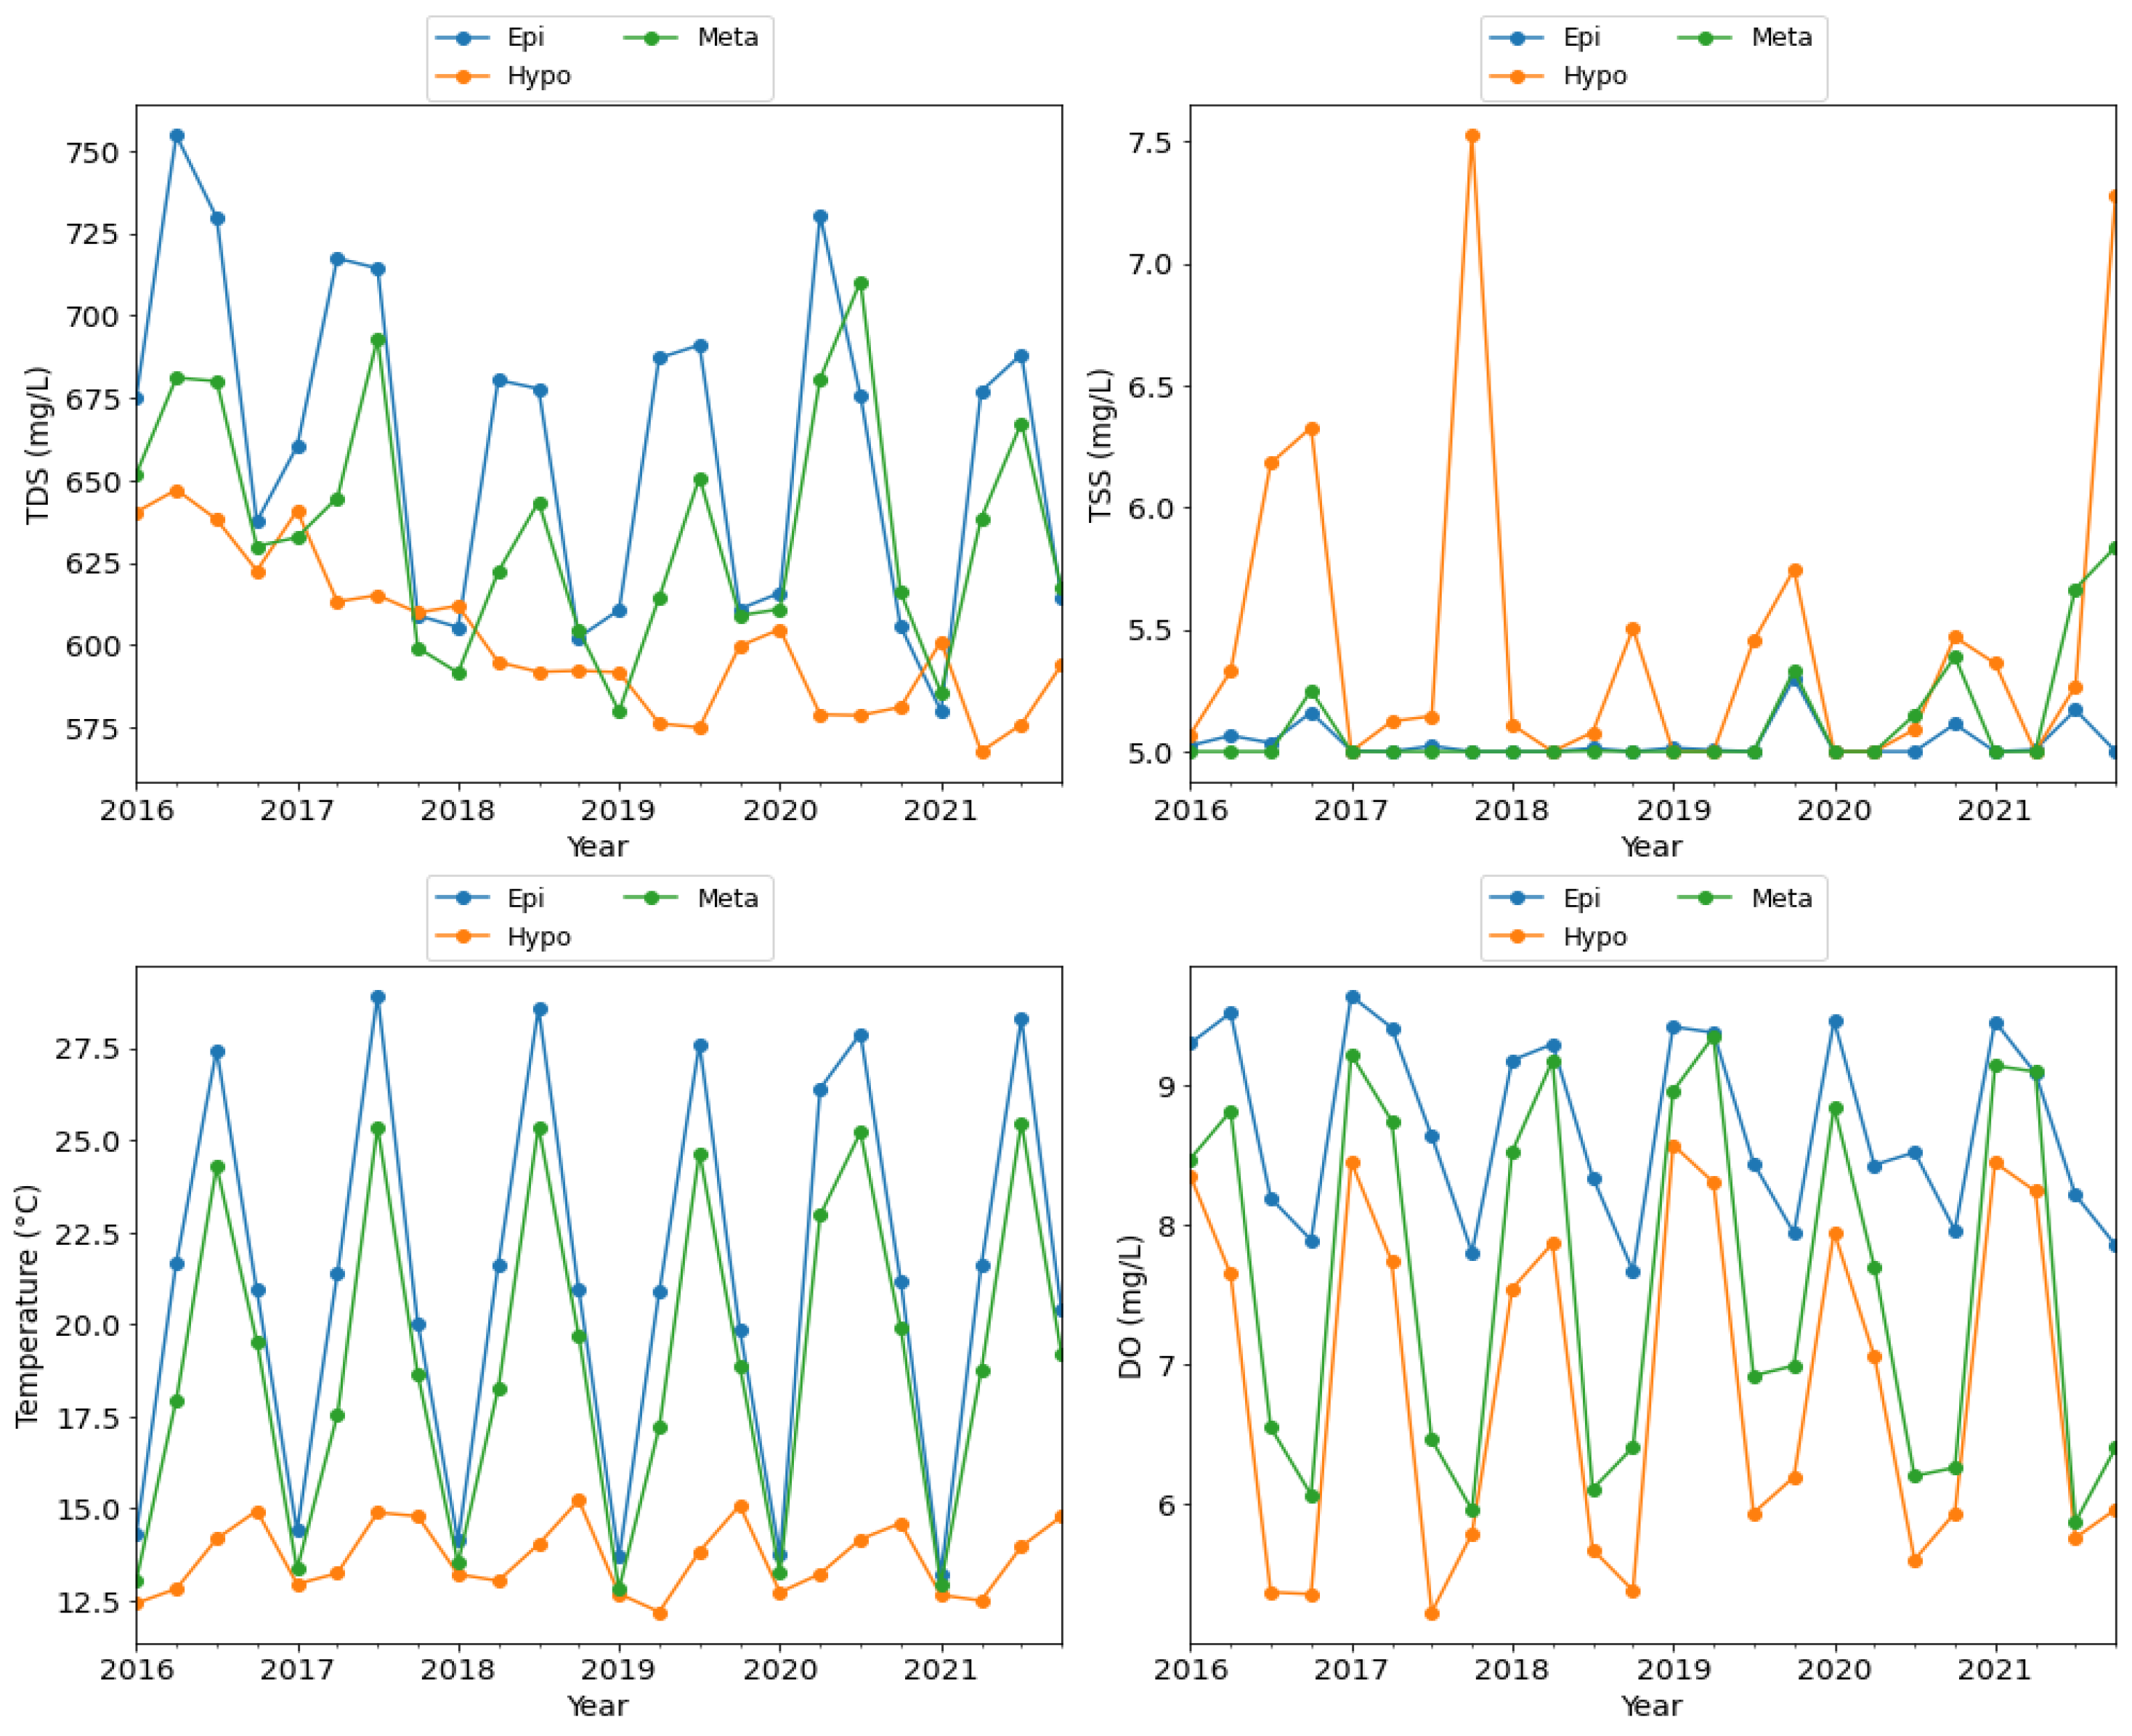
Table 1.
Lake Mead sampling station [82].
Table 1.
Lake Mead sampling station [82].
| No. | Station | Location and Zones | Purpose | Lat./Long. | Frequency and Dates |
|---|---|---|---|---|---|
| 1 | LWLVB1.2 | In channel 1.2 mi from the confluence of LWLVB. Sampling collected at the epilimnion and hypolimnion | In compliance with requirements for maintaining existing higher quality and beneficial use set by NAC 445A.197 | Movable | Weekly (March-October) Monthly (November–February) 2016–2021 |
| 2 | LWLVB1.85 | In channel 1.85 mi from the confluence of LWLVB. Sampling collected at the epilimnion, metalimnion, and hypolimnion | In compliance with requirements for maintaining existing higher quality and beneficial use set by NAC 445A.195 | Movable | Weekly (March-October) Monthly (November–February) 2016–2021 |
| 3 | LWLVB2.7 | In channel 2.7 mi from the confluence of the LWLVB. Sampling collected at the epilimnion, metalimnion, and hypolimnion | In compliance with requirements for maintaining existing higher quality and beneficial use set by NAC 445A.195 | Movable | Biweekly (March–October) Monthly (November–February) 2016–2021 |
| 4 | LWLVB3.5 | In channel 3.5 mi from the confluence of the LWLVB. Sampling collected at the epilimnion, metalimnion, and hypolimnion | In compliance with requirements for maintaining existing higher quality and beneficial use set by NAC 445A.195 | Movable | Biweekly (March–October) Monthly (November–February) 2016–2021 |
| 5 | IPS3 | In Boulder Basin on the northeast side of the mouth of Las Vegas Bay. Sampling collected at the epilimnion, metalimnion, and hypolimnion | To assess the impacts of LVW on the Boulder Basin and the Southern Nevada Water Authority (SNWA) drinking water intake | 36.0896° N 114.7662° W | Monthly year-round 2017–2021 |
| 6 | BB3 | In Boulder Basin on the northeast side of Saddle Island. Sampling collected at the epilimnion, metalimnion, and hypolimnion | To assess the impacts of LVW on the Boulder Basin and the SNWA drinking water intake | 36.0715° N 114.7832° W | Monthly year-round 2016–2021 |
| 7 | CR350.0SE0.55 | Between Battleship Rock and Burro Point. Sampling collected at the epilimnion, metalimnion, and hypolimnion | To assess the baseline concentrations in the lake upstream of the Las Vegas Bay | 36.0985° N 114.7257° W | Monthly year-round 2016–2021 |
| 8 | CR346.4 | In Boulder Basin between Sentinel Island and the shoreline of Castle Cove. Sampling collected at the epilimnion, metalimnion, and hypolimnion | To assess the impacts of LVW on the Boulder Basin | 36.0617° N 114.7392° W | Monthly year-round 2016–2021 |
| 9 | CR342.5 | In Boulder Basin in the middle of Black Canyon, near the Hoover Dam. Sampling collected at the epilimnion, metalimnion, and hypolimnion | Temporary station co-operated by LVVD and SNWA to assess the plausible effects on the downstream | 36.01910° N 114.7333° W | Monthly year-round 2016–2021 |
Table 2.
Summary descriptive statistics of the sampled WQPs from 2016–2021.
| Statistics | TDS (mg/L) | TSS (mg/L) | Temperature (°C) | DO (mg/L) |
|---|---|---|---|---|
| Count | 2964 | 2757 | 2964 | 2964 |
| Min | 397.0 | 5.0 | 11.4 | 0.5 |
| Mean | 635.3 | 5.2 | 18.3 | 7.7 |
| Max | 1030.0 | 49.0 | 31.3 | 13.8 |
| Std. | 79.9 | 1.6 | 5.7 | 1.8 |
Table 3.
Summary statistics of the monthly variability in WQPs from 2016–2021.
| TDS (mg/L) | TSS (mg/L) | Temperature (°C) | DO (mg/L) | |||||||||||||
|---|---|---|---|---|---|---|---|---|---|---|---|---|---|---|---|---|
| Month | Min | Mean | Max | Std | Min | Mean | Max | Std | Min | Mean | Max | Std | Min | Mean | Max | Std |
| 1 | 527.0 | 602.6 | 854.0 | 35.9 | 5.0 | 5.0 | 11.0 | 0.5 | 12.3 | 13.5 | 15.0 | 0.5 | 5.6 | 8.3 | 9.5 | 1.0 |
| 2 | 533.0 | 599.9 | 783.0 | 38.8 | 5.0 | 5.0 | 8.5 | 0.3 | 11.8 | 12.9 | 14.9 | 0.5 | 5.7 | 8.8 | 9.8 | 0.8 |
| 3 | 521.0 | 630.3 | 995.0 | 73.0 | 5.0 | 5.0 | 12.0 | 0.4 | 11.5 | 13.4 | 19.7 | 1.3 | 7.2 | 9.2 | 11.0 | 0.6 |
| 4 | 397.0 | 637.8 | 963.0 | 85.6 | 5.0 | 5.0 | 7.2 | 0.2 | 11.4 | 14.8 | 20.9 | 2.5 | 6.4 | 9.1 | 11.9 | 0.8 |
| 5 | 525.0 | 650.2 | 1030.0 | 92.6 | 5.0 | 5.1 | 13.0 | 0.6 | 11.5 | 17.2 | 24.7 | 4.0 | 6.1 | 8.9 | 12.0 | 1.0 |
| 6 | 493.0 | 657.4 | 1010.0 | 101.9 | 5.0 | 5.0 | 8.9 | 0.3 | 11.6 | 20.1 | 29.1 | 5.6 | 4.9 | 8.2 | 13.8 | 1.1 |
| 7 | 541.0 | 664.1 | 1030.0 | 93.4 | 5.0 | 5.2 | 14.0 | 0.9 | 11.7 | 22.1 | 31.2 | 6.7 | 3.0 | 7.5 | 10.2 | 1.4 |
| 8 | 527.0 | 657.8 | 996.0 | 85.4 | 5.0 | 5.1 | 17.0 | 0.8 | 11.8 | 22.9 | 31.3 | 6.7 | 0.6 | 6.8 | 11.7 | 2.0 |
| 9 | 528.0 | 641.7 | 931.0 | 77.2 | 5.0 | 5.3 | 19.0 | 1.2 | 11.9 | 21.9 | 30.2 | 5.8 | 0.7 | 6.0 | 11.1 | 2.2 |
| 10 | 523.0 | 621.5 | 936.0 | 59.0 | 5.0 | 6.0 | 49.0 | 4.1 | 12.0 | 19.8 | 26.2 | 4.0 | 0.5 | 6.1 | 8.7 | 1.8 |
| 11 | 542.0 | 598.6 | 851.0 | 46.1 | 5.0 | 5.3 | 20.0 | 1.7 | 12.1 | 17.8 | 21.8 | 3.2 | 2.3 | 6.7 | 8.2 | 1.3 |
| 12 | 530.0 | 591.0 | 716.0 | 27.2 | 5.0 | 5.0 | 7.2 | 0.2 | 12.0 | 15.5 | 17.2 | 1.6 | 3.9 | 7.7 | 8.7 | 1.0 |
Table 4.
Summary statistics of the seasonal variability in WQPs from 2016–2021.
| TDS (mg/L) | TSS (mg/L) | Temperature (°C) | DO (mg/L) | |||||||||||||
|---|---|---|---|---|---|---|---|---|---|---|---|---|---|---|---|---|
| Season | Min | Mean | Max | Std | Min | Mean | Max | Std | Min | Mean | Max | Std | Min | Mean | Max | Std |
| Winter | 527.0 | 597.9 | 854.0 | 34.6 | 5.0 | 5.0 | 11.0 | 0.4 | 11.8 | 13.9 | 17.2 | 1.5 | 3.9 | 8.2 | 9.8 | 1.1 |
| Spring | 397.0 | 639.1 | 1030.0 | 83.9 | 5.0 | 5.0 | 13.0 | 0.4 | 11.4 | 15.1 | 24.7 | 3.2 | 6.1 | 9.1 | 12.0 | 0.8 |
| Summer | 493.0 | 659.8 | 1030.0 | 93.3 | 5.0 | 5.1 | 17.0 | 0.8 | 11.6 | 21.8 | 31.3 | 6.5 | 0.6 | 7.5 | 13.8 | 1.7 |
| Fall | 523.0 | 624.8 | 936.0 | 66.5 | 5.0 | 5.6 | 49.0 | 2.9 | 11.9 | 20.2 | 30.2 | 4.9 | 3.9 | 8.2 | 9.8 | 1.1 |
Table 5.
Summary statistics of the yearly variability in WQPs.
| TDS (mg/L) | TSS (mg/L) | Temperature (°C) | DO (mg/L) | |||||||||||||
|---|---|---|---|---|---|---|---|---|---|---|---|---|---|---|---|---|
| Year | Min | Mean | Max | Std | Min | Mean | Max | Std | Min | Mean | Max | Std | Min | Mean | Max | Std |
| 2016 | 560.0 | 671.2 | 1030.0 | 80.1 | 5.0 | 5.3 | 20.0 | 1.3 | 11.6 | 18.1 | 30.0 | 5.5 | 1.4 | 7.7 | 13.8 | 1.8 |
| 2017 | 530.0 | 650.5 | 980.0 | 77.1 | 5.0 | 5.2 | 45.0 | 2.1 | 12.2 | 18.4 | 31.2 | 5.7 | 0.6 | 7.8 | 12.0 | 1.9 |
| 2018 | 397.0 | 621.4 | 896.0 | 69.6 | 5.0 | 5.1 | 16.0 | 0.6 | 12.4 | 18.4 | 31.2 | 5.7 | 0.9 | 7.6 | 11.4 | 1.8 |
| 2019 | 401.0 | 619.5 | 963.0 | 76.1 | 5.0 | 5.2 | 16.0 | 1.1 | 11.4 | 17.8 | 30.4 | 5.5 | 1.9 | 8.0 | 11.1 | 1.6 |
| 2020 | 493.0 | 629.3 | 996.0 | 84.3 | 5.0 | 5.1 | 10.0 | 0.6 | 12.0 | 18.9 | 30.5 | 6.1 | 1.5 | 7.3 | 10.9 | 1.9 |
| 2021 | 521.0 | 620.8 | 972.0 | 79.2 | 5.0 | 5.3 | 49.0 | 2.4 | 11.6 | 18.2 | 31.3 | 5.9 | 0.5 | 7.8 | 10.5 | 1.8 |
Table 6.
Test of normality for the WQPs from 2016–2021.
| Shapiro–Wilk Normality Test | ||
|---|---|---|
| WQPs | Test Statistic | p-Value |
| TDS | 0.849 | 0.000 |
| TSS | 0.105 | 0.000 |
| Temperature | 0.884 | 0.000 |
| DO | 0.912 | 0.000 |
Table 7.
Test of homogeneity of variance among the WQPs from 2016–2021.
| Levene Homogeneity of Variance Test | |
|---|---|
| Test Statistic | p-Value |
| 2023.222 | 0.000 |
Table 8.
Kruskal–Wallis test for the monthly WQPs significance test from 2016–2021.
| TDS | TSS | Temperature | DO | |||||
|---|---|---|---|---|---|---|---|---|
| Month | Test Statistic | p-Value | Test Statistic | p-Value | Test Statistic | p-Value | Test Statistic | p-Value |
| 1 | 0.980 | 0.322 | 0.000 | 0.996 | 71.683 | 0.000 | 26.605 | 0.000 |
| 2 | 18.410 | 0.000 | 0.636 | 0.425 | 10.869 | 0.001 | 23.812 | 0.000 |
| 3 | 0.788 | 0.375 | 0.723 | 0.395 | 30.706 | 0.000 | 0.401 | 0.527 |
| 4 | 1.308 | 0.253 | 3.110 | 0.078 | 46.999 | 0.000 | 6.941 | 0.008 |
| 5 | 0.258 | 0.612 | 0.253 | 0.615 | 47.716 | 0.000 | 56.721 | 0.000 |
| 6 | 2.177 | 0.140 | 10.506 | 0.001 | 30.853 | 0.000 | 34.702 | 0.000 |
| 7 | 0.172 | 0.678 | 1.895 | 0.169 | 4.142 | 0.042 | 33.752 | 0.000 |
| 8 | 6.011 | 0.014 | 1.515 | 0.218 | 16.167 | 0.000 | 17.040 | 0.000 |
| 9 | 8.000 | 0.005 | 2.945 | 0.086 | 55.215 | 0.000 | 0.093 | 0.760 |
| 10 | 21.944 | 0.000 | 2.847 | 0.092 | 57.042 | 0.000 | 14.008 | 0.000 |
| 11 | 0.056 | 0.812 | 5.473 | 0.019 | 56.576 | 0.000 | 81.126 | 0.000 |
| 12 | 8.476 | 0.004 | 0.333 | 0.564 | 84.014 | 0.000 | 79.285 | 0.000 |
Table 9.
Kruskal–Wallis test for the seasonal WQPs significance test from 2016–2021.
| TDS | TSS | Temperature | DO | |||||
|---|---|---|---|---|---|---|---|---|
| Test Statistic | p-Value | Test Statistic | p-Value | Test Statistic | p-Value | Test Statistic | p-Value | |
| Winter | 463.000 | 0.491 | 409.000 | 0.491 | 832.000 | 0.491 | 463.000 | 0.491 |
| Spring | 832.000 | 0.493 | 784.000 | 0.493 | 832.000 | 0.493 | 832.000 | 0.493 |
| Summer | 901.000 | 0.494 | 850.000 | 0.494 | 901.000 | 0.494 | 901.000 | 0.494 |
| Fall | 764.000 | 0.493 | 710.000 | 0.493 | 764.000 | 0.493 | 764.000 | 0.493 |
Table 10.
Kruskal–Wallis test for the yearly WQPs significance test from 2016–2021.
| TDS | TSS | Temperature | DO | |||||
|---|---|---|---|---|---|---|---|---|
| Year | Test Statistic | p-Value | Test Statistics | p-Value | Test Statistic | p-Value | Test Statistic | p-Value |
| 2016 | 497.000 | 0.492 | 461.000 | 0.491 | 497.000 | 0.492 | 497.000 | 0.492 |
| 2017 | 496.000 | 0.492 | 460.000 | 0.491 | 496.000 | 0.492 | 496.000 | 0.492 |
| 2018 | 510.000 | 0.492 | 474.000 | 0.491 | 510.000 | 0.492 | 510.000 | 0.492 |
| 2019 | 508.000 | 0.492 | 472.000 | 0.491 | 508.000 | 0.492 | 508.000 | 0.492 |
| 2020 | 395.000 | 0.491 | 368.000 | 0.490 | 395.000 | 0.491 | 395.000 | 0.491 |
| 2021 | 552.000 | 0.492 | 516.000 | 0.492 | 552.000 | 0.492 | 552.000 | 0.492 |
Table 11.
Kruskal–Wallis test WQPs significance test across periods from 2016–2021.
| TDS | TSS | Temperature | DO | |||||
|---|---|---|---|---|---|---|---|---|
| Period | Statistics | p-Value | Statistics | p-Value | Statistics | p-Value | Statistics | p-Value |
| Month | 225.097 | 0.000 | 88.083 | 0.000 | 868.249 | 0.000 | 1374.629 | 0.000 |
| Season | 181.729 | 0.000 | 67.034 | 0.000 | 749.990 | 0.000 | 1326.126 | 0.000 |
| Year | 322.744 | 0.000 | 32.076 | 0.000 | 16.287 | 0.006 | 42.181 | 0.000 |
Table 12.
Variations of WQPs at various zones of the lake from 2016–2021.
| TDS (mg/L) | TSS (mg/L) | Temperature (°C) | DO (mg/L) | |||||||||||||||||
|---|---|---|---|---|---|---|---|---|---|---|---|---|---|---|---|---|---|---|---|---|
| Zone | Count | Min | Mean | Max | Std | Count | Min | Mean | Max | Std | Count | Min | Mean | Max | Std | Count | Min | Mean | Max | Std |
| Epilimnion | 1042 | 397 | 666.0 | 1030 | 94.1 | 973 | 5 | 5.0 | 16 | 0.4 | 1042 | 12 | 21.8 | 31 | 5.7 | 1042 | 5 | 8.7 | 14 | 0.9 |
| Metalimnion | 884 | 401 | 638.7 | 996 | 74.0 | 815 | 5 | 5.1 | 19 | 1.0 | 884 | 12 | 19.5 | 29 | 5.0 | 884 | 2 | 7.6 | 11 | 1.8 |
| Hypolimnion | 1038 | 459 | 601.4 | 939 | 51.0 | 969 | 5 | 5.4 | 49 | 2.4 | 1038 | 11 | 13.7 | 23 | 2.3 | 1038 | 0 | 6.8 | 10 | 1.9 |
Disclaimer/Publisher’s Note: The statements, opinions and data contained in all publications are solely those of the individual author(s) and contributor(s) and not of MDPI and/or the editor(s). MDPI and/or the editor(s) disclaim responsibility for any injury to people or property resulting from any ideas, methods, instructions or products referred to in the content. |
© 2023 by the authors. Licensee MDPI, Basel, Switzerland. This article is an open access article distributed under the terms and conditions of the Creative Commons Attribution (CC BY) license (https://creativecommons.org/licenses/by/4.0/).
Share and Cite
MDPI and ACS Style
Adjovu, G.E.; Stephen, H.; Ahmad, S. Spatial and Temporal Dynamics of Key Water Quality Parameters in a Thermal Stratified Lake Ecosystem: The Case Study of Lake Mead. Earth 2023, 4, 461-502. https://doi.org/10.3390/earth4030025
AMA Style
Adjovu GE, Stephen H, Ahmad S. Spatial and Temporal Dynamics of Key Water Quality Parameters in a Thermal Stratified Lake Ecosystem: The Case Study of Lake Mead. Earth. 2023; 4(3):461-502. https://doi.org/10.3390/earth4030025
Chicago/Turabian StyleAdjovu, Godson Ebenezer, Haroon Stephen, and Sajjad Ahmad. 2023. "Spatial and Temporal Dynamics of Key Water Quality Parameters in a Thermal Stratified Lake Ecosystem: The Case Study of Lake Mead" Earth 4, no. 3: 461-502. https://doi.org/10.3390/earth4030025