Article

A Radiological Risk Assessment of 226Ra, 228Ra and 40K Isotopes in Tilapia Fish and its Granitic Environment in Singida Municipality, Tanzania

1
Directorate of Radiation Control, Tanzania Atomic Energy Commission (TAEC), Arusha P.O. Box 743, Tanzania
2
Department of Geography and Environmental Studies, Sokoine University of Agriculture, Morogoro P.O. Box 3038, Tanzania
*
Author to whom correspondence should be addressed.
Earth 2023, 4(3), 540-551; https://doi.org/10.3390/earth4030028
Submission received: 2 June 2023 / Revised: 30 June 2023 / Accepted: 11 July 2023 / Published: 26 July 2023

Abstract

:
Consumption of fish containing elevated levels of radionuclides can lead to undesirable health effects for consumers. People in the Singida Municipality harvest fish from lakes and ponds of granite rocks which are linked with hazardous radioisotopes that may be bio-concentrated by fishes they consume. Currently, no study has ascertained the levels of radioisotopes in fish from these environments. This study was carried out to analyse the radioactivity levels of 226Ra, 228Ra and 40K isotopes in order to assess the radiological risk associated with Tilapia fish consumption and its environment in Singida Municipality. Some 51 samples, which included water (20), sediment (20), Nile tilapia (8) and Manyara tilapia (3), were randomly sampled and composited; then, they were analysed using a high-purity germanium (HPGe) detector, between May and June 2022. The results revealed that (i) the activity levels of 228Ra were below the detection limit for fish and water samples, while in sediment, the combined activity of 228Ra was within the acceptable international levels; (ii) the mean activity concentrations of 226Ra and 40K in all other samples were within the recommended levels; (iii) the activities of radionuclides in the samples analysed were high in sediments, followed by fish, and lastly water; (iv) the bioaccumulation results show that only 40K was bio-accumulated (with 1.26 in Nile tilapia), while other radionuclides (226Ra, 228Ra) were not bio-accumulated; (vi) the radionuclide transfer from water to fish was higher compared to the radionuclide transfer from sediment to fish; (vii) the human effective doses due to consumption of Nile tilapia and Manyara tilapia were 0.00973 and 0.005 mSv/y, respectively, which is below the 1 mSv/y international limit. These findings therefore show that the current levels of radioactivity in fish in the study area do not pose a significant radiological risk to fish consumers. However, more studies on other types of fish are recommended.

1. Introduction

The living environment is continuously exposed to radionuclides such as 226Ra, 228Ra and 40K, which are widely distributed throughout rocks, soil, sediment, food, air and water, with different concentration levels. Their existence in the environment can be attributed to naturally occurring and artificially induced sources [1]. Natural radionuclides are mainly released from rocks, such as granite rock, as naturally occurring radioactive materials (NORMs), or as products of human activities such as mining operations; they are referred to as technically enhanced naturally occurring radioactive materials (TENORMs). Thus, radionuclides are transported to the aquatic environment and bio-concentrated by aquatic organisms including Tilapia fish [2]. The radionuclides found in igneous rocks including granite rocks may be concentrated by physical, biological, and chemical processes before entering the food chain [3].
Studies on NORMs, TENORMs and artificial radionuclides are usually carried out around the world to attain data about the radioactivity levels of ionizing radiation in the environment [4,5,6]. Similarly, many studies have been carried out in Tanzania on the distribution of natural radioactivity in sediments, soils, surface water, and foodstuffs [7,8,9]. However, information on the health risks associated with natural radionuclides in tilapia fish is still limited to the best of the authors’ knowledge, particularly in this study area. It is estimated that living organisms receive at least one eighth of the total effective dose resulting from radionuclides, through consumption of food materials including fish [6]. Thus, it is important to measure the radioactivity concentrations of fish species and their surrounding source of radionuclides; this will then help us to take appropriate precautions to reduce radionuclide intake.
The Singida municipality is known to be predominantly granitic, with higher levels of natural radioactive and various water bodies. Moreover, a number of anthropogenic activities such as agriculture and mining are taking place in the environs of Singida, and this may enhance levels of natural radioactivity in the surrounding environment. This area drew the attention of this research study, as its water bodies are most vulnerable to NORMs and TENORMs [10].
Therefore, this study was designed to assess the radiological risk of 226Ra, 228Ra, and 40K in Tilapia fish, which is a preferred protein food, in relation to its granitic environment. The information obtained may be used to estimate the annual effective dose due to consumption of fish. The results of this research will benefit the regulatory authorities on fish and environmental monitoring. Furthermore, upon publication, this study will increase societal knowledge of fish and their environment.

2. Materials and Methods
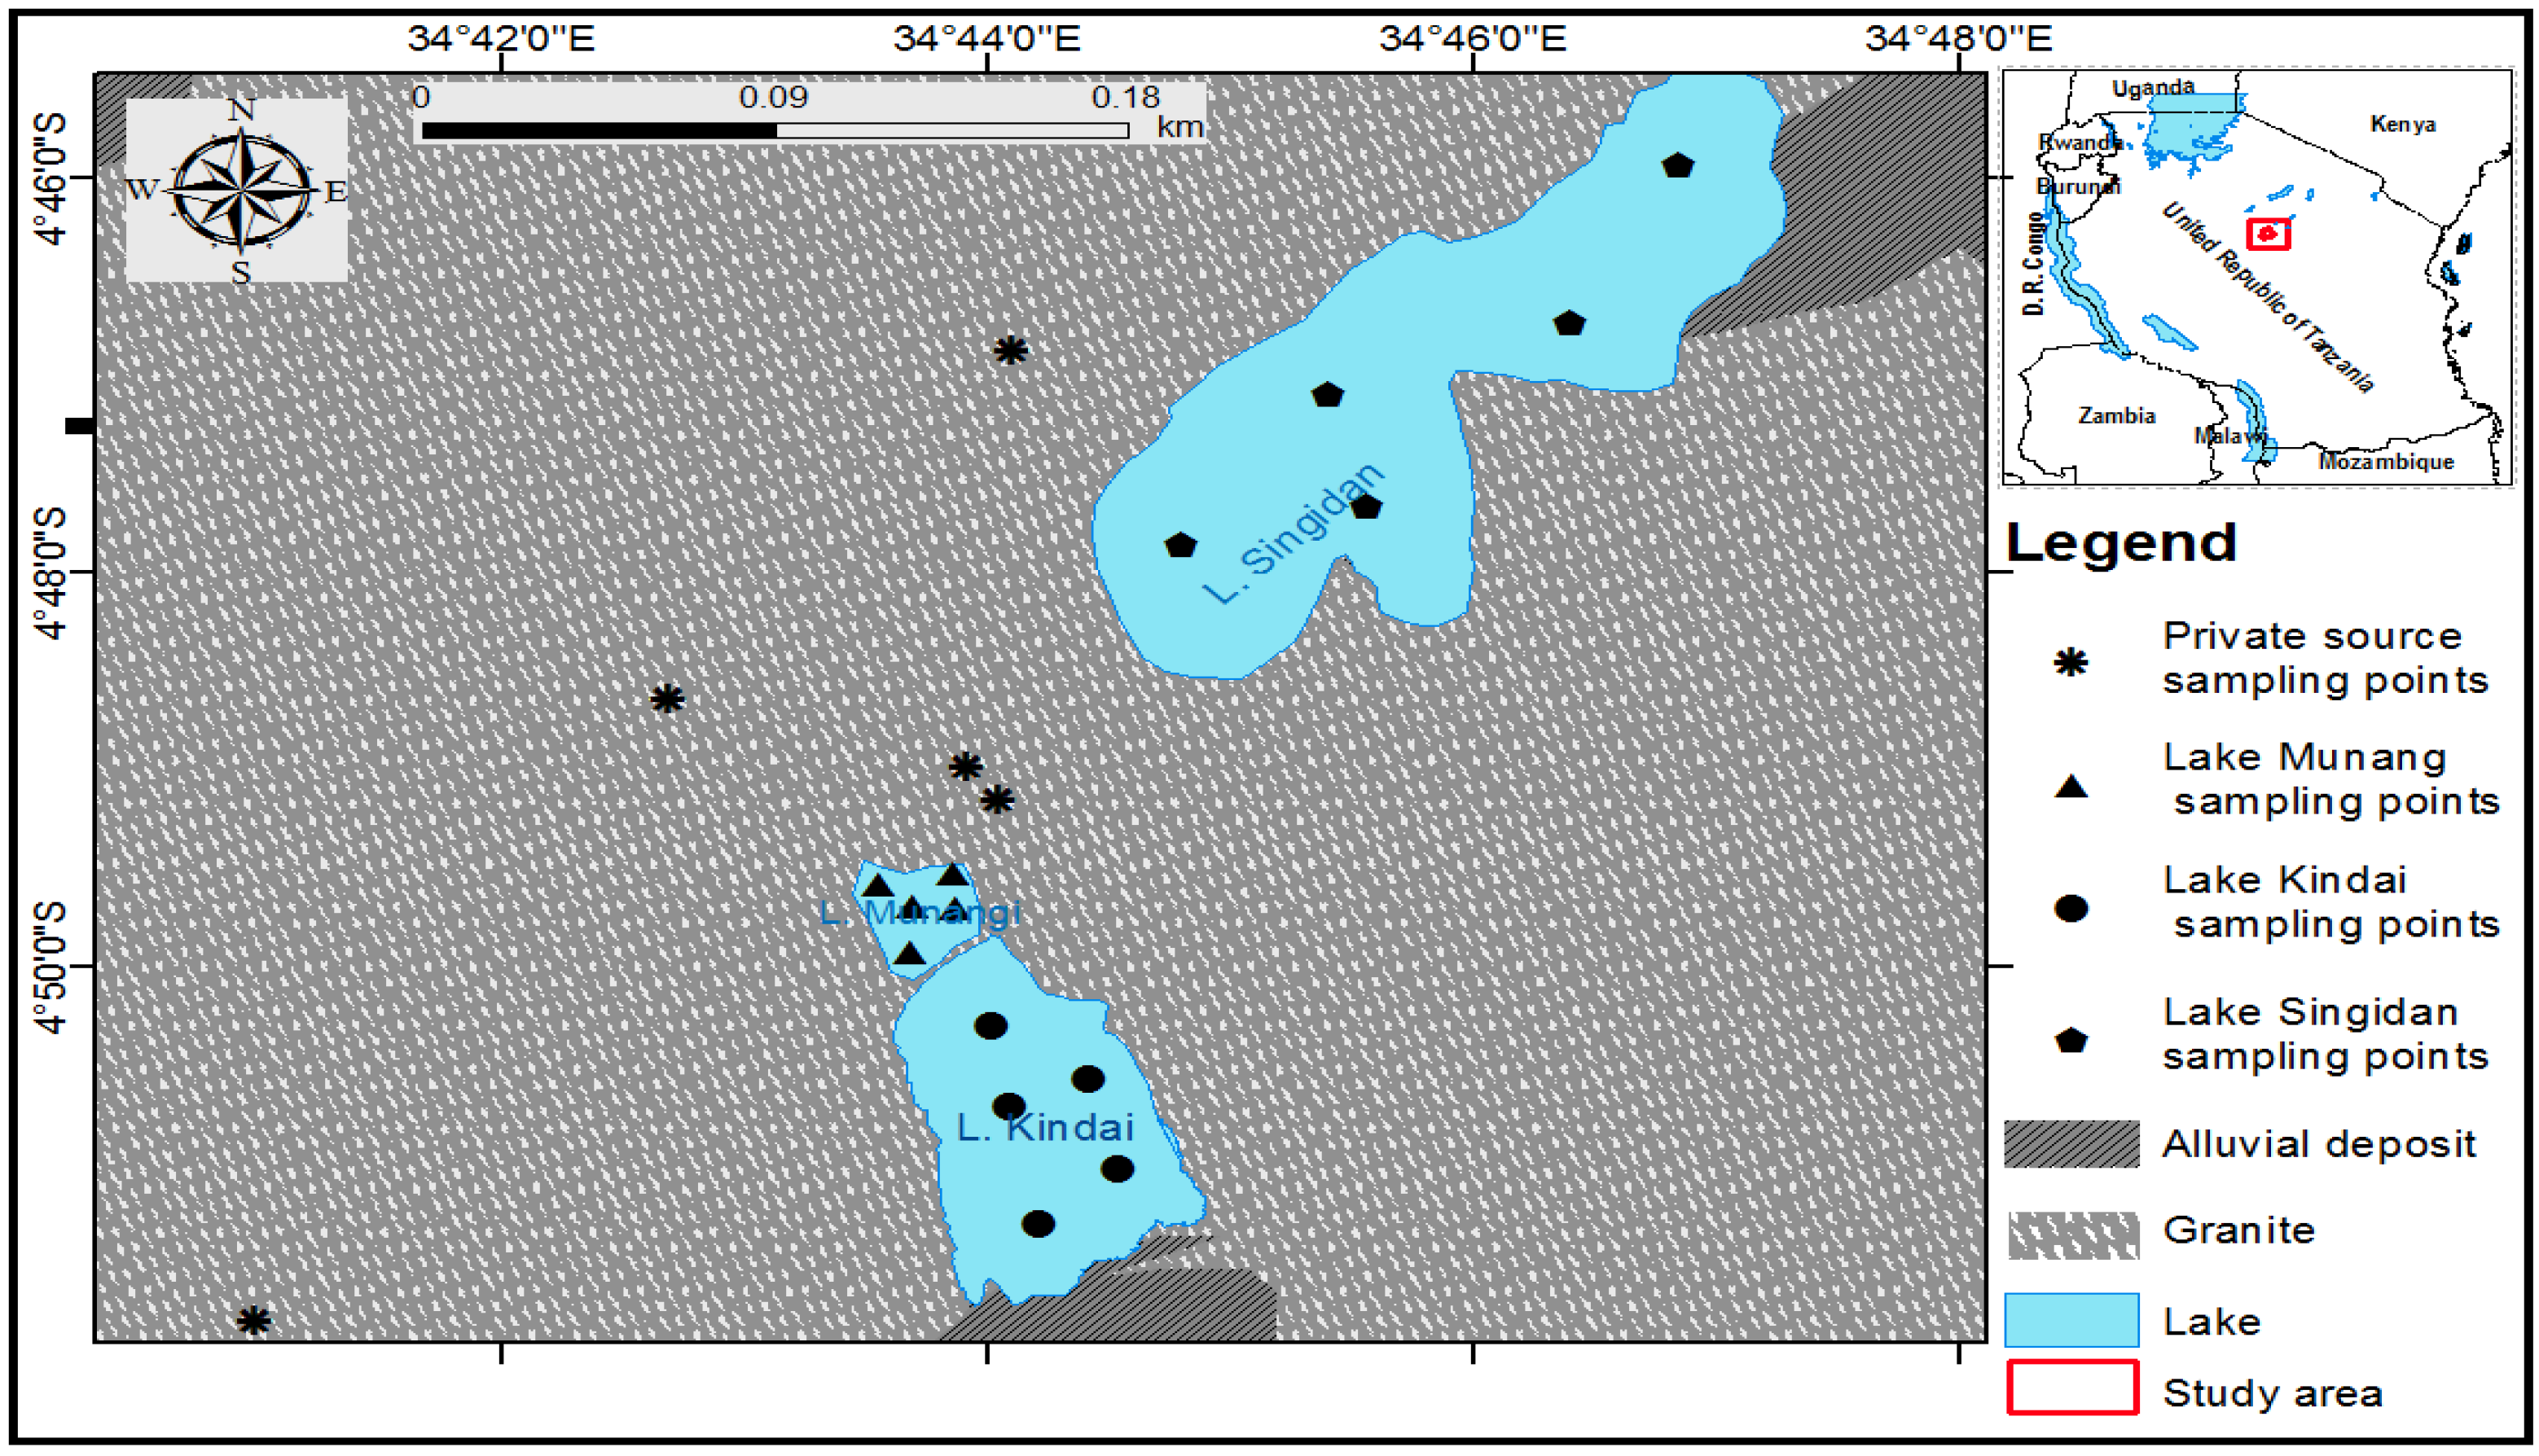
2.1. Study Area

The Singida municipality is located in Tanzania at the coordinate of 4°40′ East and 4°53′ South of equator, and longitude 34°30′ and 34°53′ East of Greenwich Mean Time (GMT). The geology of the area is dominated by the Tanzanian granite rock formation, which incorporates an closed internal drainage system with Uranium deposits reported within the same region [11]. Its climatic condition is semi-arid with a long dry season. The common social economic activities in the area include activities like fishing, agriculture and mining, as shown in Figure 1.

2.2. Sampling and Sample Preparation for Gamma Spectrometry

Fifty-one samples were first randomised to minimise impartiality and then composited to reduce objectivity, and then manageable samples were obtained. Thus, samples were collected from eight areas which were then divided into two major groups including ponds (5) and lakes (3). A total of 51 samples comprising water (20), sediment (20), Nile tilapia (8) and Manyara tilapia (3) were collected. Nile tilapia were obtained in all water bodies but Manyara tilapia were obtained only from Lake Kindai, Lake Munang and Lake Singidani. In each sampling station, samples of sediments and water were collected, and fish samples were randomly sampled from fishermen around water bodies. Data such as coordinates were taken onsite using a Global Positioning System (GPS) machine from Garmin. Guidelines regarding the measurement of radionuclides in food and the environment were observed throughout, as guided by IAEA 1989.
The details of the study area and sampling points are indicated in Figure 1.

2.3. Sediment Sampling and Laboratory Preparations

A grab sampler (a bucket of 10 litres with stone of about 4 kg) was used by a diver to collect 15 sediment samples (about 1 kg each) from Kindai Lake, Munang Lake and Singidani Lake, with an average depth of 1.5 m. Then, from the bottom of the three lakes, sediments from around 0–10 cm depth were collected under minimum disturbance. A trowel was used to collect five sediment samples from each of the five ponds at approximately 0.2 to 0.5 m depth on average; thereafter, these were merged to obtain about 1 kg of sediment subsampled from each pond. Therefore; five sub-samples from five ponds were collected after random sampling and stored in a cool box to maintain a temperature of about 4 °C. These samples were then transported to Tanzania Atomic Energy commission (TAEC) laboratories for further laboratory work.
Upon arriving in the laboratory, the sediment samples were air dried under shade for about six hours then dried in an automatic oven for about two days at a temperature of 105 °C until a constant weight was reached, in order to evaporate water until only the dried sediment remained. The dried samples were ground using a Retch milling machine; the samples were cleaned well with ethanol after each sample milling and sieved in 2 mm to obtain homogeneous samples [12]. Thereafter, each prepared sample was packed in canisters with a specific geometry (100 mm in diameter and 40 mm in height) similar to that of the calibration source provided by the International Atomic Energy Agency (IAEA). Consequently, these canisters were used for packing, and they were well labelled then closed tightly with cello tape to avoid air exchange and escape of radon gas. Samples were then stored for more than 28 days for the uranium and thorium radionuclide daughters to attain secular equilibrium between short-lived progeny and the respective long-lived (Ra-226 from U-238) and (Ra-228 from Th-232), before gamma spectrometric analysis [13].

2.4. Water Sampling and Laboratory Preparations

Fifteen water samples from the three lakes (Kindai, Munang, and Singidani) were collected using a glass bottle (Coke bottle 350 mL) tied with a stone of about 0.2 kg and a rope of about 3 m to collect deep water samples from bottom, middle and surface water; these were then mixed up to obtain about 1.125 L of a composite sample of each sampling station. Water samples from the fish ponds were also collected using a glass bottle; these samples included deep, middle, and surface water, with a depth between 0.2–0.5 m. Samples were taken in the middle and near the bank of the pond from five points, then composited to obtain a minimum of 1.125 L per sample. Therefore, five sub-samples from five ponds were collected and stored in a cool box to maintain a temperature of about 4 °C. Generally, twenty samples of water were collected from the ponds and lakes. These water samples were then pre-treated with drops of concentrated hydrochloric acid (HCl) acid, then transported to TAEC laboratories for further laboratory preparation [13].
In the laboratory, water samples were transferred without filtration to a one litre Minnelli (with a similar geometry to that of the calibration source), and were pre-washed with distilled water, dried, and rinsed with acetone to avoid impurities. The twenty water samples were then labelled and closed tightly with the cello tape to avoid any escape of radon gas. Samples were then stored for more than 28 days for uranium and thorium radionuclide daughters to attain secular equilibrium between short-lived progeny and the respective long-lived (Ra-226 from U-238) and (Ra-228 from Th-232), before gamma spectrometric analysis [8].

2.5. Fish Sampling and Laboratory Preparations

Eight Nile tilapia fish samples were sampled around the lakes and ponds, whereas three samples of Manyara tilapia were sampled from the three lakes. The collected fish samples were of approximately the same size, and were identified with the help of Singida fishery officers and fishermen [14]. These samples were well labelled and packed in special plastic bags, and stored in ice-cool boxes. During transportation to the TAEC laboratories, they were kept at approximately 4 °C by storage with ice cubes in cool boxes.
Laboratory preparations of fish started by taking them out of the cool box for thawing for about six hours. Nile tilapia were then dissected in order to obtain the edible parts of the fish (the fish muscles). Whole Manyara tilapia (i.e., how local residents consume them) were air-dried and then oven-dried at a temperature of 70 °C for about two days until they reached a constant weight (to ensure that they were completely dried). These samples were then crushed down with a grinding machine and cleaned with acetone to avoid contaminations; they were then sieved in a 2 mm mesh to obtain a homogeneous powder [15]. Thereafter, samples were packed in canisters with a specific geometry similar to that of the calibration source provided by the IAEA. They were well labelled then closed tightly with cello tape to prevent radon from escaping. Samples were then stored for more than 28 days, so that Uranium and thorium radionuclide daughters could attain secular equilibrium between short-lived progeny and the respective long-lived (Ra-226 from U-238) and (Ra-228 from Th-232), before gamma spectrometric analysis [16].

2.6. Gamma Spectrometric Analysis

Some 51 samples, which included water (20), sediment (20), Nile tilapia (8) and Manyara tilapia (3), were analysed using a high-purity germanium (HPGe) detector. During analysis, the photo-peaks regularly observed in the samples were identified, and belong to the natural radioactive decay series led by 228Ra, 226Ra, and a third natural radionuclide, 40K. The activity of 226Ra was determined using the gamma-lines of 214Pb (295.2 and 351.9 keV) and 214Bi (609.3 keV), which represented the 226Ra. The activity for 228Ra was measured from 228Ac (338.3 and 911.1 keV). The 40K was measured from its gamma-line energy of 1460.8 keV. Efficiency calibration was calculated by subjecting it to expression (1) and using a standard source with known parameters, while energy calibration was observed from the energy levels of the standard source [12].

2.7. Determination of Activity Levels, Concentration Factor, and Annual Effective Dose

The activity concentrations of specific radionuclides (226Ra, 228Ra and 40K) in the sediment, water, and fish muscle samples were calculated using the following analytical expression, as shown in Equation (1), which was also used in similar studies by other researchers, such as [8].
Asp = N sam / PE ε ( E )
where Asp is the specific activity concentration of the radionuclide in the sample, Nsam is the net counts of the radionuclide in the sample (sediment, water, and fish), PE is the gamma-ray emission probability, ε (E) is the absolute counting efficiency of the detector system, Tc is the sample counting time, and M is the mass/volume of the fish, sediment, or water sample in kilograms or litres. The equations used to calculate the radionuclide transfer factor CF (BCF and BASAF), given by expression (2), have also been used by other researchers [14].
CF = Activity   concentrations   in   biota   concetrations   Bqkg 1 ( dry   weight ) Activity   concentrations   of   reference   medium   ( Bqkg 1 )
The effective committed dose due to dietary intake is provided by the following Equation (3), adapted from ICRP reports [17].
H T , r = ( U i × C r i ) × g T r
where i denotes the food group, U i is the consumption rate per capital (kg/y), C r i the activity concentration of a radionuclide r of interest (Bq/kg), and g T r is the dose conversion coefficient for the ingestion of the radionuclide r (Sv/Bq) in tissue. This is given as 226Ra, 228Ra, and 40K, with conversion factors of 2.8 × 10⁻⁷, 2.3 × 10⁻⁷, and 6.2 × 10⁻⁹ in Sv/Bq, respectively. In order to obtain reliable data on the consumption rate in kilograms per person per year, we interviewed more than 100 people in the study area. The amounts that each adult consumes annually on average were 24.5 and 20.6 kg/p/y for Nile tilapia and Manyara tilapia, respectively.

3. Results

3.1. Activity Concentrations in Sediment

The activity concentrations of 226Ra, 228Ra, and 40K in the sediment samples were calculated using Equation (1), and are presented in Table 1. The mean activity concentrations of radionuclides in Lake Kindai were 79.95 ± 0.04 Bq/kg, 105.48 ± 0.06 Bq/kg, and 472.36 ± 0.31 Bq/kg for 226Ra, 228Ra, and 40K, respectively. The mean activity concentrations of radionuclides in Lake Munang were 87.96 ± 0.07 Bq/kg, 105.48 ± 0.06 Bq/kg, and 434.16 ± 0.24 Bq/kg for 226Ra, 228Ra, and 40K, respectively. The mean activity concentrations of radionuclides in sediment ponds were 44.1.96 ± 0.07 Bq/kg, 68.20.48 ± 0.10 Bq/kg, and 541.09 ± 1.04 Bq/kg for 226Ra, 228Ra, and 40K, respectively. The mean activity concentrations of radionuclides in Lake Singidani were 113.42 ± 0.10 Bq/kg, 116.74 ± 0.9 Bq/kg, and 574.91 ± 0.40 Bq/kg for 226Ra, 228Ra, and 40K, respectively.
Generally, radionuclides’ activities in sediment varied as follows. 40K had combined mean of 505.63 ± 21.79 Bq/kg, which ranged from (224.63–951.8) Bq/kg; this was followed by 228Ra (98.91 ± 3.43 Bq/kg), which ranged from (29.35–134.19) Bq/kg. The lowest combined mean of radionuclide was observed in 226Ra (113.42 ± 0.10 Bq/kg), which ranged from (22.57–143.54) Bq/kg. The concentration of the three radionuclides in the sediment samples varied from (22.57 to 143.54) Bq kg−1, from (29.35 to 134.19) Bq/kg, and from (224.63 to 951.8) Bq kg−1 for 226Ra, 228Ra, and 40K, respectively, with average values of 88.05 ± 4.41 Bq/kg, 98.91 ± 3.43 Bq/kg, and 505.63 ± 21.79 Bq/kg for 226Ra, 228Ra, and 40K, respectively.

3.2. Activity Concentrations in Water

The activity levels of 226Ra, 228Ra, and 40K in the water samples were estimated using expression (1), and are presented in Table 2. The results show that 228Ra was below the detection limit (BDL) in all samples from Lake Kindai, Lake Munang and Lake Singidani. Lake Kindai had a mean activity of 0.64 ± 0.018 Bq/L and 3.13 ± 0.87 Bq/L for 226Ra and 40K, respectively; for Lake Munang, both 226Ra and 228Ra were at BDL. However, the isotope 40K was detected to have a mean radioactivity of 3.67 ± 1.41 Bq/L. The mean activity concentration of 226Ra was noted to be 0.58 ± 0.20 Bq/L and 40K (5.20 ± 0.531 Bq/L) in the ponds. All radionuclides were below detectable activity in Lake Singidani.

3.3. Activity Concentrations in Fish

The radioactivity concentrations of fish samples were calculated using Equation (1), and are presented on Table 3, showing each fish type with their mean radioactivity concentration. Nile tilapia from Lake Kindai had activity levels of 11.23 ± 0.324 Bq/kg and 540.61 ± 15.606 Bq/kg for 226Ra and 40K, respectively. This level is higher compared to the Nile tilapia activity of Lake Singidani, which was 4.56 ± 1.33 Bq/kg and 5.98 ± 0.41 Bq/kg for 40K and 226Ra, respectively. Nile tilapia from ponds had combined mean activity levels of 8.51 ± 0.12 Bq/kg and 691.39 ± 3.72 Bq/kg for 226Ra and 40K, respectively, which are a little bit higher than all samples from Lake Kindai, Lake Munang, and Lake Singidani, which had radioactivity levels of 5.49 ± 0.96 Bq/kg and 637.51 ± 21.62 Bq/kg for 226Ra and 40K, respectively. Generally, the activity of Nile tilapia ranged from 0.71 Bq/kg to 14.70 Bq/kg for 226Ra, and 479.37 Bq/kg to 845.79 Bq/kg for 40K.
Manyara tilapia from Lake Munang had the highest activity concentrations of 226Ra (7.61 ± 0.21 Bq/kg). However, Manyara tilapia samples from Lake Kindai showed the highest ability to uptake 40K, with an activity of 381.81 ± 11.02 Bq/kg compared to the mean activity level of 352.23 ± 9.58 Bq/kg for 40K.

3.4. Activity Concentrations (Bq/kg) Per Location

The mean activity levels of each sample location are presented in Figure 2, whereby 40K had the highest concentrations for all locations. Other radionuclides of 226Ra and 228Ra had high activity concentrations in Lake Singidani, Lake Kindai, and Munang, compared to the ponds. Lake Munang had a high level of 226Ra compared to the ponds, and Lake Singidani shows almost the same level of 226Ra and 228Ra.

3.5. Radionuclide Transfer from the Fish Environment to Fish

Radionuclides may be transferred between biota and reference media (water and sediment) in fresh water ecosystems. The accumulation of radionuclides in biota can be represented in simplified ratio by relating the radionuclides’ concentration in biota to the radionuclides’ concentration in water and sediment. The radionuclides (226Ra, 228Ra, and 40K) bioconcentration factors (BCFs) and biota sediment accumulation factors (BSAF) were calculated using Equation (3), and are presented in Table 4.
The results show that the transfer of radionuclides from water to fish was higher compared to the radionuclide transfer from sediment to fish. Thus, the results of this equation reveal that Nile tilapia have high levels of radionuclides compared to Manyara tilapia.
The dissolved and particulate phases have also been shown to be in a steady state, with exchanges of nuclides between particles and water being wholly reversible. The BCF of 226Ra (19.46 and 17.87) is higher than that of 228Ra (3.09 and 4.57). Additionally, the 40K transfer factor (108.39 and 196.17) from water to fish was higher five times compared to those of 226 Ra (19.46 and1.7.87) and 228Ra (3.09 and 4.57) for Manyara tilapia and Nile tilapia, respectively. However, in gauging the biota sediment accumulation factor of 226Ra, 228Ra, and 40K, only 40K was bio-accumulated, with 1.26 BSAF; the other radionuclides (226Ra, 228Ra) had values less than 1 BSAF, indicating that they were not bio-accumulated.

3.6. Annual Effective Dose (AED)

The radioactivity of fish types obtained from the results was used to estimate the committed dose, which is also the annual effective dose of the population in this study area. The total dose ingested through the consumption of fish can be calculated by summing the doses derived for each radionuclide (226Ra 228Ra and 40K). The annual effective doses due to consumption of contaminated fish were calculated using Equation (3), and are presented in Table 5. The results of this calculation show that Nile tilapia and Manyara tilapia had an AED of 0.009 and 0.005 mSv/y, respectively. The average mean for both Nile tilapia and Manyara tilapia was 0.0074; this value is also less than the international recommended limit of 1 mSv/y.

4. Discussion

4.1. Activity Concentrations in Sediment

The sediment samples had the lowest mean activity levels of 226Ra compared to the other two radionuclides in this study. This may be attributed to the higher solubility of 226Ra compared with 228Ra and 40K. These properties makes 226Ra less available in sediment compared to 228Ra [19,20]. The radioactivity of 40K dominated over the other isotopes, possibly because it is the most abundant in continental rocks and it is elevated in many light minerals. The radioactivity concentration of three isotopes ranged from (22.57–143.54) Bq/kg for226Ra, 29.35–134.19 Bq/kg for 228Ra, and (224.63–951.80) Bq/kg for 40K; only in 40K are these values are little bit higher than the world average, as indicated in Table 1. These values are due to the geological nature of granite rock and the anthropogenic activities nearby these water bodies. However, a value being higher than world average may not mean it causes direct radiological hazard; this depends on the use of sediment. The sediment in this study area does not directly interact with humans.
A comparison of mean sediment activities from this study and the study conducted by [14] revealed that the Malaysian sediment’s mean radioactivity for 228Ra is 249.8 ± 19 Bq/kg, which is almost twice as high as the value found in the current study 228Ra (98.91 ± 3.43 Bq/kg). The mean activity concentration of sediment in the present study is almost four times less when compared to that from Malaysia with regard to 226 Ra (397.9 ± 42.1 Bq/kg). At the same time, the mean radioactivity concentrations of 40K (505.63 ± 21.7 Bq/kg) were three times less than those from Malaysia in 40K (1782 ± 201 Bq/kg). The world average concentrations are 35 Bq/kg, 30 Bq/kg, and 400 Bq/kg for 226Ra, 228Ra, and 40K, respectively. The results of the current study are higher, creating baseline data for future references. Thus, in general, the averages and ranges of the activity concentration of 226Ra, 228Ra, and 40K in these sediments are higher than the world figures reported in [21].

4.2. Activity Concentrations in Water

Radionuclide levels in water were generally low, reflecting the strong chemical bonding properties of the sediments. The isotope 228Ra is insoluble in water, hence it is difficult to dissociate it from granite rock and make it available in water, compared to 226Ra. The isotope of 226Ra, which is more soluble in water, tends to dissolve from granite rock and form leachate solutions; it is more readily available in water compared to 228Ra [13]. The isotopes of 228Ra in water samples were below the detection limit simply because 228Ra is essentially insoluble in water compared to 226Ra. Additionally, 40K is known to be more soluble in water than 226Ra and 228Ra [22]. The higher PH levels in Lake Singidani favoured 226Ra forming complex carbonates and thus being unavailable in water [11]. The mean activity concentrations of 226Ra and 228Ra in water were below the guideline levels for radionuclides in drinking water (1.0 Bq/L), as recommended by the World Health Organisation.
The mean radioactivity level of 40K (3.29 ± 1.20 Bq/L) in this study at Lake Singidani ranged from (1–5) Bq/L, while a study at Bahi swamp (which is found in the same geological area of central Tanzania) found a level that was a little bit higher (3.13 ± 0.87 Bq/L), ranging from (2.6–6.19) Bq/L [8]. This variation may depend on the underlying type of granite rock and the anthropogenic activities around these water bodies.

4.3. Activity Concentrations in Fish

The result showed that Nile tilapia from Lake Kindai had high radioactivity levels compared to ones from Lake Singidani. This is possibly because of different levels in alkalinity, where Lake Singidani is said to be more alkaline than Kindai [11]. It is also reported that low alkalinity favours the migration or dissolution of 226Ra, making it available in water, and then available for fish. These results indicate that Manyara tilapia exceed Nile tilapia by 0.57 Bq/kg. The concentrations of 226Ra Nile tilapia from the current study have a high mean level of 40K concentration (637.51 ± 21.62 Bq/kg), while Manyara tilapia had a mean 40K concentration of 352.23 ± 9.58 Bq/kg. The activity concentration of 40K in Manyara tilapia (352.23 ± 9.58 Bq/kg) is almost half the 40K activity concentration of Nile tilapia (637.51 ± 21.62 Bq/kg). This study was challenged by the limited number of similar studies available for comparing their results with the present results. However, [12] carried out a related study on whole Nile tilapia, and the results were 226Ra (25.6 ± 7.4 Bq/kg), 228Ra (52.4 ± 28.7 Bq/kg), and 40K (462 ± 80 Bq/kg). These differences may vary due to the differences in underlying rocks and the nature of the water bodies. The AED for this study was 0.00973 mSv/y, which is three times higher than the results obtained by [16] from Nigeria, although both were below the limit of 1 mSv/y proposed by the ICRP.

4.4. Comparisons of Activity Concentrations Levels in Different Water Bodies

Higher 40K concentrations in ponds may be attributed to many factors; these may include the use of phosphate-containing fertilisers, which are known to have high radioactivity levels [23]. The concentrations of 226Ra and 228Ra in Singidani Lake had high radioactivity levels compared to other water bodies. These levels may be attributed to factors such as geological nature, and the depth of water bodies being closer to the earth’s surface. The activity level of 226Ra in the water of Lake Kindai is a little bit lower than the activity level of 226Ra in the water of Lake Munang. This may be because Lake Munang receives more water from nearby upstream ponds in which the water activity level of 226Ra is higher, per this study.

4.5. Radionuclides Transfer from Fish Environment to Fish

The radioactivity of 226Ra in Manyara tilapia (whole fish) is a little bit higher than that in Nile tilapia, showing a difference of 0.57 Bq/kg. This difference may be due to 226Ra deposited in the Manyara tilapia bones, which increased the activity levels compared to Nile tilapia samples (which were analysed without bones). Thus, it may be safer to eat fish fillets rather than whole fish with bones in case of contamination, because radium, like other alkaline earth metals, tends to be deposited in bones. The radioactivity level of 228Ra was not detected in fish compared to 226Ra, probably because 228Ra was below the BDL in water; thus, it could also not be detected in fish. 226Ra was available in water compared to 228Ra; thus, it was more easily ingested by fish during food ingestion and gaseous exchange. The radioactivity concentrations of 40K in fish were higher in all samples analysed in this study. Bio-accumulations of 40K in Manyara tilapia may be influenced by different factors such as fish species characteristics, the physical chemical properties of the radionuclides, and the fish food chain aquatic environment [14].

4.6. Annual Effective Dose (AED)

The AED values of the two varieties of fish are approximately 100 times less when compared to the maximum AED limit (1 mSv/y) recommended by the International Commission on Radiological Protection (ICRP). Additionally, they are three times higher compared to those in a study conducted by [16] in Nigeria. The differences in radioactivity levels in this study and that of [16] may be attributed to many factors, like the geological nature of underlying rocks found in lakes. These results imply that fish consumers are radiologically safe; however, the consumption of fish bones will increase their level of radioactivity, especially their level of 226Ra.

5. Conclusion and Recommendations

All samples analysed in this study had activity concentrations that followed following trend: Sediment > fish > water. All radionuclides’ activity followed the trend 40K > 228Ra > 226Ra. The only bio-accumulated radioisotope in fish (Nile tilapia) was 40K, which is among the elements essential for human health. The movement of radionuclides from water to fish was higher compared to the movement of radionuclides from sediment to fish. Additionally, all sampling site activity levels followed the trend of Lake Singidani > Lake Kindai > Lake Munang > ponds. Thus, the reverse trend in the fish supply of these areas may lower the radiological risk of dose exposure. The annual effective doses of Nile tilapia and Manyara tilapia were 0.00937 and 0.005 mSv/y, respectively, which are much below the 1 mSv/y recommendation of the ICRP. Therefore, this study has shown that the current level of radioactivity in fish consumed in this study area does not pose a significant radiological risk to fish consumers. The study recommends that research be extended to other species of fish.

Author Contributions

Conceptualization, A.R.K.; methodology, A.R.K., J.M. and P.M.; software, A.R.K., validation, A.R.K., J.M. and P.M.; formal analysis, A.R.K., J.M. and P.M; investigation, A.R.K.; resources, A.R.K., J.M. and P.M.; data cu ration, A.R.K., J.M. and P.M.; writing—original draft preparation, A.R.K.; writing—review and editing, J.M. and P.M. and A.R.K.; visualization, A.R.K., J.M. and P.M.; supervision, J.M. and P.M. All authors have read and agreed to the published version of the manuscript.

Funding

This research received no external funding.

Data Availability Statement

Not applicable.

Acknowledgments

This research was carried out as part of the first author’s M. Sc. thesis at Sokoine University of Agriculture, Morogoro, Tanzania. The author would like to give his sincere thanks to his employer, who gave him permission to pursue the Master’s program. He is also indebted to his esteemed supervisors, who provided suggestions and guidelines to shape the research. Lastly, the author expresses his profound sense of gratitude to the anonymous reviewers and editors for their helpful comments on previous drafts of the manuscript.

Conflicts of Interest

The authors declare no conflict of interest.

References

  1. Aguko, O.W.; Kinyua, R.; Githiri, J.G. Natural Radioactivity and Excess Lifetime Cancer Risk Associated with Soil in Kargi Area, Marsabit-Kenya. J. Geosci. Environ. Prot. 2020, 8, 127–143. [Google Scholar] [CrossRef]
  2. Fasae, K.P.; Isinkaye, M.O. Radiological risks assessment of 238 U, 232 Th and 40 K in fish feeds and catfish samples from selected fish farms in Ado–Ekiti, Nigeria. J. Radiat. Res. Appl. Sci. 2018, 11, 317–322. [Google Scholar] [CrossRef] [Green Version]
  3. Giri, S.; Singh, G.; Jha, V.N.; Tripathi, R.M. Natural radionuclides in fish species from surface water of Bagjata and Banduhurang uranium mining areas, East Singhbhum, Jharkhand, India. Int. J. Radiat. Biol. 2010, 86, 946–956. [Google Scholar] [CrossRef] [PubMed]
  4. Sowole, O.; Egunjobi, K. Radioactivity Assessment of 40K, 238U and 232Th in Surface Soil Samples of Igbokoda, Southwest of Nigeria. Tanzan. J. Sci. 2019, 45, 307–314. Available online: https://0-search.ebscohost.com.ujlink.uj.ac.za/login.aspx?direct=true&db=awn&AN=tjs-191170&site=ehost-live&scope=site (accessed on 1 September 2021).
  5. Aniebone, A.; Chukwu-Okeah, V.O.; Adegbie, G.O. Radionuclide Actions, Processes and Presence in Water and Sediments, a Review. Int. J. Gr. Sediment Water 2020, 10, 559–571. [Google Scholar] [CrossRef]
  6. Billa, J.; Han, F.; Didla, S.; Yu, H.; Dimpah, J.; Brempong, O.; Adzanu, S. Radioactivity Studies on Farm Raised and Wild Catfish Produced in Mississippi, USA; Springer: Berlin/Heidelberg, Germany, 2015. [Google Scholar] [CrossRef]
  7. Mlwilo, N.A.; Mohammed, N.K.; Spyrou, N.M. Radioactivity levels of staple foodstuffs and dose estimates for most of the Tanzanian population. J. Radiol. Prot. 2007, 27, 471–480. [Google Scholar] [CrossRef] [PubMed]
  8. Kimaro, E.; Mohammed, N. Natural Radioactivity Levels in the Area around the Uranium Deposit of the Bahi District in Dodoma Region, Tanzania. Int. Res. J. Pure Appl. Chem. 2015, 9, 1–10. [Google Scholar] [CrossRef]
  9. Nyanda, P.; Nkuba, L. Natural Radioactivity in Vegetables from Selected Areas of Manyoni District in Central Tanzania. Phys. Sci. Int. J. 2017, 16, 1–10. [Google Scholar] [CrossRef]
  10. Hamidalddin, S.H.Q.; AlZahrani, J.H. An assessment of Some Toxic, Essential Elements and Natural Radioactivity, in Most Common Fish Consumed in Jeddah-Saudi Arabia. Food Nutr. Sci. 2016, 7, 301–311. [Google Scholar] [CrossRef] [Green Version]
  11. Kaishwa, S.J.; Marwa, E.M.; Msaky, J.J.; Mwakalasya, W.N. Uranium natural levels in soil, rock and water: Assessment of the quality of drinking water in Singida Urban District, Tanzania. J. Water Health 2018, 16, 542–548. [Google Scholar] [CrossRef] [PubMed]
  12. Ademola, J.A.; Ehiedu, S.I. Radiological Analysis of 40 K, 226 Ra and 232 Th in Fish, Crustacean and Sediment Samples from Fresh and Marine Water in Oil Exploration Area of Ondo State, Nigeria. Afr. J. Biomed. Res. 2010, 13, 99–106. [Google Scholar]
  13. Ravisankar, R.; Chandramohan, J.; Chandrasekaran, A.; Jebakumar, J.P.P.; Vijayalakshmi, I.; Vijayagopal, P.; Venkatraman, B. Assessments of radioactivity concentration of natural radionuclides and radiological hazard indices in sediment samples from the East coast of Tamilnadu, India with statistical approach. Mar. Pollut. Bull. 2015, 97, 419–430. [Google Scholar] [CrossRef] [PubMed]
  14. di Kampung Gajah, L.; Saat, A.; Isak, N.M.; Hamzah, Z.; Wood, A.K. Study of radionuclides linkages between fish, water and sediment in former tin mining lake in Kampung Gajah. Malsysian J. Anal. Sci. 2014, 18, 170–177. [Google Scholar]
  15. Matamoros, V. Comprehensive Sampling and Sample Preparation; Elsevier: Amsterdam, The Netherlands, 2012; Volume 1. [Google Scholar]
  16. Measurement of Radionuclides in Food and the Environment; IAEA Technical Report Series no 295; International Atomic Energy Agency: Vienna, Ausria, 1989.
  17. Michael, O.M.; Adewale, A.A.; Cornelius, A.F.; Charles, A.E.; Simon, I.O.; Mark, I.B.; Gbenga, M.; Debo, A.G.; Victoria, O.O.; John, A.O. Measurement of Natural Radionuclides Concentration and Radiological Impact Assessment of Fish Samples from Dadin Kowa Dam, Gombe State Nigeria. Afr. J. Med. Phys. 2018, 1, 1–35. [Google Scholar]
  18. ICRP. Annals of the ICRP; ICR Public: Boston, MA, USA, 2007. [Google Scholar]
  19. Igwe, J.C.; Nnorom, I.C.; Gbaruko, B.C. Kinetics of radionuclides and heavy metals behaviour in soils: Implications for plant growth. Afr. J. Biotechnol. 2005, 4, 1541–1547. [Google Scholar] [CrossRef]
  20. Van, H.D.; Nguyen, T.D.; Peka, A.; Hegedus, M.; Csordas, A.; Kovacs, T. Study of soil to plant transfer factors of 226Ra, 232Th, 40K and 137Cs in Vietnamese crops. J. Environ. Radioact. 2020, 223–224, 106416. [Google Scholar] [CrossRef]
  21. UNSCEAR. Sources and Effects of Ionizing Radiation, United Nations Scientific Committee on the Effects of Atomic Radiation UNSCEAR 2000 Report to the General Assembly, with Scientific Annexes; UN: New York, NY, USA, 2000; Volume 1. [Google Scholar]
  22. Bailey, H.; Ragnarsdottir, K.V. Uranium and Thorium Solubilities in Subduction Zone Fluids; Elsevier: Amsterdam, The Netherlands, 1994; Volume 124, pp. 119–129. [Google Scholar]
  23. Makundi, I.N.; Nyaki, M.M.; Mohammed, N.K.; Commision, E. Assessment of radioactivity levels in coal and coal. Tanzan. J. Sci. 2018, 44, 1–11. [Google Scholar]
Figure 1. A geological map showing the domination of granite rocks and sampling points in study area at Singida Municipality.
Earth 04 00028 g001
Figure 2. Radioactivity concentrations (Bq/kg) per location.
Earth 04 00028 g002
Table 1. Activity concentrations (Bq per kg) in sediment from sampled water bodies; values are expressed as mean ± SEM. (p > 0.05 and sample size n = 20).
Water BodySample ID226Ra228Ra40K
Lake KindaiSK189.43 ± 8.32133.52 ± 12.63539.18 ± 50.17
SK275.06 ± 7.5395.44 ± 9.34504.04 ± 50.30
SK392.57 ± 8.86108.94 ± 10.35493.53 ± 47.43
SK479.37 ± 7.85112.96 ± 10.88502.66 ± 49.91
SK563.34 ± 6.0075.25 ± 7.05322.41 ± 33.35
Mean ± SEM79.95 ± 0.04105.22 ± 0.08472.36 ± 0.31
Lake MunangSM195.67 ± 9.3281.63 ± 8.01393.16 ± 40.00
SM2135.55 ± 13.20112.41 ± 11.50432.44 ± 45.18
SM3114.83 ± 10.65111.75 ± 10.37432.54 ± 43.16
SM4137.34 ± 13.0899.21 ± 9.89372.15 ± 39.55
SM588.41 ± 8.29122.43 ± 11.52540.53 ± 50.95
Mean ± SEM87.96 ± 0.07105.48 ± 0.06434.16 ± 0.24
PondsSP136.28 ± 3.6773.51 ± 8.27947.06 ± 88.49
SP276.12 ± 6.9799.56 ± 9.39273.68 ± 26.47
SP356.65 ± 5.4895.40 ± 9.17411.46 ± 39.24
SP428.77 ± 3.0243.06 ± 4.49225.76 ± 23.04
SP522.68 ± 2.5029.50 ± 3.63847.49 ± 81.76
Mean ± SEM44.1 ± 0.0768.20 ± 0.10541.09 ± 1.04
Lake SingidaniSS188.57 ± 8.5499.68 ± 10.04523.31 ± 50.98
SS2103.97 ± 9.69122.98 ± 11.37545.96 ± 53.15
SS3108.36 ± 10.21126.75 ± 11.71582.03 ± 55.84
SS4142.83 ± 13.60122.72 ± 11.91626.47 ± 62.18
SS5124.80 ± 11.94111.23 ± 10.84594.80 ± 59.36
Mean ± SEM113.42 ± 0.10116.74 ±0.09574.91 ± 0.40
Overall mean ± SEM88.05 ± 4.4198.91 ± 3.43505.63 ± 21.79
Overall min–max(22.57–143.54)(29.35–134.19)(224.63–951.8)
World average (UNSCEAR)3530400
Table 2. Activity concentrations (Bq/L) from different sampled water bodies; values are expressed as mean ± SEM and sample size n = 20.
Water BodySample ID226Ra228Ra40K
Lake KindaiWK1BDLBDL2.60 ± 0.07
WK2BDLBDLBDL
WK3BDLBDL3.14 ± 0.09
WK40.64 ± 0.01BDL6.19 ± 0.17
WK5BDLBDL2.97 ± 0.09
Mean ± SEM0.64 ± 0.01-3.13 ± 0.87
Lake MunangWM1BDLBDLBDL
WM2BDLBDLBDL
WM3BDLBDL3.23 ± 2.20
WM4BDLBDL5.05 ± 2.74
WM51.02 ± 0.02BDLBDL
Mean ± SEM 1.02± 0.02-3.67 ± 1.41
PondsWP10.43 ± 0.01BDL5.40 ± 0.15
WP2BDLBDL3.18 ± 0.09
WP3 0.43 ± 0.012BDL5.40 ± 0.15
WP40.64 ± 0.02BDL5.71 ± 0.16
WP51.34 ± 0.03BDL6.31 ± 0.18
Mean ± SEM0.58 ± 0.20-5.20 ± 0.53
Lake SingidaniWS1BDLBDLBDL
WS2BDLBDLBDL
WS3BDLBDLBDL
WS4BDLBDLBDL
WS5BDLBDLBDL
Mean ± SEM---
Overall Mean ± SEM0.31 ± 0.04-3.25 ± 0.30
Min–MaxBDL–1.41BDLBDL–8.3
Table 3. Activity concentrations (Bq/kg) in Nile tilapia and Manyara tilapia from sampled water bodies; values are expressed as mean ± SEM. (p > 0.05, and sample size n = 11).
Water BodyType of FishSample ID226Ra228Ra40K
Lake KindaiNile tilapiaTK11.23 ± 0.32BDL540.61 ± 15.60
Lake MunangTMBDLBDL597.92 ± 17.26
Lake SingidaniTS4.56 ± 1.33BDL504.60 ± 50.46
PondsTP1BDLBDL693.87 ± 20.00
TP25.65 ± 0.16BDL547.39 ± 15.80
TP314 ± 0.40BDL805.51 ± 23.25
TP4BDLBDL745.17 ± 21.51
TP55.89 ± 0.17BDL665.05 ± 19.19
Mean ± SEM 8.51 ± 0.12-691.39 ± 3.72
Overall Mean ± SEM5.49 ± 0.96-637.51 ± 21.62
Min–Max0.71–14.70-479.37–845.79
Lake SingidaniManyara tilapiaTS04.97 ± 0.14BDL349.00 ± 10.07
Lake KindaiTK05.38 ± 0.15BDL381.81 ± 11.02
Lake MunangTM07.61 ± 0.21BDL325.88 ± 9.40
Overall Mean ± SEM5.98 ± 0.41-352.23 ± 9.58
Min–Max4.72–7.99-309.90–352.23
Table 4. Radionuclide transfer factor from water to fish (BCF) and from sediment to fish (BSAF), for each type of fish.
Transfer of Radionuclides from Water to Fish Transfer of Radionuclides Sediment to Fish
Sample226Ra228Ra40K226Ra228Ra40 K
Manyara tilapia19.46 3.09108.390.030.010.70
Nile tilapia17.874.57196.170.060.021.26
Table 5. Annual effective dose compared to recommended limits (mSv/y).
Fish TypeAED
Nile tilapia0.0090
Manyara tilapia0.0050
Average mean0.0074
Recommended limits [18,19]1.0000
Disclaimer/Publisher’s Note: The statements, opinions and data contained in all publications are solely those of the individual author(s) and contributor(s) and not of MDPI and/or the editor(s). MDPI and/or the editor(s) disclaim responsibility for any injury to people or property resulting from any ideas, methods, instructions or products referred to in the content.

