

Effect of Particle Size on the Physical Properties of PLA/Potato Peel Composites


1
Sustainable Packaging Institute SPI, Faculty of Life Sciences, Albstadt-Sigmaringen University, 72488 Sigmaringen, Germany
2
Meat Technology & Science of Protein-Rich Foods (MTSP), Department of Microbial and Molecular Systems, Leuven Food Science and Nutrition Research Centre, KU Leuven Campus Ghent, B-9000 Ghent, Belgium
*
Author to whom correspondence should be addressed.
Compounds 2024, 4(1), 119-140; https://doi.org/10.3390/compounds4010006
Submission received: 30 July 2023
/
Revised: 12 January 2024
/
Accepted: 26 January 2024
/
Published: 1 February 2024
(This article belongs to the Special Issue Polymeric Substrates Modification with Biobased Functional Compounds)
Abstract
:In recent years, agricultural by-product fillers have been investigated in composites to influence the physical properties of the packaging material, increase biodegradability, and reduce costs. In general, the properties of composites are mainly influenced by the type, amount, and size of fillers. The aim of this study was to characterize potato peel particles as a filler in a poly(lactic acid) (PLA) matrix and to determine the effect of particle size on the physical properties of the composite. Therefore, different fractions of potato peel powder (0–53 μm, 125–250 μm, and 315–500 μm) were incorporated into PLA matrix via compounding and injection-molding. Microscopic analysis of the injection-molded samples revealed that the average particle shape did not differ between the different fractions. Overall, increasing the particle size of potato peel particles resulted in increased stiffness and decreased ductility. The cold crystallization temperature and water vapor transmission rate of the composites were independent of particle size but increased upon the incorporation of potato peel particles. In conclusion, the effect of particle incorporation on packaging-related properties was higher than the effect of using different particle size fractions. This means that potato peel particles, regardless of their particle size distribution, are promising fillers for composites, with the potential to improve biodegradability, maintain some level of protection for the packaged product, and reduce the cost of the composites.
1. Introduction
To counteract the negative environmental impact of petrochemical-based packaging, bio-based polymers have been studied more intensively over the past decades as alternatives. Poly(lactic acid) (PLA) is a bioplastic which is gaining increasing commercial interest in various sectors, including biomedicine, the automotive industry, construction, agriculture, single-use items, and food packaging [1]. Thus, the increasing production capacity of PLA is projected to account for 37.9% of global bioplastic production capacity by 2027 [2]. PLA is an aliphatic polyester which consists of polymerized, ring-opened lactide building blocks. Lactic acid is obtained from fermentation of agricultural carbohydrates (e.g., from corn, sugar cane, tapioca, and potatoes) [3,4]. Compared to most biopolymers, PLA has good mechanical properties and can be thermally processed via injection-molding, extrusion, or film-blowing, making it attractive for the packaging industry. However, the high cost and sometimes low barrier properties of PLA compared to petrochemical alternatives limit its applicability. The use of PLA-based composites can be an option to increase the biodegradability and reduce the cost of PLA-based packaging [3,5].
The incorporation of particulate or fibrous fillers into a polymer matrix can reduce the materials cost and increase its biodegradability as well as its thermal-, gas barrier-, and mechanical properties [6]. For more environmentally friendly solutions, the use of natural fillers may be preferred in the development of bio-based composites [7]. Such fillers are typically by-products with very low economic value, characterized by low cost and high availability [3,8]. The incorporation of natural by-products, including, among others, dried grains [9], walnut shell [10], coconut shell [11], hazelnut skin, cocoa by-products [12], mussel shell [13], destarched cassava [14], coffee ground [15], pineapple skin [14], hemp hurd, alfalfa, grape stem [8], cellulose fibers, wood sawdust, hazelnut shells, flax fibers, corn cob, and starch [12,16] into PLA has been studied over the last decade.
While natural fibers often increase mechanical properties (stiffness and strength) based on their ability to carry applied stress and load [5], starch fillers have shown to decrease composite strength, reduce oxygen permeability, and increase biodegradation when added as a filler to PLA matrix [12,17]. A decrease in mechanical properties due to the incorporation of a filler into a matrix is based on repulsive interactions between the hydrophilic filler material and the continuous hydrophobic polymer phase. Depending on the type and therefore polarity of the filler material and interactions between filler and polymer, an increase in filler loading can increase or decrease the stiffness and strength of the composite [15,18,19]. Similarly, a decrease in filler size, e.g., from micro- to nanoscale, can significantly increase the stiffness and tensile strength of composites containing the same filler loading [20].
A highly available by-product with potential as a composite filler is potato peel (PPeel). Potato is the fourth most abundant crop worldwide (the first being rice, the second wheat, and the third maize) [21]. Along the potato supply chain, approximately half of the harvested tubers are discarded, mostly due to quality standards and through peeling [22,23]. In addition, the amount of industrially produced PPeel is supposed to increase within the coming years, due to a shift in consumption from fresh potatoes towards processed potato products [21], increasing the importance of PPeel side stream utilization [24,25].
In recent years, PPeel has been identified as a potential material for biopolymer applications, either in cast films [26,27,28,29,30,31,32] or, as we address in this article, as a composite filler material. For composite application, the incorporation of potato peel powder in polypropylene (PP) and linear low-density polyethylene (LLDPE) matrix has been studied, investigating the influence of potato peel filler concentration and compatibilizer addition on morphological, thermal, and physico-mechanical properties [33,34]. Thermal and physico-mechanical properties of PPeel/PP composites were increased using a compatibilizer. An increase in tensile modulus and comparable tensile strength (to neat PP) were obtained for 20% w/w filler content [34]. In PPeel/LLDPE composites, an increasing filler content decreased tensile strength and ductility and increased the tensile modulus and water absorption [33]. Biodegradable properties of PPeel/PP composites have been studied as well, showing an increase in biodegradation/mass loss of up to 10% at maximum filler concentration (40% w/w) upon increasing filler content compared to a mass loss of 1% of neat LLDPE samples [35]. Patil et al. [36] investigated the filler content of alkali-treated PPeel powder in an epoxy holding matrix on the physical properties of the composites. The authors reported decreasing tensile modulus, tensile strength, hardness, and flexural strength upon increasing filler content [36].
In the literature, mostly the filler loading and compatibilization between natural waste/by-product fillers and polymers, such as PlA, have been studied [8,11,12,13,37,38]. Although the particle size of the filler may have crucial effects on the composite [39], there is only a small number of studies investigating the effect of particle size of a hydrophilic filler in PLA composites [40,41].
To our knowledge, PPeel particles have yet not been incorporated into a PLA matrix, and the influence of PPeel particle size on composite properties has not been investigated before, either. Therefore, the aim of this study was to determine the effect of PPeel particle size on the PPeel–PLA composite’s physical properties. We hypothesize that tensile strength and ductility will decrease, and tensile modulus and water vapor transmission rate will increase with increasing particle size of PPeel due to increased “breaks” within the continuous PLA polymer matrix.
2. Materials and Methods
2.1. Materials
Potato peel: Freshly generated PPeel, which originated from potatoes of the Bernina variety, was kindly provided by the company Sautter Kartoffelverarbeitung (Bondorf, Germany). Sautter Kartoffelverarbeitung conducted the peeling process mechanically in two steps using a knife peeler (type MS-1t, Sormac, Venlo, The Netherlands) and a carbon peeler (type Crp-10, Sormac, The Netherlands). Fresh PPeel was packed directly after peeling in vacuum bags. Vacuum bags were sealed and transported to Albstadt–Sigmaringen University, where they were stored refrigerated at 4 °C for 16 h prior further treatment on the next day.
Poly(lactic acid): Luminy® LX175 was purchased from Total Corbion PLA bv (Gorinchem, The Netherlands). Density: 1.24 g/cm³, melting temperature: 155 °C, melt flow index: 8 g/10 min at 210 °C/2.16 kg.
Other: Self-adhesive aluminum foil for permeation measurements was purchased from Brugger Feinmechanik GmbH (Munich, Germany).
2.2. Sample Preparation
2.2.1. Potato Peel Pre-Treatment
PPeel was hand-washed and drained to remove excess water. Drained PPeel was dried in a combi steamer (type C4eT 10.10 EB, Convotherm Elektrogeräte GmbH, Egifingen, Germany) for 2.5 h at 75 °C, under low humidity and high air velocity. Therefore, 750 g ± 10 g PPeel was spread out uniformly on a flat aluminum container (Rational AG, Landsberg am Lech, Germany) covered with a sheet of baking paper (Cedo Folien und Haushaltsprodukte GmbH, Mönchengladbach, Germany). The drying process was carried out with ten flat containers, corresponding to a total of approximately 7.5 kg of fresh peel. During the drying process, the PPeel was manually mixed at 45 min, 90 min, and 120 min to allow for uniform drying.
2.2.2. Classification of Dried Potato Peel Powder
Dried PPeel was ground at 10,200 rpm for 3 min using an electric mixer (type TM31, Vorwerk Elektrowerke GmbH & Co. KG, Wuppertal, Germany). The potato peel powder had a moisture content of 11.4% and a chemical composition (dry matter content) of 5.7% protein (Kjeldahl), 3.1% ash (muffle furnace), 0.1% fat (Soxhlet), and approximately 91.1% carbohydrates (subtraction of protein, ash, and fat content from total dry mass).
Classification of PPeel particles was conducted using a sieve tower (VE 1000, Retch GmbH, Haan, Germany) consisting of meshes with a pore size of 500 μm, 315 μm, 250 μm, 125 μm, 90 μm and 53 μm, respectively. Therefore, 50 g ± 0.2 g ground PPeel was sieved continuously for 5 min using an amplitude of 0.5 mm. After the first passage, accumulating powder was brushed from the rim of each mesh and sieved for an additional 2 min in a second passage. After the second passage, the separated material was poured from the meshes into corresponding containers. Material that was stuck in the meshes as well as material which adhered to the underside of the meshes was brushed off in a separate container and then mixed with the unclassified material to run through the sieving process again.
Based on the obtained amount of each PPeel fraction, sieved PPeel was divided into five different fractions/classes: 0–53 μm, 53–125 μm, 125–250 μm, 250–315 μm, and 315–500 μm grain size. In addition, one class was formed using PPeel powder that had not gone through the sieving process, to represent the whole, unclassified material. Fractions of dried PPeel powder were stored in sealed vacuum bags (320300, GUDE GmbH, Rheine, Germany) at room temperature (~22.5 °C and ~35% r.h.) prior to further use.
2.2.3. Specimen Production
For the finest (0–53 μm), medium (125–250 μm), and coarsest (315–500 μm) particle size classes, specimens were produced in a 9:1 mass ratio (PLA:PPeel). Therefore, 3.6 g PLA and 0.4 g pre-dried (75 °C, 24 h) PPeel were mixed and added into the compounder funnel, where the melt was mixed with a co-rotating twin-screw at a rotation speed of 50 rpm (Haake Mini Lab 3, thermo scientific, Karlsruhe, Germany). Specimens were produced via injection-molding (Haake Mini Jet Pro, thermo scientific, Karlsruhe, Germany) applying an injection pressure of 600 bar for 4 s and a holding pressure of 400 bar for 6 s. For tensile testing, dog bone specimens with a length of 75 mm, width of 15 mm, and thickness of 1.5 mm were produced by injection-molding, whereas round specimens with a diameter of 35 mm and thickness of 1.5 mm were molded for gas permeability and optical measurements. The temperature settings for specimen production were determined in preliminary trials. For each class, the lowest processing temperatures feasible for specimen production were identified and applied (summarized in Table 1).
The produced specimens were stored in a climatic chamber (type KBF P 240, Binder GmbH, Tuttlingen, Germany) at 23 °C and 50% r.h. for at least one week, prior to characterization.
2.3. Characterization
To evaluate filler characteristics, mean particle size (Sauter mean diameter), size distribution, and equivalent volume-based surface area ratios of PPeel particle fractions were determined via laser diffraction analysis (Section 2.3.1). In addition, mean particle size, size distribution, and particle shape were characterized via microscopic image analysis of the molded composites (Section 2.3.2).
2.3.1. Laser Diffraction Analysis
Particle size distribution of PPeel powder fractions were measured in dry state using a laser diffraction particle analyzer (Mastersizer 2000, Malvern Panalytical, Kassel, Germany). For each fraction, applied testing conditions were determined to obtain an obscuration between 3.0 and 8.0. For each particle size class, a threefold determination was carried out using new material with a measuring time of 3 s. Particle patterns were interpreted using the Fraunhofer diffraction theory, and Sauter mean diameters were determined automatically via the corresponding software (Version 5.54, Malvern Panalytical, Kassel, Germany).
Obtained Sauter mean diameters D[3,2] from laser diffraction analysis were used for the calculation of equivalent volume-based surface area ratios assuming spherical particle shape, using the following equation [42]:
where SA ratio is the equivalent volume-based surface area ratio, SAS is the surface area (SA = 4 × π × (D[3,2]/2)2) of one PPeel particle of the smaller fraction, SAB is the surface area of one PPeel particle of the bigger fraction, VB is the volume (V = 4/3 × π × (D[3,2]/2)3) of one PPeel particle of the bigger fraction, and VS is the volume of one PPeel particle of the smaller fraction.
2.3.2. Microscopic Image Analysis
Round specimens produced from biocomposites composed of PLA and PPeel particles of either 0–53 μm, 125–250 μm, or 315–500 μm were used for microscopic image analysis. For each specimen, JPEG pictures of random positions were taken with a camera (PL-A662, Pixelink, Ottawa, ON, Canada) equipped with a microscope (Eclipse E66W, Nikon Europe BV, Amsterdam, The Netherlands). The magnification and focus of the pictures were adjusted to represent several PPeel particles per picture within the specimen. Minimal and maximal Feret diameters as well as the projected area of 25 random particles per specimen were measured manually using ImageJ (Wayne Rasband and contributors National Institutes of Health, Bethesda, MD, USA). For each biocomposite containing a different PPeel particle size class, four specimens were investigated, leading to a total of 100 particles per biocomposite that have been analyzed.
To characterize particle shape of PPeel particles within the biocomposite specimens, the aspect ratio (Equation (2)) and roundness (Equation (3)) were determined according to DIN ISO 9276-6 [43] for those particles [42]:
where DF min is the minimal Feret diameter and DF max is the maximal Feret diameter of the particle.
where A is the projected area of the particle, DF max is the maximal Feret diameter of the particle, and DA is the projected area equivalent diameter (Equation (4)).
To evaluate mean particle size of each class Sauter mean diameter D[3,2]) (Equation (5)) was calculated as follows [42]:
where D is either minimal/maximal Feret diameters or projected area equivalent diameters.
2.3.3. Thickness Measurement
For tensile and barrier tests, the thickness of specimens was measured at five random locations of the testing area using a caliper gauge (Reboxon, Well Max Technology HK Limited, Hong Kong, China) with a resolution of 0.001 mm and a precision of 0.002 mm.
2.3.4. Attenuated Total Reflectance Fourier Transform Infrared Spectroscopy (ATR-FTIR)
ATR-FTIR measurements of the samples were carried out in triplicate between 4.000 and 600 cm−1 using a macro module equipped with a diamond ATR-Crystal (Alpha, Bruker Optik GmbH, Ettlingen, Germany). For each sample, a background measurement of 128 scans at 4 cm−1 resolution was carried out prior to sample spectrum measurements, performed with 128 scans at 4 cm−1 resolution.
2.3.5. Differential Scanning Calorimetry (DSC)
DSC measurements were conducted under a nitrogen atmosphere (50 mL/min) using a DSC 3 (Mettler Toledo, Gießen, Germany). The tests were performed in triplicate, using 18 ± 0.5 mg samples. The samples were placed into 40 μL aluminum cups, and an empty cup was used as a reference. Prior to the measurements, the cup lids were punctured. The measurement included three separate cycles (1st heating/cooling, 2nd heating) in the range of 20–190 °C, applying a heating/cooling rate of 10 K/min. Only the 2nd heating cycle was evaluated for the determination of the glass transition temperature (Tg), cold crystallization peak temperature (Tcc), and melting peak temperature (Tm).
The crystallinity (Equation (6)) of the PLA phase within the samples was determined according to [40,44]:
where ΔHM is the measured melting enthalpy of the sample, ΔHCC is the measured enthalpy of cold crystallization of the sample, ΔHPLA100% is the theoretical melting enthalpy of 100% crystalline PLA = 93.7 J/g, and ϕ is the weight fraction of the potato peel filler (ϕ = 0.1 for samples including potato peel particles).
2.3.6. Tensile Properties
Tensile properties, elongation modulus, tensile strength, and elongation at break were determined according to DIN 527-1 [45], using a universal testing machine (Alluris FMT-314 C-Frame, PPT GmbH & Co. KG, Freiburg im Breisgau, Germany). Dog bone specimens with a length of 75 mm, a width of 15 mm and a thickness of 1.5 mm were examined using a gauge distance of 50 mm and a crosshead speed of 10 mm/min. The width and thickness of the specimens were determined as described above (see Section 2.3.3). For each PPeel particle size class within the biocomposite, at least 5 specimens were used, and the arithmetic mean value calculated.
2.3.7. Water Vapor Transmission Rate
The water vapor transmission rate (WVTR) of the samples was determined gravimetrically according to DIN 53122-1 [46], using silica gel-filled aluminum cups with a permeation area of 50 mm2. For WVTR measurements, round-molded specimens with a diameter of 35 mm and a thickness of 1.5 mm were masked with impermeable aluminum foil (90 mm diameter) on both sides. Circles (24 mm diameter) were cut out from the aluminum foil, defining the permeation area. For each PPeel size class within the biocomposites, 4 specimens were analyzed for WVTR. Cups were stored in a climatic chamber (type KBF 240, Binder GmbH, Tuttlingen, Germany) at 23 °C and 85% r.h. for 5 weeks and weighed at regular intervals of 3 to 4 days.
2.3.8. Statistical Analysis
Statistical analyses were performed using the software Minitab (Version 20.4, Minitab GmbH, Munich, Germany). Measured data were checked for normal distribution using probability plots. Similar variances were determined according to Levenes test Significant differences (p ≤ 0.05) between sample sets with similar or different variances of normal distributed data were determined by performing ANOVA according to Tukey or Games–Howell, respectively. Significant differences between samples are represented by different letters.
3. Results
3.1. Obtained Samples
To evaluate the influence of filler size on physical properties, PPeel particles were classified into several fractions via sieving analysis, and PPeel/PLA composites were produced via injection-molding, incorporating different PPeel size classes at a 1:9 ratio (w/w).
3.1.1. Classification
Different fractions of PPeel powder obtained from sieve classification could be visually distinguished as shown in Figure 1.
3.1.2. Specimen Production
To maximize the potential effect of particle size on specimen properties, specimens were prepared using 0–53 μm, 125–250 μm, and 315–500 μm PPeel particles, representing the finest, medium, and coarse particle classes, respectively, obtained by sieving dried and ground PPeel (see Section 2.2.2). Using constant PPeel mass in the PLA–PPeel biocomposites (10% w/w), the number of incorporated PPeel particles decreased with increasing particle size class, causing optical differences between the specimens (Figure 2). Specimens containing fine PPeel particles (0–53 μm, Figure 2b) appeared as a continuous/homogeneous brownish material. Specimens containing bigger/coarser PPeel particles (125–250 μm Figure 2c, 315–500 μm Figure 2d) were characterized by a transparent PLA matrix sprinkled with brown particles. As a reference, neat PLA (Figure 2a) resulted in completely transparent specimens.
3.2. Characterization
To evaluate the influence of PPeel particle size class on the physical properties of PPeel/PLA composites, particle size distributions were determined from the injection-molded biocomposite specimens prepared. In addition to particle size-based parameters (see Section 3.2.1), FTIR (see Section 3.2.2), thermal (see Section 3.2.3) and mechanical properties (see Section 3.2.4), as well as WVTR (see Section 3.2.5) were also analyzed.
3.2.1. Particle Size-Based Parameters
In laser diffraction analysis, the light scattering pattern of multiple flowing particles is interpreted based on spherical particle diameters. For each PPeel particle size class, the Sauter mean diameter was determined, representing the average particle size of the class. Assuming the PPeel particles had a spherical shape, the volume-based surface area and particle number ratios of different particle classes were determined based on their Sauter mean diameters (Table 2).
Table 2 illustrates the difference in particle size regarding volume and surface area and therefore the difference in number of particles that were integrated into the biocomposite specimens (10% w/w). This is in alignment with the optical appearance of produced specimens (Figure 2). Due to equivalent PPeel filler concentration (10% w/w), the surface and therefore interfacial area of the filler was higher for smaller particle classes compared to bigger ones [47], which also directly influenced the composite tensile properties (see Section 3.2.4).
In contrast to laser diffraction analysis, microscopic image analysis can reveal information about particle size, as well as particle shape [42]. The typical values that characterize the shape of a particle are aspect ratio and roundness (Equations (2) and (3)). Aspect ratio is defined as the ratio between the shortest and longest diameter of a particle that pass through the geometrical center of the particle. Such diameters are also called Feret diameters. According to DIN ISO 9276-6 [43], minimal and maximal Feret diameters often represent the particles’ width and length, and aspect ratio and roundness values vary between 0 and 1, with 1 representing circles [48,49].
Microscopic images of neat PLA and different PLA–PPeel biocomposites are shown in Figure 3. Neat PLA (Figure 3a) appeared as a smooth matrix with few small inclusions, which could be gas bubbles, crystalline regions, or solid contaminations that emerged during processing. For samples containing PPeel filler (Figure 3b–d), plenty of these inclusions were found, which may be fragments of the PPeel particles or gas inclusions. Particles of the two bigger PPeel classes (Figure 3c,d) could be clearly differentiated from small inclusions of neat PLA or PLA–PPeel particles of the finest class (Figure 3b).
Microscopic images of samples containing PPeel filler (Figure 3b–d) showed the porosity and slightly elongated, irregular non-spherical shape of the PPeel particles. In comparison, potato starch particles are characterized by a spherical to elongated shape, but a smoother surface [22]. A tendency of particles to form agglomerates and an occurrence of deformed particles was also seen in the microscopic images.
To characterize PPeel particles before and after incorporation into biocomposites, Sauter mean diameters of the initial potato peel powders were determined via laser diffraction analysis and compared to Sauter mean diameters of PPeel particles incorporated into biocomposites determined via microscopic image analysis (Table 3).
Sauter mean diameters determined for the different particle classes were similar across the different determination methods (Table 3). This means that the partial disruption of PPeel particles during sample preparation did not affect the overall Sauter mean diameters of the particle size distributions, according to our measurements.
Furthermore, aspect ratios and roundness values did not differ between all particle classes incorporated into the injection-molded specimens (Table 3). This means that the shape/morphology of the PPeel particles is independent of particle size.
3.2.2. Attenuated Total Reflectance Fourier Transform Infrared Spectroscopy (ATR-FTIR)
To indicate potential molecular interactions between the PPeel filler and the PLA phase, ATR-FTIR measurements were performed for the pure components as well as the injection-molded biocomposites (Figure 4).
The Neat PLA specimen (Figure 4a) revealed characteristic peaks at 2996, 1745, 1452, 1360, 1267, 1180, and 1080 cm−1, which were attributed to the –CH3, –C=O, and C–O stretching vibration, –CH deformation, –C=O bending vibration, –C=O, and –C–O stretching vibration, respectively [20,50,51]. The ATR-FTIR spectra of 0–53 μm PPeel particle powder is depicted in Figure 4b, as well as in Figure S1, where ATR-FTIR spectra of 125–250 μm and 315–500 μm are presented as well. PPeel particles, independent of size, were characterized by bands characteristic of starch, including the broad OH-vibration band around 3400–3200 cm−1 as well as peaks at 2921, 1632, 1407, and 991 cm−1, which were attributed to C–H stretching, H–O–H bending, C–H bending, and C–O–H bending vibrations, respectively [52]. However, the small peaks observed at 1733 and 1516 cm−1, partially overlapping with the broader peak at 1632 cm−1, were not characteristic of starch and might be attributed to carbonyl and amide bands of the non-starch carbohydrates, such as lignin [53] and protein [54] components of the PPeel powder (see Section 2.2.2). Spectra taken from the outer surface of the injection-molded PLA/PPeel biocomposite specimen (Figure S2b–d) did not differ from those of the neat PLA specimen (Figure S2a). Spectra taken from the cross-sectional area of the injection-molded PLA/PPeel biocomposite specimen (Figure 4c and Figure S3) showed peaks at 3274, 2995, 2923, 1747, 1651, 1455, 1381, 1360, 1265, 1180, 1081, and 957 cm−1, which were attributed to the OH-vibration band, –CH3 stretching, C–H stretching, –C=O stretching, H–O–H bending, C–O stretching, C–H bending, –CH deformation, –C=O stretching, –C–O stretching, as well as to C–O–H bending, respectively.
3.2.3. Differential Scanning Calorimetry (DSC)
To evaluate the influence of potato peel particle incorporation and size on the thermal properties of resulting composites, DSC measurements were carried out (Figure 5), determining the glass transition temperature (Tg), cold crystallization peak temperature (Tcc), melting peak temperature (Tm), and the crystallinity of the PLA phase (Xc), as depicted in Table 4.
The spectra of the neat PLA and different PLA–PPeel biocomposies showed a Tg, Tcc, and Tm which were typical for semi-crystalline polymers such as PLA [55]. The melting peak of the neat PLA specimen consisted of two clearly distinguishable peaks. Upon the incorporation of PPeel particles, a significant shift in Tm to higher temperatures, an increase in the first melting peak intensity, and a decrease in the second melting peak intensity were observed. However, ΔHm only significantly (p < 0.05) decreased upon the incorporation of 315–500 μm PPeel particles. A significant shift of TCC to higher temperatures was also observed upon PPeel particle incorporation (Table 4) and ΔHcc decreased for PLA–PPeel biocomposites containing 125–250 μm or 315–500 μm particle classes, respectively. Tg was not affected by PPeel particle incorporation, but a significant difference (p < 0.05) between PLA–PPeel biocomposites containing 0–53 μm particles and those containing 125–250 μm particles was detected.
3.2.4. Tensile Properties
To investigate the influence of PPeel particle size on the composite’s tensile properties, the tensile strength, elongation modulus, and elongation at break of the different samples were determined (Figure 6).
Overall, a trend results from the incorporated PPeel particle size class. As the particle size class increased, a decrease in tensile strength, an increase in elongation modulus, and a decrease in elongation at break were observed, as shown in Figure 6. With the incorporation of PPeel filler, the tensile strength decreased compared to the pure PLA specimens. Stiffness of a polymer is indicated by its elongation modulus. The incorporation of the medium and the coarse fraction of PPeel into the PLA matrix significantly (p < 0.05) increased the stiffness of the biocomposite (Figure 6). Stiffness also slightly increased with increasing particle size. Ductility, indicated by the elongation at break measurement, describes materials’ ability “to plastically deform upon elongation without rupture” [56]. With filler incorporation and increasing PPeel size class, ductility of the composite decreased significantly except in the case of the finest PPeel fraction (Figure 6). Between the neat PLA and the composites containing 0–53 μm particles, no significant difference in ductility was measured.
3.2.5. Water Vapor Transmission Rate (WVTR)
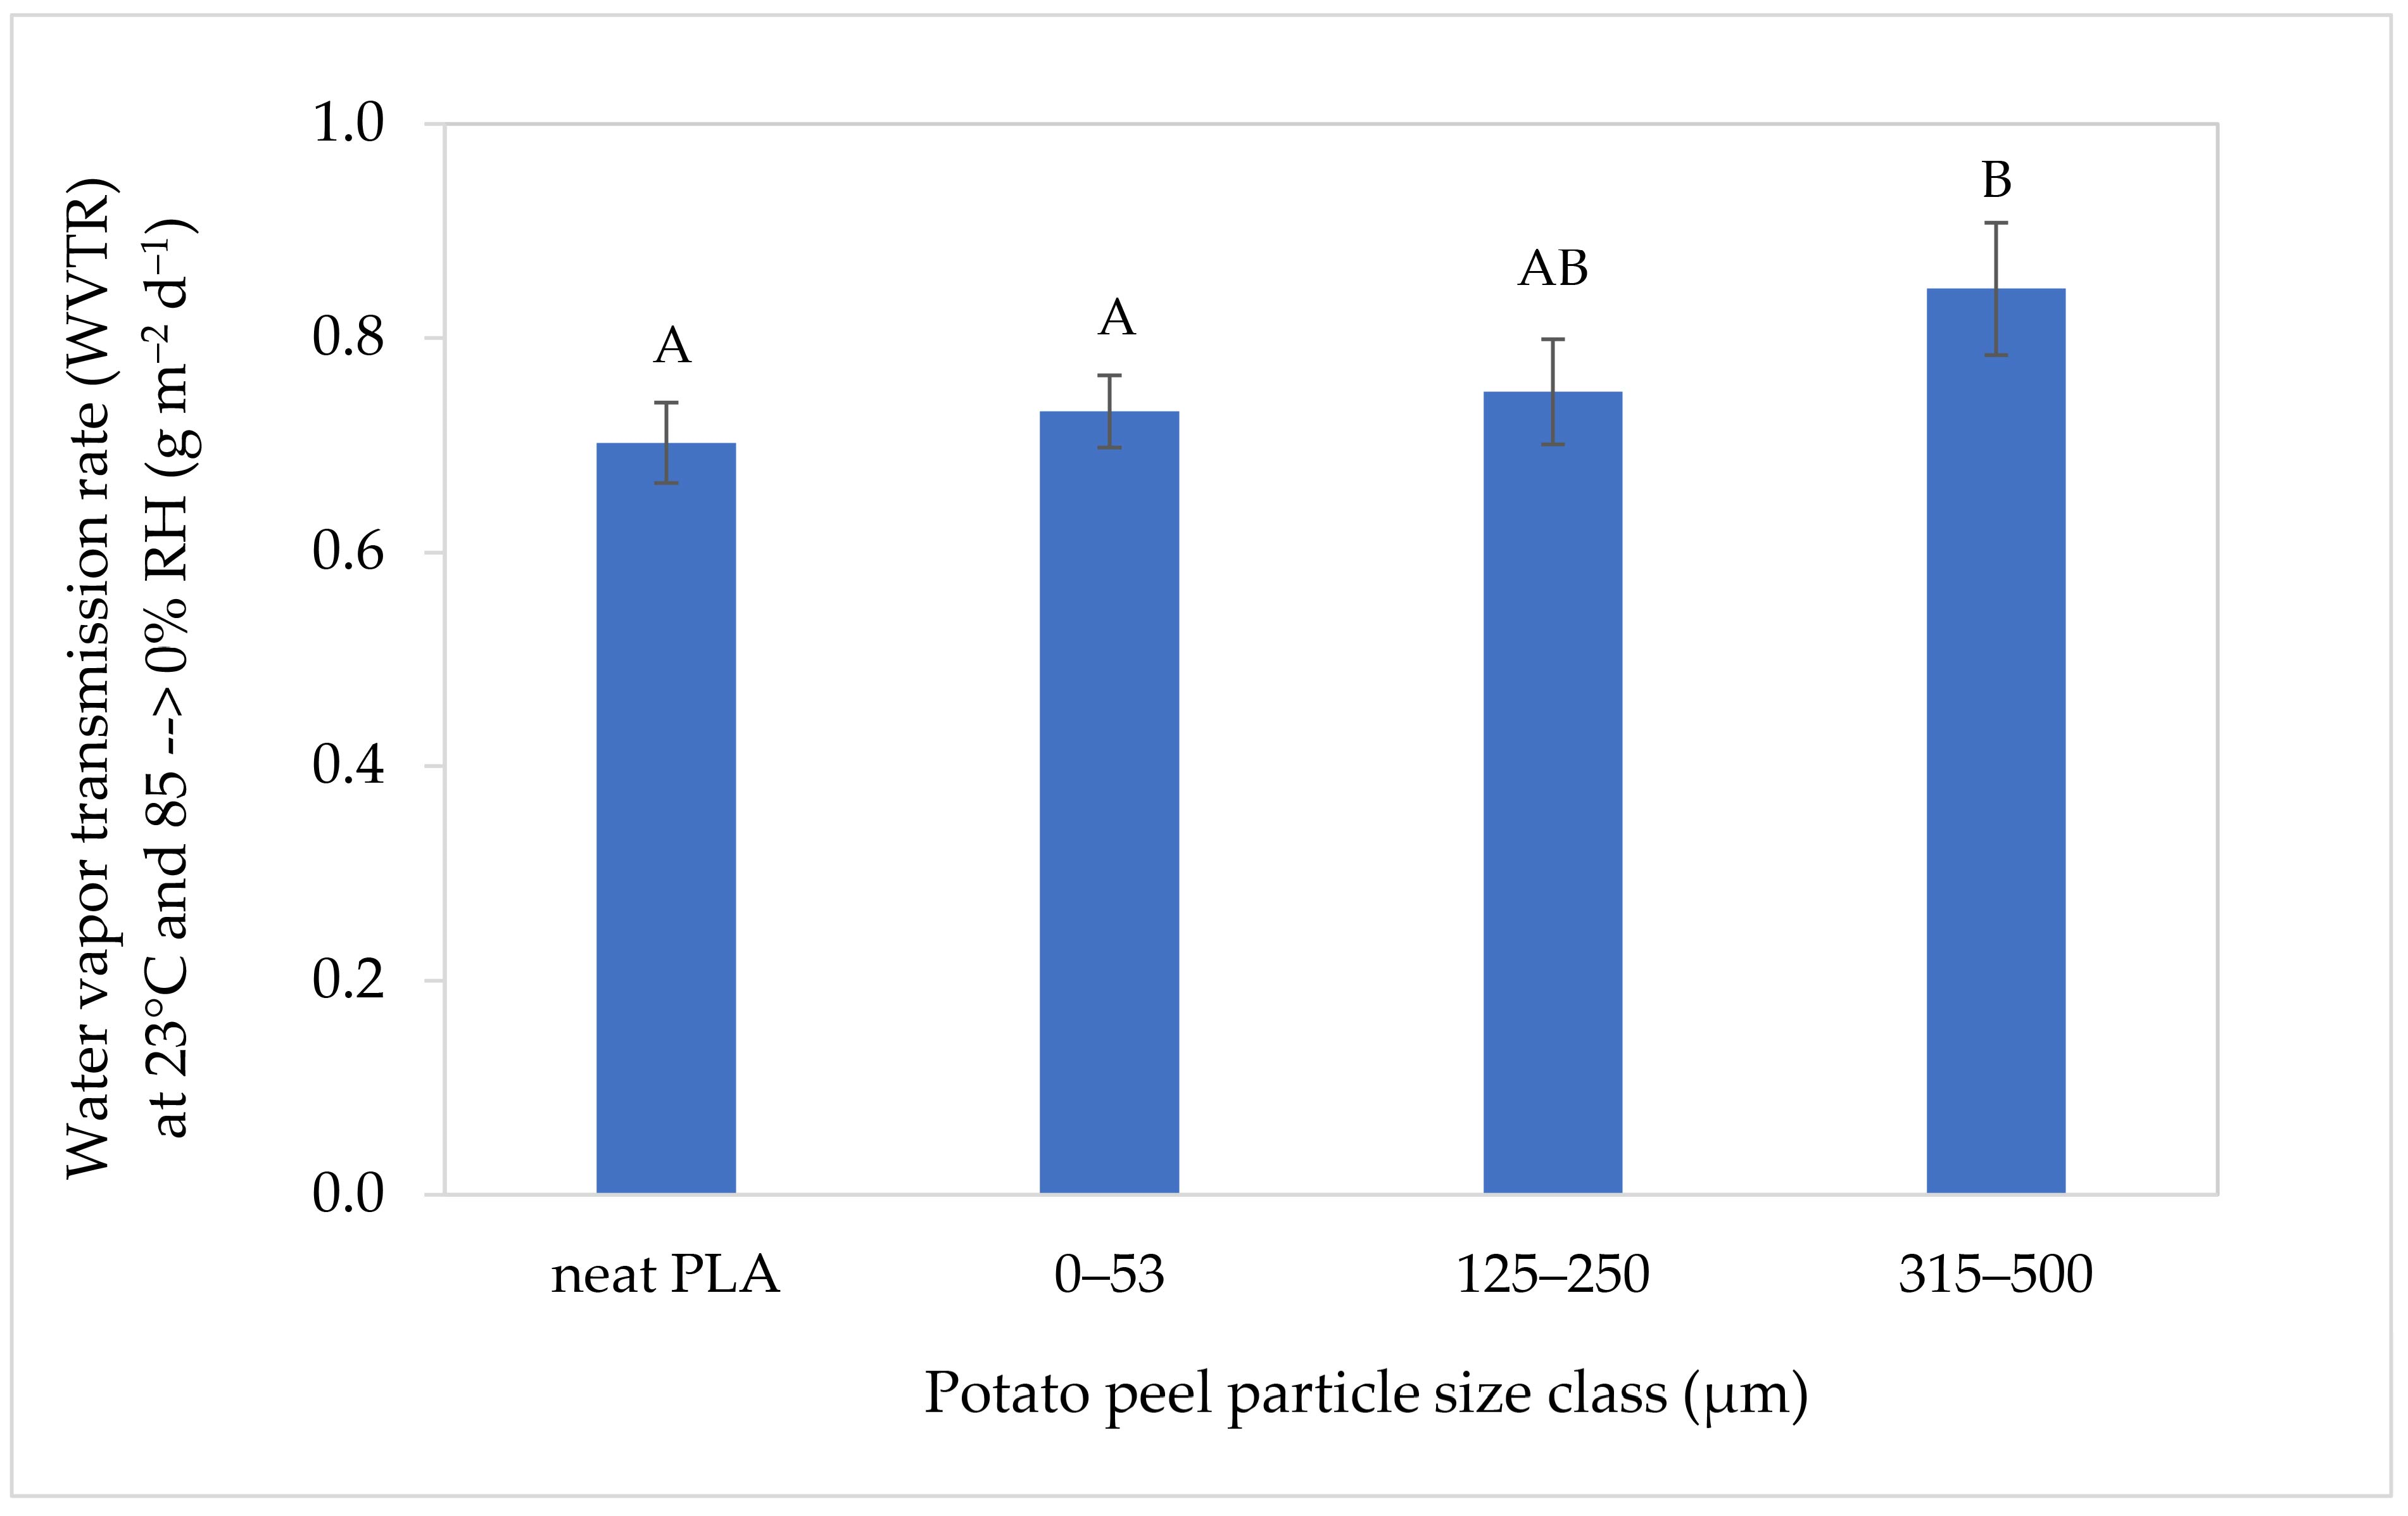
To evaluate the influence of PPeel particle size and incorporation on composite barrier properties, the water vapor transmission rates of the different 1.5 mm-thick specimens were determined (Figure 7).
Figure 7 shows no significant influence of increasing PPeel particle size on WVTR, except for the coarse particle fraction, where WVTR increased by 26% on average compared to neat PLA. However, neither the incorporation of PPeel powder nor the increase in particle size affected the water vapor barrier of the composite polymer compared to neat PLA by a great amount.
4. Discussion
The aim of this study was to determine the effect of PPeel particle size on the PPeel–PLA composite’s physical properties, including particle size, particle-polymer interactions and thermal, tensile, and barrier properties.
4.1. Specimen Production
For specimen production, extensive pre-trials were conducted to identify processing conditions that could feasibly fill molds for dog bone and circular specimens. Major difficulties that were identified in melt processing during pre-trials were composite degradation and foaming. These were likely based on occurring Maillard reactions, high compounding temperature application, and some residual water being left in the biocomposites during melt processing.
A typical characteristic of the Maillard reaction is browning, which is based on the formation of melanoidins. In addition, by-products including carbon dioxide, water, and other small molecular substances are formed through the Maillard reaction [57]. With increasing processing time during pre-trials, a visual change to the composite material was observed, with the material becoming dark brown, indicating the occurrence of melanoidins. Furthermore, increasing composite foaming and degradation were visually observed with increasing processing time (from 1 min up to 30 min) during the pre-trials. Foaming was likely based on the composites’ residual water content as well as water and carbon dioxide formation during the Maillard reaction [58]. In addition to browning and foaming, we observed a degradation of the PPeel/PLA matrix due to decreasing pressure/torque/viscosity within the compounder, resulting in melt shear-off. Several mechanisms for PLA degradation during melt processing have been reported in the literature, including hydrolysis, oxidative degradation, chain scission, and transesterification [59]. With undried PLA pellets and increasing processing time, polymer degradation increased, consequently resulting in a decrease in molecular weight [60,61]. Polymer degradation, visible as dark browning and foaming of the compound melt, was highest in PPeel/PLA composites containing the fine powder fraction (0–53 μm). This is likely attributable to the high surface–volume ratio (see Table 2), resulting in the highest cross-sectional area between the filler and continuous phase, favoring polymer degradation.
Due to the visually observed time-dependent composite degradation and foaming, processing time during injection-molding was set to ≤3 min, and applied temperature settings were increased from the initial 170–190 °C to 200–220 °C (Table 1). An increase in temperature resulted in a decrease in the viscosity of PLA due to the increased free volume between the molecular chains and thus decreased intramolecular friction, resulting in a material flow capability feasible for injection-molding application [62]. In contrast, application of high temperatures increased hydrolysis (decrease in molecular weight) and thermal degradation of the polymer [60], which further decreased material viscosity [62] and ultimately caused decreased mechanical composite properties, as shown for PLA and PLA/PBAT blends [61].
4.2. Particle Characterization
To characterize the size and shape of PPeel particles, three different methods, namely sieving analysis, laser diffraction analysis, and microscopy, were performed in this study. Sieving and laser diffraction analysis were applied to characterize the PPeel powder, and microscopic analysis was applied to characterize PPeel particles within the injection-molded specimens. Sieving analysis was performed at the beginning to classify PPeel powder into different fractions.
Laser diffraction analysis is a common and fast method to obtain the particle size distributions of spheres [42]. For non-spherical particles, diameters are spherical equivalents, which depend on particle orientation. Based on operational settings, particle size distributions may differ. Thus, particle volumes and surface areas determined from Sauter mean diameters obtained from laser diffraction analysis may differ widely from actual PPeel particle volumes and surface areas, based on the non-spherical shape of PPeel particles. The three-dimensional shape of most PPeel particles can be described as ellipsoid (see Figure 3). Equivalent volume-based surface area ratios determined from the Sauter mean diameters of equivalent spheres could be similar to those of equivalent ellipsoids, even though volume and surface area might be overestimated [42].
Particle size distribution is not always sufficient to characterize particles, due to missing information about shape [63]. Information about the shape of particles can be obtained via microscopic image analysis [64]. Light microscopy of the injection-molded specimen is a two-dimensional method, which is not suitable for representing the volume of a particle which is incorporated into a solid polymer matrix because the image can only be taken from the surface of the specimens. In the case of light microscopy performed in the present study, particles were spread at multiple depth-levels of the 1.5 mm-thick specimen. Therefore, overlapping particles could not be measured and may have interfered with the evaluation of particles in the focal plane. In the taken microscopic images, agglomerates could not always be identified clearly. The formation of agglomerates within composites due to filler–filler attraction and filler–polymer repulsion is also an important phenomenon within biocomposites. The importance of particle distribution was shown by Samal [65] for iron and carbonyl iron filler in the silicon polymer matrix. An inhomogeneous particle distribution within the composite may be responsible for poor mechanical properties in the current study.
Furthermore, the boundaries of disrupted particles are difficult to identify, causing susceptibility to errors, especially for very small particle fractions, which could not be clearly differentiated from gas inclusions as mentioned before.
Other microscopic methods which are often used for composite characterization are scanning electron microscopy (SEM) and transmission electron microscopy (TEM) [42]. On the one hand, both have larger magnification possibilities, depth of field, and resolution (SEM: 0.01–500 μm, TEM: 0.001–5 μm), giving some information about internal structure and interface compatibility. On the other hand, SEM is restricted to the specimen surface, and for TEM, a specimen thickness of < 0.2 μm is needed [42]. To enable a “view inside the specimens”, specimens need to be fractured into smaller pieces prior to analysis to enable fracture surface analysis.
A comparison between the particle size analysis of the PPeel powder before and after injection-molding revealed that Sauter mean diameters of the particle classes did not differ (Table 3). This means that the thermal processing of PPeel/PLA biocomposites and their accompanying mechanical stresses in this study did not result in significant sheering and rubdown of PPeel particles, which is, however, usually observed for other natural fillers and fibers [41].
4.3. ATR-FTIR
ATR-FTIR measurements, performed on the surface of the specimens (Figure S2), did not reveal PLA/PPeel interactions. This could be attributed to an insufficient number of PPeel particles present within the first micrometers of the specimens’ outer surface to interfere with the spectrogram of PLA. This also indicated that injection-molded specimens were covered with a PLA layer which was in alignment with the smooth surface of the specimen. This was also found by Barczewski et al. [43] for PLA/copper slag composites.
However, ATR-FTIR measurements performed at the cross-sectional area of the specimens (Figure 4c and Figure S3) revealed spectra resembling a mixture of the spectra from neat PLA (peaks at 2995, 1747, 1455, 1360, 1265, 1180, 1081 cm−1) and PPeel powder(s) (peaks at 3274, 2923, 1651, 1381, 957 cm−1). The differences in peak intensity of the samples spectra (Figure 4a–c) can likely be attributed to variances in specimen–diamond contact during the performed measurements.
Aworinde et al. [66] did not observe any peak formations nor removals upon incorporation of chitosan, chitin, or titanium powder into PLA. In our study, no additional bands were observed either, but slight shifts in wavelengths of different bands have been observed upon incorporation of PPeel particles: 2853 → 2852 cm−1, 1745 → 1747 cm−1, 1543 →1540 cm−1, 1452 → 1455 cm−1, 1382 → 1381 cm−1, 1267 → 1265 cm−1, 956 → 957 cm−1, indicating some PLA–PPeel interactions. Hassan and Koyama [51] and Makri et al. [20] observed a shift in the C=O stretching vibration around 1747 cm−1 of PLA to lower wavelengths upon micro-chitin and -lignin incorporation, respectively. The authors indicated that these shifts indicate PLA–filler interactions, which can be attributed to the formation of hydrogen bonds between hydroxyl and ester groups. Furthermore, the use of smaller particles resulted in increased PLA–filler interactions [20]. In our study, a shift of the C=O stretching vibration around 1745 cm−1 of PLA to higher wavelengths was observed upon PPeel incorporation, and no indication of increased PLA–filler interaction with decreasing particle size was observed via ATR-FTIR measurements (Figure S3).
4.4. DSC
In the literature, two distinct melting peaks of semi-crystalline PLA have been reported [67,68] that can be attributed to the beta and alpha crystalline polymorph forms [50,69]. The decrease in the second melting peak intensity, correlated to the alpha crystalline polymorph, could be a result of the stress that was applied during specimen processing. The addition of PPeel particles during the compounding step likely resulted in increased stress in the PLA phase, noticeable due to increased torque values. It has been reported that stress applied to PLA can result in a transformation of the alpha crystalline polymorph into the beta crystalline polymorph form, due to a change in polarization of the chains –C=O dipoles [69].
A slight decrease in Tg was only observed for biocomposites with 125–250 μm PPeel particles compared to the neat PLA specimen, indicating an increase in the molecular mobility of the PLA phase. This has also been observed by other authors upon addition of chitin [51], lignin [70], or chestnut shell [44] to PLA. However, a change in Tg was not observed for biocomposites containing 0–53 μm or 315–500 μm PPeel particles. Similarly, other studies did not report changes in Tg compared to neat PLA, especially upon filler incorporation of 10% w/w, but also in the range of 15 to 40% w/w [12,14,16,68,71].
According to the literature, the incorporation of fillers does often not result in a significant shift of Tcc [12] or in a shift of Tcc to lower temperatures [13,14,16], improving crystallization performance of the composite compared to neat PLA [72]. However, independent of particle size, Tcc significantly shifted to higher temperatures upon PPeel particle incorporation. This means that the chain mobility of PLA, which is required for crystallization [68], was hindered by the incorporated PPeel particles, indicating the occurrence of some filler–polymer interactions [73].
Furthermore, partially significant differences in Xc were observed upon PPeel filler incorporation of different particle size classes. According to Chun et al. [11], an in- or decrease in Xc is attributed to a nucleating effect or agglomeration of the incorporated filler, respectively. The changes in Xc suggests that there might be some occurring PLA–PPeel interactions, as incorporation of PPeel filler in the range of 10–40% w/w did not influence the heat of fusion (ΔHm) nor the degree of crystallinity in PP or LLDPE composites to a great extent due to the lack of significant filler–matrix interactions [33,34].
However, in PLA, increasing crystallinity has been reported to correlate with polymer degradation, particularly hydrolytic chain cleavage [74]. Compared to the initially amorphous PLA granules (Xc = 0%), the Xc of the PLA specimen increased to 3.2% (Table 1), indicating some PLA degradation occurring during specimen production. Furthermore, changes in Xc might be attributed to the differences in processing conditions [59] as well as (differences in) the residual moisture content of the PPeel filler (Table 1) [40]. In the case of PLA/PPeel biocomposites containing 125–250 μm or 315–500 μm particles, an increase in Xc might indicate increasing PLA degradation due to the residual moisture content of PPeel particles, which was highest in the 125–250 μm particle class. This was, however, not observed in PLA/PPeel biocomposites containing 0–53 μm particles.
4.5. Tensile Properties
A decrease in tensile strength upon PPeel particle incorporation has also been reported by Sugumaran et al. for PPeel/PP [34] and PPeel/LLDPE [33] composites, and by Patil et al. [36] for PPeel/epoxy resin composites. A decrease in tensile strength upon filler incorporation may be attributed to repulsive interactions between the filler and the continuous phase, resulting in insufficient stress transfer and, thus, decreasing tensile strength [39]. Due to the ester and hydroxyl groups of PLA, hydrogen bonds can theoretically be formed between PLA and PPeel filler [3], which are weak attractive interactions and thus not strong enough to increase tensile strength of the composite material. Rather, the PPeel particles interfered with the PLA polymer matrix, revealing a trend of decreasing tensile strength with increasing PPeel particle size (Figure 6). The filler–matrix interactions may be improved with surface pre-treatment, such as electron beam irradiation, of the filler particles and use of bonding aids [73].
However, tensile strength did not continuously decrease with increasing filler size (Figure 6). This means that a decreasing interface area between filler and continuous phase with increasing particle size did not increase composite strength. A decrease in tensile strength upon increasing particle size has been reported for algae/PLA composites when authors have compared particles <50 μm with particles 200–400 μm in length [41]. For buckwheat husk/PLA composites, a tendency toward increasing tensile strength upon particle size increase has been observed for filler contents above 4% [40].
An increase in stiffness upon filler incorporation could be based on the hindrance of chain movement during tensile testing [75]. This would mean that PPeel particles hindered the PLA polymers from moving within the matrix, which is important for the flexibility of the specimen. In addition, the stiffness of the composite could be attributed to the stiffness of the PPeel filler itself. Based on the weak interactions between the PPeel filler and the PLA matrix, PPeel particles may be easily debonded from the PLA matrix during tensile testing, and therefore did not contribute to an increase in elongation modulus [76]. These results correspond with results found for algae/PLA and buckwheat husk/PLA composites, for which stiffness increased with increasing particle size as well [40,41].
Decreasing ductility upon filler incorporation and with increasing particle size could be explained by particle debonding due to weak interactions or even repulsion between filler and polymer matrix compared to high attractive interactions within the polymer matrix. Increasing particle size has been reported to cause premature failure, due to easier particle debonding, decreasing specimens cross-sectional area that is able to carry the load [76]. The decrease in composite ductility with increasing particle size could also be attributed to chain movement hindrance when composite deformation occurred, resulting in an increasing brittleness with increasing particle size [75]. For algae/PLA, decreasing ductility with increasing particle size was reported as well, except at low filler content (2%). At low algae filler content and small particle size (< 50 μm) within the PLA matrix, the strain at break of specimen increased. Authors assumed that incorporated small particles act as local stress concentrates and therefore increase strain at break [41]. In another study, no significant differences between elongation at break values upon increasing buckwheat husk particle size incorporated into PLA matrix were observed by Andrzejewski et al. [40] for filler concentrations < 4%. A tendency toward increasing ductility upon increasing particle size was, however, shown for buckwheat husk filler concentrations above 4% [40].
When interpreting the results on the effect of particle size of PPeel on tensile strength properties, it should be taken into account that the processing temperature of the different samples was not identical (Table 1). Other authors have revealed that differences of 20 °C in melt processing temperature over a 10 min melt processing period showed an impact on the viscosity and tensile properties of PLA and PLA–cellulose composites [77]. Due to the short processing time in the current study (≤ 3 min), the influence of temperature on sample properties was assumed to be minimal (see Table 1, 200 to 220 °C). Furthermore, the aspect ratio of filler particles was shown to influence the stress transfer between the filler and continuous phases and therefore the tensile properties [78]. Considering the identical aspect ratios and roundness factors of the different PPeel size classes (Table 3), the particle shape did not vary amongst different PPeel particle size classes and therefore should not have influenced the stress-transfer properties of the matrix and the filler. In contrast, the particle size of the PPeel filler itself varied depending on the size class used and thus influenced particle distribution and stress-transfer between matrix and filler particles [65].
In the literature, a strong relationship between mechanical and thermal properties, especially Xc, has been reported [71,79]. Considering the results from the performed DSC measurements, tensile properties of PLA/PPeel biocomposites were likely affected by the differences in their Xc. As the flexibility of injection-molded PLA specimen increases with decreasing Xc, the lower Xc of PLA/PPeel biocomposites containing 0–53 μm particles (Xc = 1.9) compared to the other samples (Table 4) may explain the similar elongation at break of this sample compared to neat PLA. Accordingly, the increased Xc of the other PLA/PPeel biocomposites containing 125–250 μm or 315–500 μm particles may have contributed to the significantly lower elongation at break values of these samples.
4.6. Water Vapor Transmission Rate
The absolute WVTR values of 1.5 mm-thick specimens were all < 1 g/m2 d, which is close to the measurement limit (1 g/m2 d or 0.5 g/m2 d upon long testing time) of the gravimetric method according to DIN 53122-1 [46]. Gravimetric measurement of WVTRs of injection-molded specimens according to the method described above (see Section 2.3.7) revealed several obstacles. First, due to the small size of the circular specimens (35 mm in diameter), specimens needed to be masked with impermeable self-adhesive aluminum foil to fit the testing cup (50 cm2 testing area). Masking of specimens to enable permeability measurements, however, reduced the permeation area of specimens to approx. 18 cm2 and increased the likelihood of transverse diffusion. Second, the thickness of the specimens (1.5 mm) hindered fast permeation through the specimen. The combination of the small test area and the high sample thickness increased the measurement time until the equilibrium was reached. One possibility to overcome these challenges in future studies is to flatten out the injection-molded specimen using a hot press; however, this also bears some challenges, such as the change in structure through the pressure.
Probably due to the difficulties of WVTR measurement regarding injection-molded specimens, other studies have investigated the influence of PPeel filler concentration on specimen water absorption [33,34,36], which also resulted in a gravimetric increase due to the hygroscopic filler [80]. In these studies, water absorption increased with increasing PPeel concentration [33,34,36]. This was, however, not the objective of the present study, which focused on the effect of different PPeel size classes and not PPeel concentration.
5. Conclusions
In this study, different classes of potato peel powder (0–53 μm, 125–250 μm, 315–500 μm) were incorporated into PLA matrix via compounding and injection-molding in order to investigate the influence of particle size on physical properties of the biocomposites. Due to residual water content within the PPeel filler, PLA–PPeel biocomposite showed foaming and partial degradation during injection-molding, resulting in the necessity of short processing times. FTIR and DSC measurements suggested that there were some polymer–filler interactions, although no clear conclusion can be drawn when taking the results from the tensile testing and WVTR measurements into account. Therefore, further thermal and thermomechanical properties of PPeel/PLA biocomposites as well as their intermolecular interactions should be investigated via thermogravimetric analysis, dynamic mechanical analysis, melt flow index, and molecular weight measurements in future studies.
The particle size of PPeel filler particles significantly influenced the mechanical properties especially the stiffness of the injection-molded specimens which could be attributed to hindering effects of the PLA polymer matrix through incorporated bigger filler particles. The loss of free movement in the PLA polymer was suggested to result in reduced flexibility and thus increased stiffness. In summary, the size of PPeel filler class is important not only for mechanical properties but also to the overall appearance of biocomposites. Small PPeel particles resulted in a homogeneous appearance of injection-molded specimens, whereas bigger particles within the biocomposite were clearly visible as particles. In addition, particles of the smaller PPeel class tended to affect mechanical and WVTR properties less than those of the bigger classes. This means that for the development of biocomposites using natural filler material, the particle size should be carefully considered dependent on the application.
Overall, the incorporation of PPeel in PLA composites represents a promising way to incorporate into bio-based packaging materials such as PLA material that is minorly competitive with foodstuff, cheap, and a bio-based side stream product. With this approach, composites may be formulated that provide sufficient protection for the packaged good, enhance biodegradability, and decreased costs, leading to more marketable composites for packaging applications.
Supplementary Materials
The following supporting information can be downloaded at: https://www.mdpi.com/article/10.3390/compounds4010006/s1, Figure S1. Averaged ATR-FTIR spectra of different potato peel particle sizes: (a) 0–53 μm, (b) 125–250 μm, and (c) 315–500 μm. Figure S2. Averaged ATR-FTIR spectra of the surface of neat PLA specimens and PLA–PPeel biocomposite specimens containing different potato peel particle sizes. (a) neat PLA, (b) PLA–PPeel biocomposite (0–53 μm), (c) PLA–PPeel biocomposite (125–250 μm), and (d) PLA–PPeel biocomposite (315–500 μm). Figure S3. Averaged ATR-FTIR spectra of cross-sectional area of PLA–PPeel biocomposite specimens containing different potato peel particle sizes: (a) 0–53 μm, (b) 125–250 μm, and (c) 315–500 μm.
Author Contributions
K.M. performed experiments, conducted the literature search, and drafted the manuscript. C.L.R. supported in experimental design and analysis of the results and edited and reviewed the manuscript. M.L. and M.S. reviewed and edited the manuscript upon critical revision of the text. All authors have read and agreed to the published version of the manuscript.
Funding
Parts of this work were financially supported by the Heinrich-Stockmeyer Stiftung as part of a PhD scholarship (scholarship holder: Katharina Miller).
Data Availability Statement
The original contributions presented in the study are included in the article/Supplementary Material, further inquiries can be directed to the first author Katharina Miller.
Acknowledgments
The authors would like to thank Manuel Hogg for his technical support in the conduction of the specimen production as well as Pieter De Wever for his support regarding the ATR-FTIR measurements.
Conflicts of Interest
The authors declare no conflicts of interest. The funders had no role in the design of the study; in the collection, analyses, or interpretation of data; in the writing of the manuscript; or in the decision to publish the results.
References
- Balla, E.; Daniilidis, V.; Karlioti, G.; Kalamas, T.; Stefanidou, M.; Bikiaris, N.D.; Vlachopoulos, A.; Koumentakou, I.; Bikiaris, D.N. Poly(lactic Acid): A versatile biobased polymer for the future with multifunctional properties-From monomer synthesis, polymerization techniques and molecular weight increase to PLA applications. Polymers 2021, 13, 1822. [Google Scholar] [CrossRef] [PubMed]
- Nova-Institute. Global Production Capacities of Bioplastics 2027: (By Material Type). Available online: https://www.european-bioplastics.org/market/#iLightbox[gallery_image_1]/1 (accessed on 19 July 2023).
- Rodríguez-Núñez, J.R.; Madera-Santana, T.J.; Burrola-Núñez, H.; Martínez-Encinas, E.G. Composite materials based on PLA and its applications in food packaging. In Composites Materials for Food Packaging; First published; Cirillo, G., Spizzirri, U.G., Kozlowski, M.A., Eds.; Scrivener Publishing LLC.: Beverly, MA, USA; John Wiley & Sons Inc.: Hoboken, NJ, USA, 2018; pp. 355–399. ISBN 9781119160205. [Google Scholar]
- Li, X.; Lin, Y.; Liu, M.; Meng, L.; Li, C. A review of research and application of polylactic acid composites. J. Appl. Polym. Sci. 2023, 140, e53477. [Google Scholar] [CrossRef]
- Mann, G.S.; Singh, L.P.; Kumar, P.; Singh, S. Green composites: A review of processing technologies and recent applications. J. Thermoplast. Compos. Mater. 2020, 33, 1145–1171. [Google Scholar] [CrossRef]
- Rajeshkumar, G.; Seshadri, S.A.; Devnani, G.L.; Sanjay, M.R.; Siengchin, S.; Maran, J.P.; Al-Dhabi, N.A.; Karuppiah, P.; Mariadhas, V.A.; Sivarajasekar, N.; et al. Environment friendly, renewable and sustainable poly lactic acid (PLA) based natural fiber reinforced composites—A comprehensive review. J. Clean. Prod. 2021, 310, 127483. [Google Scholar] [CrossRef]
- Nandiyanto, A.B.D.; Hofifah, S.N.; Girsang, G.C.S.; Putri, S.R.; Budiman, B.A.; Triawan, F.; Al-Obaidi, A.S.M. The effects of rice husk particles size as a reinforcement component on resin-based brake pad Pperformance: From literature review on the use of agricultural waste as a reinforcement material, chemical polymerization reaction of epoxy resin, to experiments. Automot. Exp. 2021, 4, 68–82. [Google Scholar] [CrossRef]
- Battegazzore, D.; Noori, A.; Frache, A. Natural wastes as particle filler for poly(lactic acid)-based composites. J. Compos. Mater. 2019, 53, 783–797. [Google Scholar] [CrossRef]
- Bajwa, D.; Eichers, M.; Shojaeiarani, J.; Kallmeyer, A. Influence of biobased plasticizers on 3D printed polylactic acid composites filled with sustainable biofiller. Ind. Crops Prod. 2021, 173, 114132. [Google Scholar] [CrossRef]
- Palaniyappan, S.; Veeman, D.; Sivakumar, N.K.; Natrayan, L. Development and optimization of lattice structure on the walnut shell reinforced PLA composite for the tensile strength and dimensional error properties. Structures 2022, 45, 163–178. [Google Scholar] [CrossRef]
- Chun, K.S.; Husseinsyah, S.; Osman, H. Mechanical and thermal properties of coconut shell powder filled polylactic acid biocomposites: Effects of the filler content and silane coupling agent. J. Polym. Res. 2012, 19, 9859. [Google Scholar] [CrossRef]
- Battegazzore, D.; Bocchini, S.; Alongi, J.; Frache, A. Plasticizers, antioxidants and reinforcement fillers from hazelnut skin and cocoa by-products: Extraction and use in PLA and PP. Polym. Degrad. Stab. 2014, 108, 297–306. [Google Scholar] [CrossRef]
- Gigante, V.; Cinelli, P.; Righetti, M.C.; Sandroni, M.; Tognotti, L.; Seggiani, M.; Lazzeri, A. Evaluation of mussel shells powder as reinforcement for PLA-based biocomposites. Int. J. Mol. Sci. 2020, 21, 5364. [Google Scholar] [CrossRef]
- Kim, K.-W.; Lee, B.-H.; Kim, H.-J.; Sriroth, K.; Dorgan, J.R. Thermal and mechanical properties of cassava and pineapple flours-filled PLA bio-composites. J. Therm. Anal. Calorim. 2012, 108, 1131–1139. [Google Scholar] [CrossRef]
- Baek, B.-S.; Park, J.-W.; Lee, B.-H.; Kim, H.-J. Development and application of green composites: Using coffee ground and bamboo flour. J. Polym. Environ. 2013, 21, 702–709. [Google Scholar] [CrossRef]
- Battegazzore, D.; Alongi, J.; Frache, A. Poly(lactic acid)-based composites containing natural fillers: Thermal, mechanical and barrier properties. J. Polym. Environ. 2014, 22, 88–98. [Google Scholar] [CrossRef]
- Petinakis, E.; Liu, X.; Yu, L.; Way, C.; Sangwan, P.; Dean, K.; Bateman, S.; Edward, G. Biodegradation and thermal decomposition of poly(lactic acid)-based materials reinforced by hydrophilic fillers. Polym. Degrad. Stab. 2010, 95, 1704–1707. [Google Scholar] [CrossRef]
- Sudamrao Getme, A.; Patel, B. A Review: Bio-fiber’s as reinforcement in composites of polylactic acid (PLA). Mater. Today Proc. 2020, 26, 2116–2122. [Google Scholar] [CrossRef]
- Formela, K.; Zedler, Ł.; Hejna, A.; Tercjak, A. Reactive extrusion of bio-based polymer blends and composites—Current trends and future developments. EXPRESS Polym. Lett. 2018, 12, 24–57. [Google Scholar] [CrossRef]
- Makri, S.P.; Xanthopoulou, E.; Klonos, P.A.; Grigoropoulos, A.; Kyritsis, A.; Tsachouridis, K.; Bikiaris, D.N.; Anastasiou, A.; Deligkiozi, I.; Nikolaidis, N. Effect of micro- and nano-lignin on the thermal, mechanical, and antioxidant properties of biobased PLA–lignin composite films. Polymers 2022, 14, 5274. [Google Scholar] [CrossRef] [PubMed]
- Bundesanstalt für Landwirtschaft und Ernährung. Bericht zur Markt- und Versorgungslage Kartoffeln; Bundesanstalt für Landwirtschaft und Ernährung: Bonn, Germany, 2020. [Google Scholar]
- Miller, K.; Reichert, C.L.; Schmid, M.; Loeffler, M. Physical, chemical and biochemical modification approaches of potato (peel) constituents for bio-based food packaging concepts: A review. Foods 2022, 11, 2927. [Google Scholar] [CrossRef]
- Willersinn, C.; Mack, G.; Mouron, P.; Keiser, A.; Siegrist, M. Quantity and quality of food losses along the Swiss potato supply chain: Stepwise investigation and the influence of quality standards on losses. Waste Manag. 2015, 46, 120–132. [Google Scholar] [CrossRef]
- Dey, T.; Bhattacharjee, T.; Nag, P.; Ritika; Ghati, A.; Kuila, A. Valorization of agro-waste into value added products for sustainable development. Bioresour. Technol. 2021, 16, 100834. [Google Scholar] [CrossRef]
- Khanal, S.; Karimi, K.; Majumdar, S.; Kumar, V.; Verma, R.; Bhatia, S.K.; Kuca, K.; Esteban, J.; Kumar, D. Sustainable utilization and valorization of potato waste: State of the art, challenges, and perspectives. Biomass Convers. Biorefin. 2023. [Google Scholar] [CrossRef]
- Borah, P.P.; Das, P.; Badwaik, L.S. Ultrasound treated potato peel and sweet lime pomace based biopolymer film development. Ultrason. Sonochem. 2017, 36, 11–19. [Google Scholar] [CrossRef]
- Kang, H.J.; Min, S.C. Potato peel-based biopolymer film development using high-pressure homogenization, irradiation, and ultrasound. LWT 2010, 43, 903–909. [Google Scholar] [CrossRef]
- Kang, H.J.; Won, M.Y.; Lee, S.J.; Min, S.C. Plasticization and moisture sensitivity of potato peel-based biopolymer films. Food Sci. Biotechnol. 2015, 24, 1703–1710. [Google Scholar] [CrossRef]
- Miller, K.; Silcher, C.; Lindner, M.; Schmid, M. Effects of glycerol and sorbitol on optical, mechanical, and gas barrier properties of potato peel-based films. Packag. Technol. Sci. 2021, 34, 11–23. [Google Scholar] [CrossRef]
- Rommi, K.; Rahikainen, J.; Vartiainen, J.; Holopainen, U.; Lahtinen, P.; Honkapää, K.; Lantto, R. Potato peeling costreams as raw materials for biopolymer film preparation. J. Appl. Polym. Sci. 2016, 133. [Google Scholar] [CrossRef]
- Merino, D.; Paul, U.C.; Athanassiou, A. Bio-based plastic films prepared from potato peels using mild acid hydrolysis followed by plasticization with a polyglycerol. Food Packag. Shelf Life 2021, 29, 100707. [Google Scholar] [CrossRef]
- Othman, S.H.; Edwal, S.m.M.; Risyon, N.P.; Basha, R.K.; Talib, R. Water sorption and water permeability properties of edible film made from potato peel waste. Food Sci. Technol. 2017, 37, 63–70. [Google Scholar] [CrossRef]
- Sugumaran, V.; Kapur, G.S.; Narula, A.K. Sustainable potato peel powder–LLDPE biocomposite preparation and effect of maleic anhydride-grafted polyolefins on their properties. Polym. Bull. 2018, 75, 5513–5533. [Google Scholar] [CrossRef]
- Sugumaran, V.; Vimal, K.V.; Kapur, G.S.; Narula, A.K. Preparation and morphological, thermal, and physicomechanical properties of polypropylenepotato peel biocomposites. J. Appl. Polym. Sci. 2015, 132. [Google Scholar] [CrossRef]
- Sugumaran, V.; Bhunia, H.; Narula, A.K. Evaluation of biodegradability of potato peel powder based polyolefin biocomposites. J. Polym. Environ. 2018, 26, 2049–2060. [Google Scholar] [CrossRef]
- Patil, A.Y.; Banapurmath, N.R.; Yaradoddi, J.S.; Kotturshettar, B.B.; Shettar, A.S.; Basavaraj, G.D.; Keshavamurthy, R.; Yunus Khan, T.M.; Mathad, S.N. Experimental and simulation studies on waste vegetable peels as bio-composite fillers for light duty applications. Arab. J. Sci. Eng. 2019, 44, 7895–7907. [Google Scholar] [CrossRef]
- Schmid, M.; Herbst, C.; Müller, K.; Stäbler, A.; Schlemmer, D.; Coltelli, M.-B.; Lazzeri, A. Effect of potato pulp filler on the mechanical properties and water vapour transmission rate of thermoplastic WPI/PBS blends. Polym. Plast. Technol. Eng. 2016, 55, 510–517. [Google Scholar] [CrossRef]
- Suaduang, N.; Ross, S.; Ross, G.M.; Pratumshat, S.; Mahasaranon, S. Effect of spent coffee grounds filler on the physical and mechanical properties of poly(lactic acid) bio-composite films. Mater. Today Proc. 2019, 17, 2104–2110. [Google Scholar] [CrossRef]
- Fu, S.Y.; Feng, X.Q.; Lauke, B.; Mai, Y.W. Effects of particle size, particle/matrix interface adhesion and particle loading on mechanical properties of particulate–polymer composites. Compos. Part B Eng. 2008, 39, 933–961. [Google Scholar] [CrossRef]
- Andrzejewski, J.; Krawczak, A.; Wesoły, K.; Szostak, M. Rotational molding of biocomposites with addition of buckwheat husk filler. Structure-property correlation assessment for materials based on polyethylene (PE) and poly(lactic acid) PLA. Compos. Part B Eng. 2020, 202, 108410. [Google Scholar] [CrossRef]
- Bulota, M.; Budtova, T. PLA/algae composites: Morphology and mechanical properties. Compos. Part A Appl. Sci. Manuf. 2015, 73, 109–115. [Google Scholar] [CrossRef]
- Merkus, H.G. Particle Size Measurements: Fundamentals, Practice, Quality; Springer Science + Business Media B.V.: Dordrecht, The Netherlands, 2009; ISBN 978-1-4020-9015-8. [Google Scholar]
- DIN ISO, 9276-6; Darstellung der Ergebnisse von Partikelgrößenanalysen–Teil 6. Deutsches Institut für Normung e.V., Beuth Verlag GmbH: Berlin, Germany, 2012.
- Barczewski, M.; Hejna, A.; Aniśko, J.; Andrzejewski, J.; Piasecki, A.; Mysiukiewicz, O.; Bąk, M.; Gapiński, B.; Ortega, Z. Rotational molding of polylactide (PLA) composites filled with copper slag as a waste filler from metallurgical industry. Polym. Test. 2022, 106, 107449. [Google Scholar] [CrossRef]
- DIN EN ISO 527-1; Kunststoffe-Bestimmung der Zugeigenschaften: Teil 1: Allgemeine Grundsätze. Deutsches Institut für Normung e.V., Beuth Verlag GmbH: Berlin, Germany, 2012.
- DIN 53122-1; Kunststoffe-Bestimmung der Wasserdampfdurchlässigkeit: Teil 1: Gravimetrisches Verfahren. Deutsches Institut für Normung e.V., Beuth Verlag GmbH: Berlin, Germany, 2001.
- Jasmee, S.; Omar, G.; Othaman, S.S.C.; Masripan, N.A.; Hamid, H.A. Interface thermal resistance and thermal conductivity of polymer composites at different types, shapes, and sizes of fillers: A review. Polym. Compos. 2021, 42, 2629–2652. [Google Scholar] [CrossRef]
- Merkus, H.G.; Cirillo, G.; Kozlowski, M.A.; Spizzirri, U.G. Dispersion of Powders in Air and in Liquids. In Particle Size Measurements; Springer: Dordrecht, The Netherlands; John Wiley & Sons: Hoboken, NJ, USA, 2009; pp. 117–136. ISBN 9781119160205. [Google Scholar]
- Carter, R.M.; Yan, Y. Measurement of particle shape using digital imaging techniques. J. Phys. Conf. Ser. 2005, 15, 177–182. [Google Scholar] [CrossRef]
- Akindoyo, J.O.; Beg, M.D.; Ghazali, S.; Heim, H.P.; Feldmann, M. Impact modified PLA-hydroxyapatite composites—Thermo-mechanical properties. Compos. Part A Appl. Sci. Manuf. 2018, 107, 326–333. [Google Scholar] [CrossRef]
- Hassan, M.M.; Koyama, K. Thermomechanical and viscoelastic properties of green composites of PLA using chitin micro-particles as fillers. J. Polym. Res. 2020, 27, 27. [Google Scholar] [CrossRef]
- Pozo, C.; Rodríguez-Llamazares, S.; Bouza, R.; Barral, L.; Castaño, J.; Müller, N.; Restrepo, I. Study of the structural order of native starch granules using combined FTIR and XRD analysis. J. Polym. Res. 2018, 25, 266. [Google Scholar] [CrossRef]
- Derkacheva, O.; Sukhov, D. Investigation of lignins by FTIR spectroscopy. Macromol. Symp. 2008, 265, 61–68. [Google Scholar] [CrossRef]
- Hussain, M.; Qayum, A.; Zhang, X.; Hao, X.; Liu, L.; Wang, Y.; Hussain, K.; Li, X. Improvement in bioactive, functional, structural and digestibility of potato protein and its fraction patatin via ultra-sonication. LWT 2021, 148, 111747. [Google Scholar] [CrossRef]
- Singh, A.A.; Sharma, S.; Srivastava, M.; Majumdar, A. Modulating the properties of polylactic acid for packaging applications using biobased plasticizers and naturally obtained fillers. Int. J. Biol. Macromol. 2020, 153, 1165–1175. [Google Scholar] [CrossRef]
- Lee, D.S.; Yam, K.L.; Piergiovanni, L. Food Packaging Science and Technology; CRC Press: Hoboken, NJ, USA, 2008; ISBN 9781439894071. [Google Scholar]
- Matissek, R. Lebensmittelsicherheit; Springer: Berlin/Heidelberg, Germany, 2020; ISBN 978-3-662-61898-1. [Google Scholar]
- Nofar, M.; Sacligil, D.; Carreau, P.J.; Kamal, M.R.; Heuzey, M.-C. Poly (lactic acid) blends: Processing, properties and applications. Int. J. Biol. Macromol. 2019, 125, 307–360. [Google Scholar] [CrossRef]
- Di Lorenzo, M.L.; Androsch, R. Synthesis, Structure and Properties of Poly(Lactic Acid); Springer International Publishing: Cham, Switzerland, 2018; ISBN 978-3-319-64229-1. [Google Scholar]
- Le Marec, P.E.; Ferry, L.; Quantin, J.-C.; Bénézet, J.-C.; Bonfils, F.; Guilbert, S.; Bergeret, A. Influence of melt processing conditions on poly(lactic acid) degradation: Molar mass distribution and crystallization. Polym. Degrad. Stab. 2014, 110, 353–363. [Google Scholar] [CrossRef]
- Signori, F.; Coltelli, M.-B.; Bronco, S. Thermal degradation of poly(lactic acid) (PLA) and poly(butylene adipate-co-terephthalate) (PBAT) and their blends upon melt processing. Polym. Degrad. Stab. 2009, 94, 74–82. [Google Scholar] [CrossRef]
- Di Lorenzo, M.L.; Androsch, R. Industrial Applications of Poly(Lactic Acid); Springer International Publishing: Cham, Switzerland, 2018; ISBN 978-3-319-75458-1. [Google Scholar]
- Xu, R. Light scattering: A review of particle characterization applications. Particuology 2015, 18, 11–21. [Google Scholar] [CrossRef]
- Janaka, G.H.A.; Kumara, J.; Hayano, K.; Ogiwara, K. Image analysis techniques on evaluation of particle size distribution of gravel. GEOMATE J. 2012, 3, 290–297. [Google Scholar]
- Samal, S. Effect of shape and size of filler particle on the aggregation and sedimentation behavior of the polymer composite. Powder Technol. 2020, 366, 43–51. [Google Scholar] [CrossRef]
- Aworinde, A.K.; Adeosun, S.O.; Oyawale, F.A.; Akinlabi, E.T.; Akinlabi, S.A. Comparative effects of organic and inorganic bio-fillers on the hydrophobicity of polylactic acid. Results Eng. 2020, 5, 100098. [Google Scholar] [CrossRef]
- Beauson, J.; Schillani, G.; van der Schueren, L.; Goutianos, S. The effect of processing conditions and polymer crystallinity on the mechanical properties of unidirectional self-reinforced PLA composites. Compos. Part A Appl. Sci. Manuf. 2022, 152, 106668. [Google Scholar] [CrossRef]
- Anwer, M.A.; Naguib, H.E.; Celzard, A.; Fierro, V. Comparison of the thermal, dynamic mechanical and morphological properties of PLA-Lignin & PLA-Tannin particulate green composites. Compos. Part B Eng. 2015, 82, 92–99. [Google Scholar]
- Echeverría, C.; Limón, I.; Muñoz-Bonilla, A.; Fernández-García, M.; López, D. Development of highly crystalline polylactic acid with -crystalline phase from the Induced alignment of electrospun fibers. Polymers 2021, 13, 2860. [Google Scholar] [CrossRef] [PubMed]
- Spiridon, I.; Leluk, K.; Resmerita, A.M.; Darie, R.N. Evaluation of PLA–lignin bioplastics properties before and after accelerated weathering. Compos. Part B Eng. 2015, 69, 342–349. [Google Scholar] [CrossRef]
- Gao, Y.; Picot, O.T.; Bilotti, E.; Peijs, T. Influence of filler size on the properties of poly(lactic acid) (PLA)/graphene nanoplatelet (GNP) nanocomposites. Eur. Polym. J. 2017, 86, 117–131. [Google Scholar] [CrossRef]
- Zhu, Z.H.; Zhang, N.; Wang, T.; Hao, M.Y. Analysis of crystallization and melting behavior of composites before and after annealing. IOP Conf. Ser. Mater. Sci. Eng. 2020, 733, 12025. [Google Scholar] [CrossRef]
- Kumar, A.; Tumu, V.R. Physicochemical properties of the electron beam irradiated bamboo powder and its bio-composites with PLA. Compos. Part B Eng. 2019, 175, 107098. [Google Scholar] [CrossRef]
- Elsawy, M.A.; Kim, K.-H.; Park, J.-W.; Deep, A. Hydrolytic degradation of polylactic acid (PLA) and its composites. Renew. Sustain. Energy Rev. 2017, 79, 1346–1352. [Google Scholar] [CrossRef]
- Onuoha, C.; Onyemaobi, O.O.; Anyakwo, C.N.; Onuegbu, G.C. Effect of filler loading and particle size on the mechanical properties of periwinklw shell-filled recycled polypropylene Composites. Am. J. Eng. Res. 2017, 6, 72–79. [Google Scholar]
- Móczó, J.; Pukánszky, B. Particulate fillers in thermoplastics. Encyclopedia of Polymers and Composites; Springer: Berlin/Heidelberg, Germany, 2015; pp. 1–35. [Google Scholar]
- Patti, A.; Acierno, D.; Latteri, A.; Tosto, C.; Pergolizzi, E.; Recca, G.; Cristaudo, M.; Cicala, G. Influence of the processing conditions on the mechanical performance of sustainable bio-based PLA compounds. Polymers 2020, 12, 2197. [Google Scholar] [CrossRef] [PubMed]
- Nourbakhsh, A.; Karegarfard, A.; Ashori, A.; Nourbakhsh, A. Effects of particle size and coupling agent concentration on mechanical properties of particulate-filled polymer composites. J. Thermoplast. Compos. Mater. 2010, 23, 169–174. [Google Scholar] [CrossRef]
- Gosh, S.; Viana, J.C.; Reis, R.L.; Mano, J.F. Effect of processing conditions on morphology and mechanical properties of injection-molded poly(l-lactic acid). Polym. Eng. Sci. 2007, 47, 1141–1147. [Google Scholar] [CrossRef]
- Sahayaraj, F.A.; Muthukrishnan, M.; Ramesh, M. Experimental investigation on physical, mechanical, and thermal properties of jute and hemp fibers reinforced hybrid polylactic acid composites. Polym. Compos. 2022, 43, 2854–2863. [Google Scholar] [CrossRef]
Figure 1.
Images of PPeel powder classes: (a) 0–53 μm, (b) 125–250 μm, (c) 315–500 μm.
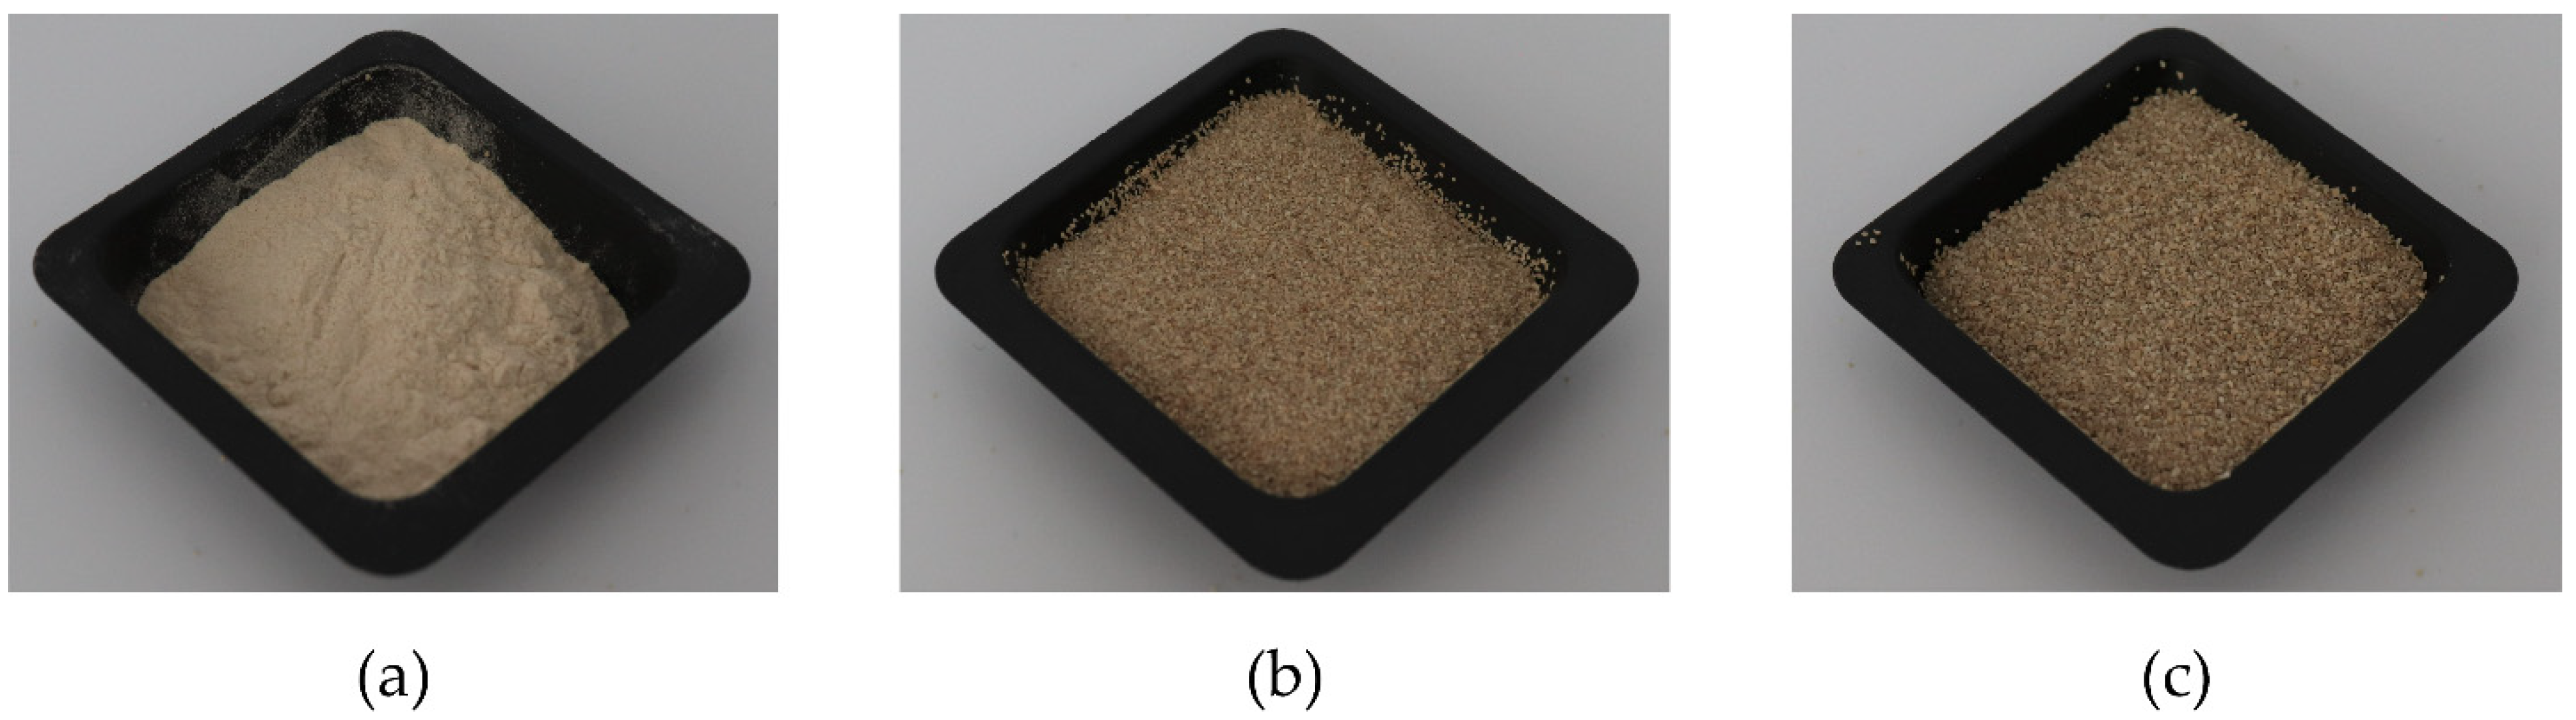
Figure 2.
Images of representative circular and dog bone specimens of (a) neat PLA and biocomposite specimens containing different particle size classes of PPeel powder (9:1 ratio PLA:PPeel): (b) 0–53 μm, (c) 125–250 μm, (d) 315–500 μm.
Figure 2.
Images of representative circular and dog bone specimens of (a) neat PLA and biocomposite specimens containing different particle size classes of PPeel powder (9:1 ratio PLA:PPeel): (b) 0–53 μm, (c) 125–250 μm, (d) 315–500 μm.
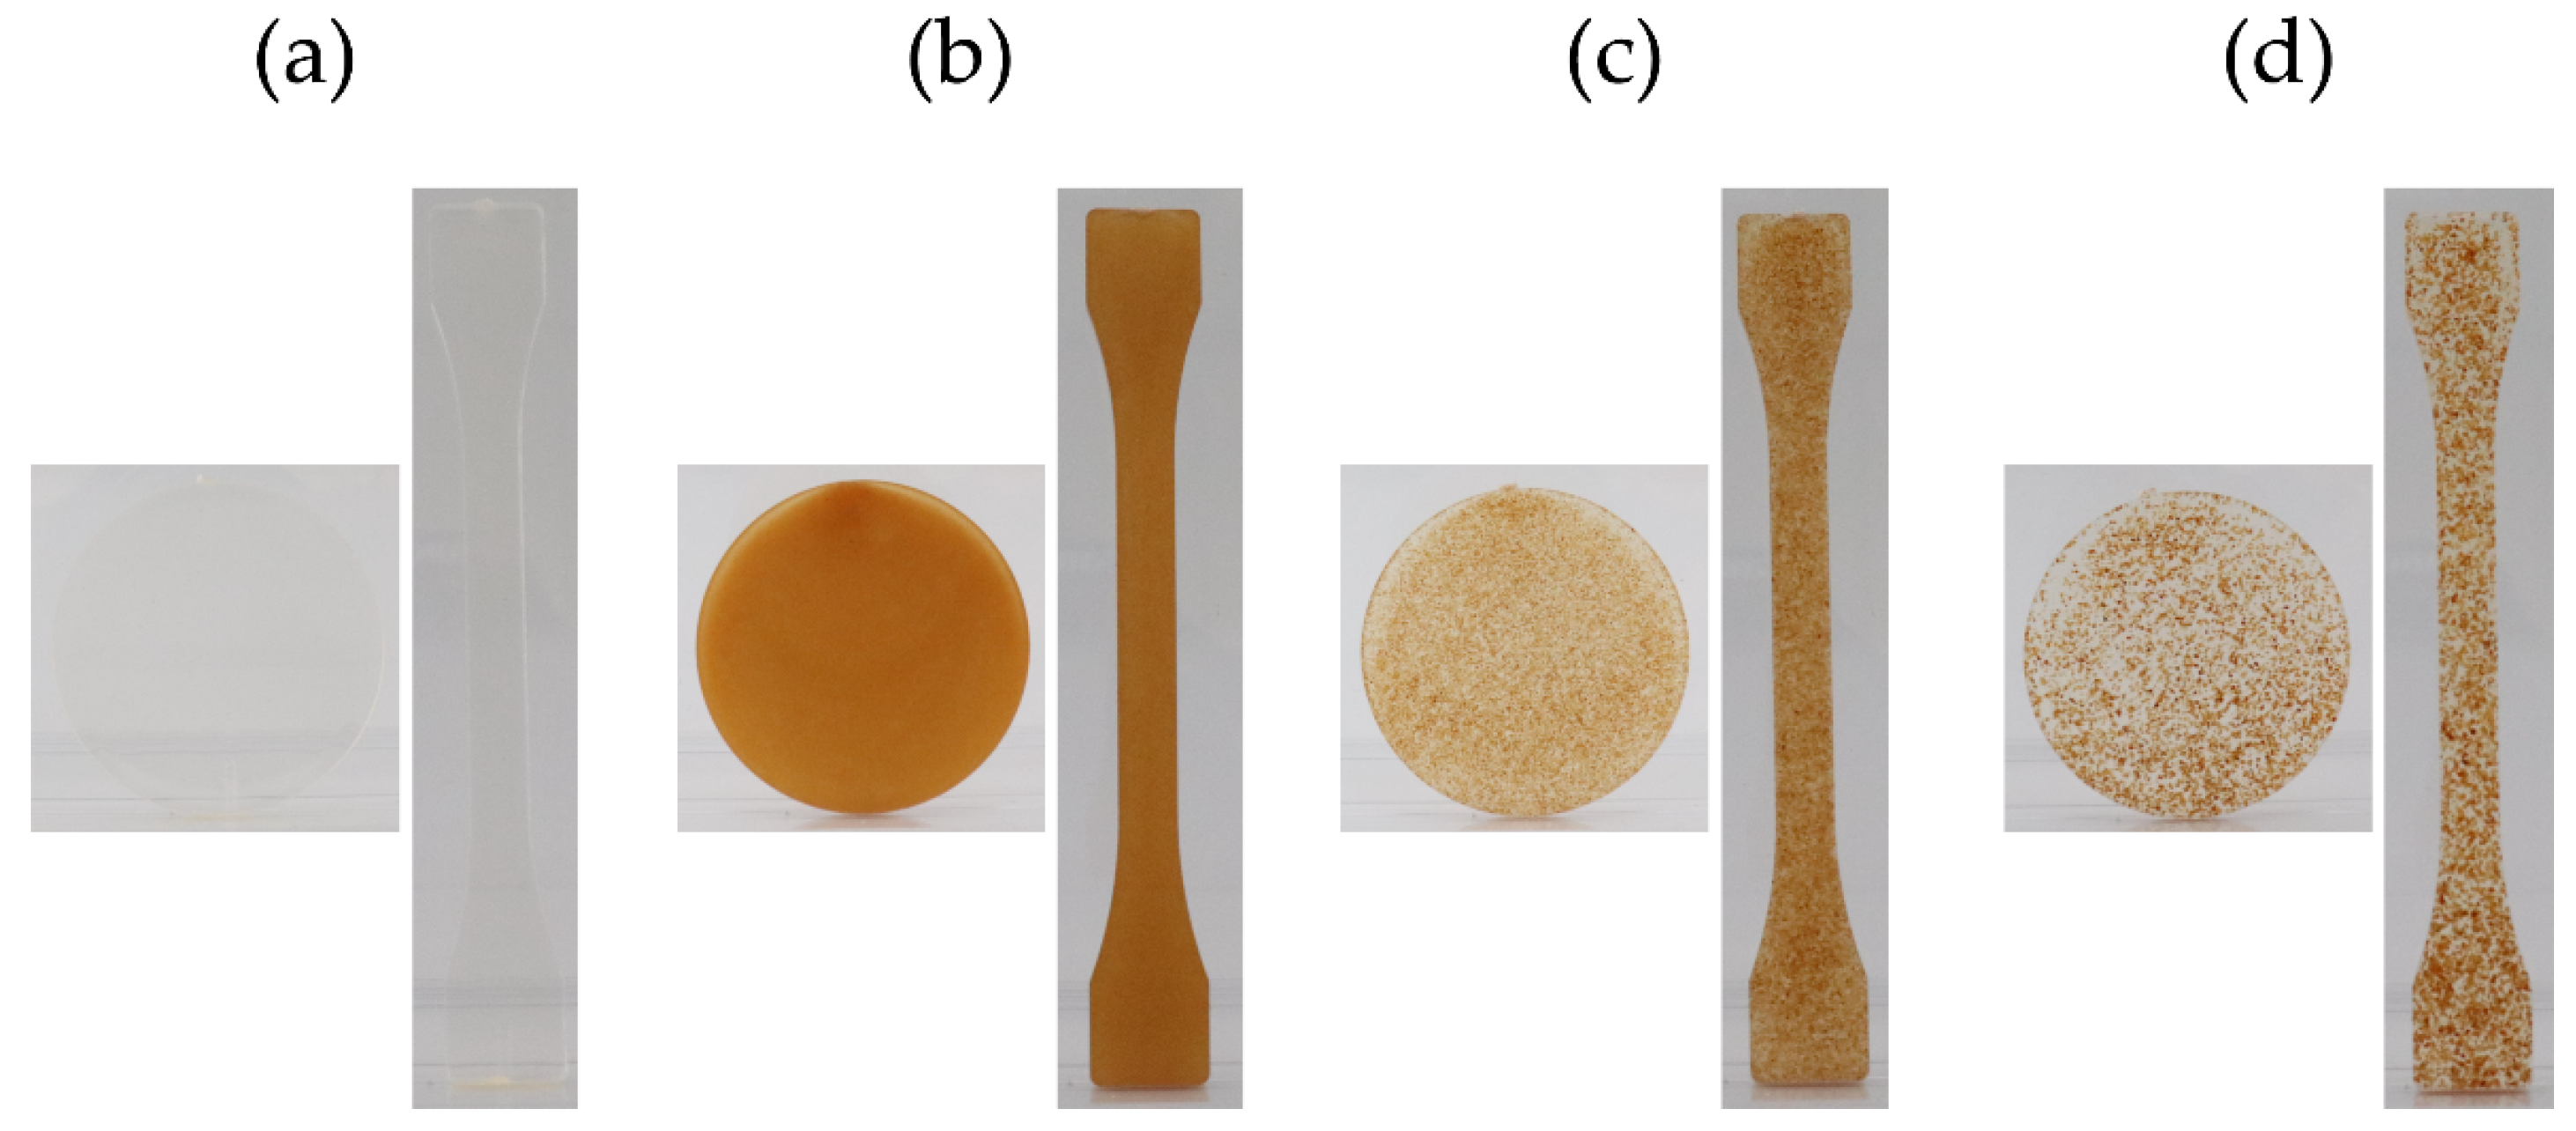
Figure 3.
Microscopic images of injection-molded specimens composed of (a) neat PLA, 400× magnification; (b) PLA–PPeel biocomposite with PPeel particles (0–53 μm), 200× magnification; (c) LA–PPeel biocomposite with PPeel particles (125–250 μm), 100× magnification; (d) PLA–PPeel biocomposite with PPeel particles (315–500 μm), 40× magnification. Length scales: (a) 10 μm, (b–d) 100 μm.
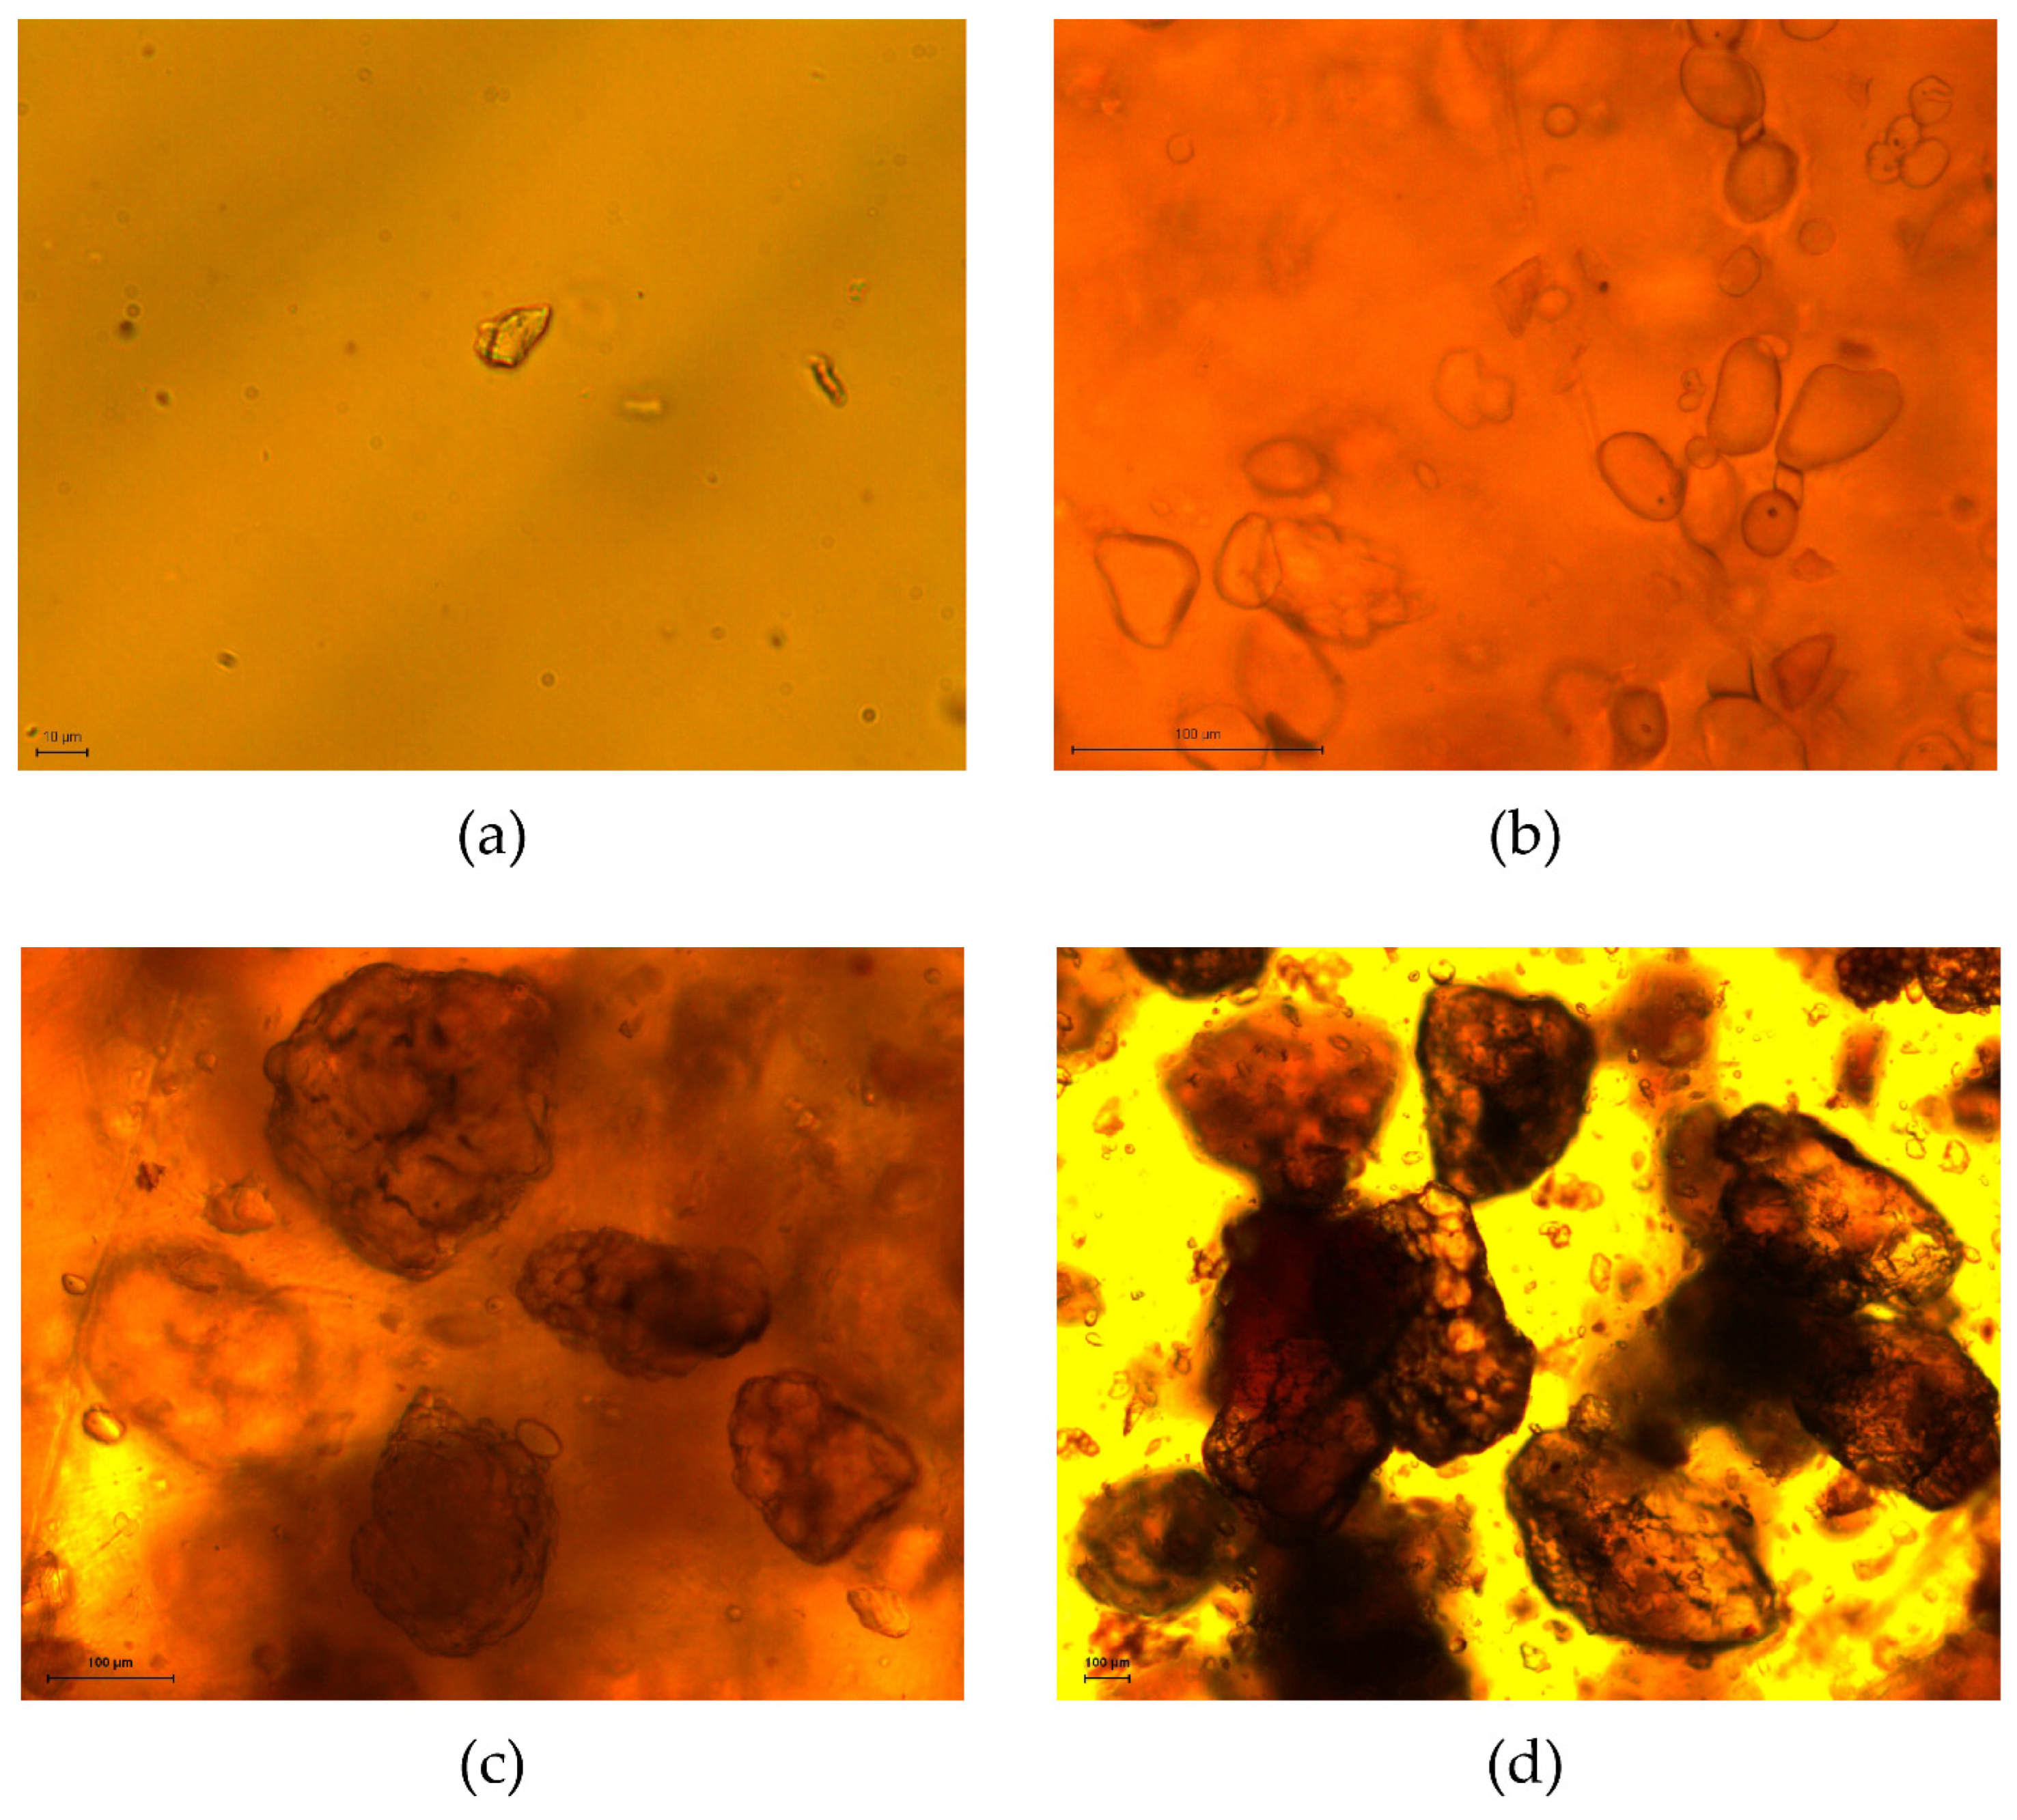
Figure 4.
Averaged ATR-FTIR spectra of (a) neat PLA specimen, (b) 0–53 μm PPeel particle powder, and (c) the cross-section of PLA–PPeel biocomposite specimen containing 0–53 μm PPeel powder.
Figure 4.
Averaged ATR-FTIR spectra of (a) neat PLA specimen, (b) 0–53 μm PPeel particle powder, and (c) the cross-section of PLA–PPeel biocomposite specimen containing 0–53 μm PPeel powder.
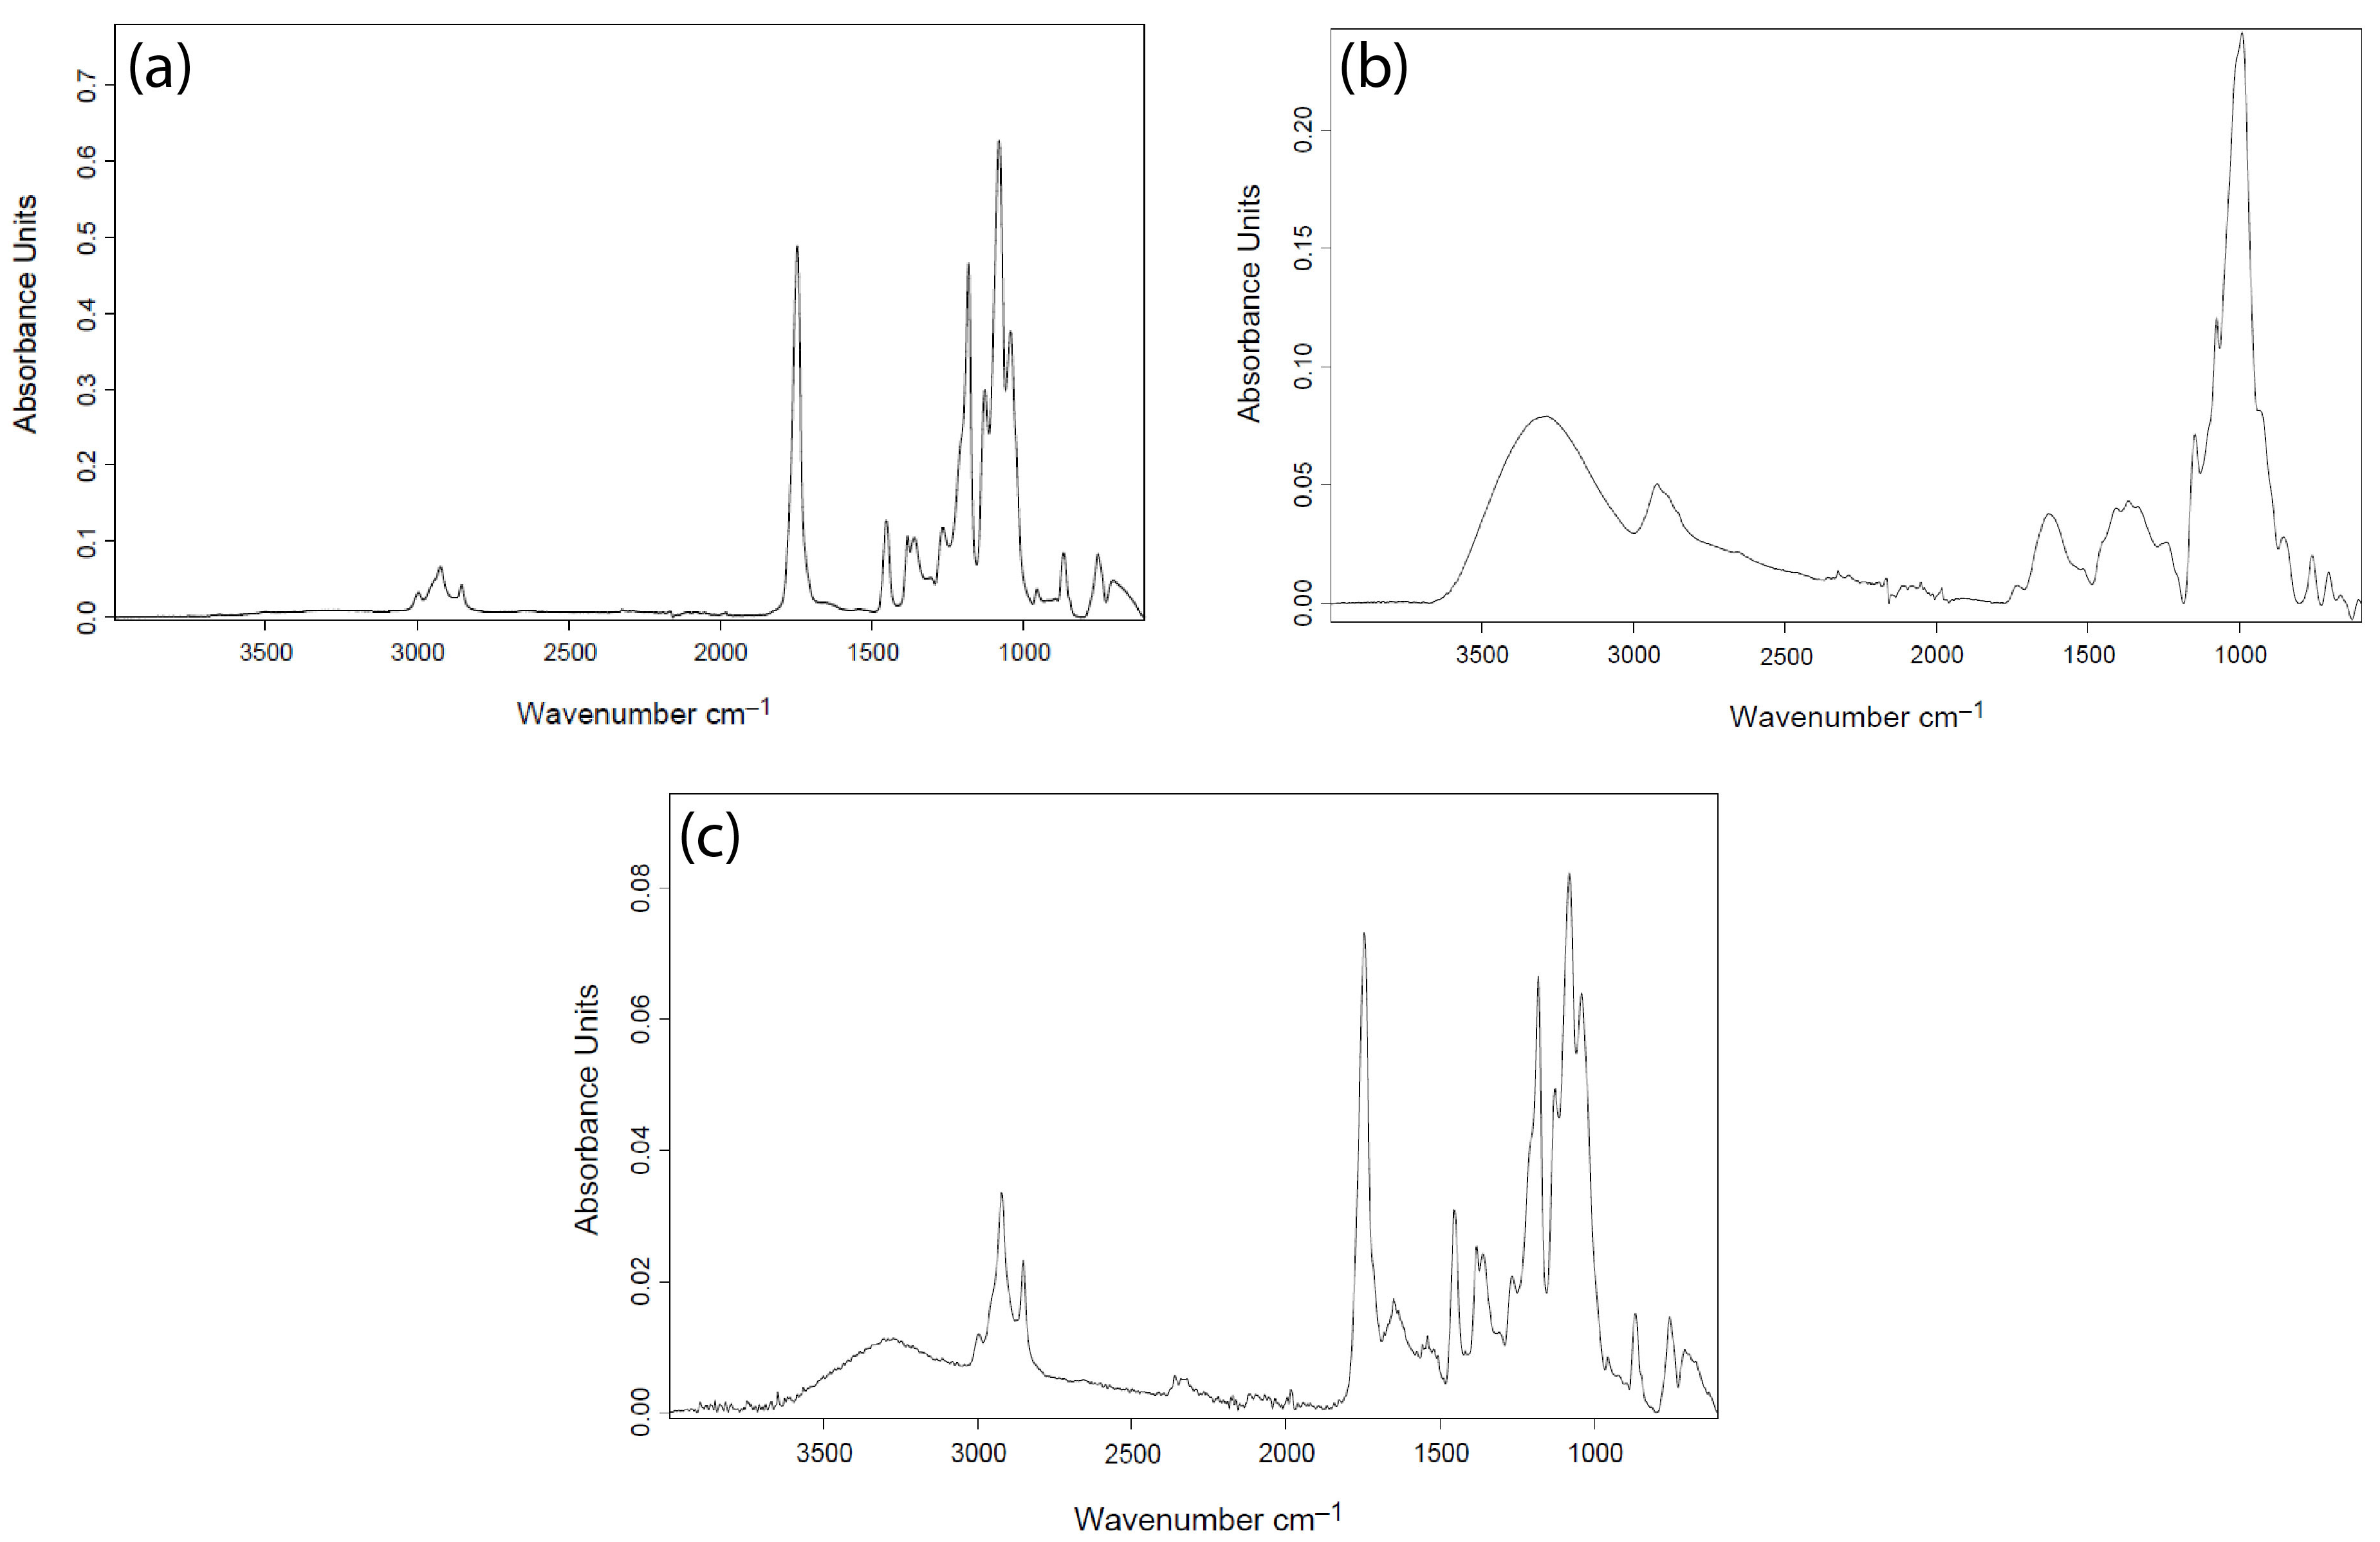
Figure 5.
Averaged DSC curves of the 2nd heating cycle of neat PLA specimen and PLA–PPeel biocomposite specimen containing different potato peel particle sizes: (a) neat PLA, (b) PLA–PPeel biocomposite (0–53 μm), (c) PLA–PPeel biocomposite (125–250 μm), and (d) PLA–PPeel biocomposite (315–500 μm).
Figure 5.
Averaged DSC curves of the 2nd heating cycle of neat PLA specimen and PLA–PPeel biocomposite specimen containing different potato peel particle sizes: (a) neat PLA, (b) PLA–PPeel biocomposite (0–53 μm), (c) PLA–PPeel biocomposite (125–250 μm), and (d) PLA–PPeel biocomposite (315–500 μm).
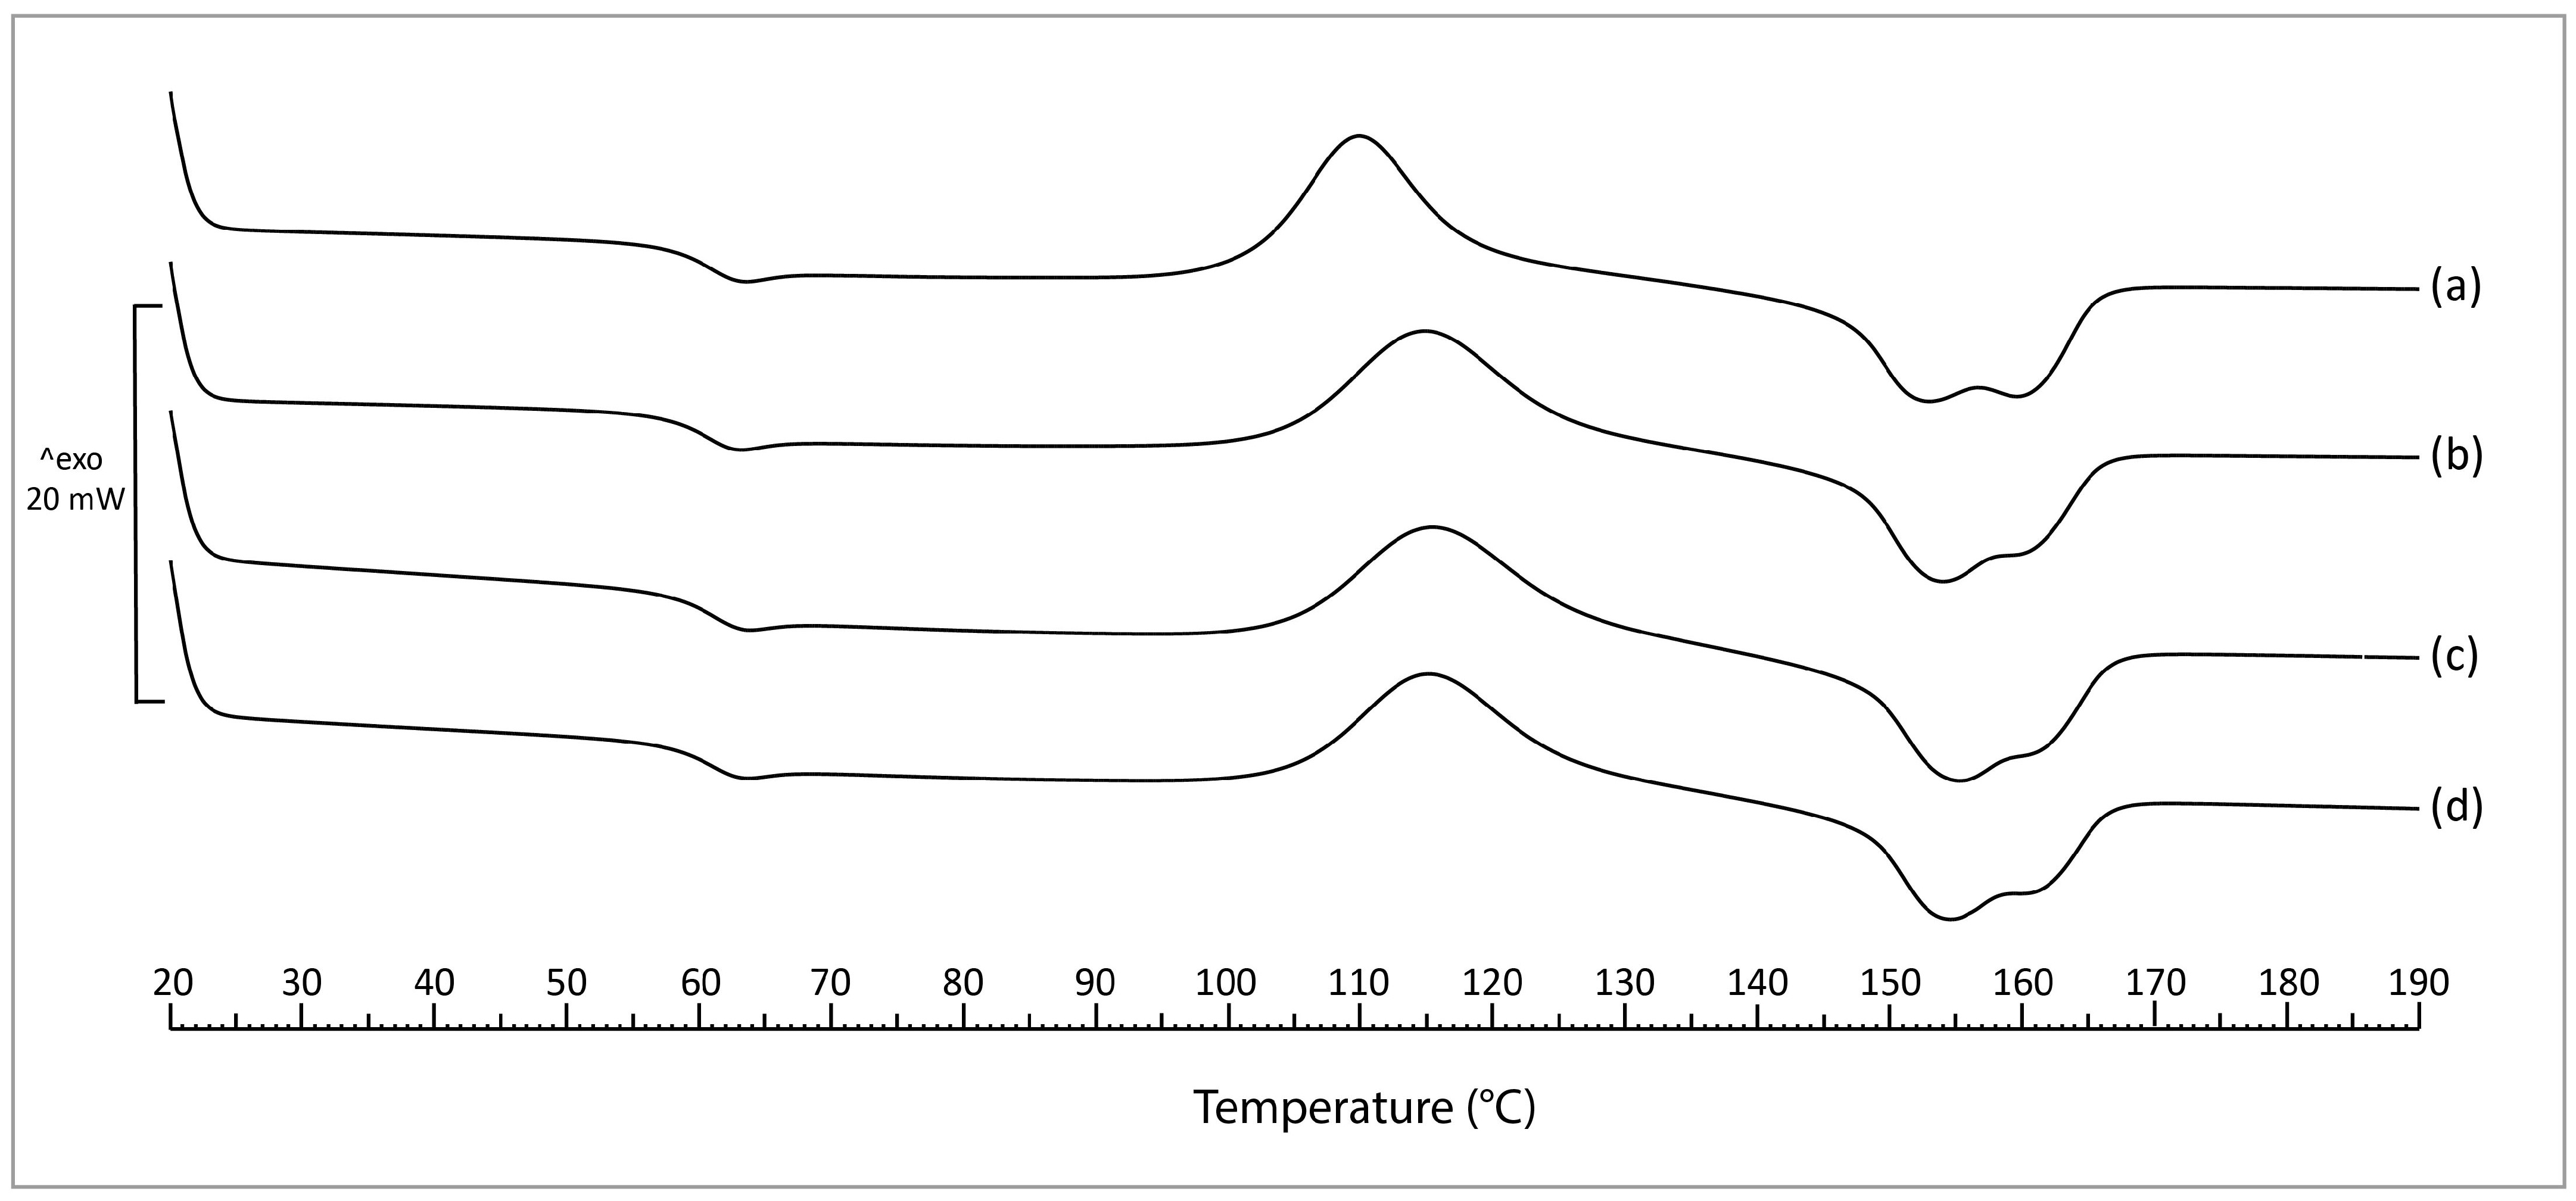
Figure 6.
Tensile properties of neat PLA and PLA–PPeel biocomposites prepared via injection-molding using different PPeel particle size classes. Significant differences (p ≤ 0.05) between mean values are represented by the use of different letters: A, B, C.
Figure 6.
Tensile properties of neat PLA and PLA–PPeel biocomposites prepared via injection-molding using different PPeel particle size classes. Significant differences (p ≤ 0.05) between mean values are represented by the use of different letters: A, B, C.

Figure 7.
Water vapor transmission rate of specimens containing different PPeel particle size classes. Significant differences (p ≤ 0.05) between mean values are represented by the use of different letters: A, B.
Figure 7.
Water vapor transmission rate of specimens containing different PPeel particle size classes. Significant differences (p ≤ 0.05) between mean values are represented by the use of different letters: A, B.

Table 1.
Applied processing conditions for specimen production.
| Pure PLA | PLA:Ppeel 0–53 μm | PLA:PPeel 125–250 μm | PLA:PPeel 315–500 μm | |
|---|---|---|---|---|
| PLA:PPeel ratio | 9:0 | 9:1 | 9:1 | 9:1 |
| Moisture content (%) | 0.3 | 0.9 | 1.1 | 0.7 |
| Extruder screw rotation (rpm) | 50 | 50 | 50 | 50 |
| Extruder temperature (°C) | 210 | 220 | 200 | 200 |
| Injection temperature (°C) | 210 | 210 | 200 | 210 |
| Mold temperature (°C) | 30 | 30 | 50 | 30 |
Table 2.
Volume-based particle number and surface area ratios of PPeel particle size classes (0–53 μm, 125–250 μm, and 315–500 μm) within the biocomposites based on Sauter mean diameters D[3,2].
Table 2.
Volume-based particle number and surface area ratios of PPeel particle size classes (0–53 μm, 125–250 μm, and 315–500 μm) within the biocomposites based on Sauter mean diameters D[3,2].
| Particle Class (μm) | D[3,2] (μm) | Volume (μm³) | Volume Ratio (-) | Surface Area (μm²) | Coarsest Class Equivalent Surface Area (μm²) | Surface Area Ratio (-) | ||
|---|---|---|---|---|---|---|---|---|
| 0–53 | 31 | 15,599 | 3,019 | 9,112,179 | ||||
| 252.7 | 6.3 | |||||||
| 125–250 | 196 | 3,942,456 | 3018.2 | 120,687 | 1,441,212 | 14.5 | ||
| 11.9 | 2.3 | |||||||
| 315–500 | 448 | 47,079,589 | 630,530 | 630,530 | ||||
Table 3.
Sauter mean diameter D[3,2] of different PPeel particle fractions (0–53 μm, 125–250 μm, and 315–500 μm) determined via laser diffraction analysis (LDA) prior to injection-molding, and within PLA–PPeel injection-molded specimens determined via minimal and maximal Feret diameters (DF) and projected area equivalent diameters (DA) from microscopic images, respectively. Aspect ratio and roundness of the different PPeel particle fractions (0–53 μm, 125–250 μm, and 315–500 μm) within PLA–PPeel injection-molded specimens were calculated according to Equation (2) and Equation (3), respectively.
| Particle Class (μm) | D[3,2] LDA (μm) | D[3,2] DF (μm) | D[3,2] DA (μm) | Aspect Ratio (-) | Roundness (-) |
|---|---|---|---|---|---|
| 0–53 | 31 | 38 | 34 | 0.67 | 0.77 |
| 125–250 | 196 | 193 | 184 | 0.67 | 0.77 |
| 315–500 | 448 | 464 | 446 | 0.68 | 0.77 |
Table 4.
Thermal properties, glass transition temperature (Tg), cold crystallization peak temperature (Tcc), and melting peak temperature (Tm), and crystallinity (Xc), of neat PLA and PLA–PPeel biocomposites using different PPeel particle size classes. Significant differences (p ≤ 0.05) between mean values are represented by the use of different letters: A, B, C.
| Sample | Tg | Tcc | Tm | Χc |
|---|---|---|---|---|
| Neat PLA | 59.5 ± 0.3 AB | 109.9 ± 0.1 A | 152.4 ± 0.5 A/159.1 ± 0.3 | 3.2 ± 0.5 AB |
| PLA/PPeel 0–53 μm | 58.9 ± 0.1 A | 114.8 ± 0.3 B | 153.4 ± 0.4 AB | 1.9 ± 0.2 A |
| PLA/PPeel 125–250 μm | 59.5 ± 0.3 B | 115.3 ± 1.5 B | 154.6 ± 0.1 C | 6.3 ± 1.4 C |
| PLA/PPeel 315–500 μm | 59.3 ± 0.2 AB | 115.1 ± 0.8 B | 153.9 ± 0.5 BC | 4.7 ± 0.9 BC |
Disclaimer/Publisher’s Note: The statements, opinions and data contained in all publications are solely those of the individual author(s) and contributor(s) and not of MDPI and/or the editor(s). MDPI and/or the editor(s) disclaim responsibility for any injury to people or property resulting from any ideas, methods, instructions or products referred to in the content. |
© 2024 by the authors. Licensee MDPI, Basel, Switzerland. This article is an open access article distributed under the terms and conditions of the Creative Commons Attribution (CC BY) license (https://creativecommons.org/licenses/by/4.0/).
Share and Cite
MDPI and ACS Style
Miller, K.; Reichert, C.L.; Loeffler, M.; Schmid, M. Effect of Particle Size on the Physical Properties of PLA/Potato Peel Composites. Compounds 2024, 4, 119-140. https://doi.org/10.3390/compounds4010006
AMA Style
Miller K, Reichert CL, Loeffler M, Schmid M. Effect of Particle Size on the Physical Properties of PLA/Potato Peel Composites. Compounds. 2024; 4(1):119-140. https://doi.org/10.3390/compounds4010006
Chicago/Turabian StyleMiller, Katharina, Corina L. Reichert, Myriam Loeffler, and Markus Schmid. 2024. "Effect of Particle Size on the Physical Properties of PLA/Potato Peel Composites" Compounds 4, no. 1: 119-140. https://doi.org/10.3390/compounds4010006