Article

Association, Conformational Rearrangements and the Reverse Process of Aggregates Dissociation during Apomyoglobin Amyloid Formation

1
Institute of Protein Research RAS, 142290 Pushchino, Russia
2
Branch of the Shemyakin-Ovchinnikov Institute of Bioorganic Chemistry RAS, 142290 Pushchino, Russia
*
Authors to whom correspondence should be addressed.
Physchem 2023, 3(3), 304-318; https://doi.org/10.3390/physchem3030021
Submission received: 6 February 2023 / Revised: 26 May 2023 / Accepted: 18 July 2023 / Published: 24 July 2023
(This article belongs to the Section Biophysical Chemistry)

Abstract

:
Amyloid formation is linked with serious human diseases that are currently incurable. Usually, in the study of amyloid aggregation, the description of the protein’s association is in focus. Whereas the mechanism of the cross-β-structure formation, and the presence of aggregation reversibility, remain insufficiently explored. In this work, the kinetics of amyloid aggregation of apomyoglobin (ApoMb) have been studied using thioflavin fluorescence, electron microscopy, and non-denaturing electrophoresis. An analysis of the concentration dependence of the aggregation rates allows the conclusion that ApoMb amyloid formation includes the stages of conformational rearrangements in the aggregates, followed by their association and the fibril formation. The study of the mutant variants aggregation kinetics showed that the association rate is determined by the amino acids’ hydrophobicity, while the rate of conformational rearrangements is affected by the localization of the substitution. An unexpected result was the discovery that ApoMb amyloid formation is reversible, and under native-like conditions, the amyloid can dissociate, producing monomers. A consequence of the reversibility of amyloid aggregation is the presence of the monomer after aggregation completion. Since the aggregation reversibility indicates the possibility of dissociation of already formed fibrils, presented data and approaches can be useful in finding ways for amyloid diseases treatment.

1. Introduction

The inability of proteins to fold properly leads to their dysfunction and aggregation. One of the types of protein aggregates are amyloids, which are fibrils containing a cross-β-structure [1]. To date, more than 50 diseases associated with the formation of amyloids are known, including Alzheimer’s disease, type II diabetes, spongiform encephalopathies, and others [2,3]. The cause of amyloidosis symptoms is damage to the cell membranes by protein aggregates. Usually, the most toxic species are not fibrils, but oligomers formed at the early stages of amyloid formation [4,5,6]. Therefore, the study of the amyloid aggregation kinetics and factors influencing the various stages of this process may be useful in finding ways to treat amyloid diseases [7].
The classical model used to describe the kinetics of amyloid formation is nucleation polymerization. Its specific feature is the slow and thermodynamically unfavorable first steps of protein oligomerization (nucleation) [8,9,10]. Three stages are distinguished on the kinetic curve of nucleation polymerization: a lag phase, corresponding to the formation of an unstable oligomeric nucleus, an exponential growth phase, and a stationary phase, where the reaction graph reaches a plateau [8,9,10]. For amyloid aggregation, the classical model of nucleation polymerization is complemented by secondary pathways involving nucleation catalyzed by existing aggregates [11,12].
To date, using both disease-associated and model proteins, the effect of amino acid substitutions on the aggregation kinetics has been studied. It has been shown that the rate of amyloid formation is determined by the residues’ hydrophobicity and the protein structure stability [13,14,15,16,17,18]. Under denaturing conditions, the aggregation rate correlates with the hydrophobicity, since the latter stabilizes the intermolecular interactions [13,14,15]. Under native-like conditions, protein destabilization leads to an increase in the population of non-native conformations with hydrophobic groups exposed to the solvent, and, therefore, increases the aggregation rate [17,18]. Thus, both a hydrophobicity increase and the native state destabilization affect the rate of amyloid formation by accelerating the molecules’ association, and are expected to accelerate any type of aggregation. However, besides the molecules’ association, the amyloid formation includes conformational rearrangements, resulting in the formation of a highly regular cross-β-structure [19,20,21,22]. It differs from the β-structure of globular proteins by greater regularity and less twisting [23,24]. To date, the factors affecting the rate of conformational rearrangements during amyloid formation remain unexplored. Since the toxicity of amyloid aggregates depends on the cross-β-structure content, the study of the structural transitions may play a key role in finding approaches to reduce the amyloidosis symptoms [25,26].
The second important and unexplored issue of the amyloid formation kinetics is the reverse process, that is, the dissociation of amyloids under conditions of aggregation. The dynamic equilibrium between the monomer and small aggregates formed during the lag-period of amyloid formation has been shown previously [27]. While it is usually believed that the mature amyloid fibrils are highly stable, the reverse process of amyloid aggregation is absent, or its rate is minimal [28]. The discovery of a high concentration of the monomer after the completion of the kinetics of amyloid aggregation raised the question of the possible reversibility of all stages of fibril formation [29,30]. Using Aβ-peptide, the dissociation of fibrils under aggregation conditions has been shown, which confirmed the reversibility of amyloid formation [31,32]. To date, such reports are uncommon, and the amyloid formation reversibility needs further study.
This study aimed to examine how amino acid substitutions affect various stages of amyloid formation, including association, conformational rearrangements, and the amyloid aggregation reversibility. To study the stage of conformational rearrangements, it is important to choose the conditions where this process proceeds slowly enough to be detected experimentally. Therefore, for our work we chose the model protein apomyoglobin (ApoMb) for several reasons. First, it is a completely α-helical protein forming amyloids from a folded state; therefore, it is assumed that its structural transitions leading to the formation of cross-β-structure occur with the crossing of a relatively high energy barrier. Second, our previous results showed that after ApoMb aggregation completion, a significant fraction of the protein remains in the monomeric form, indicating a possible reversibility of amyloid formation [33]. Therefore, this protein is an appropriate model for studying both the conformational rearrangements and the reversibility of amyloid aggregation.
ApoMb is a single domain protein containing eight helices, and its folding occurs through the formation of an intermediate state [34,35,36]. ApoMb forms amyloid fibrils under a wide range of conditions, and the precursor of amyloids can be both an intermediate state and an unfolded one [33,37,38]. The experimental data point to the important role of the A-helix of ApoMb in the process of amyloid aggregation: the peptide corresponding to this region is capable of amyloid aggregation; in addition, substitutions in the A-helix lead to an increase in the ApoMb amyloidogenicity [38,39].
This study investigated the amyloid formation kinetics of wild-type ApoMb and its five mutant variants at a temperature of 40 °C and pH 5.5. These conditions were chosen as they closely resemble physiological ones. The results obtained show that the rate of association is affected by amino acid hydrophobicity, while the rate of conformational conversion during amyloid aggregation is determined by the position of mutation. It was shown that ApoMb amyloid aggregation is reversible and fibrils can dissociate to monomers under the conditions of aggregation. Using new approaches for studying the amyloid formation reversibility, the effect of mutations on the equilibrium between monomer and aggregates has been estimated. Thus, the obtained data provide a deep insight into the mechanism of different stages during amyloid formation by folded proteins.

2. Materials and Methods

2.1. Protein Expression and Isolation

Plasmids containing the genes of sperm whale ApoMb mutated forms were obtained using a 7 QuikChange site-directed mutagenesis kit (Stratagene, San Diego, CA, USA) with the plasmid pET17b as a template (a kind gift from P.E. Wright). ApoMb and its variants were isolated and purified after the expression of appropriate plasmids in Escherichia coli (E. coli) BL21 (DE3) cells as described previously [40].

2.2. Absorption Spectroscopy

To calculate the protein concentration, absorption spectra were measured on a Cary 100 spectrophotometer (Agilent Technologies, Palo Alto, CA, USA) in the 220–450 nm range. The extinction coefficients were calculated from the amino acid sequence and taken as A 280 0.1 % = 0.88 for WT ApoMb and its mutated proteins V10A, V10F, and V10AM131A, the value of A 280 0.1 % = 0.56 was used for the variants W14A and W14F [41].

2.3. Aggregation Conditions

To study amyloid formation, lyophilized proteins were dissolved in a 10 mM sodium phosphate buffer, pH 5.5. Then the poorly dissolved material was removed by centrifugation using a Beckman 100 ultracentrifuge (Beckman Coulter, Brea, CA, USA) at 90,000× g for 30 min at a temperature of 4 °C. The ApoMb solutions were incubated for 24 h at a temperature of 40 °C.

2.4. Fluorescence Spectroscopy

A Varian Cary Eclipse (Agilent Technologies, Santa Clara, CA, USA) spectrofluorimeter was used for thioflavin T (ThT) fluorescence measurements. To study the concentration dependence of the aggregation rates, the kinetics of the ApoMb V10F variant were registered in the range of protein concentrations 8–290 µM. For the investigation of the mutations’ effects on the amyloid formation rates, the kinetics were measured at an ApoMb variants concentration equal to 290 µM. The dye concentration was 500 µM. The excitation wavelength was 450 nm. The fluorescence was recorded at 480 nm at 40 °C in a cuvette with stirring. The optical path length of the cuvette was 1 cm.

2.5. Electron Microscopy

The samples for electron microscopy studies were prepared according to the negative staining method, described earlier [42]. Briefly, a cooper 400-mesh grid (Electron Microscopy Science, Hatfield, PA, USA) coated with a formvar film was mounted on the protein sample drop (6 µM). After 5 min absorption, the grid with the preparation was negatively stained for 2 min with a 1% aqueous solution of uranyl acetate. Micrographs were obtained using a transmission electron microscope JEM 1200 EX (Jeol, Tokyo, Japan) at an 80 kV accelerating voltage. Images were recorded on the Kodak electron image film (SO-163) at a magnification of 40,000.

2.6. Fourier Transforms Infrared Spectroscopy (FTIR)

Infrared spectra were recorded by Nicolet 6700 Fourier transform IR spectrometer (Thermo Scientific, Waltham, MA, USA). The protein concentration was 5 mg/mL, spectra were measured at 25 °C. The sample was placed between CaF2 plates; the optical path length was 5.8 µm. The spectra comprising the average of 256 scans were measured with a 4 cm−1 resolution with automatic water vapor compensation.

2.7. Non-Denaturing Electrophoresis

Non-denaturing electrophoresis of ApoMb solutions was performed in 9% PAGE. The electrophoresis was performed at pH 5.5 without a denaturant addition using 50 mM MES-NaOH buffer (pH 5.5) as an electrode and gel buffer. Positively charged methylene green dye, appropriate for electrophoresis in acidic conditions, was added to the sample buffer as a leading dye. The protein bands stained with Coomassie Brilliant Blue G250–were quantified using the Total Lab software (Gosforth, UK).

2.8. Amyloids Purification

After allowing the aggregation process to complete over 24 h, the amyloid solution was centrifuged at 90,000× g using a Beckman 100 ultracentrifuge (Beckman Coulter, Brea, CA, USA), at a temperature of 4 °C for 30 min. The supernatant was removed. Resuspension in the 10 mM sodium phosphate, pH 5.5 buffer, and the centrifugation of amyloids were repeated twice to remove the rest of the monomeric protein and low molecular weight aggregates. Then the precipitate with amyloid fibrils was resuspended in 10 mM sodium phosphate buffer, pH 5.5 to a final concentration 290 µM.

3. Results

3.1. Selection of Amino Acid Residues for Substitutions

This work aimed to study the influence of both the protein structure stability and the amino acid residues’ hydrophobicity on the ApoMb amyloid aggregation kinetics. First, since the A-helix of ApoMb is shown to be highly amyloidogenic, we selected substitutions in this region [38,39]. Second, in accordance with our earlier research on the stability of ApoMb mutants, we have selected variants with varying degrees of the native state destabilization for this work [33,40]. These include V10A, W14A, and V10AM131A. All these substitutions decrease the residue hydrophobicity. Additionally, to confirm the hydrophobicity effect on aggregation, the residues at these positions were substituted by more hydrophobic ones: V10F and W14F. Thus, a set of five ApoMb variants was obtained: W14A, V10AM131A, V10A, W14F, and V10F.
For all the obtained proteins, the kinetics of amyloid formation have been studied at pH 5.5 and 40 °C. These conditions are as close as possible to physiological ones under which ApoMb forms amyloids. At a pH above 5.5, ApoMb forms amorphous aggregates, while decreasing the temperature below 40 °C leads to a pronounced slowdown in aggregation, making it unsuitable for experimental studies. Under the chosen conditions, monomer wild-type ApoMb and its variants contain a pronounced secondary structure and show heme-binding ability [33].

3.2. The Stages of ApoMb Amyloid Formation

To investigate the stages of ApoMb amyloid formation, the variant V10F was chosen as an example due to its high amyloidogenicity [33,43]. For experiments, the protein concentration was 290 µM. The kinetics of aggregates formation have been studied by the non-denaturing electrophoresis. Figure 1a shows the electrophoregram of the aliquots taken at different time points of protein incubation at 40 °C. The lower band in the gel corresponds to the monomeric protein. The diffuse band at the top of the first track indicates the presence of ApoMb aggregates at pH 5.5 before incubation. The aggregation kinetic representing the decrease in the intensity of the monomer band as a function of time was plotted (Figure 1a). According to the results obtained, the aggregation process is well described by an exponential dependence reaching a plateau after about 6 h of incubation.
Unlike non-denaturing electrophoresis, sensing the formation of any types of aggregates, the ThT specifically binds with the cross-β-structure. Therefore, the ThT fluorescence method allows a focus on the amyloid formation. The ThT kinetics of ApoMb amyloid aggregation are similar to that obtained by non-denaturing electrophoresis (Figure 1a,c). To confirm that the observed dye binding reflects the appearance of a β-structure in the protein and is not non-specific, the FTIR method was used. Figure 1b shows the FTIR spectra of ApoMb V10F before incubation and after 8 h aggregation. The spectrum before incubation shows one peak at the wavenumber of 1650 cm−1, corresponding to the absorption of the α-helix and the coil. In contrast, in the spectrum of the sample, after 8 h incubation appears a peak at 1620 cm1, characteristic of a cross-β-structure [23]. FTIR spectra were measured for samples at different time points of amyloid formation, then the kinetic graph was plotted using the A1620/A1650 ratio, which is proportional to the cross-β-structure content. The coincidence of the kinetic curves obtained by FTIR and ThT fluorescence indicates that the dye binding is specific (Figure 1c). Therefore, the ThT fluorescence method is appropriate for monitoring the increase in the cross-β-structure content during ApoMb amyloid formation.
The ThT kinetic graph can be approximated by a double-exponential function (Figure 1c). This concludes that there are at least two stages during ApoMb amyloid formation. From the approximation, the rates of the first (k1 = 2.61 h1) and the second (k2 = 0.42 h1) aggregation stages were obtained. The characteristic times of the first and the second stages, equal to 48 min and 8 h, respectively, were calculated according to the standard method [44]. The morphology of aggregates formed after these amyloid formation stages was studied using electron microscopy. At the end of the first stage (≈48 min), globular and rod-like aggregates were predominant (Figure 1d). At the subsequent stage over 8 h, the formation of fibrillar structures up to 100 nm long occurs (Figure 1e). Thus, the obtained data allow concluding that the first step of ApoMb amyloid aggregation corresponds to the formation of globular cross-β-structural aggregates, binding ThT. The second stage includes the fibril formation and an increase in the β-structure content (Figure 1f).

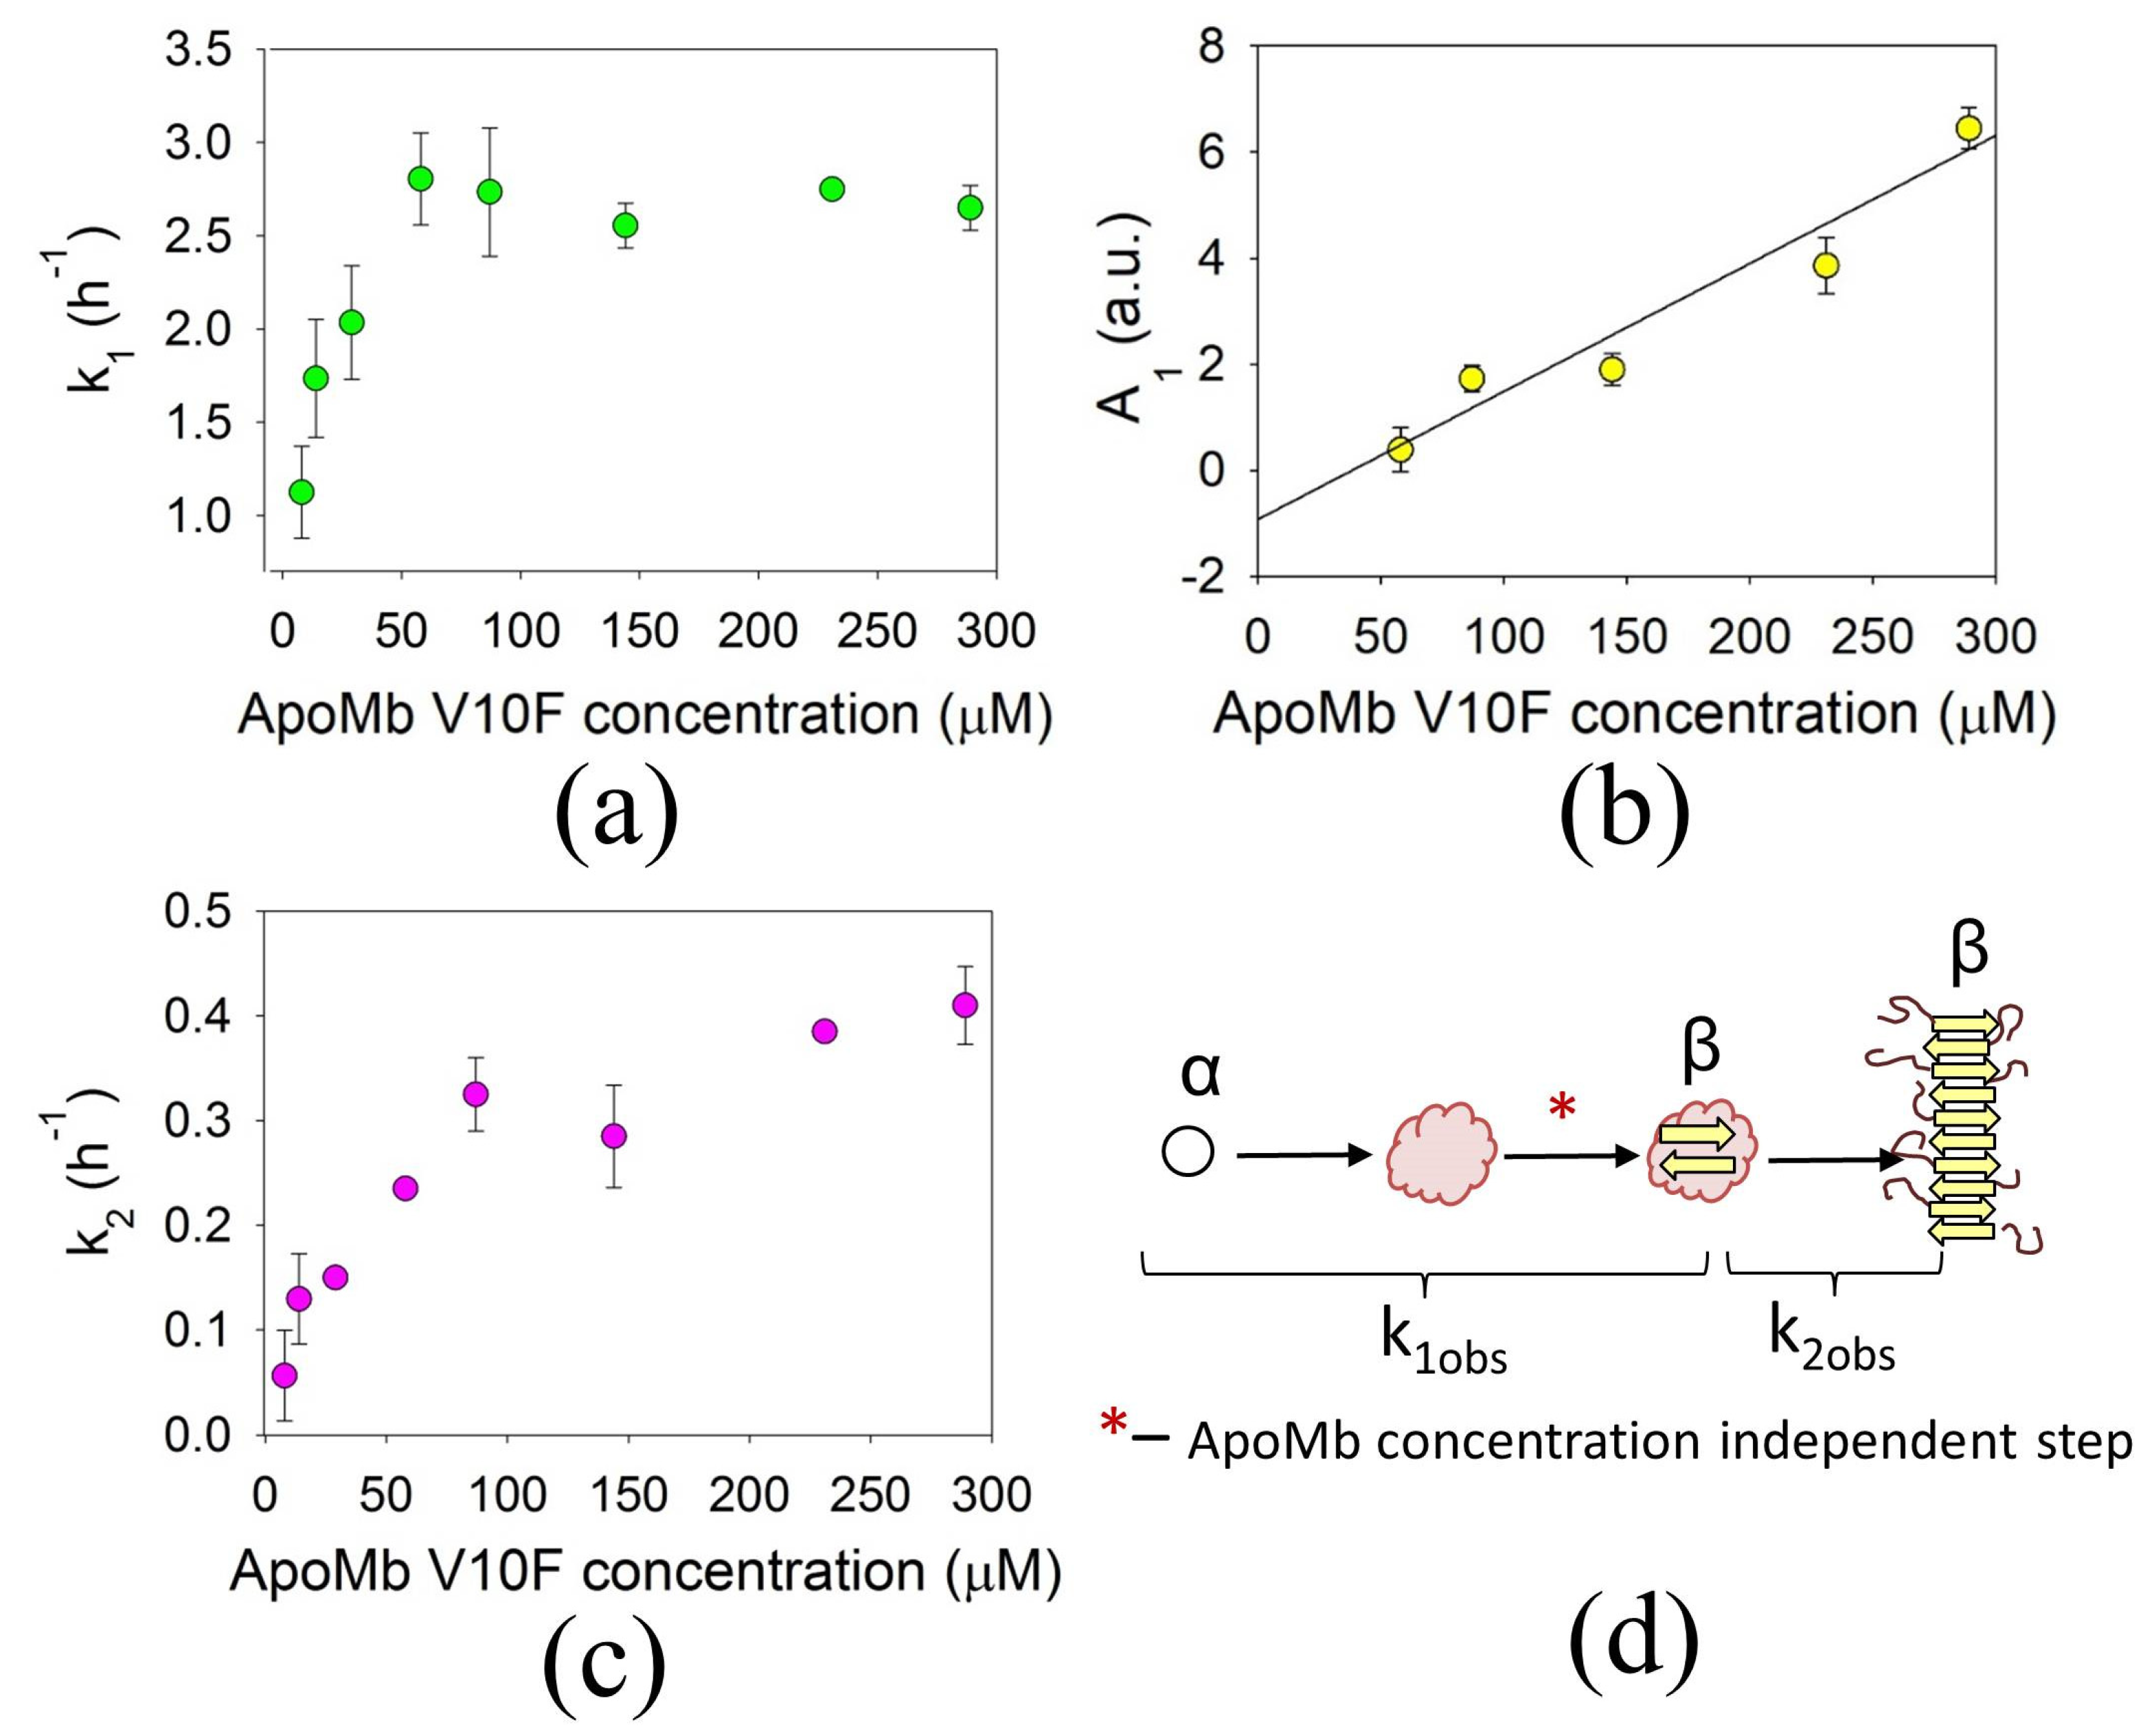
3.3. Concentration Dependences of the ApoMb Aggregation Rates

The kinetics of amyloid formation at different ApoMb concentrations were followed by the ThT fluorescence using V10F mutant as an example (Figure S1). From the approximation of kinetic curves, the values of the first and second aggregation rate constants were obtained. The concentration dependence of the first rate is shown in Figure 2a. In the range of low ApoMb concentrations (lower 60 μM), this rate increases with increasing protein concentration. This type of dependence is characteristic of aggregation and indicates that the rate of the process is determined by the particles’ association.
In contrast, at a high ApoMb concentration (above 60 μM), the rate of the first stage is concentration independent. There are two possible explanations for the results obtained. The first is that at high protein concentrations, the amyloid aggregation rate is determined by the zero-order reaction, i.e., a process within a single particle. The second explanation is that, besides amyloids, non-specific aggregates that do not bind ThT are formed, and their fraction increases with increasing protein concentration [45]. In this case, the number of formed fibrils would be the same in the range of ApoMb concentration, corresponding to the plateau on the graph. To check if the last model is appropriate for ApoMb, we plotted the concentration dependence of the first stage amplitude in the range where the aggregation rate is concentration independent (Figure 2b). The data show that the amplitude and, consequently, the number of amyloids increases linearly with the increasing protein concentration. This excludes the last model for ApoMb amyloid formation and supports the first explanation, that the first visible aggregation rate is determined by the zero-order reaction at a high protein concentration. The ThT fluorescence reflects the formation of the amyloid cross-β-structure. Thus, the concentration-independent stage during amyloid formation seems to be a conformational rearrangement within aggregates, leading to the formation of a β-structure from the initially α-helical ApoMb.
The second aggregation stage also depends on the protein concentration. The rate constant k2, increases as the protein concentration increases throughout the range studied (Figure 2c). This behavior is typical for protein association. Thus, the saturation of the first-rate concentration dependence allows the supplementing of the previous scheme of ApoMb aggregation with the third stage of conformational rearrangements (Figure 2d).
The data obtained indicate that the free energy profile of ApoMb aggregation depends on protein concentration. The first observed rate constant (k1obs) of amyloid formation includes two stages with their own free energy barriers. The first barrier corresponds to the protein molecules’ association, and its height decreases with increasing protein concentration. The second barrier is determined by conformational rearrangements within aggregates, and it is concentration independent. At low ApoMb concentrations (below 60 μM), the highest energy barrier (#) corresponds to the association stage (Figure 3a). At higher concentrations (above 60 μM), the association rate increases, reducing the first free energy barrier to an extent, making it lower than the conformational rearrangements barrier (Figure 3b). Therefore, the rate of the first observed rate constant (k1obs) is determined by the structural rearrangements within aggregates and does not depend on the ApoMb concentration. During the third stage of amyloid formation, fibril formation occurs, and its observed rate constant (k2obs) is determined by the association over the entire range of protein concentrations.

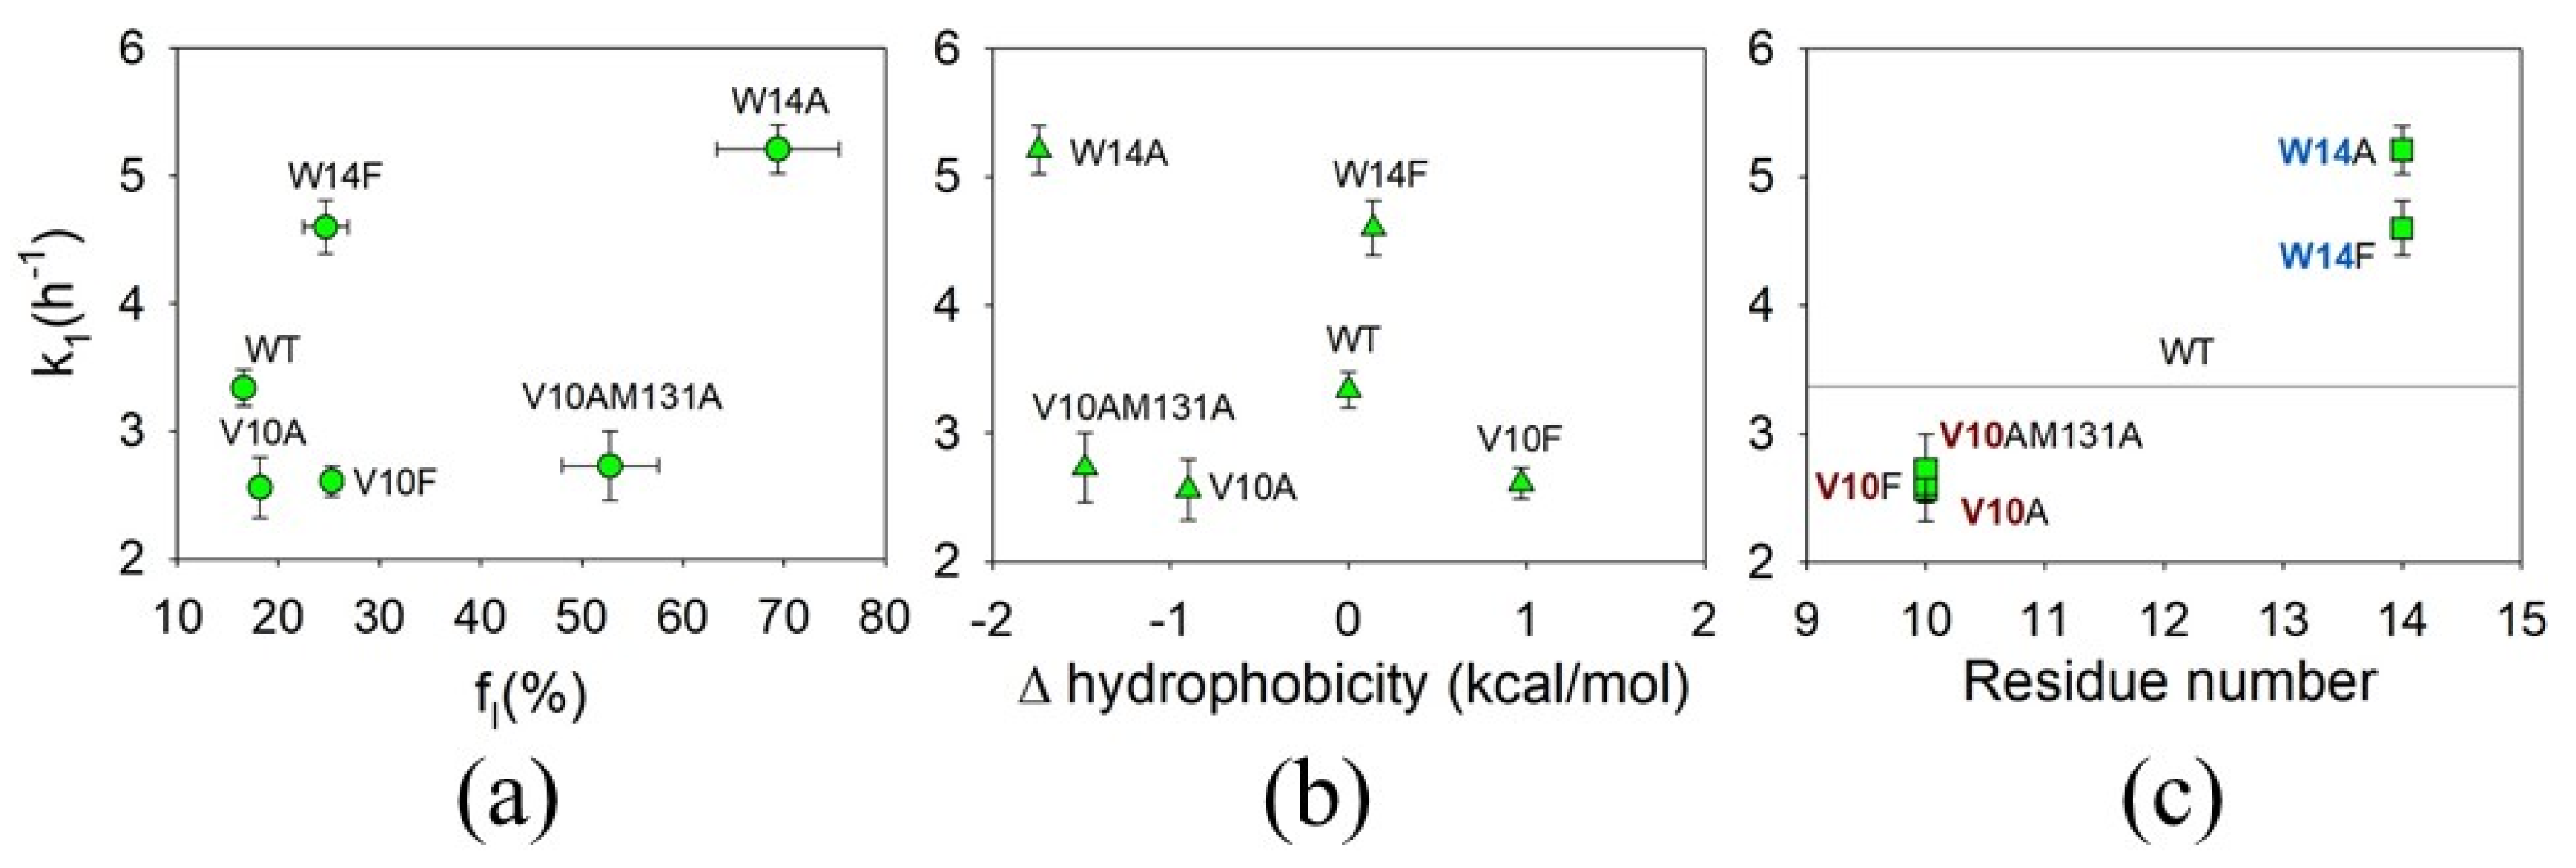
3.4. The Effect of Mutations on the First Rate of ApoMb Amyloid Aggregation

To understand what factors determine the rate of structural rearrangements within aggregates, we studied the amyloid formation kinetics of ApoMb variants at a protein concentration of 290 µM. At this concentration, the first observed rate constant is concentration independent, and conformational conversion is the slowest step. The kinetics of ApoMb variants amyloid formation was followed using ThT fluorescence (Figure 4). The first (k1obs) and the second (k2obs) observable rate constants were calculated from the two-exponential approximation (Table 1).
Usually, the rate of amyloid aggregation correlates with the hydrophobicity of amino acid residues or, in the case of native-like conditions, with the stability of the protein structure [13,14,15,16,17,18]. Therefore, first, we tried to find the dependence of the ApoMb aggregation rate on these parameters (Figure 5a,b). As a measure of the mutant structure stability, we used populations of the native and intermediate states under the studied conditions (pH 5.5; 40 °C) determined earlier (Table 1) [33]. The obtained data reveal the absence of these correlations for ApoMb amyloid formation.
In the absence of generally accepted correlations, the discovery of the dependence of the aggregation rate on the position of the amino acid substitutions along the polypeptide chain was especially surprising. Substitutions of the V10 residue led to a slowdown of the conformational rearrangements compared to wild-type proteins, while mutations at the W14 position accelerate this stage (Figure 5c). The significant differences in the aggregation rate between proteins with the point mutations indicate a high specificity of the amyloid cross-β-structure formation. The dependence of k1 on the localization of amino acid substitutions, regardless of the residue properties, suggests that the rate of conformational rearrangements is determined by the structure of a specific region of a protein involved in the formation of the β-structure by α-helical ApoMb.
Numerous studies of amyloid aggregation indicate that the main determinants of the aggregation rate are the physicochemical properties of the residues, such as hydrophobicity and charge [13,14]. Therefore, accounting for these parameters underlies most algorithms predicting the effect of mutations on the aggregation rate [15,46,47]. The absolute aggregation rate prediction is carried out taking into account the protein concentration [46,48]. The influence of these factors is clearly seen when the rate of amyloid formation is limited by the molecules’ association. However, in the case of ApoMb, it has been found that under the conditions used, the first observed rate constant of amyloid formation is not determined by the protein association, but rather by conformational rearrangements within aggregates. That explains the lack of above-mentioned correlations. This result allows us to conclude that conventional approaches for predicting the mutations’ effect on the aggregation rate, based on the hydrophobicity, cannot always be applied if the observed fibril formation rate is determined by conformational rearrangements. The data obtained for ApoMb showed that the rate of conformational conversion is determined by localization of substitution. These results suppose that a further search for sites where substitutions significantly change the rate of conformational rearrangements may be useful for complementation of the existing approaches for predicting the effect of mutations on the aggregation rate, as well as for the control of amyloid formation kinetics.

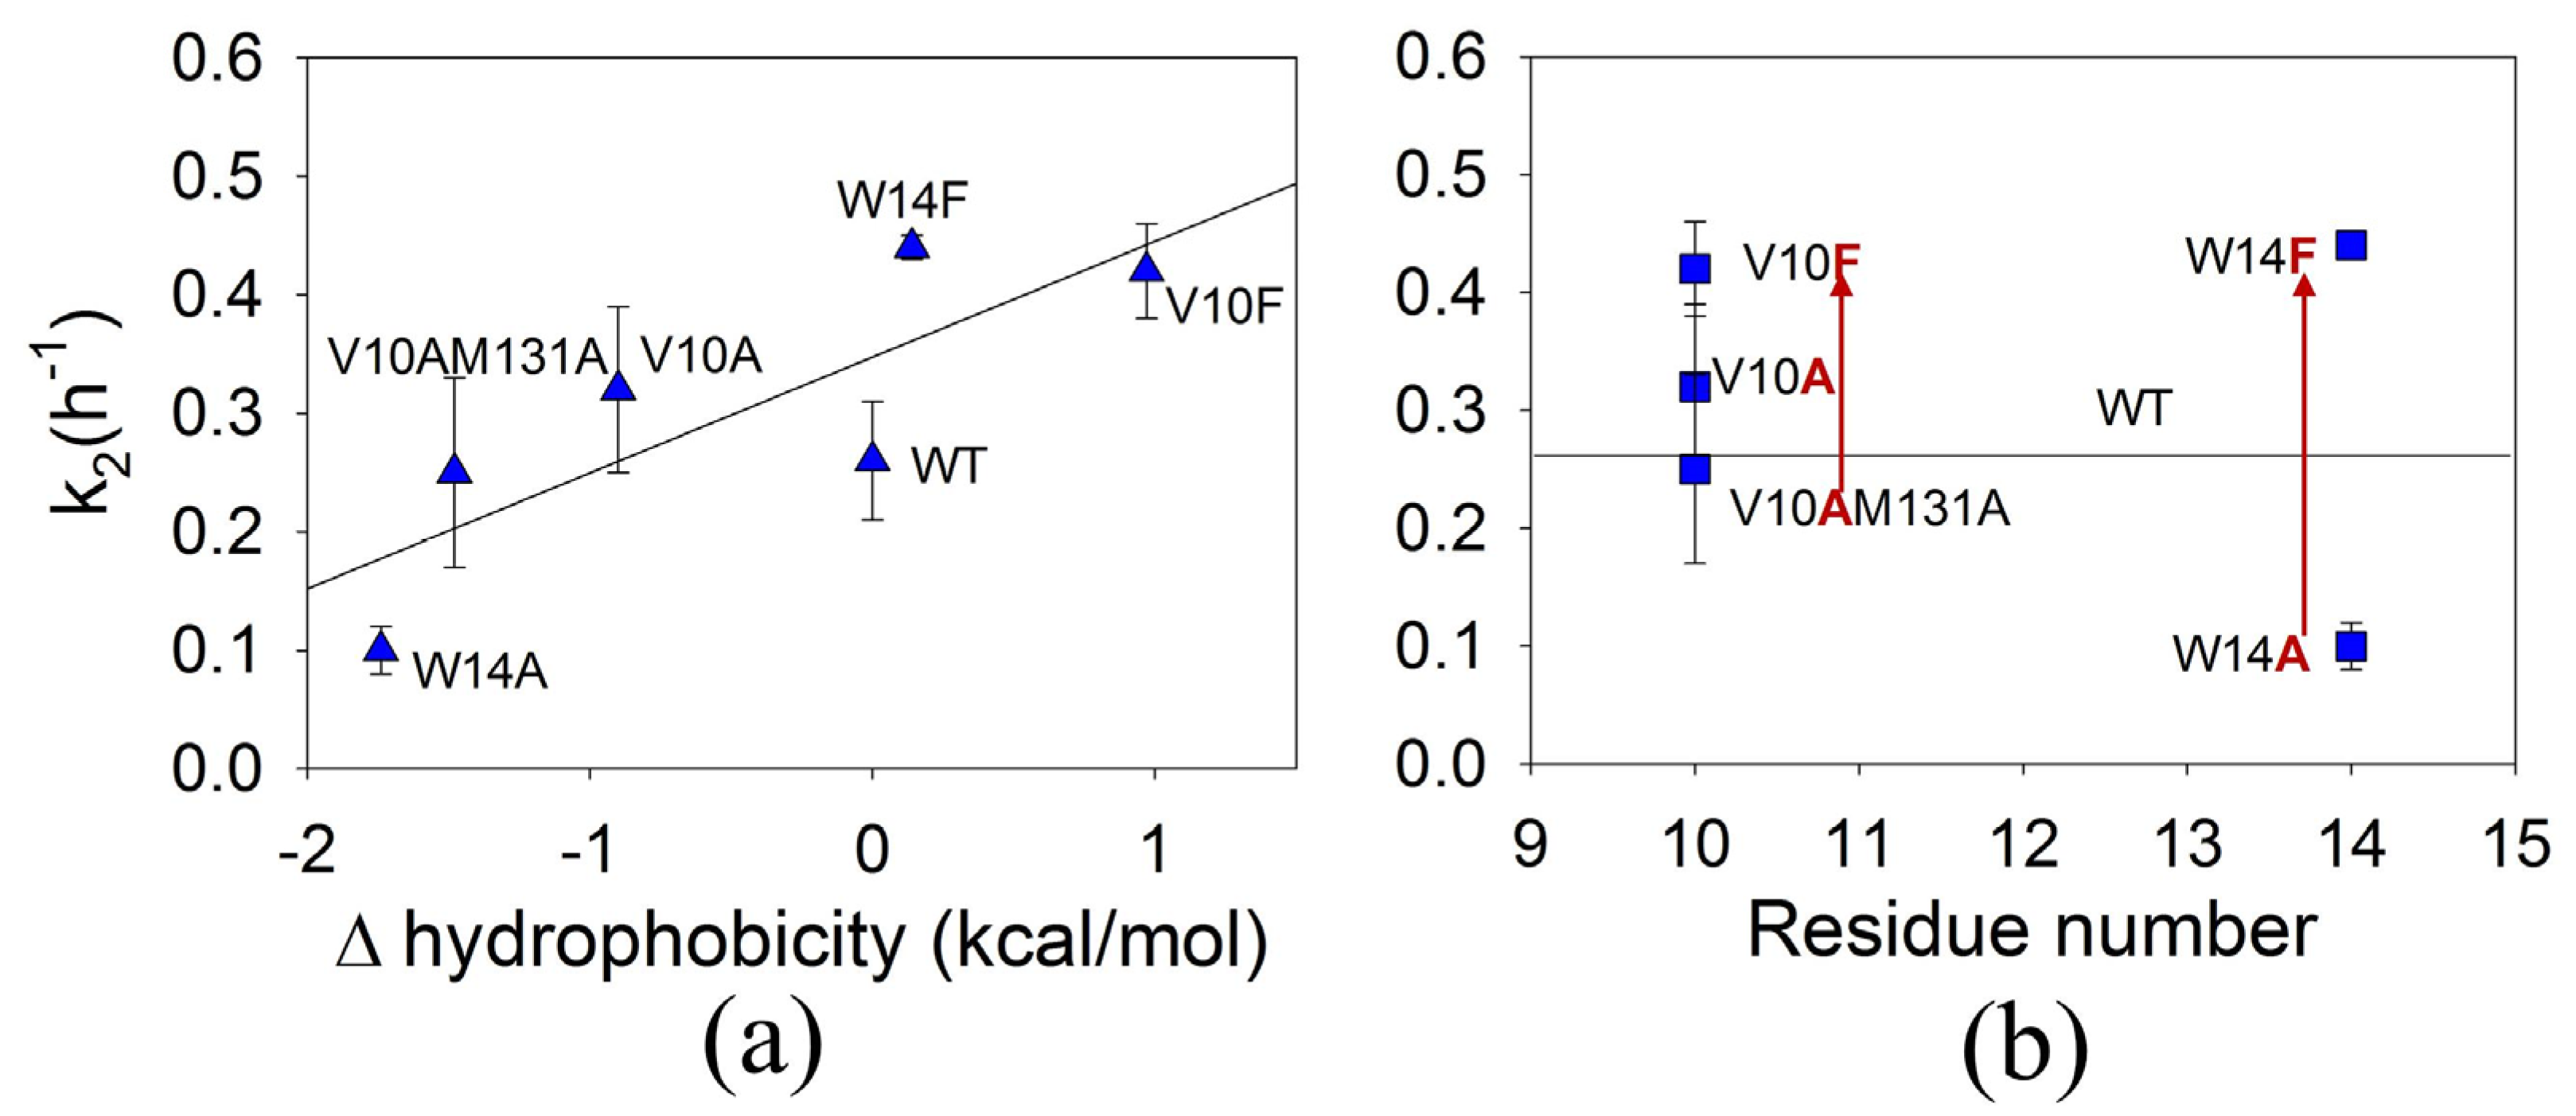
3.5. The Effect of Mutations on the Second Rate of ApoMb Amyloid Aggregation

During the second stage of ApoMb amyloid formation, fibrils are formed from globular aggregates. The second rate constant depends on the protein concentration, i.e., it is limited by the aggregates’ association (Figure 2c). As mentioned above, usually the association rate is determined by the properties of the amino acid residues, and it increases with their hydrophobicity [13,14,15]. In accordance, for the studied ApoMb variants, a correlation is observed between the change in the residues’ hydrophobicity as a result of mutations and the rate of fibril formation (r = 0.82) (Figure 6a). However, the same kind of residue located in different regions of the protein can be involved in the formation of intermolecular interactions to varying degrees. For example, one residue can be completely buried in the aggregate structure and form interactions by the entire surface, while the other residue of the same type can form contacts only by part of its surface. A decrease in the hydrophobic surface of the residue in the first case will lead to a more pronounced slowdown of aggregation compared to the second case. Since the dependence of the aggregation rate on the hydrophobicity change for all residues does not take into account the possible difference in their involvement in intermolecular interactions, the coefficient of this correlation can be low (Figure 6a). Therefore, it would be more correct to compare the aggregation rate of protein variants in which substitutions changing hydrophobicity are located at the same position. Such a comparison for ApoMb indicates that the same tendency is observed for both studied positions: mutant variants with substitutions for phenilalanine fibrillate faster than those with mutation to the less hydrophobic alanine (Figure 6b). An additional decrease in hydrophobicity due to the second substitution M131A leads to a slowdown in amyloid formation of V10AM131A ApoMb compared to the V10A variant. According to the data obtained, the difference in the aggregation rate between the mutants with substitutions for alanine and phenilalanine is more pronounced for the 14 position than for the 10 one. This suggests that the residue at the 14 position is involved in the formation of intermolecular interactions in more extent than the 10 residue.

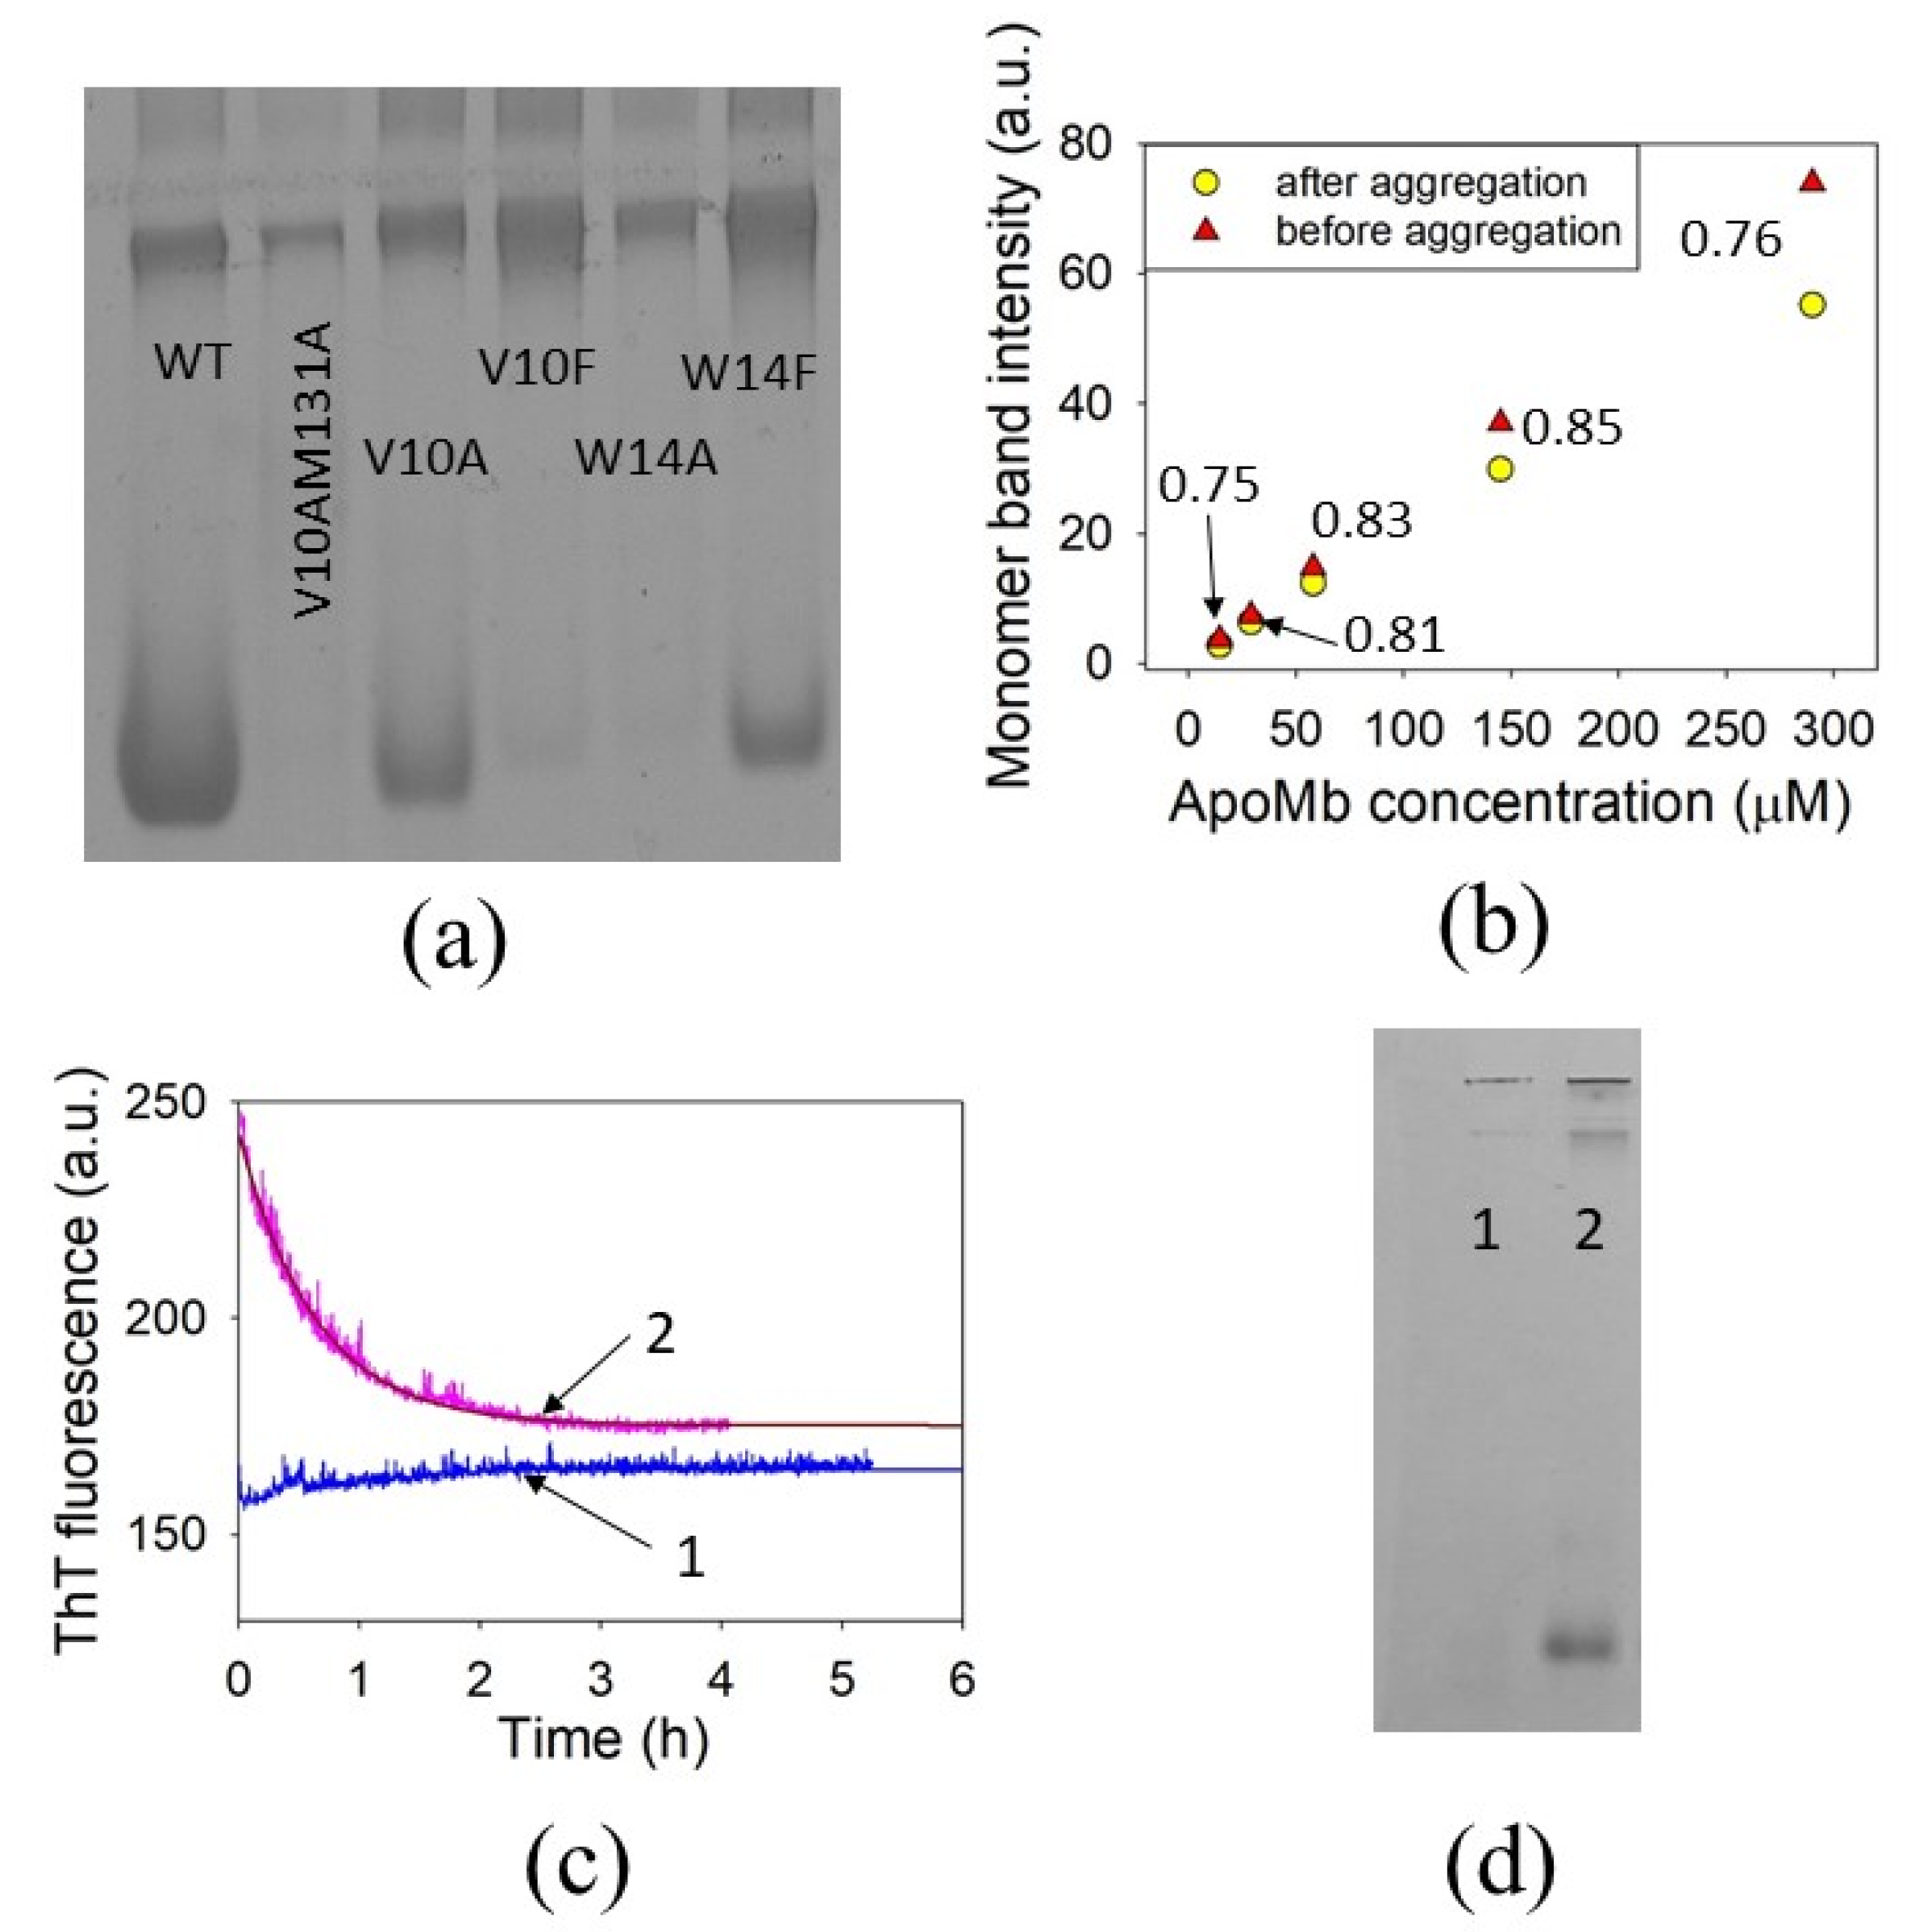
3.6. The Amyloid Formation Reversibility

In some cases, the mutant forms of a protein may differ not only in the aggregation rate, but also in the amyloid formation propensity. A comparison of the aggregation propensity implies a quantitative assessment of the aggregates’ content after the end of amyloid formation, when the kinetic curves reach a plateau. Due to the heterogeneity of aggregates, it is difficult to estimate their amount experimentally. In contrast, it is much easier to estimate the concentration of the monomeric protein after aggregation completion. This value is inversely proportional to the amount of aggregates, and it can be used as a measure of the aggregation propensity. In this work, the estimation of the ApoMb monomer content was carried out using the non-denaturing electrophoresis. After aggregation kinetic completion (24 h), the solutions of ApoMb variants were separated by electrophoresis in the absence of a denaturant. The total amount of protein applied per lane was the same for all samples. According to the data, the aggregation propensity of ApoMb mutants varies, and in the case of some variants, a significant fraction of the monomeric protein remains in solution after completion of aggregation (Figure 7a). The calculated values of the monomer band intensity are presented in the Table 1.
To ensure the accurate interpretation of the kinetic data, it is crucial to understand why a monomer is present in the solution after the aggregation is complete and why the protein does not fully participate in the amyloid formation. One of the possible explanations is that the residual monomer concentration is the critical one, observed for nucleation polymerization [49]. Below this concentration level, the amyloid formation cannot occur, since the interaction energy in the aggregates does not compensate for the monomer’s entropy loss. The second explanation is the reversibility of the amyloid aggregation and the presence of an equilibrium between the monomer and aggregates.
If the residual ApoMb monomer concentration corresponds to the critical one, the monomer content after aggregation completion should be the same at different initial protein concentrations. To test this assumption, we compared the monomer content after aggregation completion of WT ApoMb incubated at the various concentrations using the non-denaturing electrophoresis (Figure S2). The results obtained indicate that the monomer band intensities after the end of aggregation are not the same for all the studied samples. This excludes an assumption that the residual monomer content corresponds to the critical amyloidogenic concentration (Figure 7b). The electrophoresis results show that the fraction of the remaining monomer corresponds to 0.75–0.85 in relation to the total protein and is similar for all studied samples (Figure 7b). This supports the assumption about the reversibility of amyloid formation and the presence of an equilibrium between the monomeric protein and aggregates.
To confirm this assumption, we performed the amyloid dilution experiments. First, a solution of WT ApoMb after aggregation completion (24 h) was diluted from a concentration of 290 µM to 60 µM, then the ThT fluorescence was followed during incubation at 40 °C (Figure 7c(1)). The absence of significant changes in fluorescence allows the conclusion that a decrease in the concentration of amyloids does not cause their dissociation. The second experiment was a similar dilution of amyloids that were preliminarily purified, by the centrifugation of the solution after aggregation completion and subsequent resuspension of the pellet. A purified fibril dissolution revealed a pronounced decrease in ThT fluorescence, indicating the dissociation of amyloids (Figure 7c(2)). These results confirm that ApoMb amyloid aggregation is reversible. Moreover, the fibrils’ dissociation is determined by the fractions of monomeric protein and aggregates, and it occurs with an increase in the fraction of the latter relative to the monomer.
The next question arising is what are the products of the amyloid dissociation? To elucidate this, we performed non-denaturing electrophoresis of purified fibrils and of the solution after fibrils’ dissociation when the kinetics monitored by ThT fluorescence reached the plateau (Figure 7d). The appearance of a monomer band after fibrils’ dissociation indicates that under the aggregation conditions, amyloids can disassemble to a monomeric protein.
Thus, the results obtained suggest that the presence of a residual monomer after aggregation completion is a consequence of the reversibility of amyloid formation and the equilibrium between the monomer and aggregates. The reversibility of aggregation means that previously formed fibrils can be dissociated under native-like conditions. Therefore, this discovery, as well as further studies of the amyloid formation reversibility, may be useful in finding approaches to amyloid disease treatment.

4. Discussion

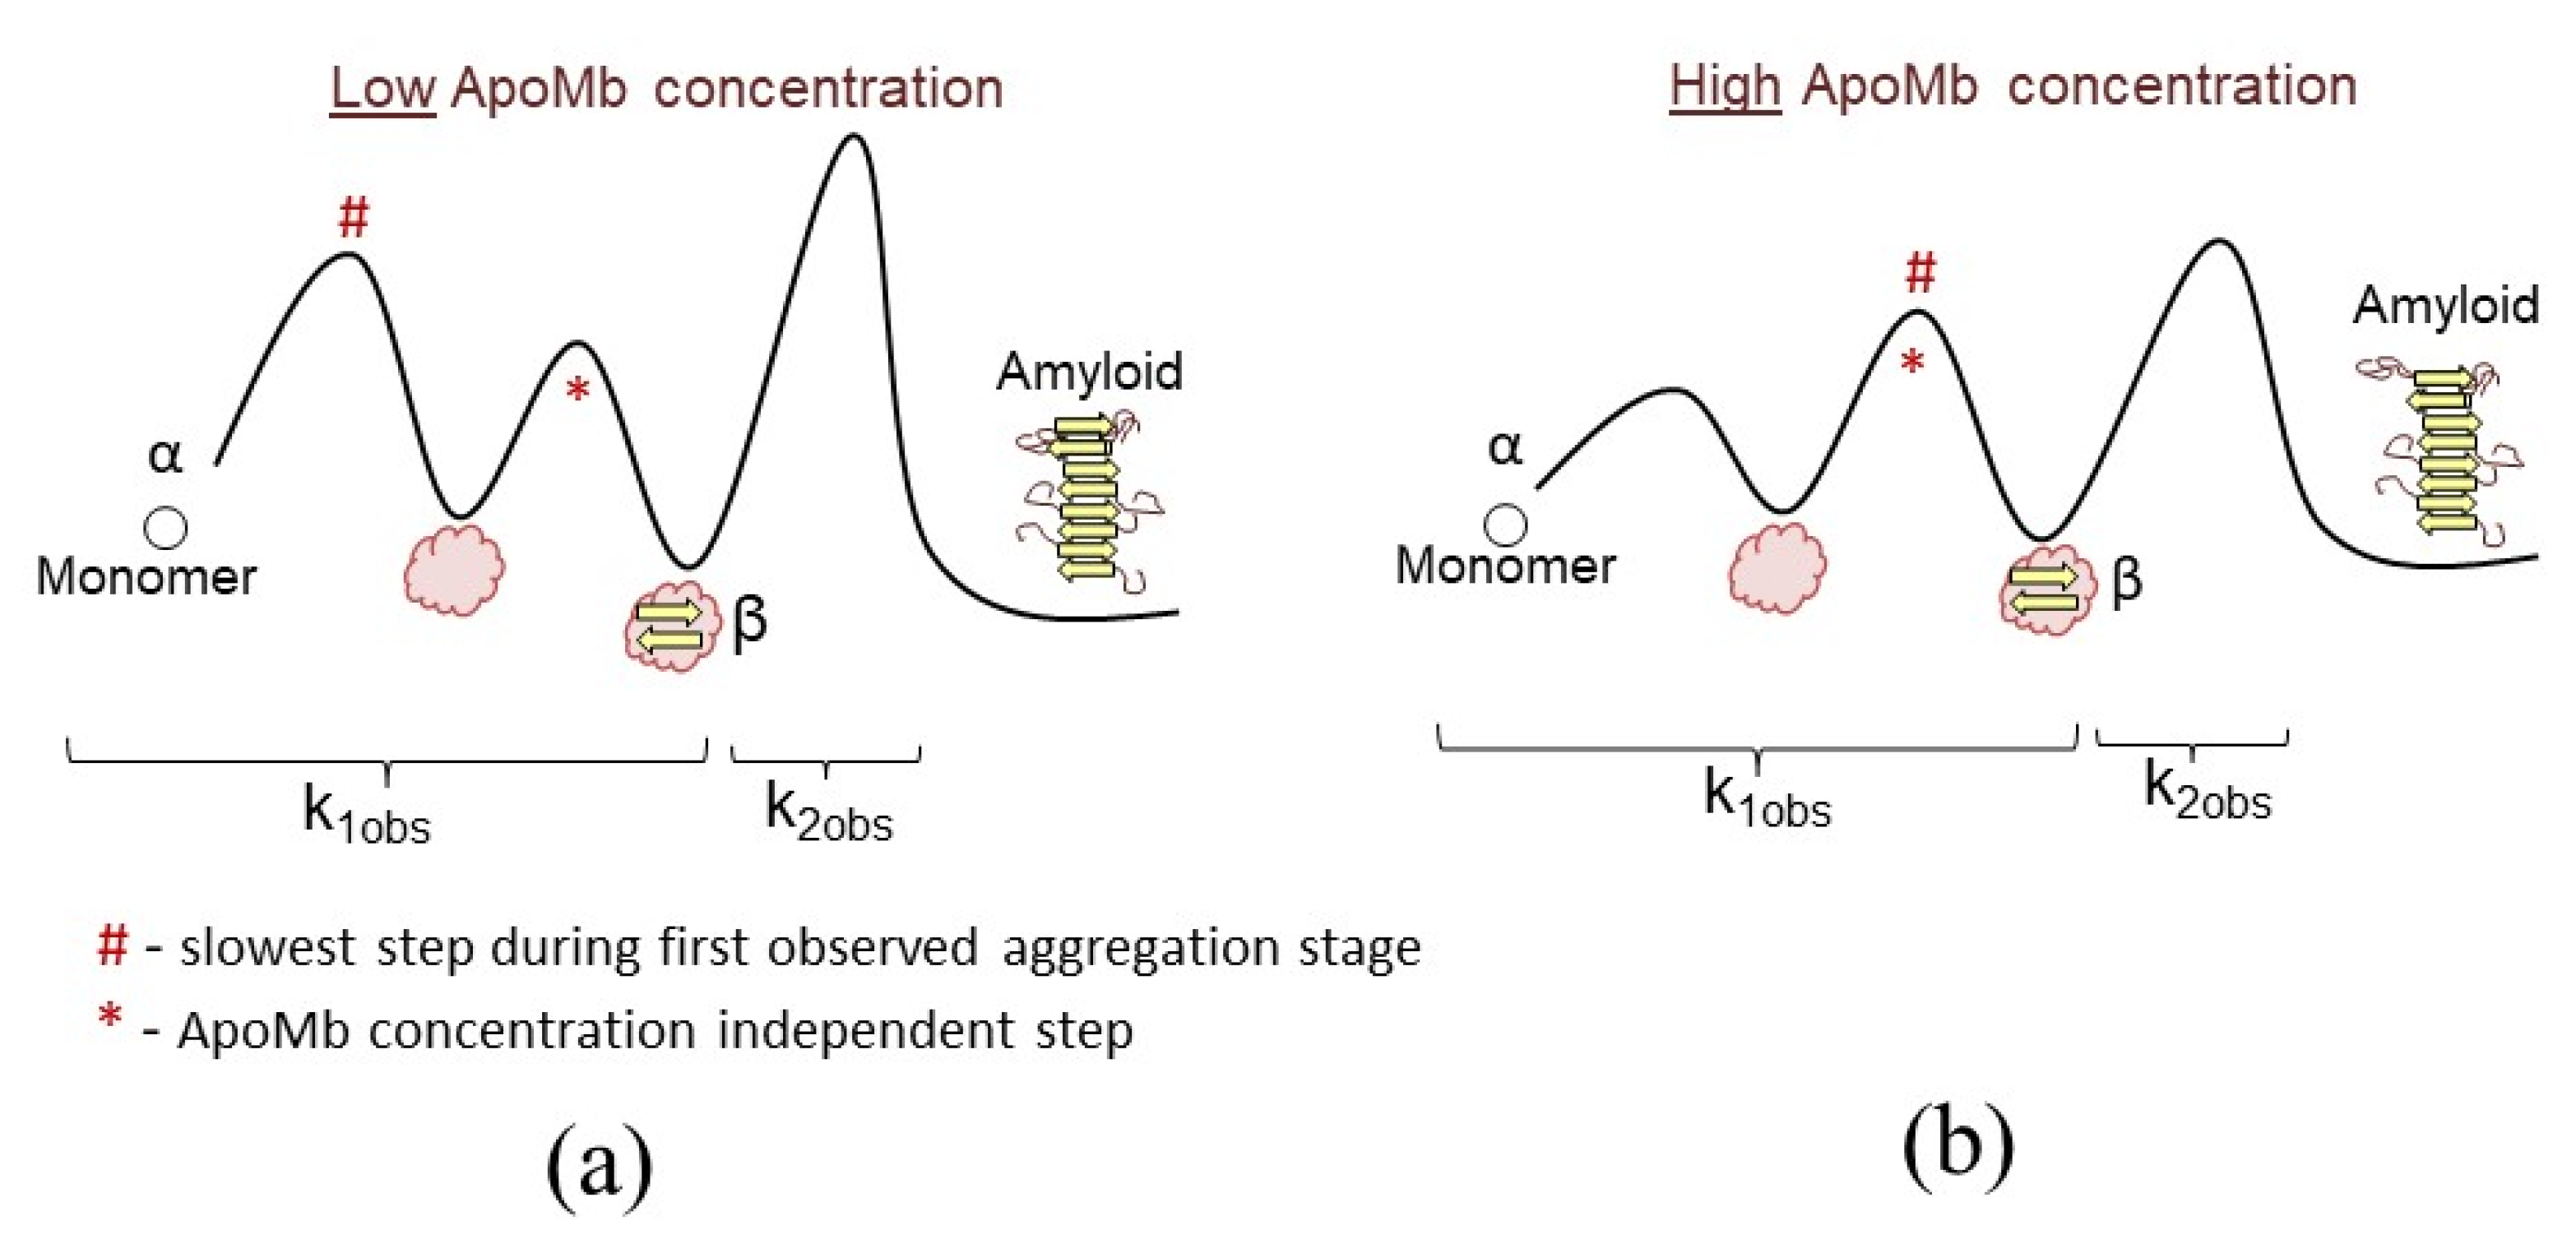
4.1. Association and Conformational Rearrangements during Amyloid Aggregation

A specific feature of amyloid fibrils is the presence of a cross-β-structure, which differs from the β-structure of globular proteins in its greater regularity and less twisting [23,24]. Therefore, the process of amyloid formation includes not only the association of protein molecules but also structural rearrangements leading to the formation of a highly regular cross-β-structure. In addition, the toxicity of amyloid aggregates depends on the content and structural features of the cross-β-structure, so the control of conformational rearrangements may be important for the treatment of amyloidosis [25,26]. However, most of the work performed to date has focused on the protein association, and the mechanism of conformational rearrangements remains insufficiently studied.
In this work, the impact of amino acid substitutions on both the association and the rate of conformational rearrangements were examined through investigating ApoMb, a model protein. Through experiments that aimed to investigate the concentration dependence on the rate of amyloid formation, a previously hidden stage of conformational rearrangements within the aggregates has been revealed. It was shown that the rate of molecules association is influenced by the hydrophobicity of amino acid residues, whereas the position of the mutation determines the rate of conformational rearrangements.
The effect of substitution localization on the kinetics of structural rearrangements is a novel and unexpected result. To explain it, it is important to answer the question, what do mutants with substitutions at the same position have in common? Usually, mutations lead not only to a change in the stability of the native state, but also to a change in the protein structure. The NMR data revealed that the structure of both the native and intermediate states of ApoMb are affected by single amino acid substitutions, not only near the mutation site but also at some distance [36]. It is likely that mutations in the same positions change the structure in the same region of the protein molecule. The obtained data assumed that both studied substitutions lead to a change in the structural features of the protein region, forming β-structure in α-helical ApoMb. Structural changes due to the substitution of V10 slow down conformational rearrangements compared to wild-type ApoMb, while W14 mutations accelerate this stage.

4.2. The Reversibility of ApoMb Amyloid Formation

One of the most important and unexplored issues in the field of protein aggregation is the reversibility of amyloid formation. It is generally assumed that due to the high stability of the fibrils, amyloid aggregation is an irreversible process [28]. Therefore, when investigating the amyloid formation of protein mutants, only the effect of the substitutions on the molecule’s aggregation is considered, while the reversed process is neglected. The results of our work conclude that the ApoMb amyloid formation is reversible, and there is equilibrium between the monomer and the aggregates. The removal of the monomer from the solution shifts the equilibrium and induces the dissociation of amyloids to a monomeric protein.
A consequence of the reversibility of amyloid formation is the presence of a monomeric protein after aggregation completion. The residual concentration of a monomer can serve as a quantitative measure of its stability relative to the aggregates: a high equilibrium monomer concentration corresponds to a low aggregate stability. The mutations significantly shift the equilibrium between the aggregates and monomer. In the case of wild-type ApoMb, about 20% of protein molecules are involved in the amyloid formation, whereas variants with substitutions V10F, W14F, and V10AM131A are almost completely involved in the formation of fibrils and show high aggregate stability.
Thus, this work shows the reversibility of ApoMb amyloid aggregation and describes experimental approaches for its study. We suppose that the future investigation of this issue can not only provide new insight into the biophysical mechanism of amyloid aggregation, but also open up new opportunities for amyloidosis treatment.

Supplementary Materials

The following supporting information can be downloaded at: https://www.mdpi.com/article/10.3390/physchem3030021/s1, Figure S1: Kinetics of ApoMb V10F amyloid aggregation at various protein concentration; Figure S2: Electrophoregram of WT ApoMb solutions before and after 24 h incubation at 40 °C at different protein concentrations.

Author Contributions

Conceptualization, N.K. and V.B.; methodology, N.K., N.R., V.B. and I.K.; investigation, V.M., A.G., N.I. and M.M.; writing—original draft preparation, N.K.; writing—review and editing, N.K. and V.M.; visualization, N.R. All authors have read and agreed to the published version of the manuscript.

Funding

This research was funded by the Russian Science Foundation, grant number 21-14-00268.

Data Availability Statement

All data are available within the article.

Acknowledgments

The authors are thankful to A.V. Finkelstein and V.E. Bychkova for the helpful discussion of obtained results, to P.E. Wright for providing plasmid with ApoMb gene, to D.A. Dolgikh for construction of plasmids containing ApoMb mutants, to S.E. Permyakov and A.S. Kazakov for assistance in measuring FTIR spectra, and to V.D. Vasiliev for obtaining the EM images. Assistance in obtaining microscopy images was provided by the Electron Microscopy Core Facilities of the Pushchino Center of Biological Research No. 670266.

Conflicts of Interest

The authors declare no conflict of interest.

References

  1. Makin, O.S.; Atkins, E.; Sikorski, P.; Johansson, J.; Serpell, L.C. Molecular basis for amyloid fibril formation and stability. Proc. Natl. Acad. Sci. USA 2005, 102, 315–320. [Google Scholar] [CrossRef]
  2. Knowles, T.P.; Vendruscolo, M.; Dobson, C.M. The amyloid state and its association with protein misfolding diseases. Nat. Rev. Mol. Cell. Biol. 2014, 15, 384–396. [Google Scholar] [CrossRef]
  3. Chiti, F.; Dobson, C.M. Protein misfolding, functional amyloid, and human disease. Annu. Rev. Biochem. 2006, 75, 333–366. [Google Scholar] [CrossRef] [Green Version]
  4. Salahuddin, P.; Fatima, M.T.; Abdelhameed, A.S.; Nusrat, S.; Khan, R.H. Structure of amyloid oligomers and their mechanism of toxicities: Targeting amyloid oligomers using novel therapeutic approaches. Eur. J. Med. Chem. 2016, 23, 41–58. [Google Scholar] [CrossRef] [PubMed]
  5. Bucciantini, M.; Giannoni, E.; Chiti, F.; Baroni, F.; Formigli, L.; Zurdo, J.; Taddei, N.; Ramponi, G.; Dobson, C.M.; Stefani, M. Inherent toxicity of aggregates implies a common mechanism for protein misfolding diseases. Nature 2002, 416, 507–511. [Google Scholar] [CrossRef] [PubMed]
  6. Winner, B.; Jappelli, R.; Maji, S.K.; Desplats, P.A.; Boyer, L.; Aigner, S.; Hetzer, C.; Lo-her, T.; Vilar, M.; Campioni, S.; et al. In vivo demonstration that alpha-synuclein oligomers are toxic. Proc. Natl. Acad. Sci. USA 2011, 108, 4194–4199. [Google Scholar] [CrossRef] [PubMed]
  7. Habchi, J.; Chia, S.; Limbocker, R.; Manini, B.; Ahh, M.; Perni, M.; Hansson, O.; Arosio, P.; Kumita, J.R.; Challa, P.K.; et al. Systematic development of small molecules to inhibit specific microscopic steps of Aβ42 aggregation in Alzheimer’s disease. Proc. Natl. Acad. Sci. USA 2017, 114, E200–E208. [Google Scholar] [CrossRef]
  8. Goldstein, R.F.; Stryer, L. Cooperative polymerization reactions. Analytical approximations, numerical examples, and experimental strategy. Biophys. J. 1986, 50, 583–599. [Google Scholar] [CrossRef] [Green Version]
  9. Cohen, S.I.A.; Vendruscolo, M.; Dobson, C.M.; Knowles, T.P.J. From macroscopic measurements to microscopic mechanisms of protein aggregation. J. Mol. Biol. 2012, 421, 160–171. [Google Scholar] [CrossRef]
  10. Lomakin, A.; Chung, D.S.; Benedek, G.B.; Kirschner, D.A.; Teplow, D.B. On the nucleation and growth of amyloid beta-protein fibrils: Detection of nuclei and quantitation of rate constants. Proc. Natl. Acad. Sci. USA 1996, 93, 1125–1129. [Google Scholar] [CrossRef]
  11. Cohen, S.I.A.; Linse, S.; Luheshi, L.M.; Hellstrand, E.; White, D.A.; Rajah, L.; Otzen, D.E.; Vendruscolo, M.; Dobson, C.M.; Knowles, T.P.J. Proliferation of amyloid-β42 aggregates occurs through a secondary nucleation mechanism. Proc. Natl. Acad. Sci. USA 2013, 110, 9758–9763. [Google Scholar] [CrossRef]
  12. Gillam, J.E.; MacPhee, C.E. Modelling amyloid fibrils formation kinetics: Mechanism of nucleation growth. J. Phys. Condens. Matter. 2013, 25, 373101. [Google Scholar] [CrossRef]
  13. Chiti, F.; Taddei, N.; Baroni, F.; Capanni, C.; Stefani, M.; Ramponi, G.; Dobson, C.M. Kinetic partitioning of protein folding and aggregation. Nat. Struct. Biol. 2002, 9, 137–143. [Google Scholar] [CrossRef] [PubMed]
  14. Calamai, M.; Taddei, N.; Stefani, M.; Ramponi, G.; Chiti, F. Relative influence of hydrophobicity and net charge in the aggregation of two homologous proteins. Biochemistry 2003, 42, 15078–15083. [Google Scholar] [CrossRef] [PubMed]
  15. Chiti, F.; Stefani, M.; Taddei, N.; Ramponi, G.; Dobson, C.M. Rationalization of the effects of mutations on peptide and protein aggregation rates. Nature 2003, 424, 805–808. [Google Scholar] [CrossRef]
  16. Tjernberg, L.; Hosia, W.; Bark, N.; Thyberg, J.; Johansson, J. Charge attraction and beta propensity are necessary for amyloid fibril formation from tetrapeptides. J. Biol. Chem. 2002, 277, 43243–43246. [Google Scholar] [CrossRef] [PubMed] [Green Version]
  17. Plakoutsi, G.; Bemporad, F.; Monti, M.; Pagnozzi, D.; Pucci, P.; Chiti, F. Exploring the mechanism of formation of native-like and precursor amyloid oligomers for the native acylphosphatase from Sulfolobus solfataricus. Structure 2006, 14, 993–1001. [Google Scholar] [CrossRef] [Green Version]
  18. Marin-Argany, M.; Guell-Bosch, J.; Blancas-Mejia, L.M.; Villegas, S.; Ramirez-Alvarado, M. Mutations can cause light chains to be too stable or too unstable to form amyloid fibrils. Protein Sci. 2015, 24, 1829–1840. [Google Scholar] [CrossRef] [Green Version]
  19. Cerda-Costa, N.; Esteras-Chopo, A.; Aviles, F.X.; Serrano, L.; Villegas, V. Early kinetics of amyloid fibril formation reveals conformational reorganization of initial aggregates. J. Mol. Biol. 2007, 366, 1351–1363. [Google Scholar] [CrossRef]
  20. Serio, T.R.; Cashikar, A.G.; Kowal, A.S.; Sawicki, G.J.; Moslehi, J.J.; Serpell, L.; Arnsdorf, M.F.; Lindquist, S.L. Nucleated conformational conversion and the replication of conformational information by a prion. Science 2000, 289, 1317–1321. [Google Scholar] [CrossRef] [Green Version]
  21. Kumar, S.; Mohanty, S.K.; Udgaonkar, J.B. Mechanism of formation of protofibrils of barstar from soluble oligomers: Evidence for multiple steps and lateral association coupled to conformational conversion. J. Mol. Biol. 2007, 367, 1186–1204. [Google Scholar] [CrossRef] [PubMed]
  22. Leonil, J.; Henry, G.; Jouanneau, D.; Delage, M.M.; Forge, V.; Putaux, J.L. Kinetics of fibril formation of bovine kappa-casein indicate a conformational rearrangement as a critical step in the process. J. Mol. Biol. 2008, 381, 1267–1280. [Google Scholar] [CrossRef] [PubMed]
  23. Zandomeneghi, G.; Krebs, M.R.H.; McCammon, M.G.; Fandrich, M. FTIR reveals structural differences between native beta-sheet proteins and amyloid fibrils. Protein Sci. 2004, 13, 3314–3321. [Google Scholar] [CrossRef] [Green Version]
  24. Biancalana, M.; Makabe, K.; Koide, A.; Koide, S. Molecular mechanism of thioflavin-T binding to the surface of beta-rich peptide self-assemblies. J. Mol. Biol. 2009, 385, 1052–1063. [Google Scholar] [CrossRef] [PubMed] [Green Version]
  25. Vignaud, H.; Bobo, C.; Lascu, I.; Sorgjerd, M.K.; Zako, T.; Maeda, M.; Salin, B.; Lecomte, S.; Cullin, C. A structure-toxicity study of Aβ42 reveals a new anti-parallel aggregation pathway. PLoS ONE 2013, 8, e80262. [Google Scholar] [CrossRef] [Green Version]
  26. Celej, M.S.; Sarroukh, R.; Goormaghtigh, E.; Fidelio, G.D.; Rysschaert, J.-M.; Raussens, V. Toxic prefibrillar α-synuclein amyloid oligomers adopt distinctive antiparallel β-sheet structure. Biochem. J. 2012, 443, 719–726. [Google Scholar] [CrossRef]
  27. Hoshino, M. Fibril formation from the amyloid β-peptide is governed by a dynamic equilibrium involving association and dissociation of the monomer. Biophys. Rev. 2017, 9, 9–16. [Google Scholar] [CrossRef] [Green Version]
  28. Gazit, E. The “Correctly Folded” state of proteins: Is it a metastable state? Angew. Chem. Int. Ed. Engl. 2002, 41, 257–259. [Google Scholar] [CrossRef]
  29. Buell, A.K. Stability matters, too—the thermodynamics of amyloid fibril formation. Chem. Sci. 2022, 13, 10177–10192. [Google Scholar] [CrossRef]
  30. Pashley, C.L.; Hewitt, E.W.; Radford, S.E. Comparison of the aggregation of homologous β2-microglobulin variants reveals protein solubility as a key determinant of amyloid formation. J. Mol. Biol. 2016, 428, 631–643. [Google Scholar] [CrossRef] [Green Version]
  31. Williams, A.D.; Portelius, E.; Kheterpal, I.; Guo, J.-T.; Cook, K.D.; Xu, Y.; Wetzel, R. Mapping abeta amyloid fibril secondary structure using scanning proline mutagenesis. J. Mol. Biol. 2004, 335, 833–842. [Google Scholar] [CrossRef] [PubMed]
  32. O’Nuallain, B.; Shivaprasad, S.; Kheterpal, I.; Wetzel, R. Thermodynamics of A beta(1–40) amyloid fibril elongation. Biochemistry 2005, 44, 12709–12718. [Google Scholar] [CrossRef] [PubMed]
  33. Katina, N.S.; Balobanov, V.A.; Ilyina, N.B.; Vasiliev, V.D.; Marchenkov, V.V.; Glukhov, A.S.; Nikulin, A.D.; Bychkova, V.E. sw ApoMb amyloid aggregation under non-denaturing conditions: The role of native structure stability. Biophys. J. 2017, 113, 991–1001. [Google Scholar] [CrossRef] [PubMed] [Green Version]
  34. Eliezer, D.; Wright, P.E. Is apomyoglobin a molten globule? Structural characterization by NMR. J. Mol. Biol. 1996, 263, 531–538. [Google Scholar] [CrossRef]
  35. Griko, Y.V.; Privalov, P.L. Thermodynamic puzzle of apomyoglobin unfolding. J. Mol. Biol. 1994, 235, 1318–1325. [Google Scholar] [CrossRef]
  36. Nishimura, C.; Dyson, H.J.; Wright, P.E. Identification of native and non-native structure in kinetic folding intermediates of apomyoglobin. J. Mol. Biol. 2006, 355, 139–156. [Google Scholar] [CrossRef]
  37. Fandrich, M.; Forge, V.; Buder, K.; Kittler, M.; Dobson, C.M.; Diekmann, S. Myoglobin forms amyloid fibrils by association of unfolded polypeptide segments. Proc. Natl. Acad. Sci. USA 2003, 100, 15463–15468. [Google Scholar] [CrossRef]
  38. Sirangelo, I.; Malmo, C.; Iannuzzi, C.; Mezzogiorno, A.; Bianco, M.R.; Papa, M.; Irace, G. Fibrillogenesis and cytotoxic activity of the amyloid-forming apomyoglobin mutant W7FW14F. J. Biol. Chem. 2004, 279, 13183–13189. [Google Scholar] [CrossRef] [Green Version]
  39. Picotti, P.; Franceschi, G.D.; Frare, E.; Spolaore, B.; Zambonin, M.; Chiti, F.; Polverino de Laureto, P.; Fontana, A. Amyloid fibril formation and disaggregation of fragment 1-29 of apomyoglobin: Insight into the effect of pH on protein fibrillogenesis. J. Mol. Biol. 2007, 367, 1237–1245. [Google Scholar] [CrossRef]
  40. Samatova, E.N.; Katina, N.S.; Balobanov, V.A.; Melnik, B.S.; Dolgikh, D.A.; Bychkova, V.E.; Finkelstein, A.V. How strong are side chain interactions in the folding intermediate? Protein Sci. 2009, 18, 2152–2159. [Google Scholar] [CrossRef] [Green Version]
  41. Gill, S.C.; von Hippel, P.H. Calculation of protein extinction coefficients from amino acid sequence data. Anal. Biochem. 1989, 182, 319–326. [Google Scholar] [CrossRef]
  42. Marchenkov, V.; Ivashina, T.; Marchenko, N.; Ryabova, N.; Selivanova, O.; Timchenko, A.; Kihara, H.; Ksenzenko, V.; Semisotnov, G. In vivo incorporation of photoproteins into GroEL chaperonin retaining structural and functional properties. Molecules 2023, 28, 1901. [Google Scholar] [CrossRef] [PubMed]
  43. Katina, N.S.; Ilyina, N.B.; Kashparov, I.A.; Balobanov, V.A.; Vasiliev, V.D.; Bychkova, V.E. Apomyoglobin mutants with single point mutations at val10 can form amyloid structures at permissive temperature. Biochemistry 2011, 76, 555–563. [Google Scholar] [CrossRef]
  44. Pollard, T.D.; De La Cruz, E.M. Take advantage of time in your experiments: A guide to simple, informative kinetics assays. Mol. Biol. Cell 2013, 24, 1103–1110. [Google Scholar] [CrossRef] [PubMed]
  45. Finkelstein, A.V.; Dovidchenko, N.V.; Galzitskaya, O.V. What is responsible for atypical dependence of the rate of amyloid formation on protein concentration: Fibril-catalyzed initiation of new fibrils or competition with oligomers? J. Phys. Chem. Lett. 2018, 9, 1002–1006. [Google Scholar] [CrossRef]
  46. DuBay, K.F.; Pawar, A.P.; Chiti, F.; Zurdo, J.; Dobson, C.M.; Vendruscolo, M. Prediction of the absolute aggregation rates of amyloidogenic polypeptide chains. J. Mol. Biol. 2004, 341, 1317–1326. [Google Scholar] [CrossRef] [PubMed]
  47. Tartaglia, G.G.; Cavalli, A.; Pellarin, R.; Caflish, A. The role of aromaticity, exposed surface, and dipole moment in determining protein aggregation rates. Protein Sci. 2004, 13, 1939–1941. [Google Scholar] [CrossRef] [PubMed]
  48. Rawat, P.; Prabakaran, R.; Kumar, S.; Gromiha, M.M. AbsoluRATE: An in-silico method to predict the aggregation kinetics of native proteins. Biochim. Biophys. Acta Proteins Proteom. 2021, 1896, 140682. [Google Scholar] [CrossRef]
  49. Harper, J.D.; Lansbury, P.T. Models of amyloid seeding in Alzheimer’s disease and scrapie: Mechanistic truths and physiological consequences of the time-dependent solubility of amyloid proteins. Annu Rev. Biochem. 1997, 66, 385–407. [Google Scholar] [CrossRef]
Figure 1. The non–denaturing electrophoresis data for samples at different time points of ApoMb V10F incubation at 40 °C and kinetics of aggregation plotted according to the electrophoregram (a); FTIR spectra of ApoMb before and after 8 h incubation (b); kinetics of amyloid aggregation obtained by ThT fluorescence and FTIR spectroscopy (c); electron micrographs of solutions after 48 min (d), and 8 h aggregation, globular (ga), rod–like (ra) aggregates, and fibrils (f) are marked by arrows (e); proposed model of ApoMb amyloid formation (f).
Physchem 03 00021 g001
Figure 2. Concentration dependence of the rate constant (a) and amplitude (b) of the first stage of ApoMb V10F amyloid formation; concentration dependence of the second aggregation rate (c); proposed model of ApoMb amyloid aggregation (d).
Physchem 03 00021 g002
Figure 3. Free energy profiles of ApoMb amyloid aggregation at low (a) and high (b) protein concentration.
Physchem 03 00021 g003
Figure 4. Amyloid formation kinetic of ApoMb wild-type and its variants.
Physchem 03 00021 g004
Figure 5. The first rate constant of the ApoMb variants aggregation as a function of the fraction of the native and intermediate states (a), changes in the residue hydrophobicity (b), and mutation positions (c).
Physchem 03 00021 g005
Figure 6. The dependences of the ApoMb variants’ second rate constant of aggregation on changes in the residues hydrophobicity (a), and mutations positions (b).
Physchem 03 00021 g006
Figure 7. Non-denaturing electrophoregram of ApoMb variants after aggregation completion (a); monomer band intensity of solutions before and after amyloid formation at various WT ApoMb concentrations, the numbers at arrows indicate the fraction of the monomeric protein after aggregation completion (b); kinetics after dilution (from 290 µM to 60 µM) of the solution with non-purified (1) and purified (2) amyloids (c); non-denaturing electrophoregram of purified amyloid solution before (1) and after (2) its incubation at 40 °C during 6 h (d).
Physchem 03 00021 g007
Table 1. Amyloid formation rates, residual monomer band intensity, and properties of ApoMb variants, arranged according to the hydrophobicity increase.
ApoMb
Variant
k1obs (h−1)k2obs (h−1)fI (%) aΔhydrophobicity (kcal/mol) bMonomer Band Intensity (a.u.) c
W14A5.21 ± 0.090.10 ± 0.0269.4 ± 6.1−1.740.08 ± 0.01
V10AM131A2.73 ± 0.270.25 ± 0.0852.8 ± 4.7−1.480.09 ± 0.02
V10A2.56 ± 0.240.32 ± 0.0718.2 ± 0.9−0.900.49 ± 0.01
WT3.34 ± 0.140.26 ± 0.0516.6 ± 0.601.00 ± 0
W14F4.60 ± 0.010.44 ± 0.0124.7 ± 2.20.140.34 ± 0.02
V10F2.61 ± 0.120.42 ± 0.0425.3 ± 0.60.970.11 ± 0.02
a—The data are from [33]; b—the data are from [15]; c—normalized to WT protein.
Disclaimer/Publisher’s Note: The statements, opinions and data contained in all publications are solely those of the individual author(s) and contributor(s) and not of MDPI and/or the editor(s). MDPI and/or the editor(s) disclaim responsibility for any injury to people or property resulting from any ideas, methods, instructions or products referred to in the content.

