
Examining the Hydration Behavior of Aqueous Calcium Chloride (CaCl2) Solution via Atomistic Simulations
1
Department of Mechanical Engineering & Mechanics, Lehigh University, Bethlehem, PA 18015, USA
2
Packard Laboratory 561, 19 Memorial Drive West, Bethlehem, PA 18015, USA
*
Author to whom correspondence should be addressed.
Physchem 2023, 3(3), 319-331; https://doi.org/10.3390/physchem3030022
Submission received: 14 June 2023
/
Revised: 27 July 2023
/
Accepted: 2 August 2023
/
Published: 5 August 2023
(This article belongs to the Section Theoretical and Computational Chemistry)
Abstract
:Equilibrium molecular dynamics simulations are performed to examine the hydration behavior of Ca2+ and Cl− across a wide range of salt concentrations (from 1 wt.% to 60 wt.% CaCl2) in an aqueous solution. The predicted radial distribution functions (RDFs) and coordination numbers (CNs) of Ca2+–water, Cl−–water, and Ca2+–Cl− agree with the previous studies conducted at concentrations below the solubility limit at room temperature. The hydration limit of aqueous calcium chloride solution is identified at 10 wt.% CaCl2 as the CNs remain constant below it. Beyond the bulk solubility limit ~44.7 wt.% CaCl2, a noticeable decrease in the CN of Cl− and water is recorded, implying the saturation of the solution. The solvating water molecules decrease with increasing salt concentration, which can be attributed to the growth in the number of ion pairs.
1. Introduction
In aqueous electrolyte solutions, the structure and coordination of water molecules around a solute vary with relative concentrations, contributing to differences in the thermodynamic properties of the solution, such as specific heat and freezing temperature. These molecular scale effects can have a pronounced effect of the macroscopic properties. For instance, an aqueous calcium chloride (CaCl2) solution with a solute concentration of 50.7 wt.% has a freezing point of ~29 °C and can release latent energy of ~170 kJ/kg upon freezing [1]. In the solid phase, calcium chloride hexahydrate (CaCl2·6H2O) is employed as an inorganic phase-change material (PCM). The relatively high volumetric energy storage capacity within a narrow range of temperatures, together with an inexpensive and wide availability of the salt, situate it as a promising candidate for low-temperature thermochemical energy storage applications [2]. Additionally, Ca2+ and Cl− ions play useful biological roles for chemical bond activation and cell osmotic pressure, respectively [3]. One of the driving mechanisms for such characteristics is the hydration behavior of the solute resulting from ion–ion and ion–water interactions [4], which has been well studied using various methods [5,6,7,8]. Ion–ion interactions, also known as ionic bonding, result from the electrostatic attraction between oppositely charged ions. These interactions significantly affect the structural characteristics of the hydration shell, altering the physical and chemical properties of the solute in solution. On the other hand, ion–water interactions involve the attraction between water molecules and ions, governed by electrostatic forces. These forces orient the water molecules in the hydration shell in specific directions and influence their mobility.
X-ray diffraction (XRD), neutron diffraction (ND) and extended X-ray absorption fine structure (EXAFS) measurements are commonly used experimental methods to study the hydration behavior of the aqueous electrolyte solution [9,10,11,12,13,14]. Todorova et al. [13] summarized experimental results on the average Ca-O distance in a CaCl2 solution as ranging from 2.39 to 2.46 Å, and the coordination number (CN) as ranging between 5.5 and 10.0. Wang et al. [15] reported that the distance and CN of the first hydration shell of Ca2+ in a CaCl2 solution to be 2.41–2.43 Å and 6.2–6.7 using an X-ray scattering method, respectively. These results imply that the experimental measurements have been inconclusive.
Molecular simulations allow for the examination of aqueous salt solutions at the nanoscale, where the physical interactions of the associated atoms can be analyzed. Smith et al. [16] discussed in their review the recent advancements in forcefields and methodology for calculating solubility and osmotic pressure in molecular simulations of aqueous electrolyte solutions. Moucka and Lisal et al. [17,18,19,20] utilized a rigorous thermodynamic method to compute the salt solubility via osmotic molecular simulations. Megyes et al. [12] used diffraction methods and molecular dynamics (MD) simulation to study the solution structures of 2.5 M and 4.0 M aqueous solutions of CaCl2. They found that the distance of the first hydration shell of Ca2+ was between 2.43 and 2.46 Å, as determined using both experimental methods and MD simulation. Biriukov et al. [10] studied a concentrated 7.3 M CaCl2 solution based on five different forcefields [21,22,23,24,25], three with scaled charges and two others based on the Ca-NDIS data. Their results showed that coordination numbers for Ca-Cl, Ca-O, and Cl-O were within the ranges of 0.1–1.5, 4.5–7.1, and 6.3–8.8, respectively. For self-diffusion coefficient predictions, models with scaled charges rendered a better performance than those with absolute charges; however, the authors noted that full-charge models are important and apt for predicting certain properties, including Gibbs free energy of hydration and ion–water distances.
While multiple reports are available in the literature examining the salt-water coordination, both experimentally and computationally [3,12,26,27], these efforts are focused on the dilute solution regime, providing a limited understanding of molecular interactions for concentrated solutions that can be potentially considered for slurry-based PCMs. Herein lies the novelty and originality of our work; we extend the focus of our investigation into the realm of concentrated solutions. To achieve this goal, a scrutiny of the aqueous CaCl2 solution is conducted from the dilute (1 wt.%) to a beyond-saturated concentration above the solubility (44.7 wt.%), and we identify the hydration limit using molecular dynamics (MD) simulations. Our findings reveal a notable decrease in the number of water molecules solvating the ions with increasing concentrations, contributing to increased ion pair formation and reduced coordination numbers between the hydration and solubility limits. This insight on the behavior of concentrated CaCl2 solutions addresses the knowledge void in the current literature, and provides a fundamental basis for both future theoretical research and practical applications.
2. Simulation Methods
To investigate the hydration characteristics of Ca2+ and Cl− ions, equilibrium MD simulations are employed with the GROMACS package [28,29], while the RasMol [30] tool is used for the visualization and postprocessing of the recorded atomic trajectories. An electrostatically neutral cuboidal simulation box of 6 × 6 × 6 nm3 is set up to contain specified numbers of randomly distributed Ca2+, Cl− ions, and water molecules as a function of the salt concentrations, as shown in Table 1. Two representative simulation boxes at 1 and 60 wt.% CaCl2 are shown in Figure 1. The simulation domain is first equilibrated at 298.15 K and 1 atm. pressure under the isothermal–isobaric (NPT) ensemble for 5 nanoseconds (ns) under the V-rescale thermostat and Berendsen barostat with coupling time constants of 2 picoseconds (ps). Next, the canonical (NVT) simulation is performed at the same temperature for 10 ns as the production run. For concentrations of 50, 55, and 60 wt.%, an additional 25 ns is implemented to account for their extended ion-pairing time. The temperature is restrained by the Nose–Hoover thermostat [31] with a time constant of 2 ps to control the period of the temperature oscillations at equilibrium. All simulations are independently repeated three times, using a timestep of 0.001 ps and the leap-frog integrator.
The water molecules are modeled by the flexible three-site simple point charge (SPC) potential [32], which has demonstrated a superior performance on the dynamical and dielectric properties [33] of bulk water relative to the rigid water model. The Lennard-Jones potential parameters for the nonbonded van der Waals and Coulomb interactions are obtained from a GROMOS-53A6 forcefield that has successfully replicated the free enthalpies of solvation using the thermodynamic integration approach [34,35]. This combination of GROMOS-53A6 forcefield and SPC water model has been widely employed in the literature [4,13,36]. These parameters, together with those for the bond and angle interactions, are listed in Table 2. Periodic boundaries are implemented along all the three directions, and neighbor lists are created via the Verlet cutoff scheme [37]. Long-rage electrostatics are accounted for using the particle mesh Ewald [38] (PME) scheme. Both the Coulombic and van der Walls functions are truncated at a 1.0 nm cut-off distance. This approach omits any interactions between atom pairs displaced further than this distance, enabling an enhanced computational efficiency. Cross-interaction parameters between the dissimilar species are calculated using the Lorentz–Berthelot mixing rules [39]. The concentration at which ion pairs start to form is defined as the hydration limit, while the solubility limit is attained at a concentration when only ion pairs exist in the solution.
3. Results and Discussion
We examine the coordination behavior for the hydrated ions in the salt solutions with concentrations ranging from 1 to 60 wt.% of CaCl2. Figure 2 illustrates the variations in the radial distribution functions (RDFs), g(r), for Ca2+–water and the corresponding coordination numbers (CNs) of water molecules surrounding a Ca2+ ion in the aqueous solution. We note that the RDF and CN are calculated based on the oxygen (OW) of the water molecule. The RDF [28] is computed as , where the < > represents the average, and is the mean particle density of atom B at a radial distance r from atom A, while is the same physical quantity but considered over all such spheres around A, with a maximum extent being half of the simulation domain dimension. The CN indicates the number of water molecules present in each neighboring spherical shell, and obtained through the integration of the RDF [28], i.e., .
The first hydration shell around a Ca+ ion is recorded at a distance of 0.23 nm, as noted by the RDF peak in Figure 2a. The radius of the first shell of water molecules surrounding Ca2+ is also illustrated in Figure 2b,e. Beyond the first shell, gCaOw(r) becomes zero from 0.30 to 0.38 nm due to absence of water molecules and subsequently gCaOw(r) increases at about 0.47 nm, indicating the occurrence of a second hydration shell across the range of concentrations for the solution, from dilute to concentrated. Due to their negative partial charges, the oxygen atoms in the water molecules are attracted to the Ca2+ ions. Consequently, the hydrogen atoms being on the outer surface of the hydration shell creates an effective positive charge around the shell. This positive-charge surface of the first shell only weakly attracts other water molecules, forming a second hydration shell corresponding to the second smaller peak in Figure 2a. The occurrence of the rather weak second hydration shell around Ca2+ ions is also noted from the coordination number curve whose slope changes at 0.47 nm, which is the location of the second peak.
With increasing salt concentration, the intensity of the first peak drops due to the changes in the cation hydration structure. The coordination number CNCaOw decreases from 8 at dilute CaCl2 solutions to ~3 for the 60 wt.% CaCl2 solution. Figure 2b,e presents the first hydration shell around Ca2+ for several selected solutions. For the 10 wt.% and 20 wt.% CaCl2 solutions, there are eight water molecules surrounding the Ca2+ ion, creating the first hydration shell. However, with increasing CaCl2 concentrations, fewer water molecules are able to surround the salt cations to construct the hydration shell. As shown in Figure 2d,e, the first hydration shell contains only six and three water molecules for the 40 wt.% and 60 wt.% CaCl2 solution because the Cl− ions present in the concentrated solutions replace the water molecules to form ion pairs with Ca2+.
The ion pairs are illustrated in Figure 3. In Figure 3a, the gCaCl(r) profile suggests that for dilute CaCl2 solutions below the hydration limit (~10 wt.% CaCl2), only a sparse number of Cl− ions are present around Ca2+ ions until about 0.51 nm. This long distance implies that no ion pair exists in the dilute salt solutions. For the CaCl2 concentrations above the hydration limit, the first, as well as the highest, peak occurs at 0.276 nm and the corresponding coordination number CNCaCl ranges from 0 to 3 across the concentration regime. Similar to the hydration shell of the Ca2+ ions, the gCaCl(r) then decreases to and persists at 0 for a short distance from 0.330 to 0.410 nm. Subsequently, a weaker peak is realized at 0.512 nm, which gradually decreases with increasing concentrations. Figure 3b,e representatively describes the locations of the five nearest Cl− ions to the Ca2+ ion. In Figure 3b,c, for the salt solutions with 10 wt.% and 20 wt.% CaCl2, no Cl− is located around the Ca2+ until about 0.50 nm. However, as shown in Figure 3d,e, when the concentration of CaCl2 reaches 40 wt.% and above, the Cl− ions are attracted to neighboring Ca2+, thus forming the ion pairs. Therefore, the number of water molecules in the hydration shell of Ca2+ ions decreases (Figure 3a) because the ion pairs replace the water molecules in the hydration shell. With a higher CaCl2 concentration, more ion pairs are formed; there are two Cl− ions around the Ca2+ within 0.300 nm in the 40 wt.% CaCl2 solution, but three in the 60 wt.% CaCl2 solution.
For an exhaustive scrutiny of the solvation characteristics in CaCl2 solutions, the hydration structure of Cl− ions is also studied. Figure 4a shows the RDF and CN profile for Cl− ions and water at different concentrations. The first peaks of gCLOW(r) for all concentrations are at around 0.318 nm. For the concentrated solution, including the 40, 50, and 60 wt.% CaCl2 solutions, an additional weaker peak is identified at 0.514 nm. However, the absence of a plateau between the two peaks in the CN profile indicates that water molecules are always present in the vicinity of Cl− ions even when ion pairs are dominant in the solution. Figure 4b,e presents the hydration shell of Cl− ion in CaCl2 solution with different concentrations. Since Cl− is negatively charged, the hydrogens of water molecules with the positive partial charges align towards the Cl− ion. All the Cl− hydration shells comprise a similar number of water molecules, as explained below.
In addition, the RDF and CN profiles for Ca2+, Cl− ions and water molecules are shown in Figure 5. The first and second RDF peaks resemble the first dominant RDF peak of Ca2+–water and Cl−–water, respectively, but do not replicate the similar intensities. The coordination number corresponding to these two peaks is smaller than the summation of the first coordination number of in Ca2+–water and Cl−–water, which further corroborates that Cl− indeed shares the water molecules from the hydration shell of Ca2+.
Figure 6 presents the variation in the CN for different pairs of species across the range of the simulated salt concentrations. As expected, all CNs remain constant until the hydration limit of the solution at room temperature is attained around 10 wt.% CaCl2. Beyond this salt concentration, as the solution gradually proceeds towards saturation, the CNCaO gradually decreases as an increasing number of ion pairs form, which is also reflected from the CNCaCl that increases (from being nearly zero) beyond the hydration limit. Nevertheless, with increasing CaCl2 concentrations, unlike the CNCaO, the CNClO counterintuitively increases past the hydration limit, suggesting that the number of water molecules also increases in the hydration shell of the Cl− ions. This increase can be attributed to the increasing number of ion pairs. As Ca2+ ions are increasingly surrounded by Cl− ions, the water molecules in the hydration shell of the ion-paired Ca2+ are also counted in the hydration shell of the Cl− ions. Thus, the first peaks of gClO(r) become wider in concentrated solutions, as shown in Figure 4a. The values and trends of the CN profile are in agreement with those found in previous studies [40] for the salt concentration below the solubility limit. However, for CaCl2 fractions above the solubility, CNClO ceases to rise and starts to decrease. The inflection point of increasing CNClO can be regarded as a signature of the CaCl2 solution attaining the solubility limit. As the CaCl2 solution approaches saturation, the water molecules solvating the Ca2+ fail to compensate for the loss of the water molecules from the hydration shell of Cl− ion, thus leading to the decrease in CNClO.
Figure 7 presents the variations of the self-diffusion coefficients of the ions and the water molecules in the solution for different salt concentrations. The predictions from the MD simulations are calculated using the Einstein relation where t, r, and DA, represent time, atom position, and the self-diffusion coefficient [41]. These simulation outcomes are in agreement with the previously published experimental data at dilute concentrations [42]. As the concentration increases, the ion pairs form, impeding the diffusion, and corroborating the solubility behavior [10,43]. The molality above which the ions become significantly sluggish and precipitate corresponds to the findings in Figure 6 from the variations of the CN with increasing salt concentrations, thereby validating our prediction of the solubility limit.
We additionally perform Luzar–Chandler analyses on the solvent–solute system to understand the binding/unbinding times between the ions and the water molecules, and how that reflects on the structure of the solution. Figure 8a describes the variation in function c(t) with the simulation times across all salt concentrations considered. c(t) is representative of the probability of the bonds, predominantly hydrogen bonds, remaining intact with time. It is defined as [44], where h(t) = 1 if a specific pair of water molecules is hydrogen bonded at time t, and h(t) = 0 otherwise. provides the average likelihood, over all pairs of molecules, that a pair initially bonded at time zero remains bonded at time t, while denotes the average probability that any pair of molecules is hydrogen bonded at a given time. We note that with increasing concentration, the bonds tend to persist over a longer duration of the simulation. The positively charged hydrogen of water molecules is attracted to the negatively charged Cl− ions by hydrogen bonding, while the oxygen is attracted to the positively charged Ca2+ ions. It takes a relatively longer time to break the ion pair interactions to enable the dissolution of the salt. The solution reaches a point of complete dissolution as the probability tends to zero. Nonetheless, at higher concentrations, since ion pair formation dominates in lieu of hydration shells, the ion pairs in equilibrium further form hydrogen bonds with surrounding water molecules, denoted by the variation in c(t) for extreme concentrations. Likewise, in Figure 8b, the temporal evolution of the function k(t), defined as [44], reproduces the rate of relaxation towards attaining equilibrium. We find that the rate of change in hydrogen bond population for bonds that have been disrupted ceases monotonically to zero after 80–100 ps, suggesting that the simulation times of 10 ns employed are sufficient to sample the dynamics of the solution at equilibrium.
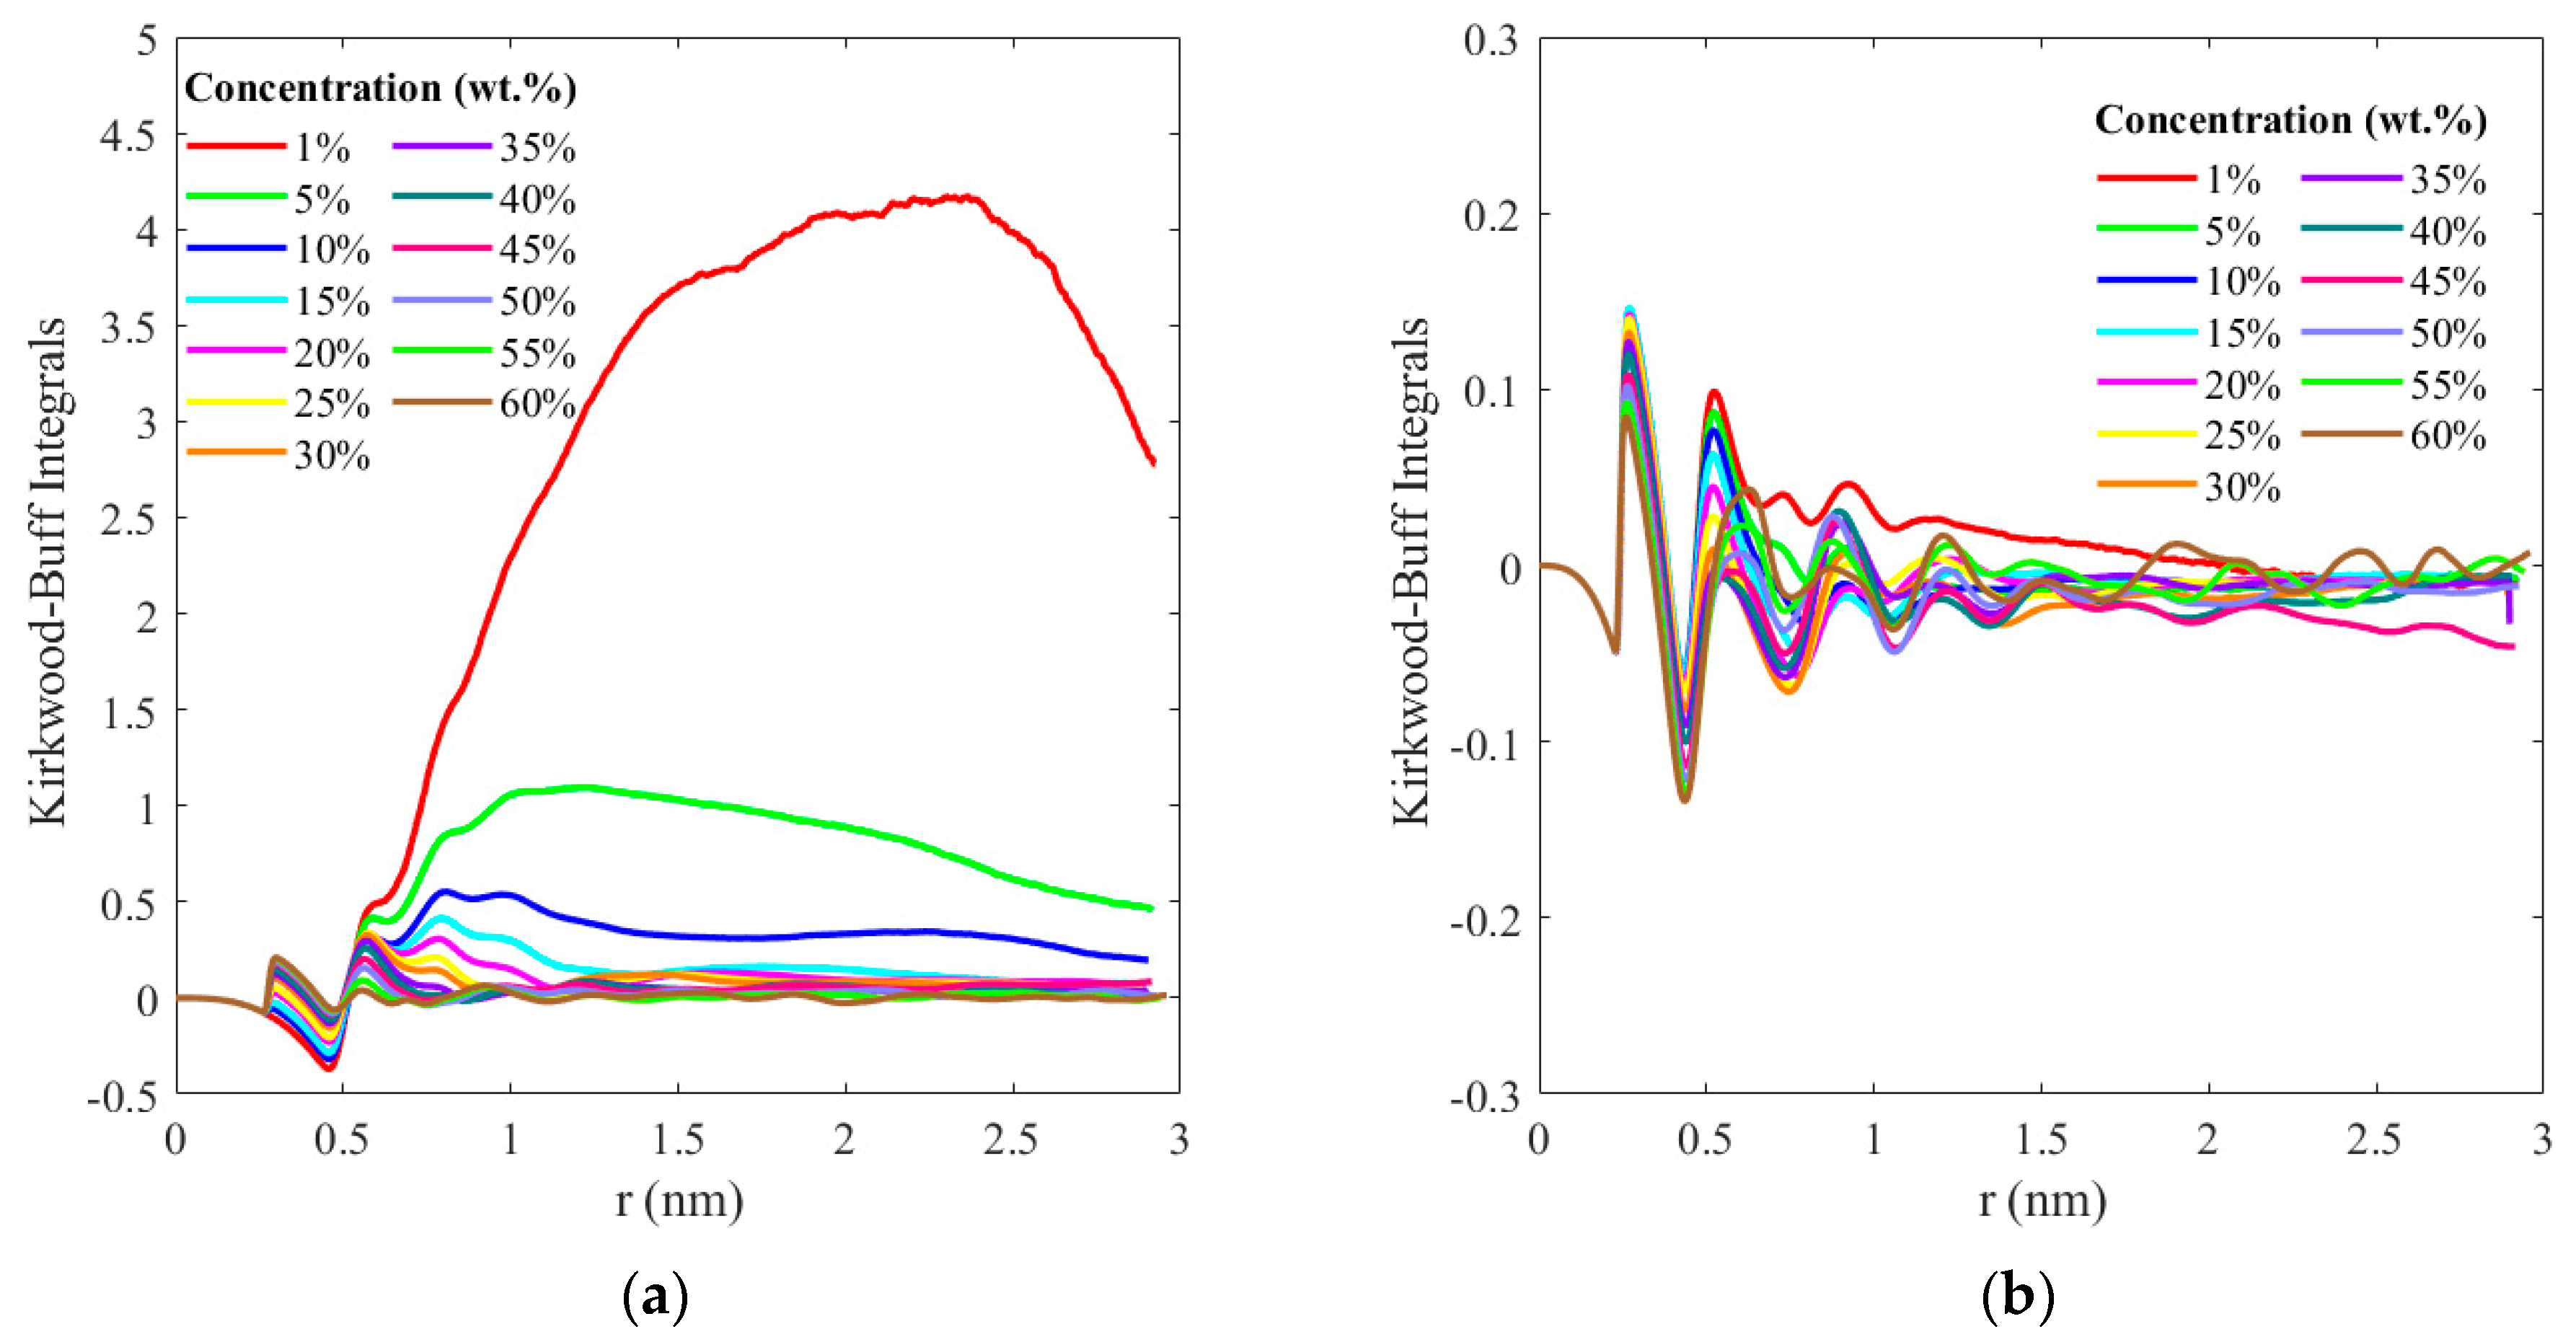
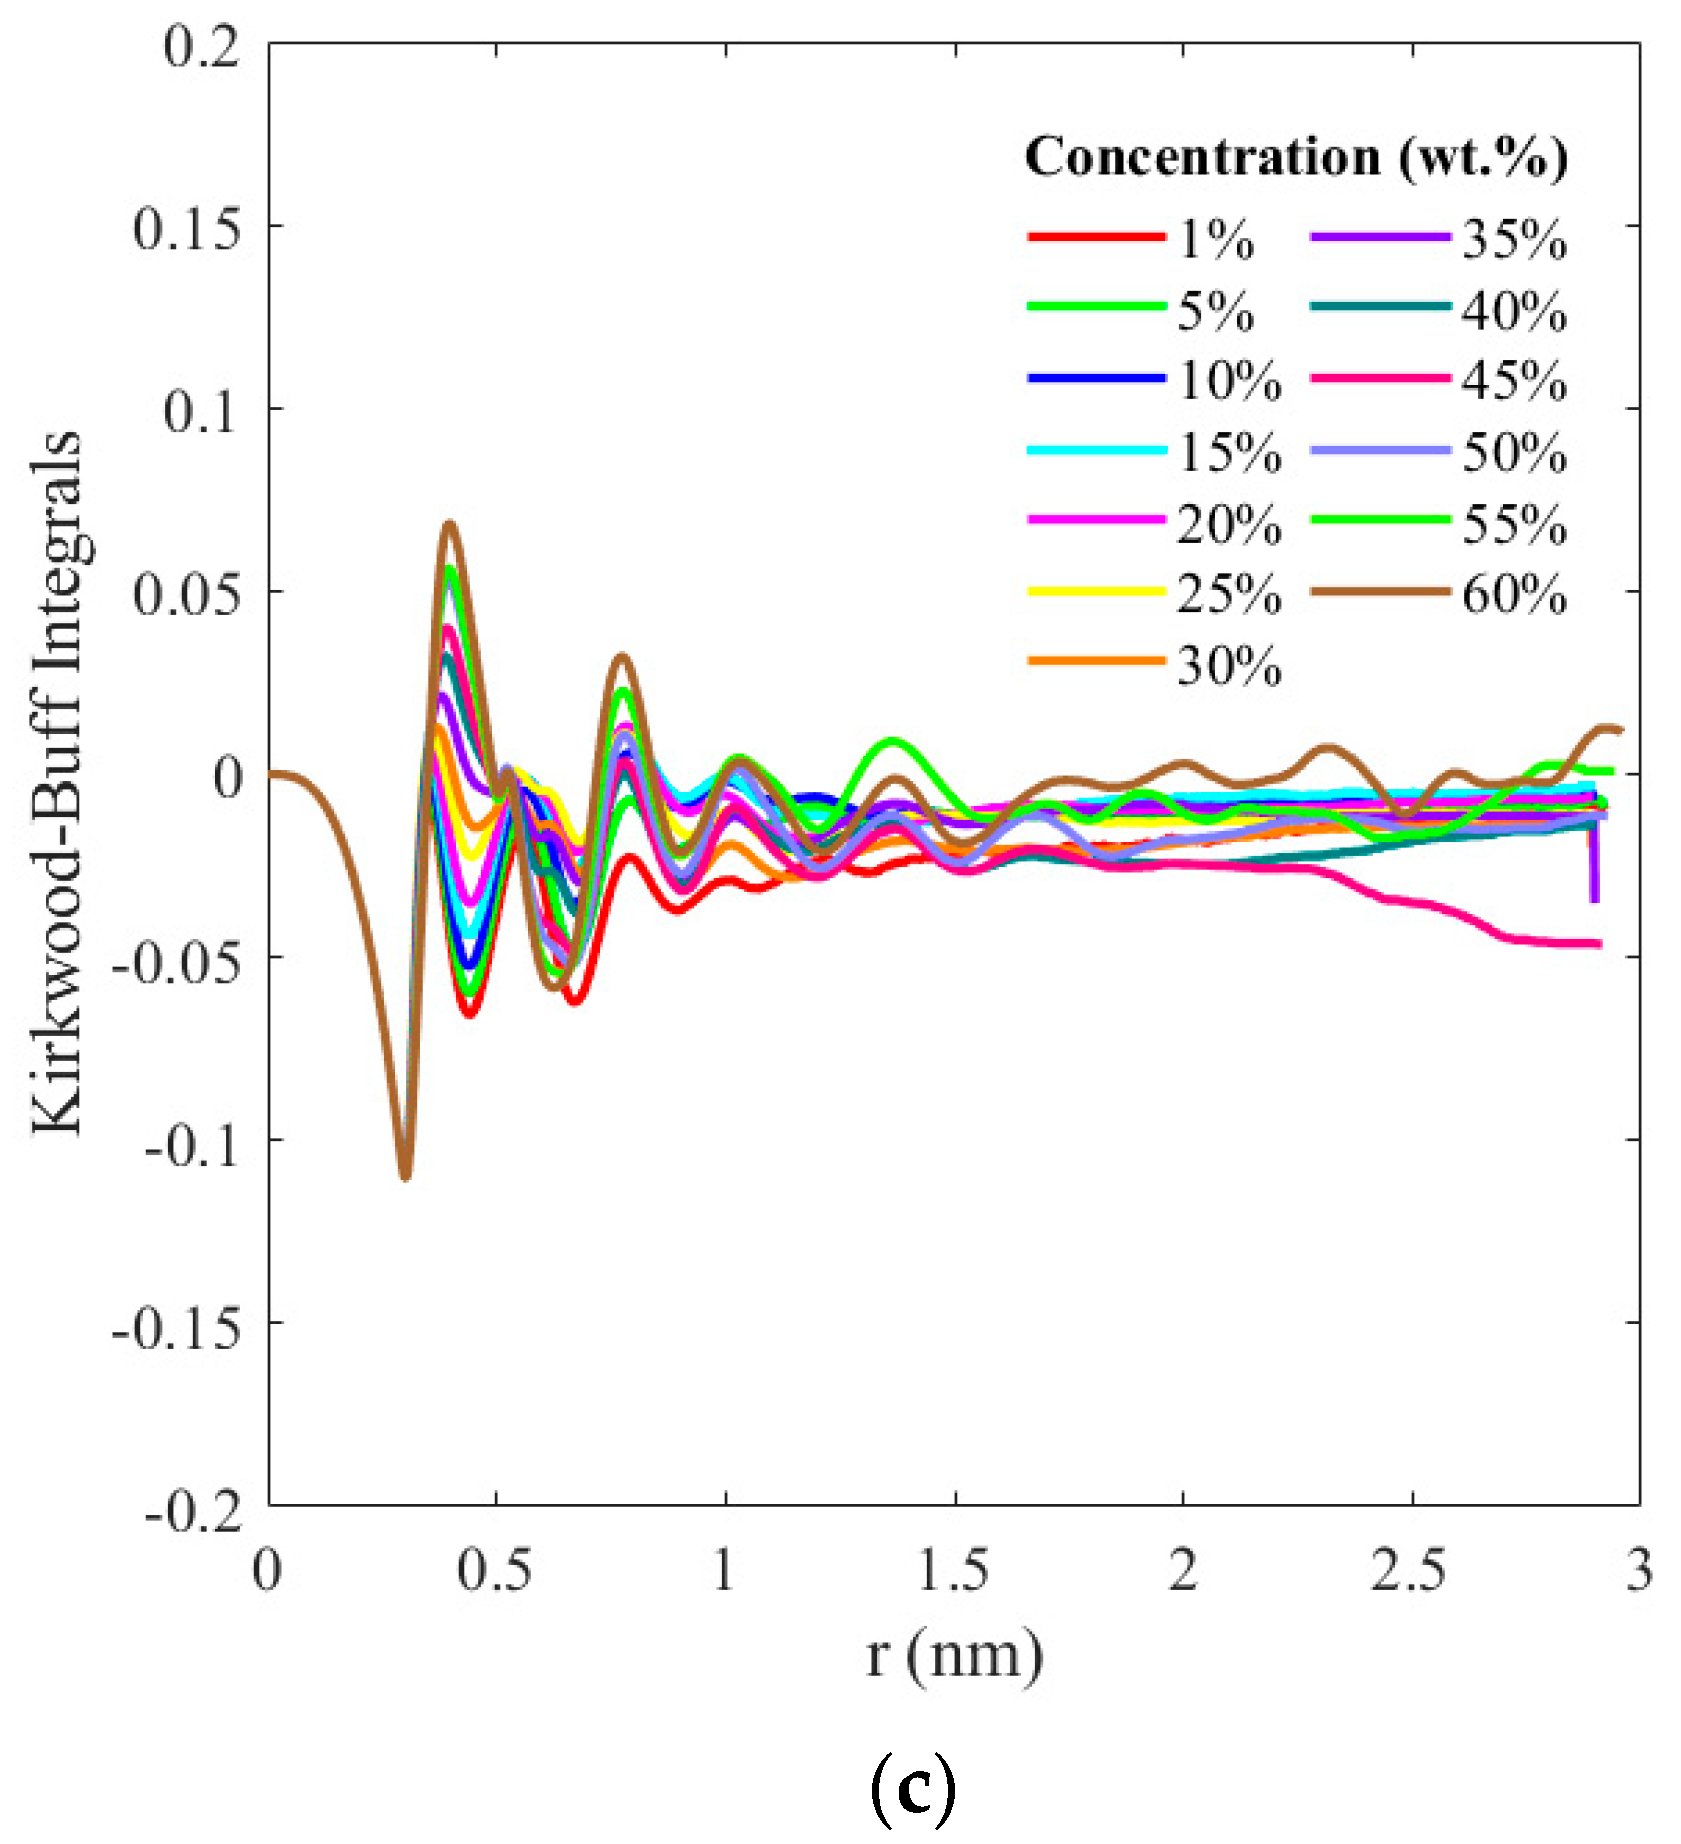
The Kirkwood–Buff integrals (KBIs) for the ion–ion and ion–water interactions derived from the spatial integral over the corresponding radial distribution functions are presented in Figure 9. These are calculated as , where is the KBI for a pair of components i and j, which could be ions or water molecules, and is the RDF between particles i and j at a distance R. The RDF is subtracted by 1 to remove the ideal gas contribution, as the KBI is intended to describe deviations from the ideal gas behavior. At low concentrations (1–10%), due to the complete dissolution of the salt, and, consequently, the absence of ion pairs in the dilute solution, KBIs for the ion–ion interactions do not converge; however, we note that for increasing concentrations, the KBIs (Figure 9a) attain a plateau around 1.5 nm, indicating the mean size of the structural configurations of the ion pairs attained in concentrated solutions. Conversely, the KBIs for ion–water interactions presented in Figure 9b,d exhibit a reciprocal behavior; at low concentrations, the presence of hydration shells creates defined structural configurations that converge around 1.5 nm, while at higher concentrations (>40%), the formation of ion pairs disrupts the hydration shells and diverges from the aforementioned structural order.
4. Conclusions
Our study, based on molecular dynamics simulations, provides a comprehensive examination of the solvation characteristics of CaCl2 across a broad spectrum of concentrations. A hydration limit is observed at a solution concentration of 10 wt.% CaCl2. Below this threshold, the coordination numbers for Ca2+–water, Ca2+-Cl−, and Cl−–water remain constant. When this hydration limit is surpassed, the formation of ion pairs instigates divergent trends within the coordination number profiles. Notably, the quantity of water molecules solvating Ca2+ reduces as the concentrations rise, a phenomenon attributable to the increase in ion pair formation. This is further mirrored in the coordination number profile of Ca2+-Cl−, which continues to augment beyond the hydration limit.
With regard to Cl−, its coordination number experiences an increase between the hydration and solubility limits, followed by a subsequent decrease beyond the latter. This coordination number transition point of Cl− can be perceived as a predictor of the solubility limit. Beyond this point, ion pair formation intensifies, which consequently reduces the amount of solvating water molecules available for both Ca2+ and Cl−.
Our findings provide a deeper insight into the solvation behavior of CaCl2 and the impact of ion pair formation on the solvation dynamics for concentrated salt solutions. These outcomes can contribute to the understanding and prediction of solubility limits in aqueous media containing inorganic salts.
Author Contributions
Conceptualization, G.B.; Formal analysis, L.Y.; Investigation, L.Y.; Supervision, G.B.; Writing—Original Draft, L.Y.; Writing—Review and Editing, G.B. All authors have read and agreed to the published version of the manuscript.
Funding
This research was funded by National Science Foundation award OAC-2019035.
Data Availability Statement
The data presented in this study are available on request from the corresponding author.
Acknowledgments
The simulations were performed on the Lehigh University LTS computing cluster, Hawk.
Conflicts of Interest
The authors declare no conflict of interest.
References
- Yu, K.; Liu, Y.; Yang, Y. Review on form-stable inorganic hydrated salt phase change materials: Preparation, characterization and effect on the thermophysical properties. Appl. Energy 2021, 292, 116845. [Google Scholar] [CrossRef]
- Gerkman, M.A.; Han, G.G. Toward Controlled Thermal Energy Storage and Release in Organic Phase Change Materials. Joule 2020, 4, 1621–1625. [Google Scholar] [CrossRef]
- Bruni, F.; Imberti, S.; Mancinelli, R.; Ricci, M.A. Aqueous solutions of divalent chlorides: Ions hydration shell and water structure. J. Chem. Phys. 2012, 136, 064520. [Google Scholar] [CrossRef]
- Balasubramanian, G.; Murad, S.; Kappiyoor, R.; Puri, I.K. Structure of aqueous MgSO4 solution: Dilute to concentrated. Chem. Phys. Lett. 2011, 508, 38–42. [Google Scholar] [CrossRef]
- Hemalatha, B.; Vasantharani, P.; Vijayakumari, K.K. Ion-Ion and Ion-Solvent Interactions of Tetraalkyl Ammonium Bromide in Mixed DMF-Water Systems at Different Temperatures. J. Solut. Chem. 2009, 38, 947–955. [Google Scholar] [CrossRef]
- Botamanenko, D.Y.; Jarrold, M.F. Ion-Ion Interactions in Charge Detection Mass Spectrometry. J. Am. Soc. Mass Spectrom. 2019, 30, 2741–2749. [Google Scholar] [CrossRef] [PubMed]
- Dakua, V.K.; Sinha, B.; Roy, M.N. Ion–solvent and ion–ion interactions of sodium molybdate salt in aqueous binary mixtures of 1,4-dioxane at different temperatures. Phys. Chem. Liq. 2007, 45, 549–560. [Google Scholar] [CrossRef]
- Kournopoulos, S.; Santos, M.S.; Ravipati, S.; Haslam, A.J.; Jackson, G.; Economou, I.G.; Galindo, A. The Contribution of the Ion–Ion and Ion–Solvent Interactions in a Molecular Thermodynamic Treatment of Electrolyte Solutions. J. Phys. Chem. B 2022, 126, 9821–9839. [Google Scholar] [CrossRef]
- van der Vegt, N.F.A.; Haldrup, K.; Roke, S.; Zheng, J.; Lund, M.; Bakker, H.J. Water-Mediated Ion Pairing: Occurrence and Relevance. Chem. Rev. 2016, 116, 7626–7641. [Google Scholar] [CrossRef] [Green Version]
- Biriukov, D.; Wang, H.-W.; Rampal, N.; Tempra, C.; Kula, P.; Neuefeind, J.C.; Stack, A.G.; Předota, M. The “good”, the “bad”, and the “hidden” in neutron scattering and molecular dynamics of ionic aqueous solutions. J. Chem. Phys. 2022, 156, 194505. [Google Scholar] [CrossRef]
- Megyes, T.; Grósz, T.; Radnai, T.; Bakó, I.; Pálinkás, G. Solvation of Calcium Ion in Polar Solvents: An X-ray Diffraction and ab Initio Study. J. Phys. Chem. A 2004, 108, 7261–7271. [Google Scholar] [CrossRef]
- Megyes, T.; Bakó, I.; Bálint, S.; Grósz, T.; Radnai, T. Ion pairing in aqueous calcium chloride solution: Molecular dynamics simulation and diffraction studies. J. Mol. Liq. 2006, 129, 63–74. [Google Scholar] [CrossRef]
- Todorova, T.; Hünenberger, P.H.; Hutter, J. Car–Parrinello Molecular Dynamics Simulations of CaCl2 Aqueous Solutions. J. Chem. Theory Comput. 2008, 4, 779–789. [Google Scholar] [CrossRef] [PubMed]
- Friesen, S.; Hefter, G.; Buchner, R. Cation Hydration and Ion Pairing in Aqueous Solutions of MgCl2 and CaCl2. J. Phys. Chem. B 2019, 123, 891–900. [Google Scholar] [CrossRef]
- Wang, G.; Zhou, Y.; Toshio, Y.; Liu, H.; Zhu, F.; Wu, Z. Structure of Aqueous CaCl2 Solutions by X-ray Scattering and Density Functional Theory. Russ. J. Phys. Chem. A 2022, 96, S68–S76. [Google Scholar] [CrossRef]
- Smith, W.R.; Nezbeda, I.; Kolafa, J.; Moučka, F. Recent progress in the molecular simulation of thermodynamic properties of aqueous electrolyte solutions. Fluid Phase Equilibria 2018, 466, 19–30. [Google Scholar] [CrossRef]
- Lísal, M.; Smith, W.R.; Kolafa, J. Molecular Simulations of Aqueous Electrolyte Solubility: 1. The Expanded-Ensemble Osmotic Molecular Dynamics Method for the Solution Phase. J. Phys. Chem. B 2005, 109, 12956–12965. [Google Scholar] [CrossRef]
- Moučka, F.; Lísal, M.; Škvor, J.; Jirsák, J.; Nezbeda, I.; Smith, W.R. Molecular Simulation of Aqueous Electrolyte Solubility. Osmotic Ensemble Monte Carlo Methodology for Free Energy and Solubility Calculations and Application to NaCl. J. Phys. Chem. B 2011, 115, 7849–7861. [Google Scholar] [CrossRef]
- Moučka, F.; Lísal, M.; Smith, W.R. Molecular Simulation of Aqueous Electrolyte Solubility. 3. Alkali-Halide Salts and Their Mixtures in Water and in Hydrochloric Acid. J. Phys. Chem. B 2012, 116, 5468–5478. [Google Scholar] [CrossRef]
- Moučka, F.; Kolafa, J.; Lísal, M.; Smith, W.R. Chemical potentials of alkaline earth metal halide aqueous electrolytes and solubility of their hydrates by molecular simulation: Application to CaCl2, antarcticite, and sinjarite. J. Chem. Phys. 2018, 148, 222832. [Google Scholar] [CrossRef]
- Deublein, S.; Reiser, S.; Vrabec, J.; Hasse, H. A Set of Molecular Models for Alkaline-Earth Cations in Aqueous Solution. J. Phys. Chem. B 2012, 116, 5448–5457. [Google Scholar] [CrossRef] [PubMed]
- Mamatkulov, S.; Fyta, M.; Netz, R.R. Force fields for divalent cations based on single-ion and ion-pair properties. J. Chem. Phys. 2013, 138, 024505. [Google Scholar] [CrossRef] [PubMed] [Green Version]
- Zeron, I.M.; Abascal, J.L.F.; Vega, C. A force field of Li+, Na+, K+, Mg2+, Ca2+, Cl−, and SO42− in aqueous solution based on the TIP4P/2005 water model and scaled charges for the ions. J. Chem. Phys. 2019, 151, 134504. [Google Scholar] [CrossRef] [PubMed]
- Kohagen, M.; Mason, P.E.; Jungwirth, P. Accurate Description of Calcium Solvation in Concentrated Aqueous Solutions. J. Phys. Chem. B 2014, 118, 7902–7909. [Google Scholar] [CrossRef]
- Martinek, T.; Duboué-Dijon, E.; Timr, Š.; Mason, P.E.; Baxová, K.; Fischer, H.E.; Schmidt, B.; Pluhařová, E.; Jungwirth, P. Calcium ions in aqueous solutions: Accurate force field description aided by ab initio molecular dynamics and neutron scattering. J. Chem. Phys. 2018, 148, 222813. [Google Scholar] [CrossRef] [Green Version]
- Bernal-Uruchurtu, M.I.; Ortega-Blake, I. A refined Monte Carlo study of Mg2+ and Ca2+ hydration. J. Chem. Phys. 1995, 103, 1588–1598. [Google Scholar] [CrossRef]
- Probst, M.M.; Radnai, T.; Heinzinger, K.; Bopp, P.; Rode, B.M. Molecular dynamics and x-ray investigation of an aqueous calcium chloride solution. J. Phys. Chem. 1985, 89, 753–759. [Google Scholar] [CrossRef]
- Lindahl, E.; Abraham, M.J.; Hess, B.; van der Spoel, D. GROMACS 2020 Manual; GROMACS Development Team: Stockholm, Sweden, 2020. [Google Scholar] [CrossRef]
- Berendsen, H.J.C.; Van Der Spoel, D.; Van Drunen, R. GROMACS: A message-passing parallel molecular dynamics implementation. Comput. Phys. Commun. 1995, 91, 43–56. [Google Scholar] [CrossRef]
- Sayle, R.A.; Milner-White, E. RASMOL: Biomolecular graphics for all. Trends Biochem. Sci. 1995, 20, 374–376. [Google Scholar] [CrossRef]
- Hoover, W.G.; Holian, B.L. Kinetic moments method for the canonical ensemble distribution. Phys. Lett. A 1996, 211, 253–257. [Google Scholar] [CrossRef] [Green Version]
- Berendsen, H.J.C.; Postma, J.P.M.; Van Gunsteren, W.F.; Hermans, J. Interaction models for water in relation to protein hydration. In Intermolecular Forces; Pullman, B., Ed.; Springer: Dordrecht, The Netherlands, 1981; pp. 331–342. [Google Scholar]
- Wu, Y.; Tepper, H.L.; Voth, G.A. Flexible simple point-charge water model with improved liquid-state properties. J. Chem. Phys. 2006, 124, 024503. [Google Scholar] [CrossRef] [PubMed]
- Oostenbrink, C.; Villa, A.; Mark, A.E.; Van Gunsteren, W.F. A biomolecular force field based on the free enthalpy of hydration and solvation: The GROMOS force-field parameter sets 53A5 and 53A6. J. Comput. Chem. 2004, 25, 1656–1676. [Google Scholar] [CrossRef] [PubMed]
- Beveridge, D.L.; DiCapua, F.M. Free Energy Via Molecular Simulation: Applications to Chemical and Biomolecular Systems. Annu. Rev. Biophys. Biophys. Chem. 1989, 18, 431–492. [Google Scholar] [CrossRef] [PubMed]
- Naik, R.R.; Gandhi, N.S.; Thakur, M.; Nanda, V. Analysis of crystallization phenomenon in Indian honey using molecular dynamics simulations and artificial neural network. Food Chem. 2019, 300, 125182. [Google Scholar] [CrossRef]
- Verlet, L. Computer “Experiments” on Classical Fluids. I. Thermodynamical Properties of Lennard-Jones Molecules. Phys. Rev. 1967, 159, 98–103. [Google Scholar] [CrossRef] [Green Version]
- Di Pierro, M.; Elber, R.; Leimkuhler, B. A Stochastic Algorithm for the Isobaric–Isothermal Ensemble with Ewald Summations for All Long Range Forces. J. Chem. Theory Comput. 2015, 11, 5624–5637. [Google Scholar] [CrossRef] [Green Version]
- Desgranges, C.; Delhommelle, J. Evaluation of the grand-canonical partition function using expanded Wang-Landau simulations. III. Impact of combining rules on mixtures properties. J. Chem. Phys. 2014, 140, 104109. [Google Scholar] [CrossRef]
- Chialvo, A.A.; Simonson, J.M. The structure of CaCl2 aqueous solutions over a wide range of concentration. Interpretation of diffraction experiments via molecular simulation. J. Chem. Phys. 2003, 119, 8052–8061. [Google Scholar] [CrossRef]
- Allen, M.P.; Tildesley, D.J. Computer Simulation of Liquids, 2nd ed.; Oxford University Press: Oxford, UK, 2017; pp. 1–626. [Google Scholar] [CrossRef]
- Hall, J.R.; Wishaw, B.F.; Stokes, R.H. The Diffusion Coefficients of Calcium Chloride and Ammonium Chloride in Concentrated Aqueous Solutions at 25°. J. Am. Chem. Soc. 1953, 75, 1556–1560. [Google Scholar] [CrossRef]
- Young, J.M.; Tietz, C.; Panagiotopoulos, A.Z. Activity Coefficients and Solubility of CaCl2 from Molecular Simulations. J. Chem. Eng. Data 2020, 65, 337–348. [Google Scholar] [CrossRef]
- Luzar, A. Resolving the hydrogen bond dynamics conundrum. J. Chem. Phys. 2000, 113, 10663–10675. [Google Scholar] [CrossRef] [Green Version]
Figure 1.
The initial state of the simulation box for (a) 1 wt.% CaCl2 and (b) 60 wt.% CaCl2, where the white, red, green, and grey particles represent hydrogen, oxygen, chloride, and calcium atoms, respectively. This color scheme is consistent throughout the following figures.
Figure 1.
The initial state of the simulation box for (a) 1 wt.% CaCl2 and (b) 60 wt.% CaCl2, where the white, red, green, and grey particles represent hydrogen, oxygen, chloride, and calcium atoms, respectively. This color scheme is consistent throughout the following figures.
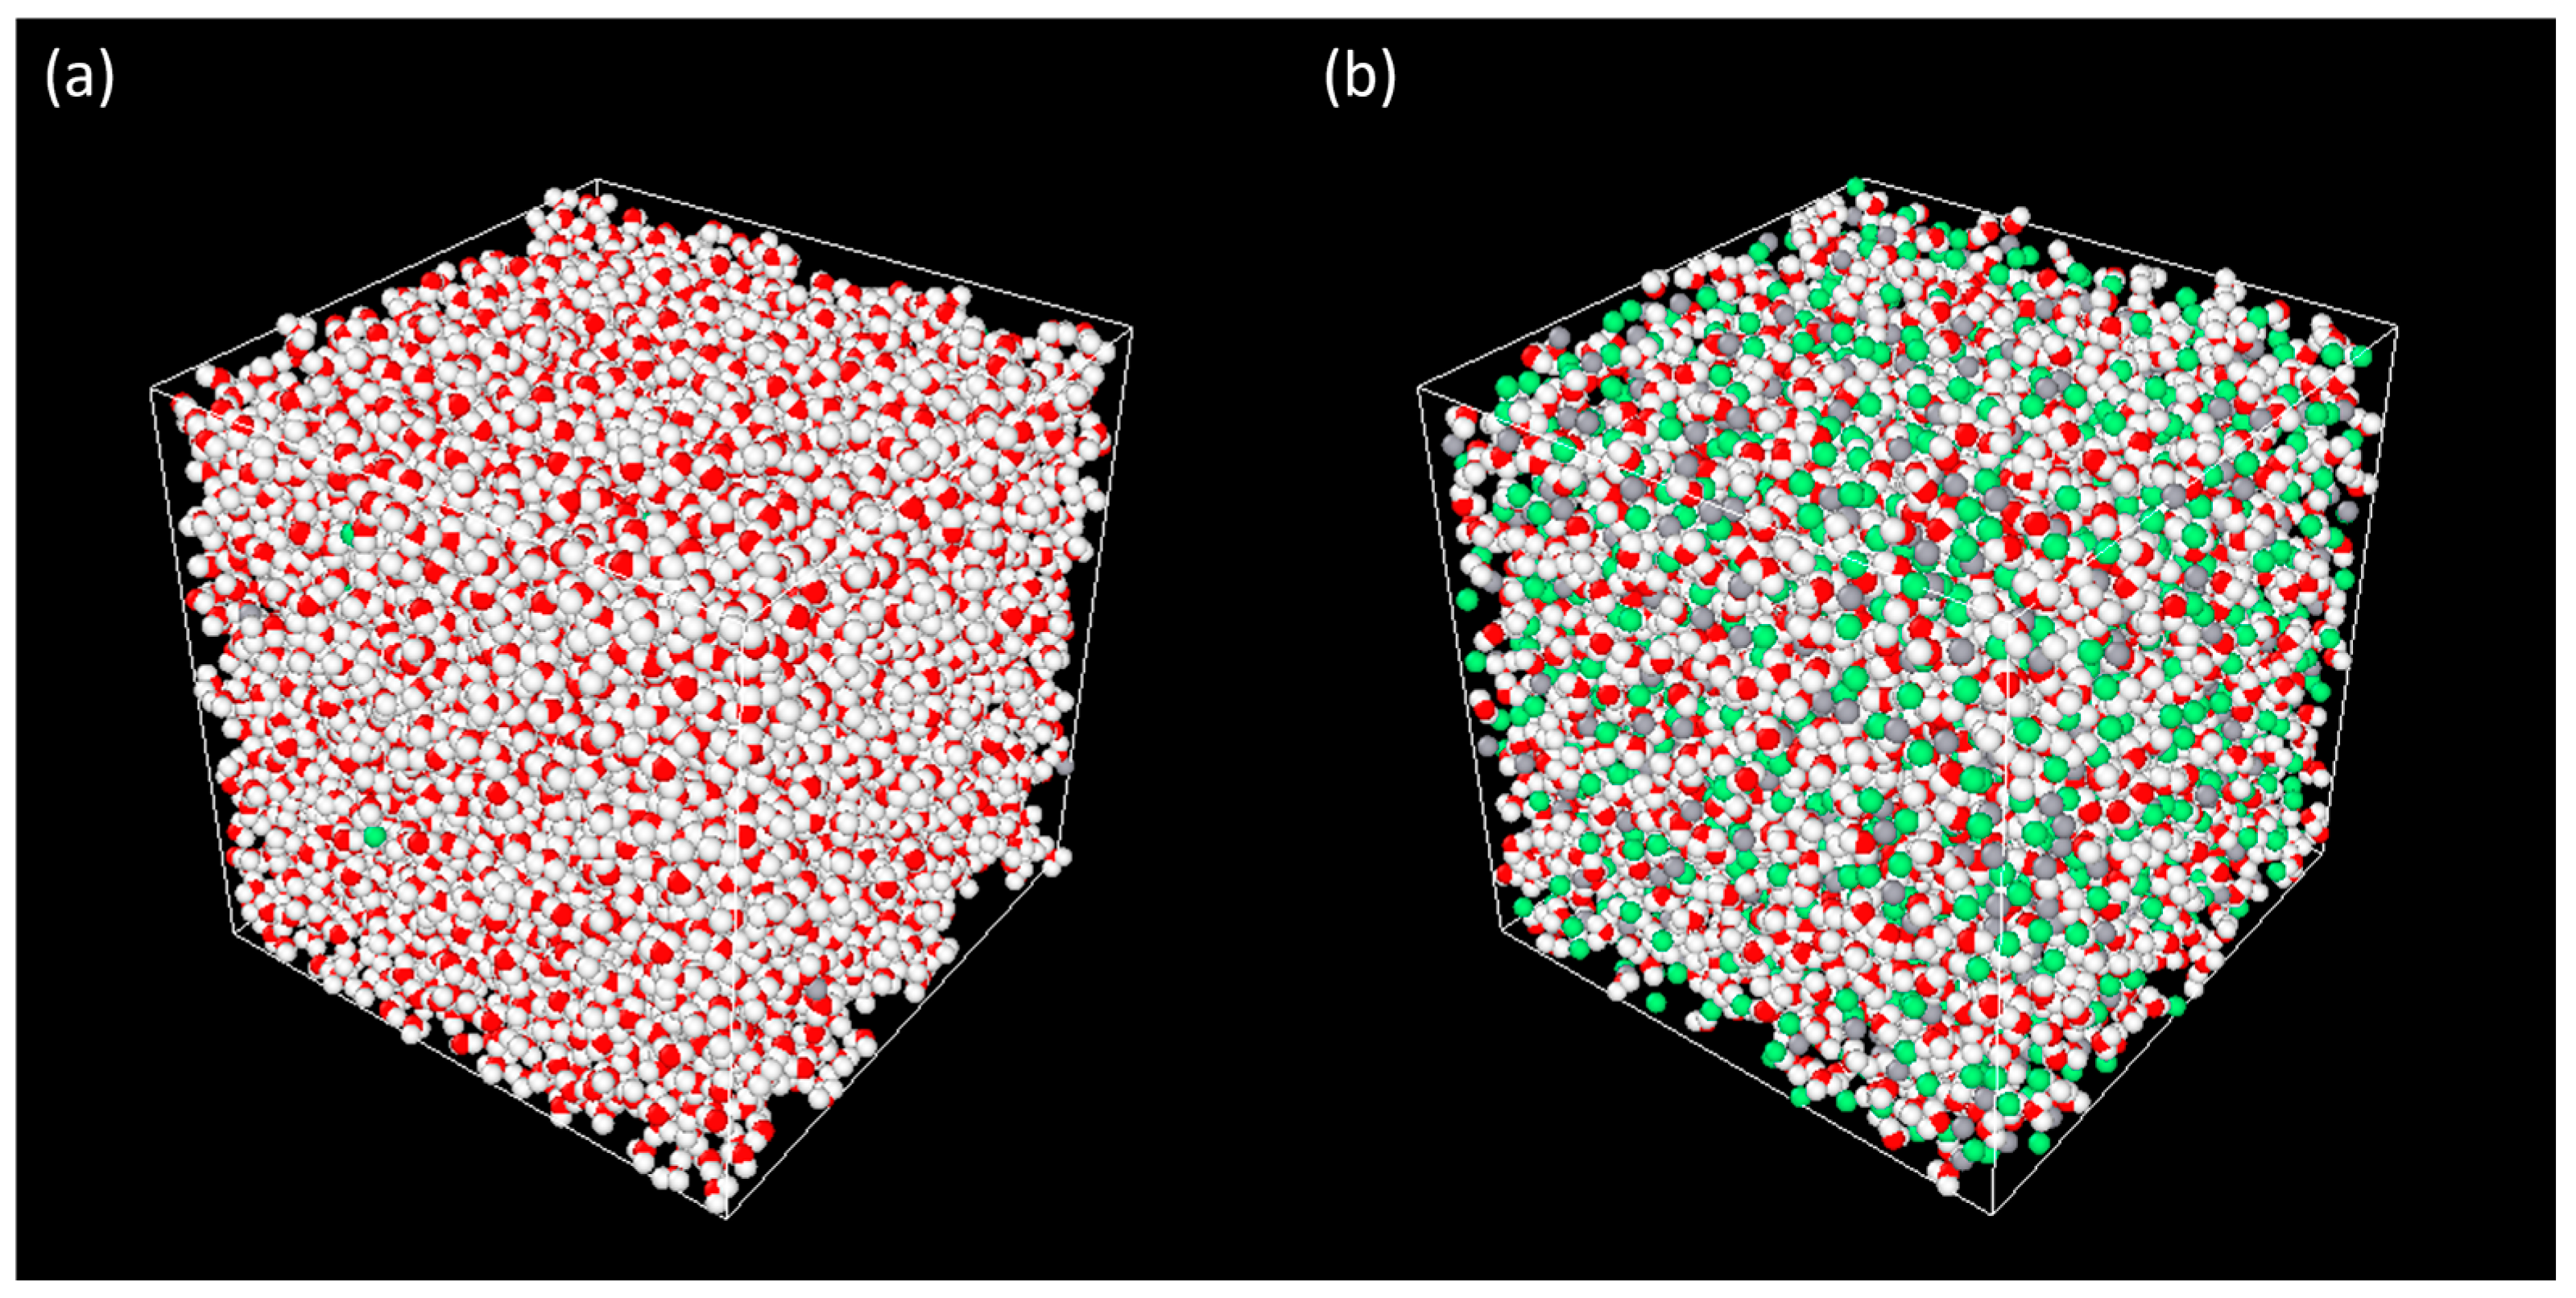
Figure 2.
(a) The radial distribution function (RDF) presented as continuous lines, and the corresponding coordination number (CN), shown with dashed lines, for Ca2+ and water at different salt concentrations. Representative orientations for the water molecules around a Ca2+ ion for (b) 10 wt.%, (c) 20 wt.%, (d) 40 wt.%, and (e) 60 wt.% CaCl2 concentrated solutions are illustrated, with distances in nm (nanometer). The blue arrow labels the typical distance between a water molecule and a Ca2+ ion corresponding to the peak RDF in (a) denoting the first shell.
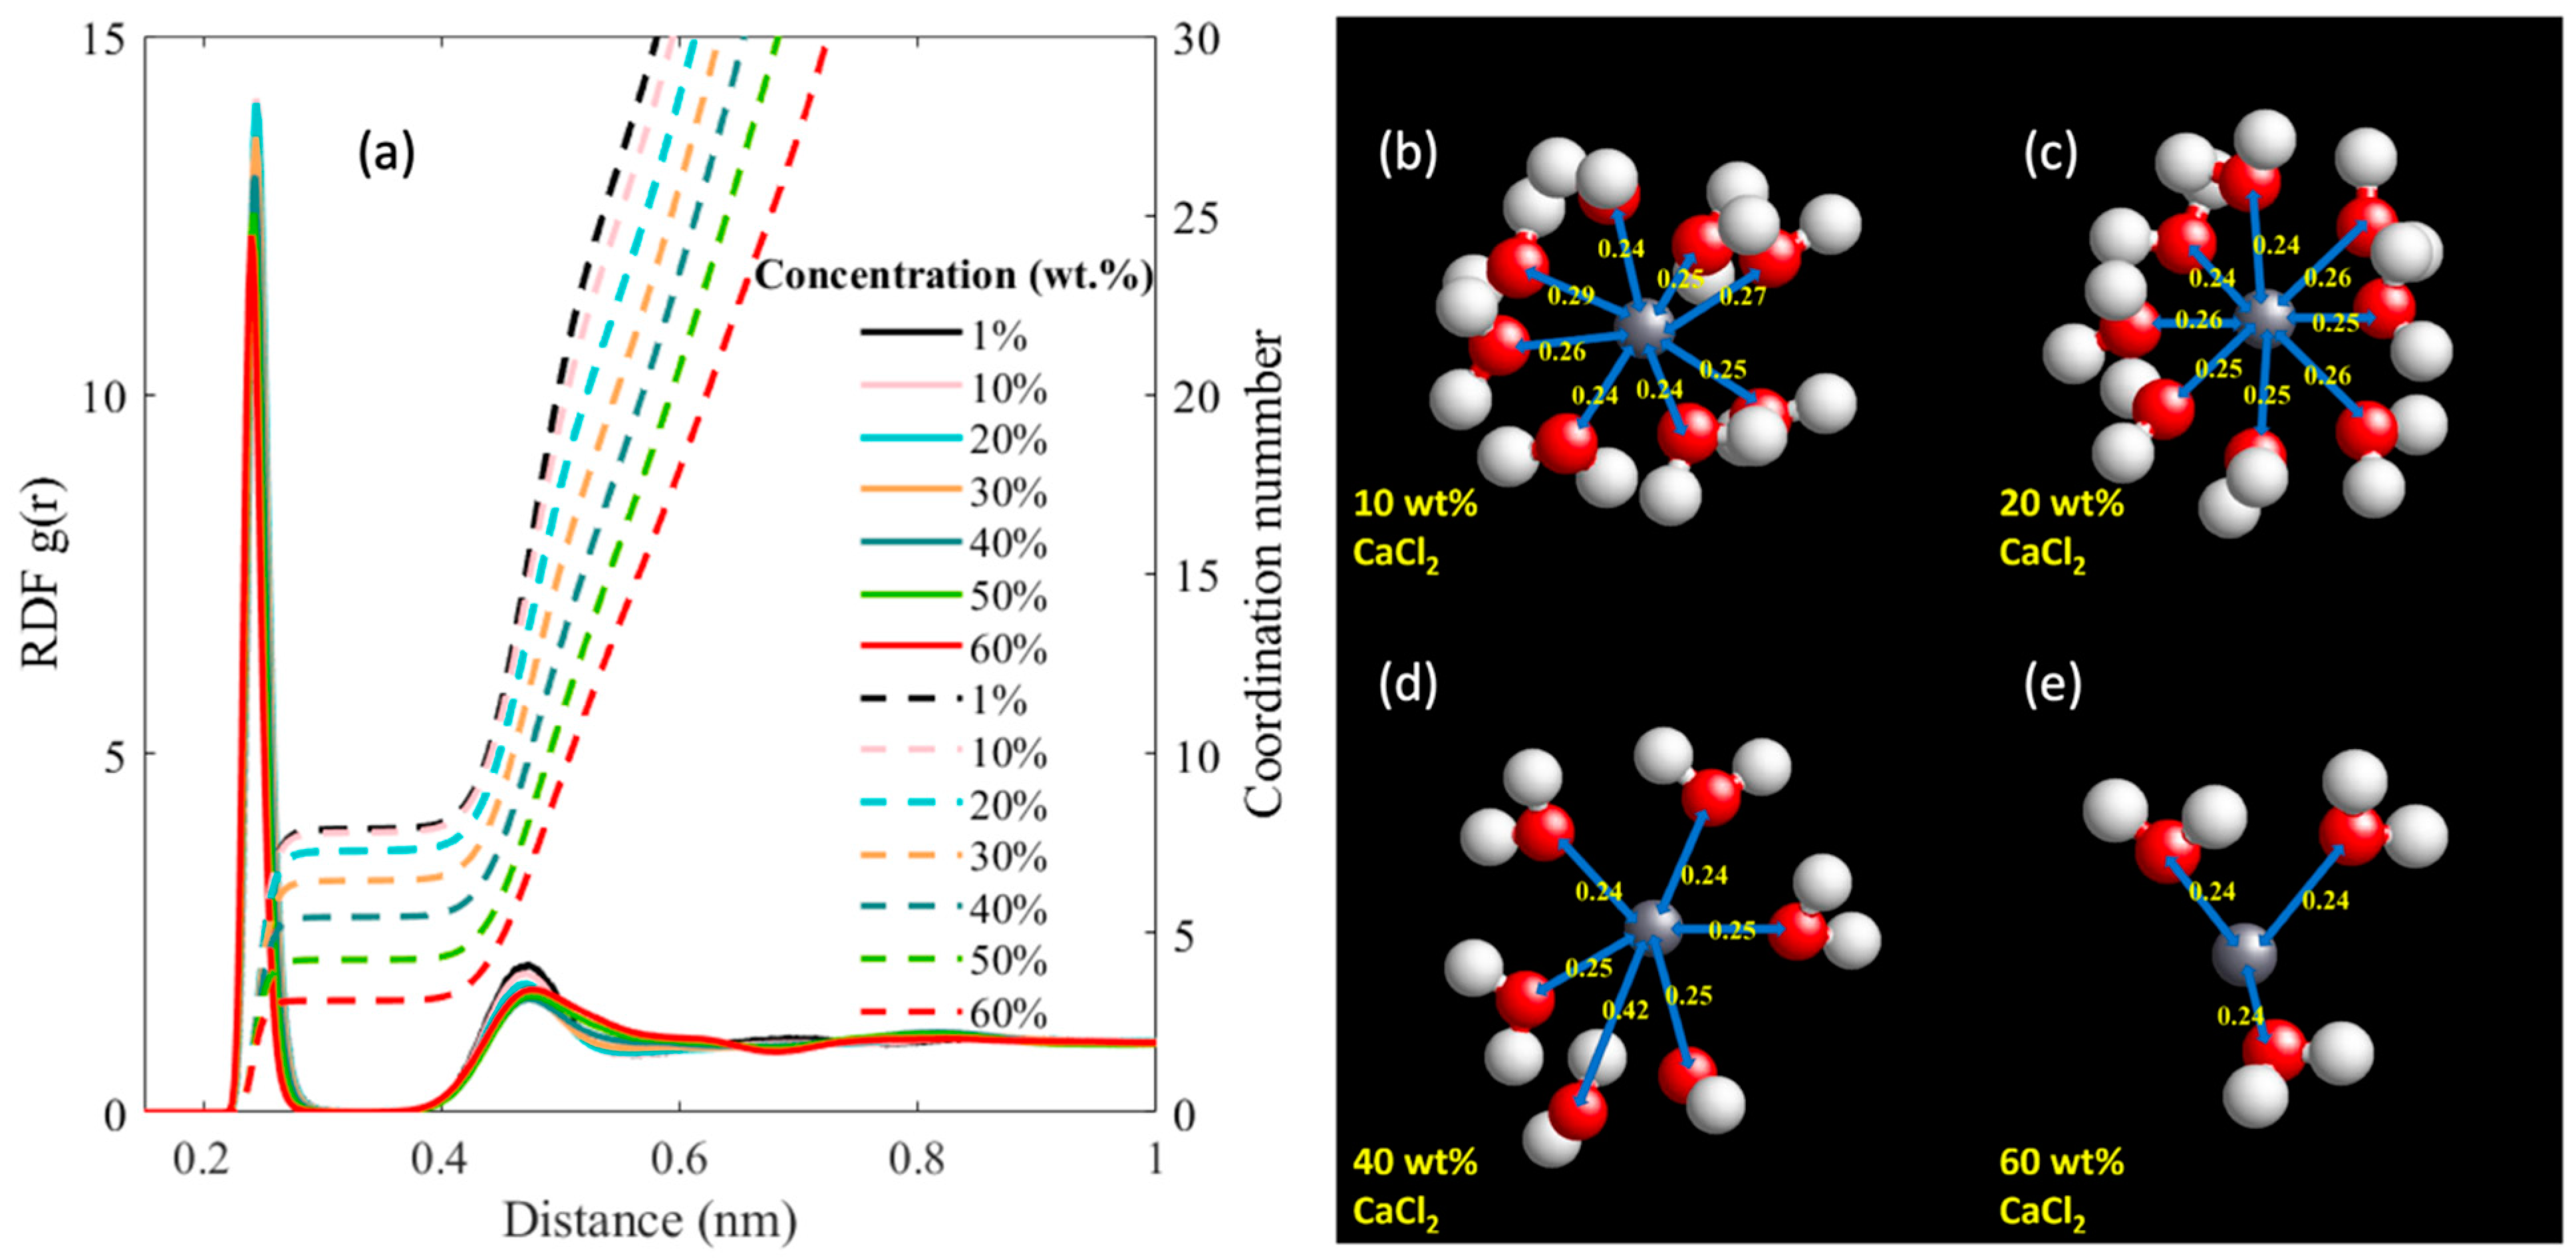
Figure 3.
(a) The radial distribution function (RDF) presented as continuous lines, and the corresponding coordination number (CN), shown with dashed lines, for Ca2+ and Cl− at different salt concentrations. Representative orientations for the Cl− ions around a Ca2+ ion for (b) 10 wt.%, (c) 20 wt.%, (d) 40 wt.%, and (e) 60 wt.% CaCl2 concentrated solutions are illustrated, with distances in nm (nanometers). The orange arrow labels the typical distance between a Cl− ion and a Ca2+ ion corresponding to the peak RDF in (a) denoting the first shell.
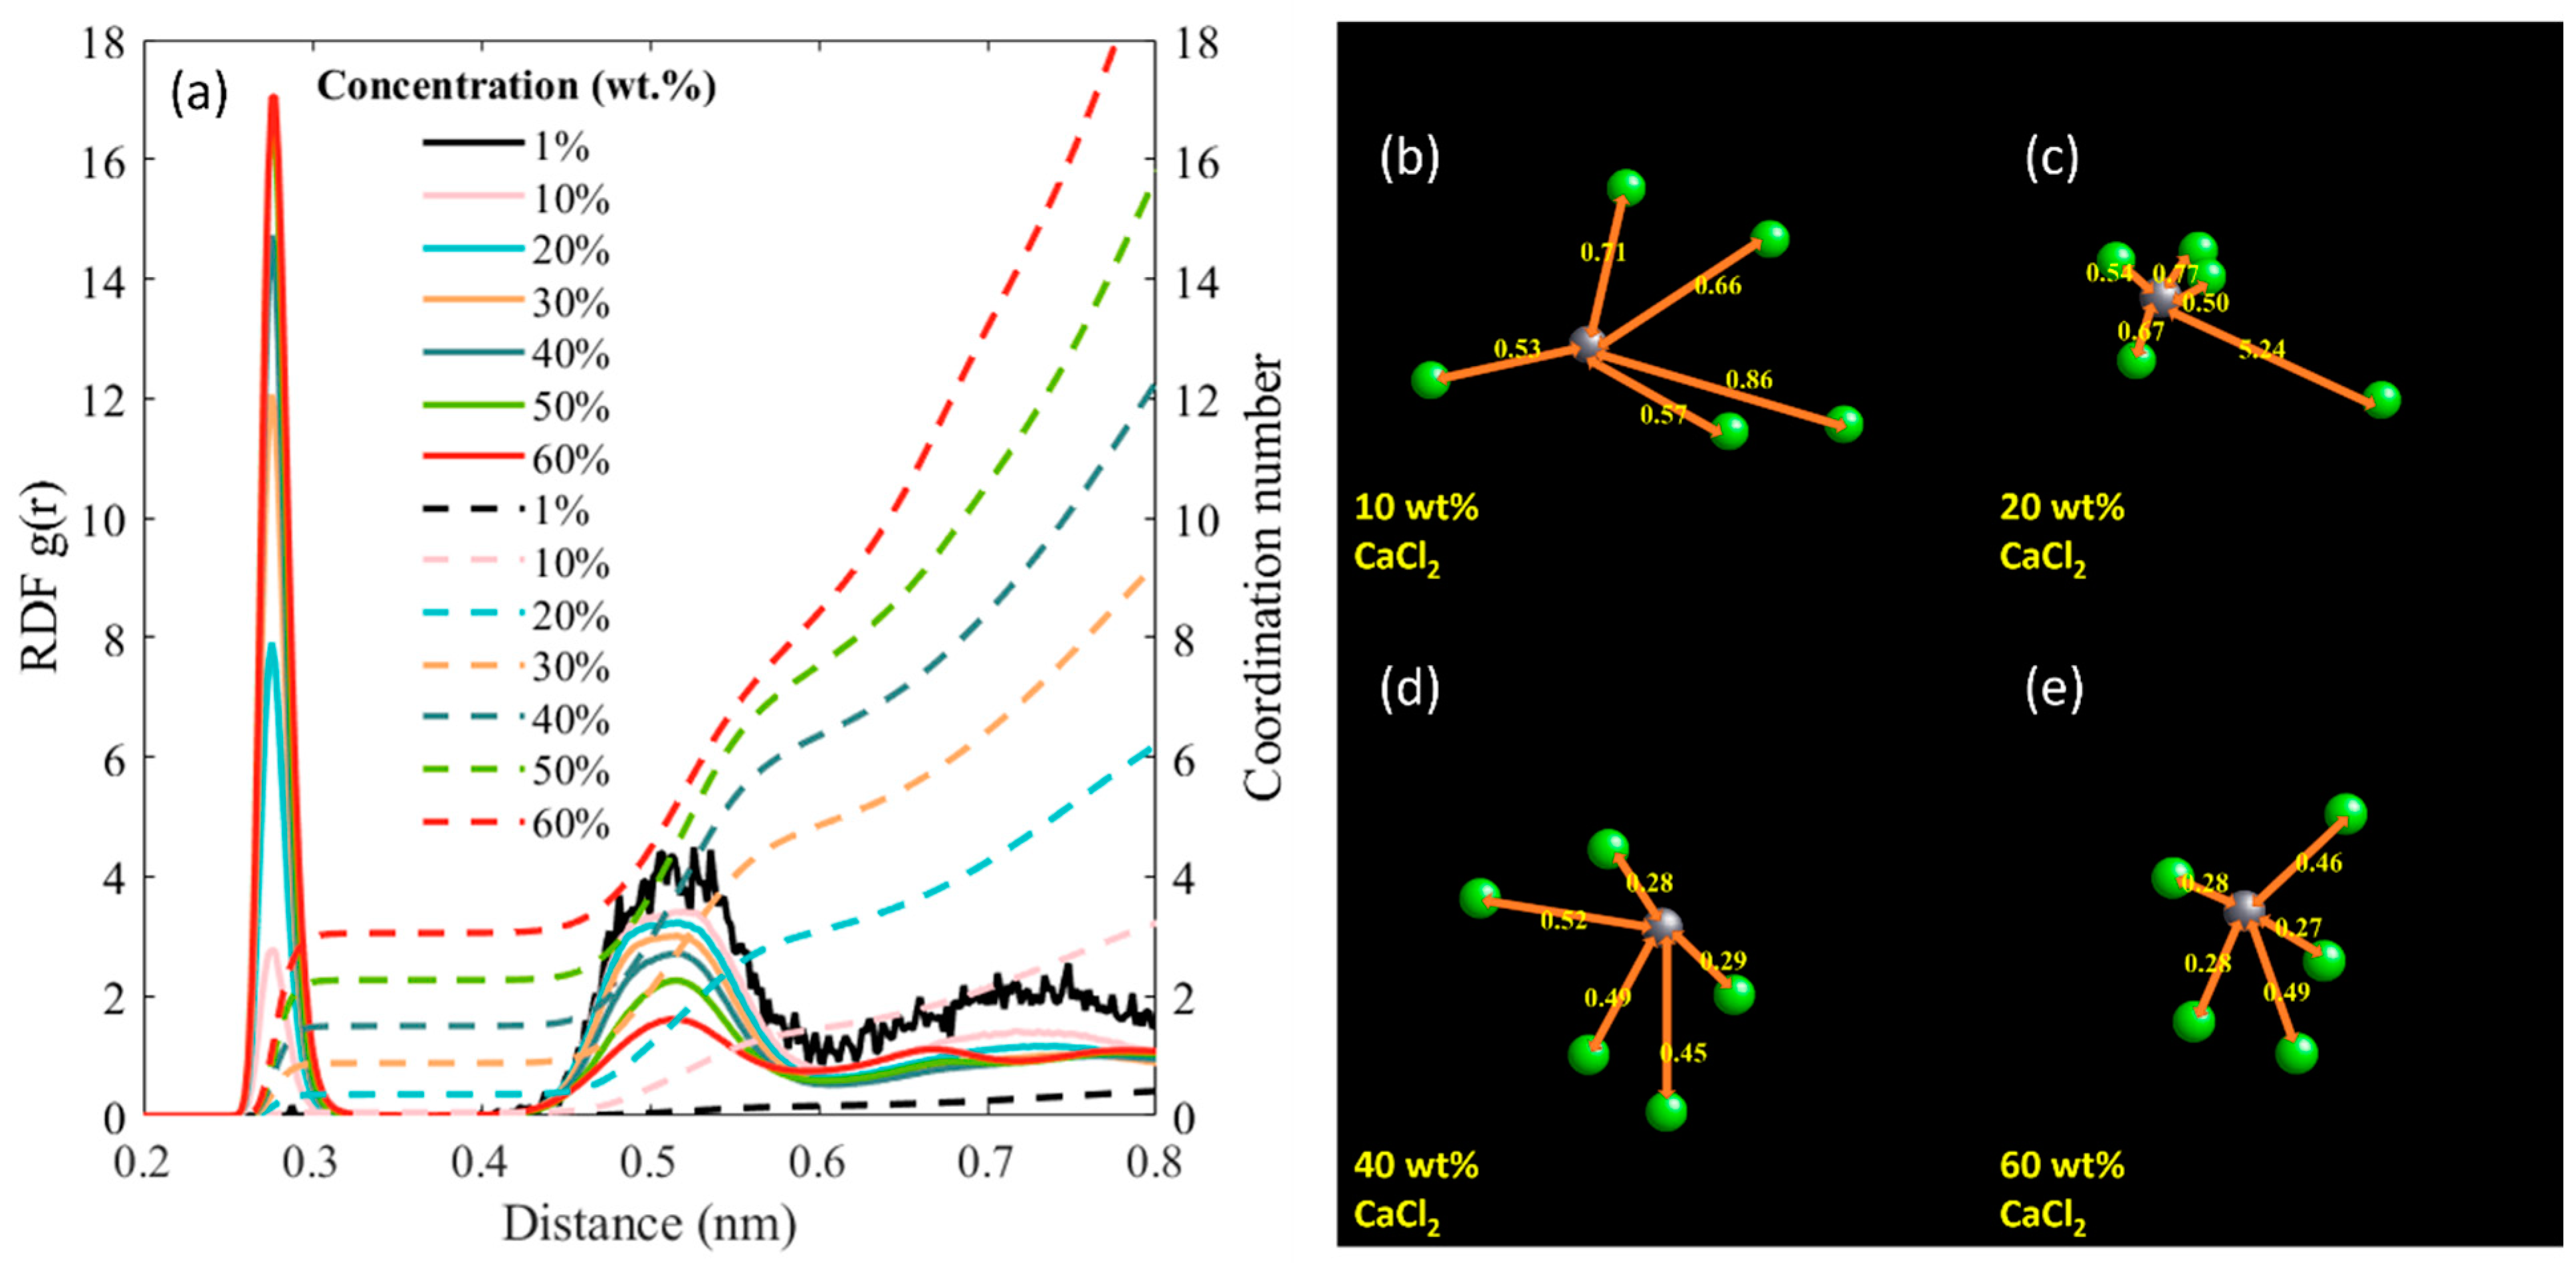
Figure 4.
(a) The radial distribution function (RDF) presented as continuous lines, and the corresponding coordination number (CN), shown with dashed lines, for Cl− and water molecules at different salt concentrations. Representative orientations for the water molecules around a Cl− ion for (b) 10 wt.%, (c) 20 wt.%, (d) 40 wt.%, and (e) 60 wt.% CaCl2 concentrated solutions are illustrated, with distances in nm (nanometers). The purple arrow labels the typical distance between a Cl− ion and a Ca2+ ion corresponding to the peak RDF in (a) denoting the first shell.
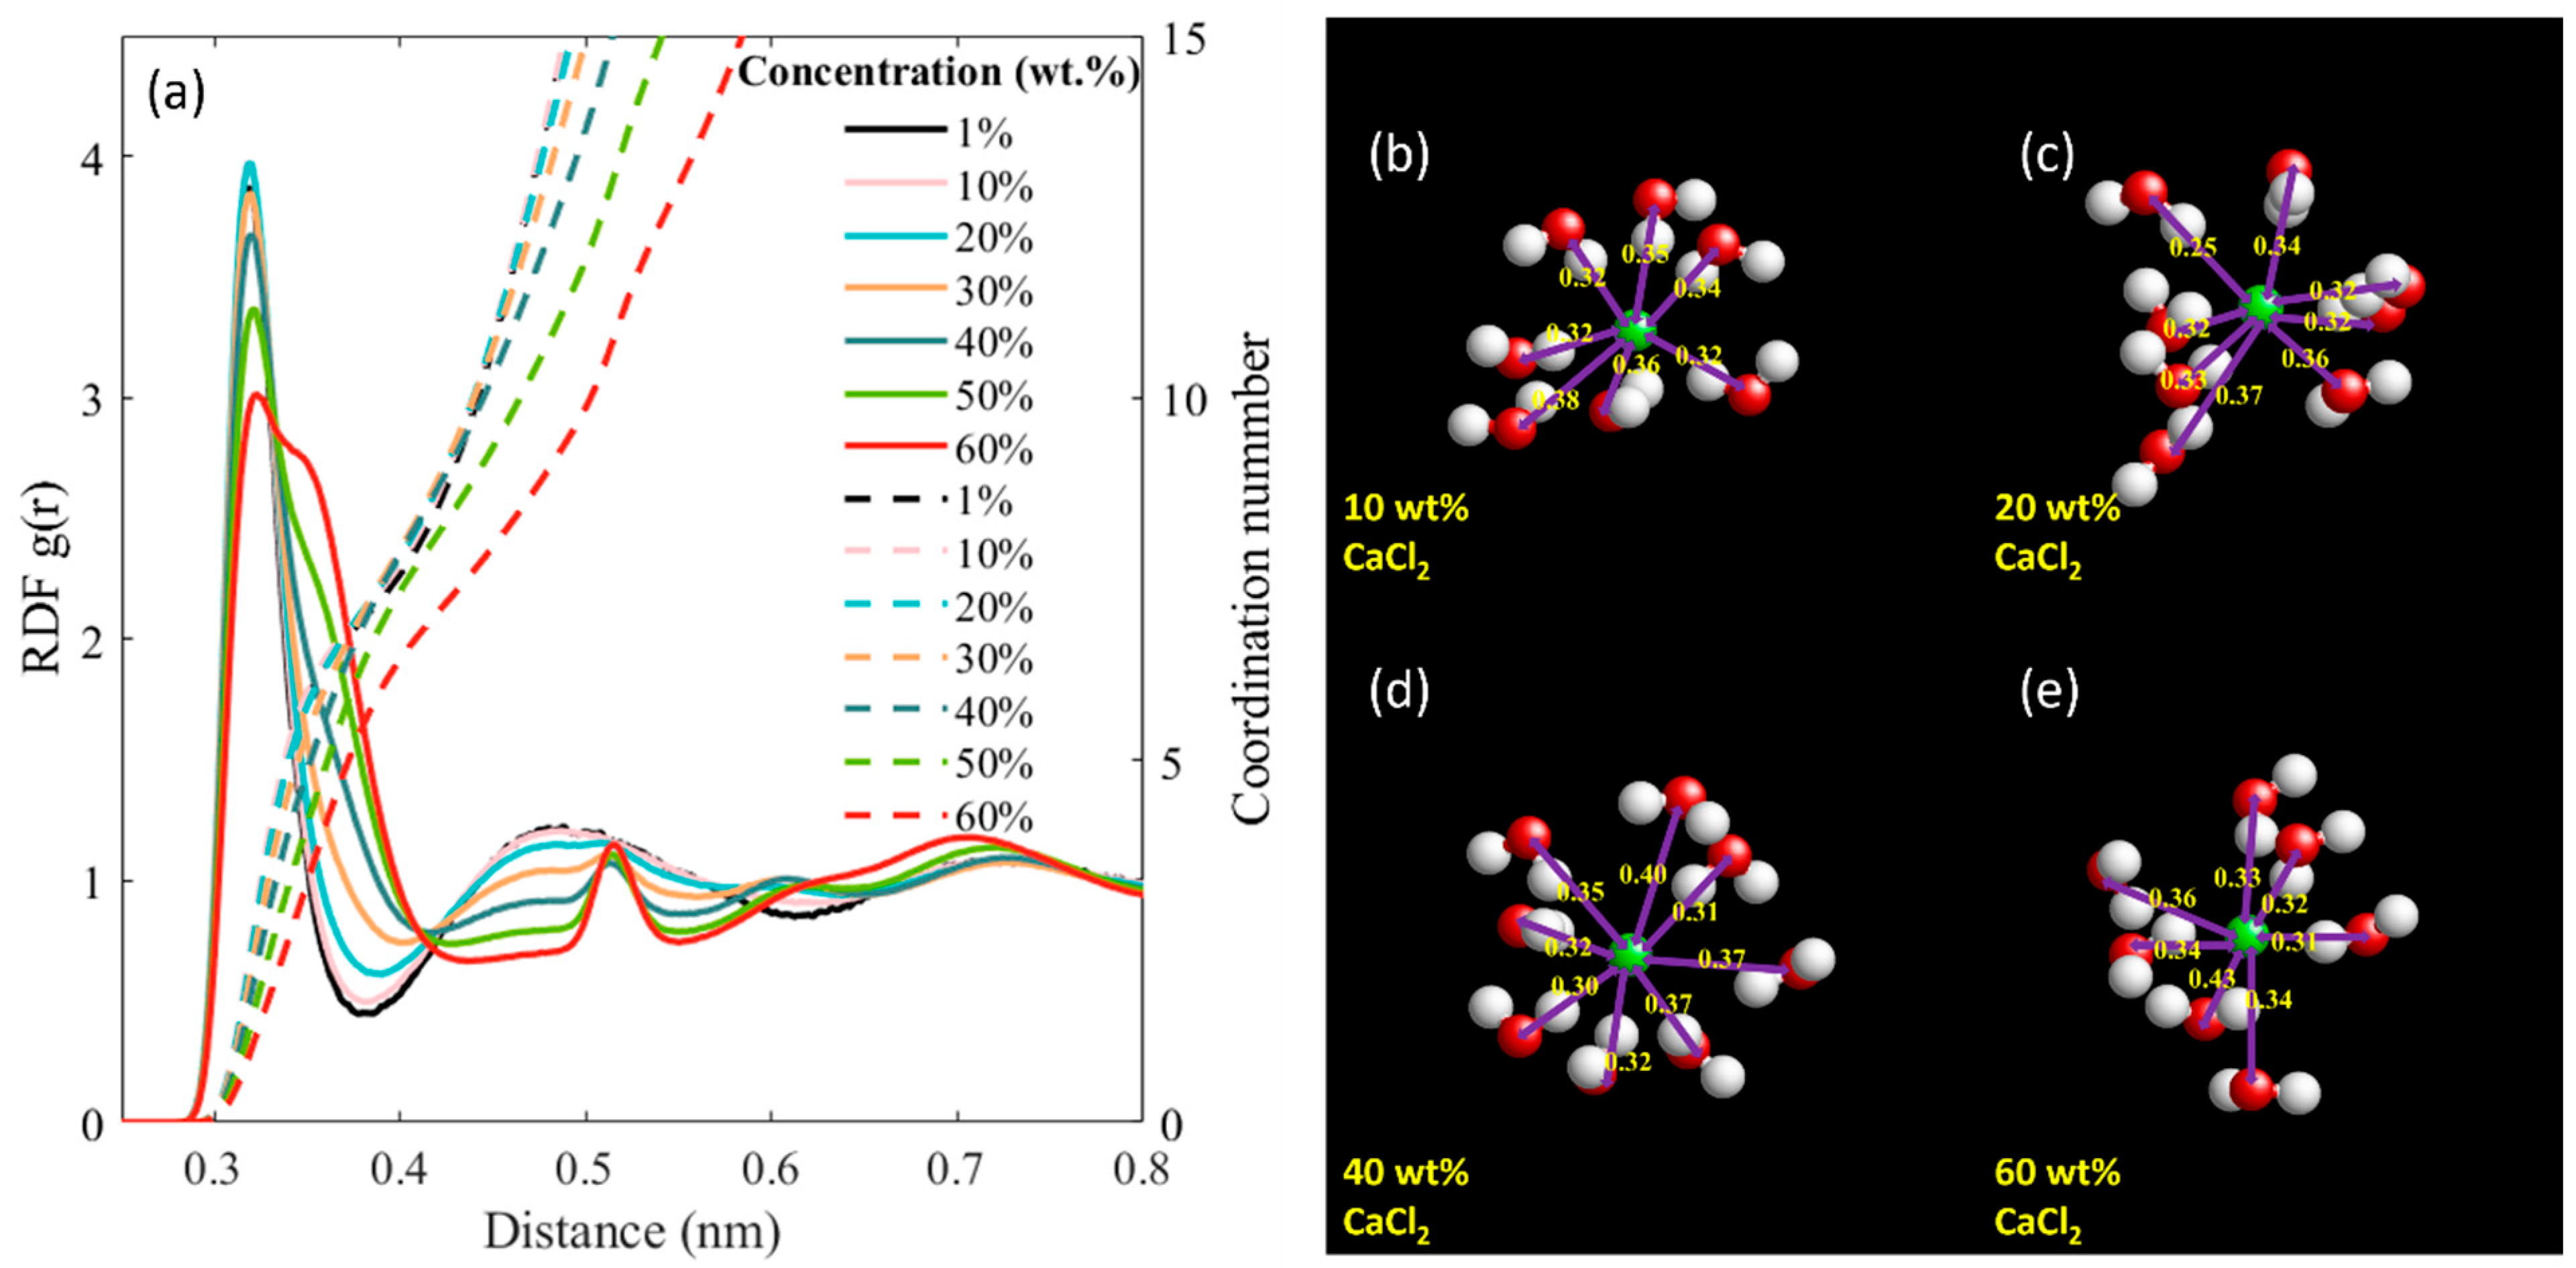
Figure 5.
The radial distribution function (RDF) presented as continuous lines, and the corresponding coordination number (CN), shown with dashed lines, for Cl2+, Cl− and water molecules at different salt concentrations.
Figure 5.
The radial distribution function (RDF) presented as continuous lines, and the corresponding coordination number (CN), shown with dashed lines, for Cl2+, Cl− and water molecules at different salt concentrations.
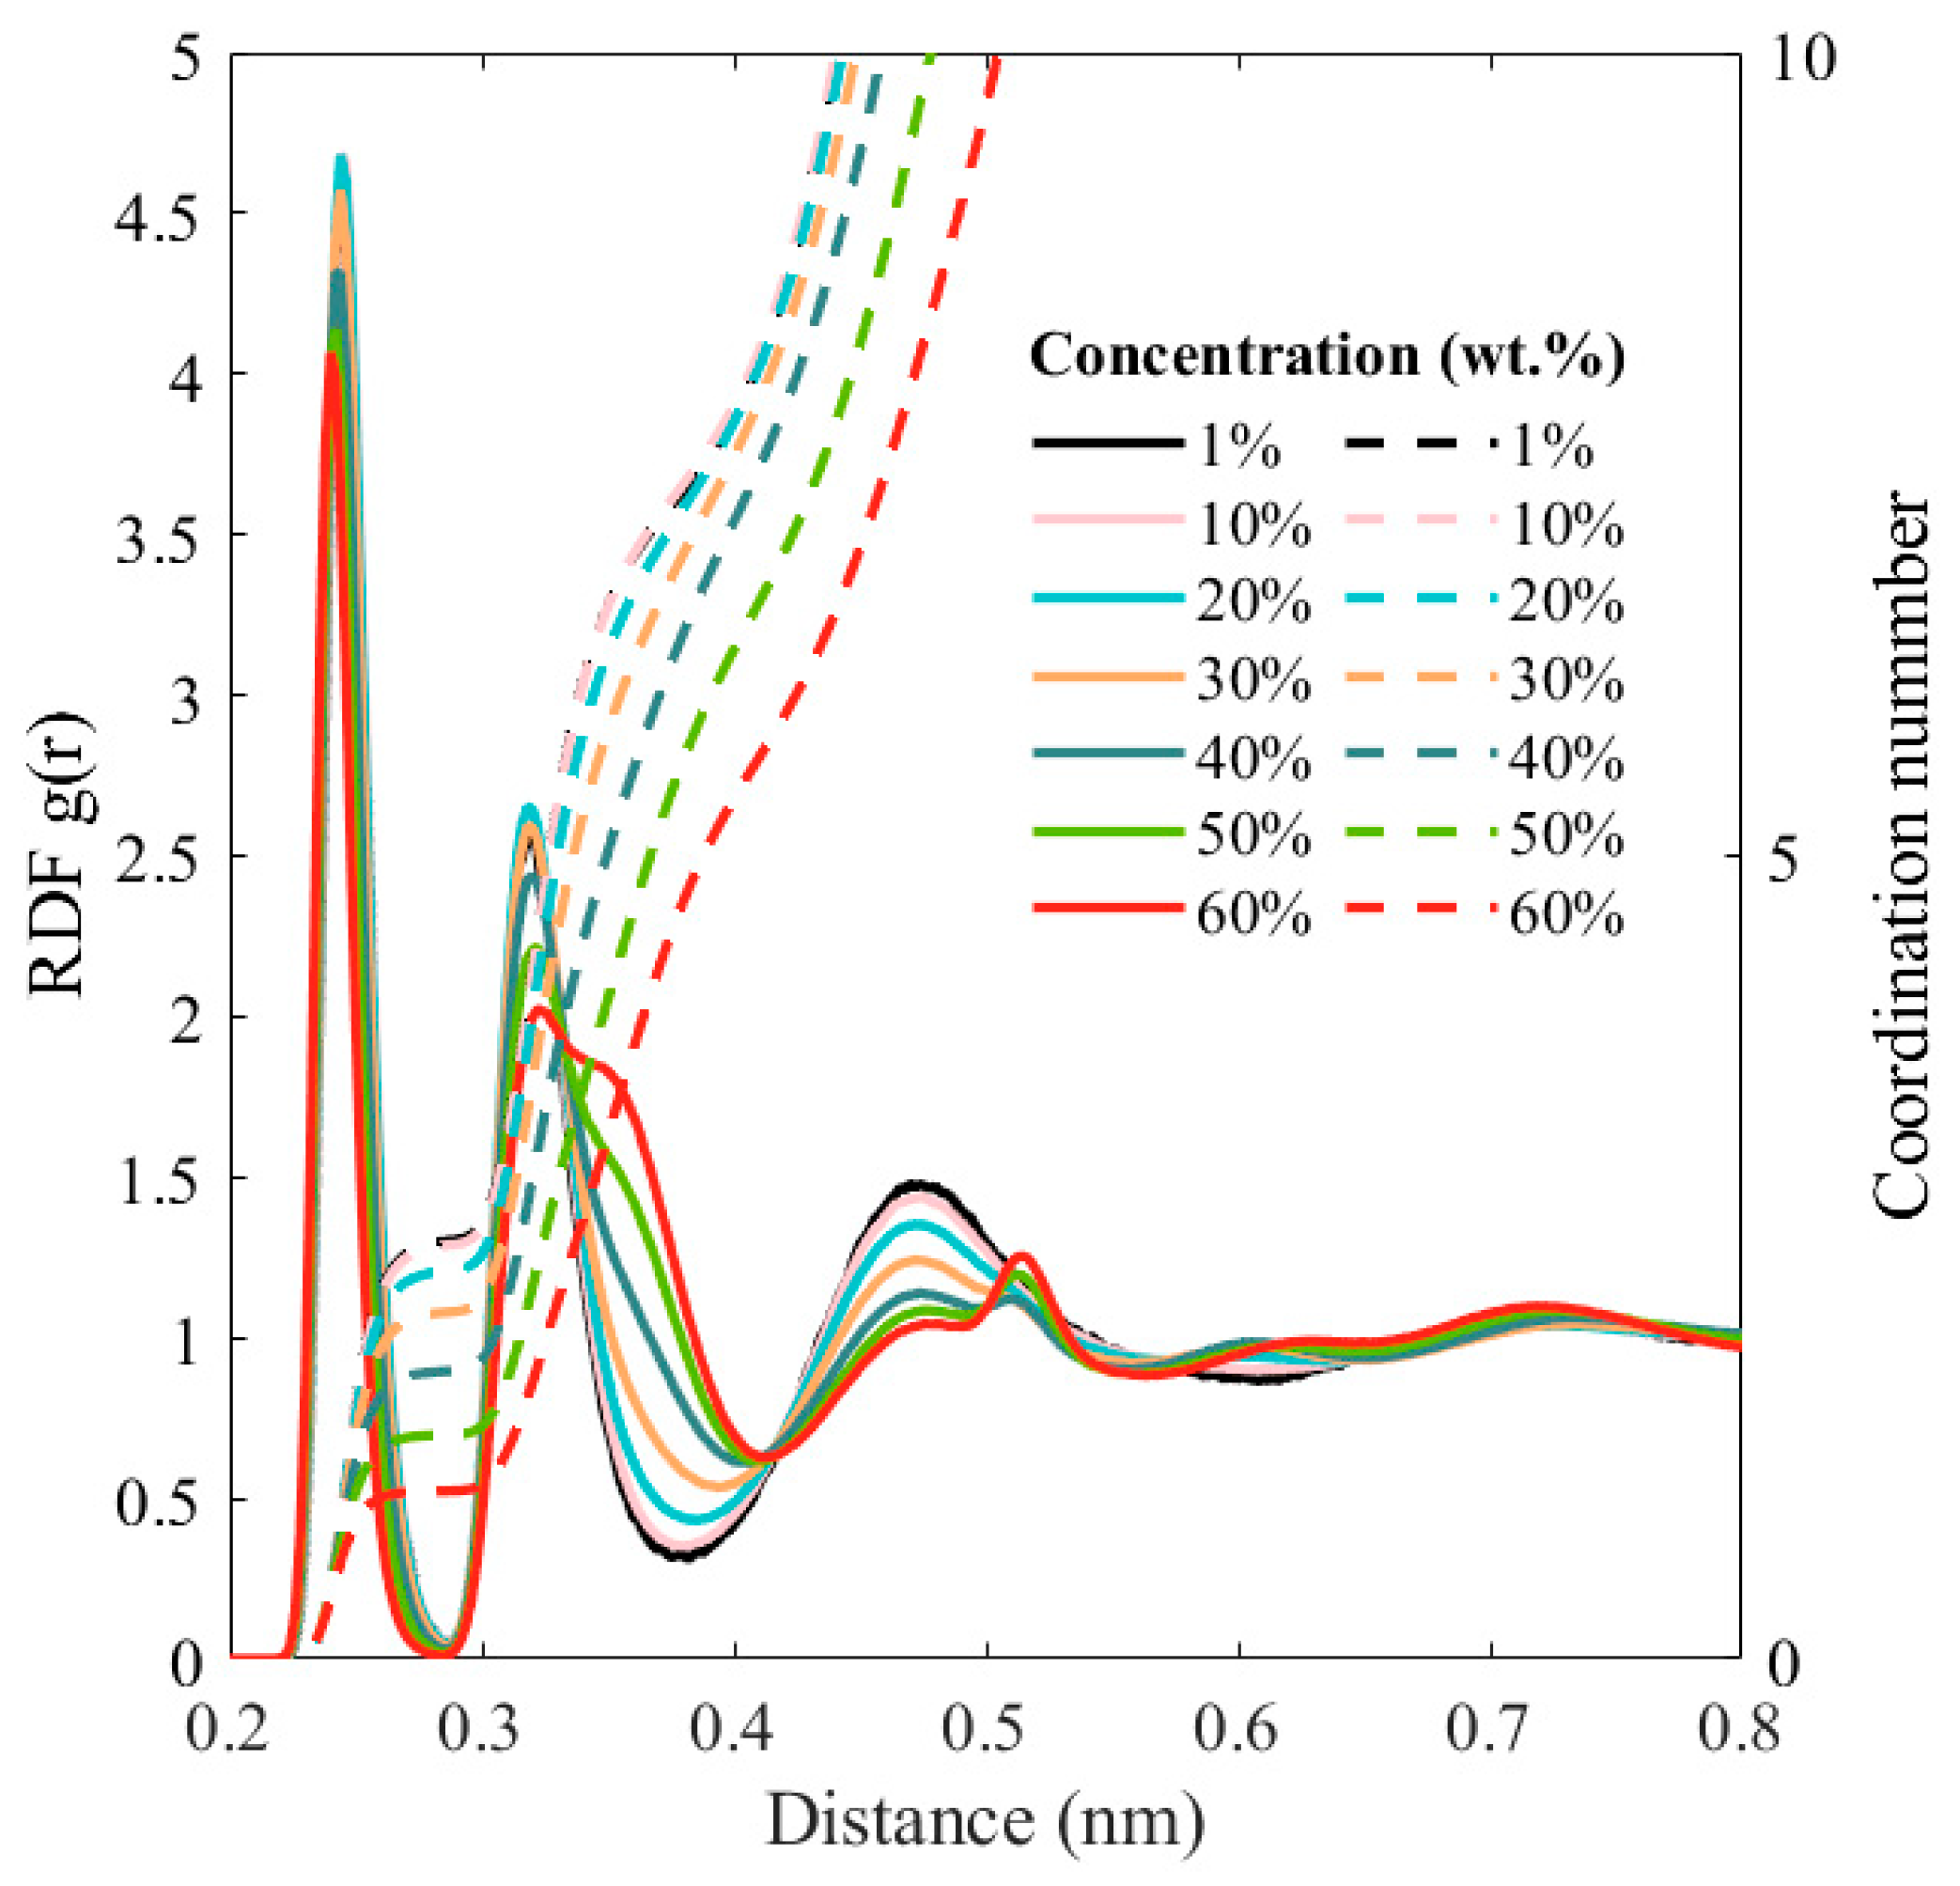
Figure 6.
The variation in the coordination numbers of different pairs of species with changes in salt concentrations. The solid line represents the simulation result obtained in this work, while the dashed line represents the experimental (Exptl.) result, adapted with permission from Ref. [40]. 2003, Chialvo, Ariel A.; Simonson, J. Michael.

Figure 7.
(a) Self−diffusion coefficient for CaCl2 with changes in salt concentration. The experimental data is reprinted with permission from Ref. [42]. 1953, J. R. Hall, B. F. Wishaw, R. H. Stokes (b) The corresponding variations in the mean square displacement (MSD) for CaCl2 with simulation time for selected salt concentrations (c) Self−diffusion coefficients for Ca2+, Cl−, and water with changes in salt concentration. Above the solubility limit, ~7 M, the diffusion of ions and water molecules is significantly reduced, leading to the diffusion coefficient approaching near-zero values.
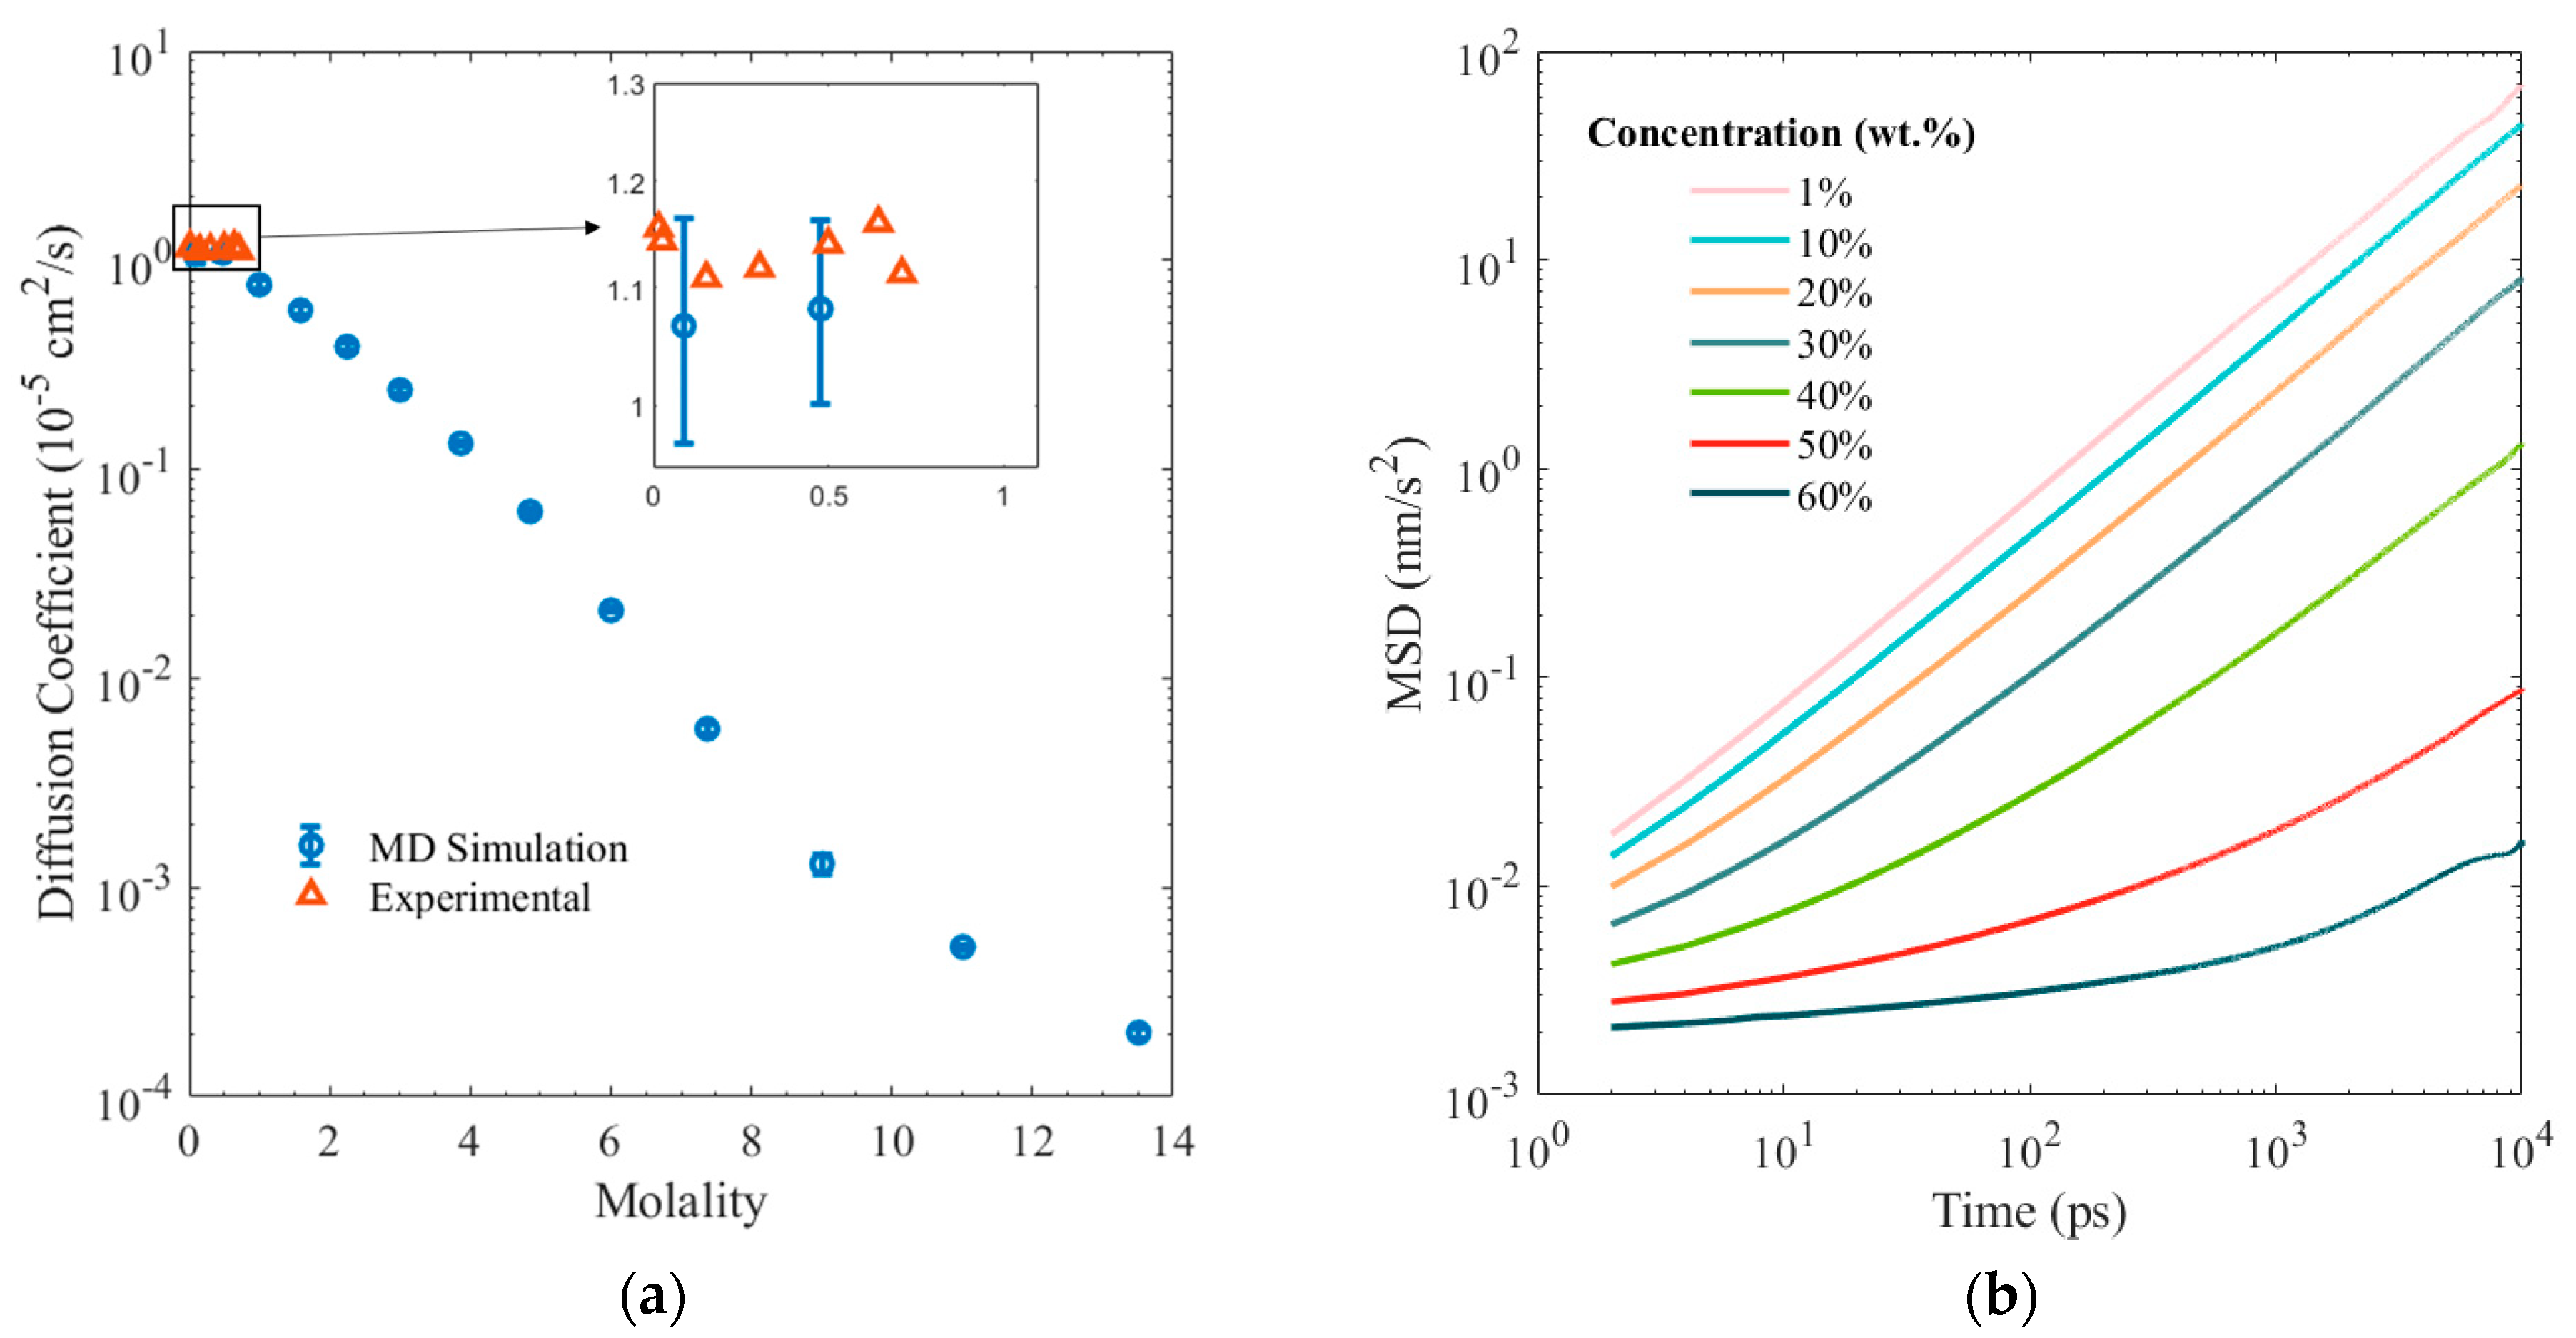
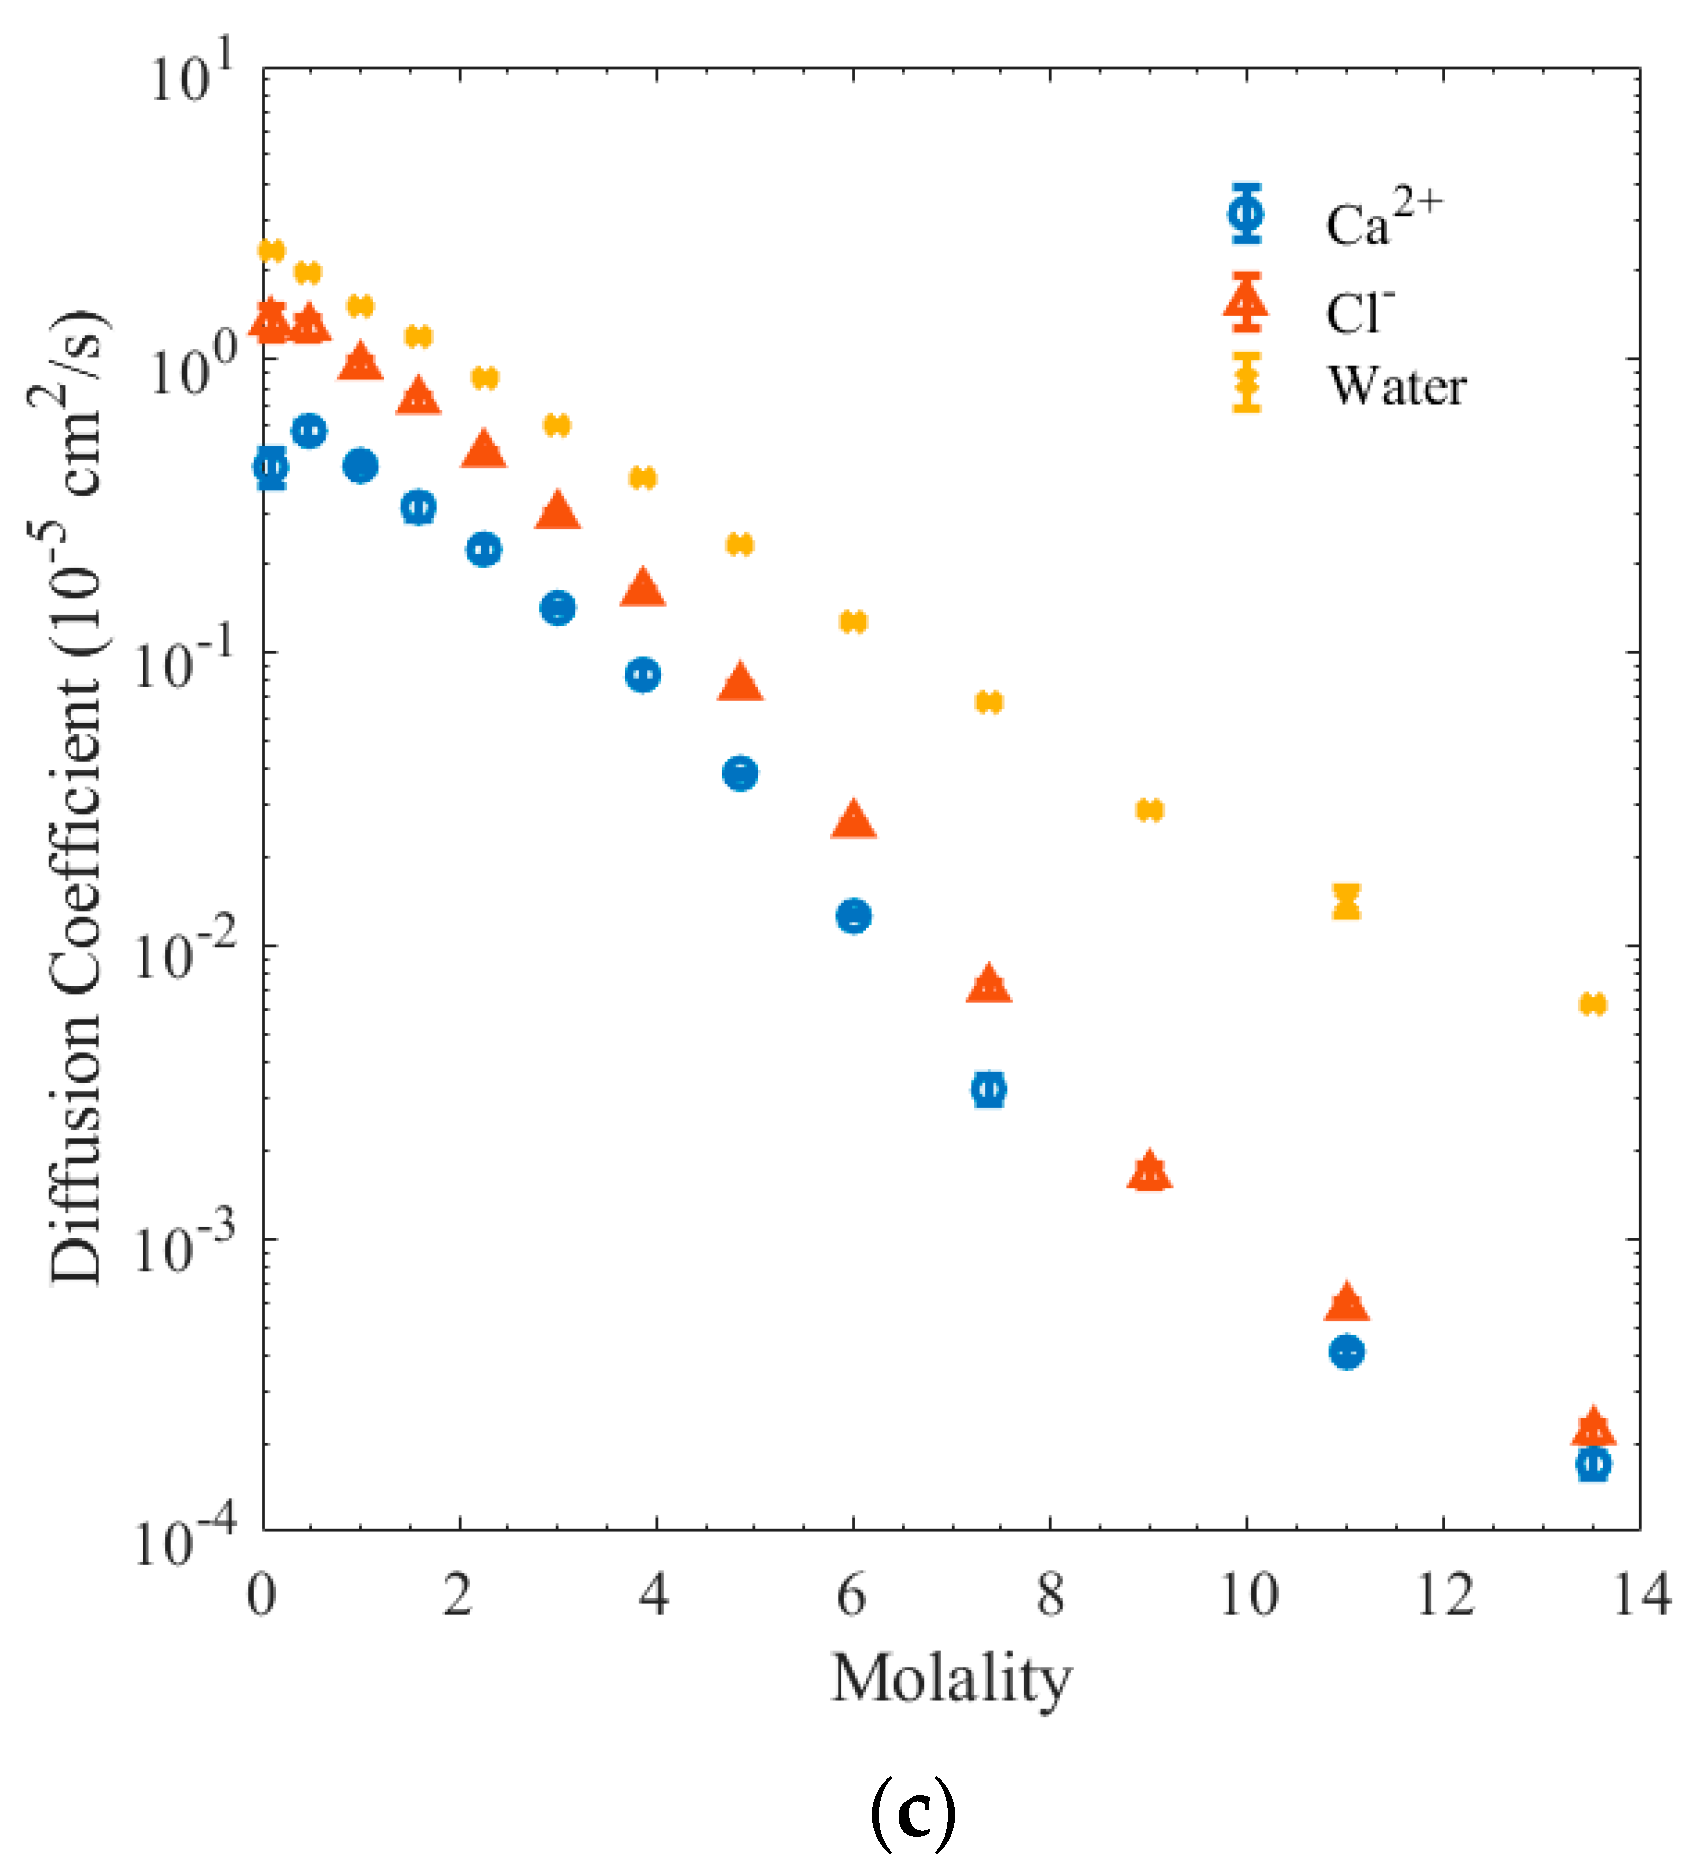
Figure 8.
(a) Fluctuations of hydrogen bond populations c(t) with changes in salt concentrations demonstrate the effect of time required for the solute to undergo complete dissolution. (b) The rate of relaxation to equilibrium k(t) varies with salt concentrations but is indicative of the rather fast simulation times for the solution to attain equilibrium.
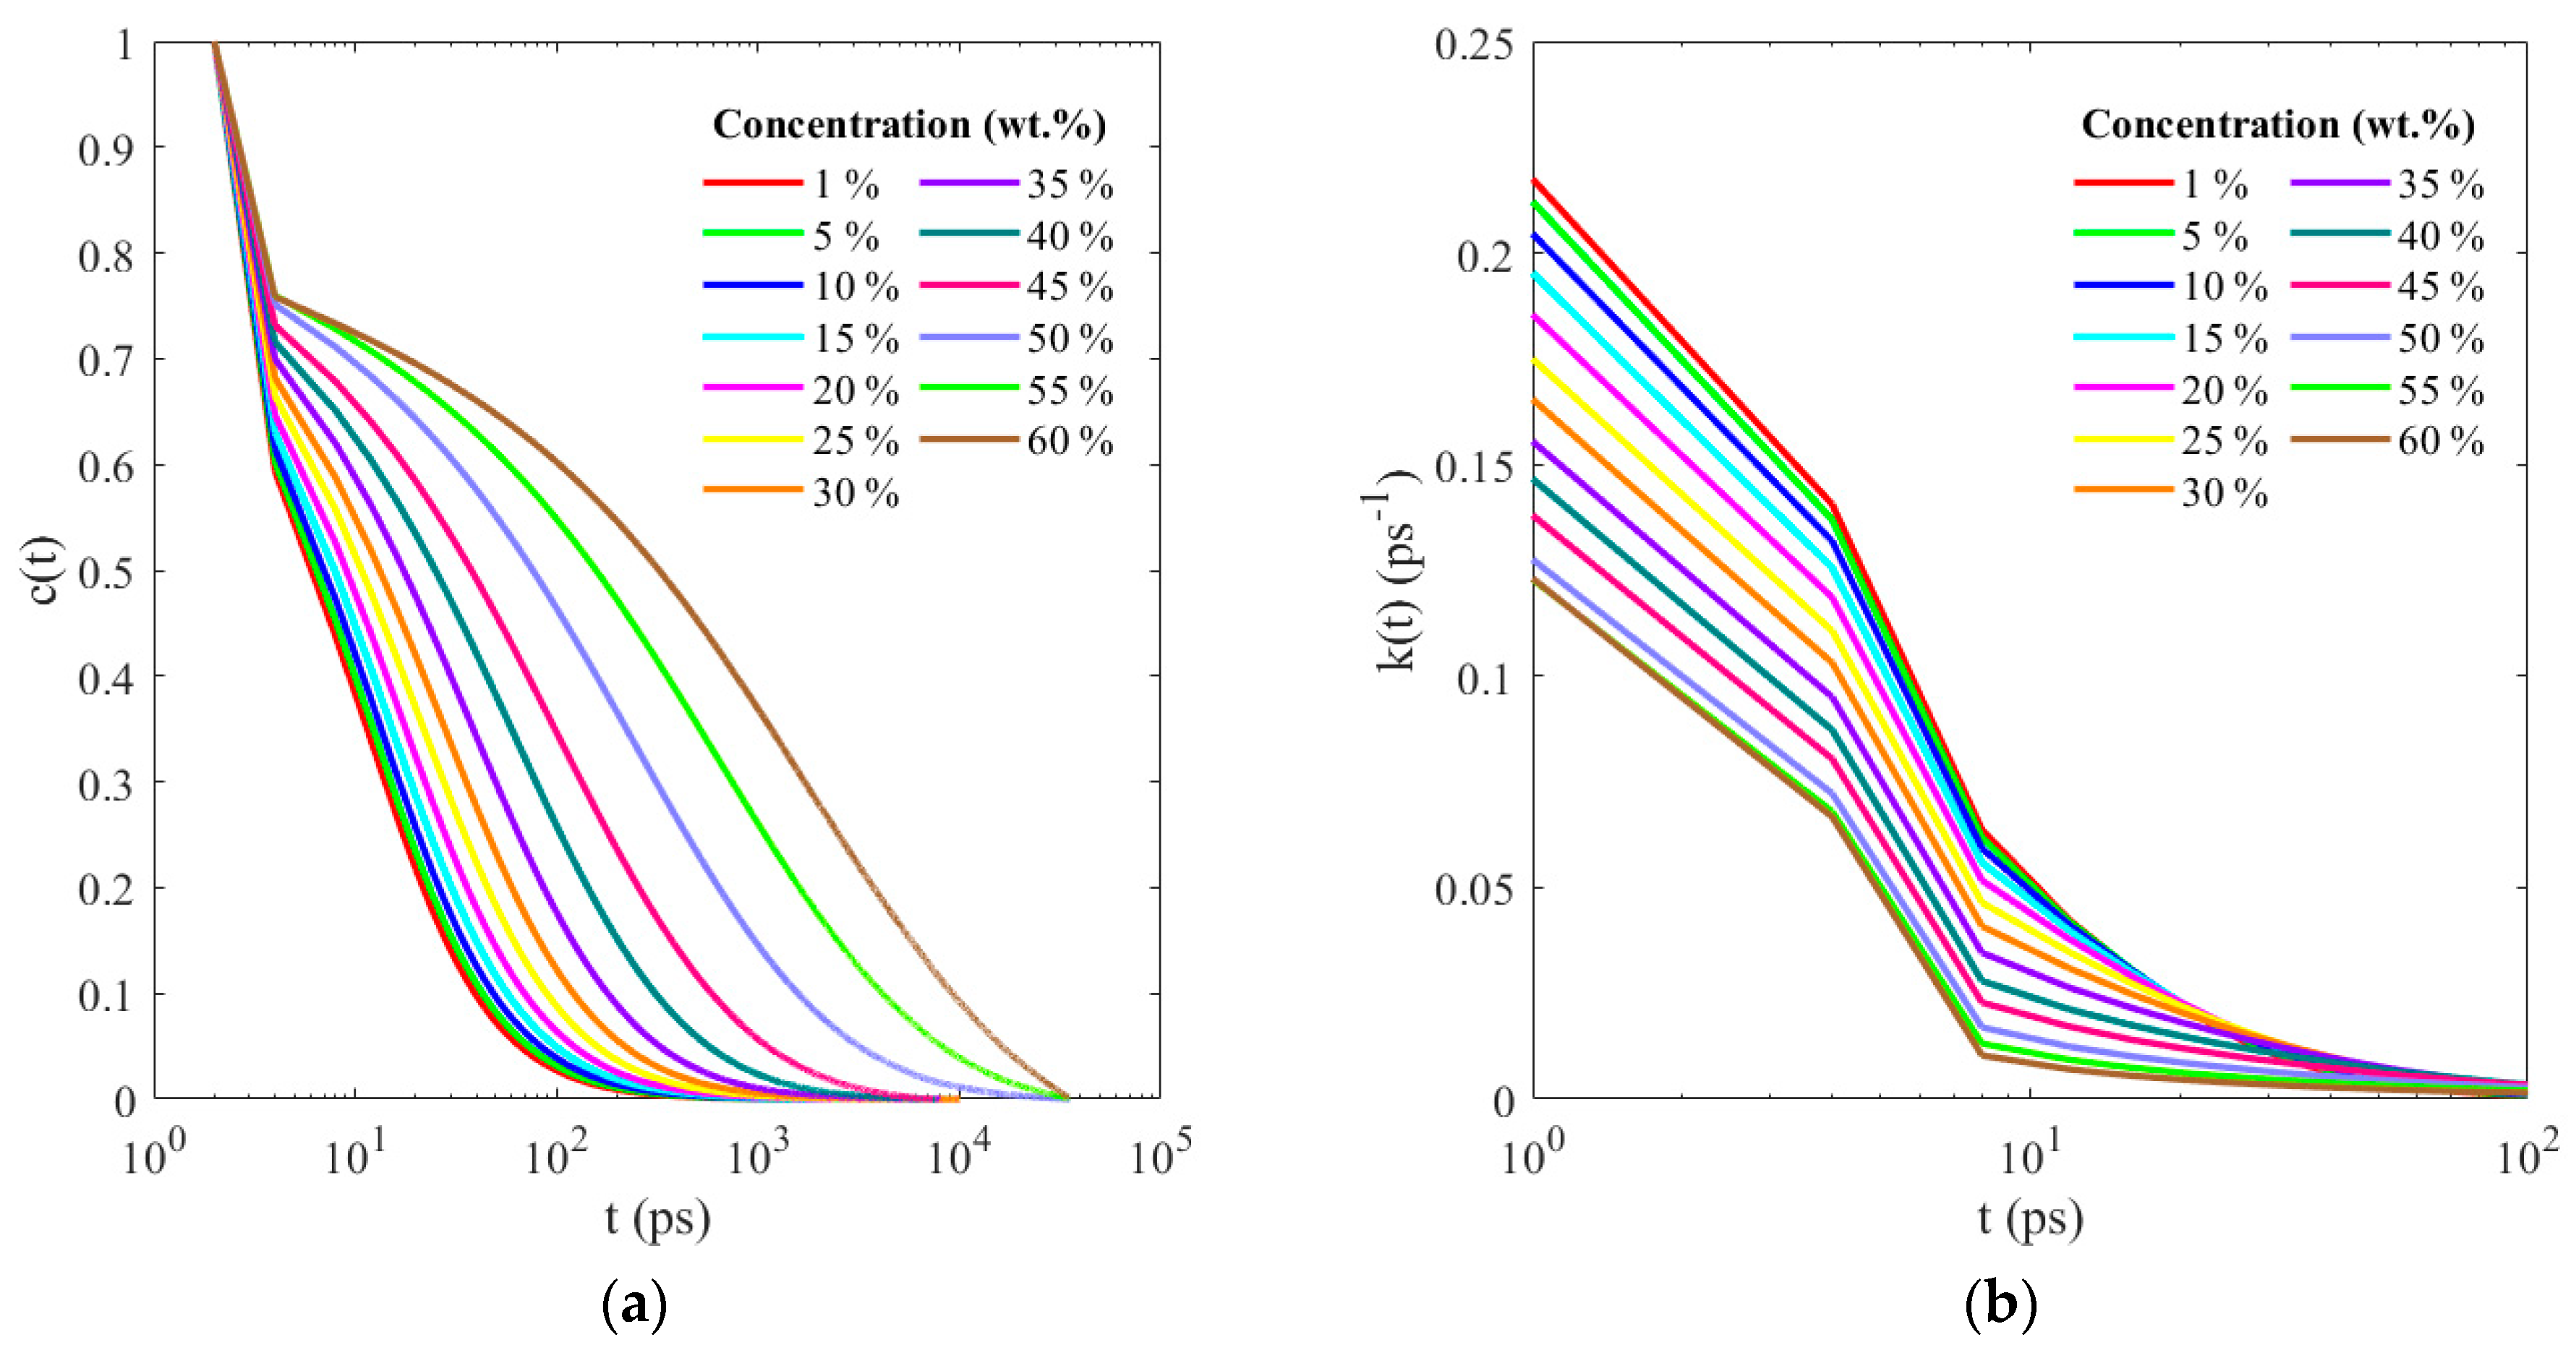
Figure 9.
(a) Kirkwood−Buff integrals between (a) Ca2+ and Cl−, (b) Ca2+ and water, and (c) Cl− and water indicate the relative effects of salt concentration on the structural configuration formed by the ion pairs in (a) and the hydration shells in (b,c).
Figure 9.
(a) Kirkwood−Buff integrals between (a) Ca2+ and Cl−, (b) Ca2+ and water, and (c) Cl− and water indicate the relative effects of salt concentration on the structural configuration formed by the ion pairs in (a) and the hydration shells in (b,c).

Table 1.
Number of ions and water molecules present in the simulated systems at different salt concentrations (weight %) of the solution.
Table 1.
Number of ions and water molecules present in the simulated systems at different salt concentrations (weight %) of the solution.
| CaCl2 wt.% | Molality (mol/kg) | Number of Molecules/Ions | ||
|---|---|---|---|---|
| Water | Ca2+ | Cl− | ||
| 1.00% | 0.1 | 6996 | 11 | 22 |
| 5.00% | 0.5 | 6852 | 59 | 118 |
| 10.00% | 1.0 | 6669 | 120 | 240 |
| 15.00% | 1.6 | 6474 | 185 | 370 |
| 20.00% | 2.3 | 6267 | 254 | 508 |
| 25.00% | 3.0 | 6048 | 327 | 654 |
| 30.00% | 3.9 | 5814 | 405 | 810 |
| 35.00% | 4.9 | 5568 | 487 | 974 |
| 40.00% | 6.0 | 5307 | 574 | 1148 |
| 45.00% | 7.4 | 5025 | 668 | 1336 |
| 50.00% | 9.0 | 4728 | 767 | 1534 |
| 55.00% | 11.0 | 4407 | 874 | 1748 |
| 60.00% | 13.5 | 4062 | 989 | 1978 |
Table 2.
The non-bonded (Lennard-Jones and Coulomb) and bonded (bonds, angles) interaction parameters for Ca2+, Cl−, and parameters for water modeled using the SPC potential [34].
Table 2.
The non-bonded (Lennard-Jones and Coulomb) and bonded (bonds, angles) interaction parameters for Ca2+, Cl−, and parameters for water modeled using the SPC potential [34].
| Sites | σ (nm) | ε (kJ/mol) | q (e) |
|---|---|---|---|
| Ca | 0.2813 | 0.5069 | 2.000 |
| Cl | 0.4448 | 0.4571 | −1.000 |
| Ow | 0.3166 | 0.6502 | −0.820 |
| H | 0.0000 | 0.0000 | 0.410 |
| Bond types | Interaction function | r0 (nm) | kb (kJ·mol−1·nm−4) |
| Ow-H | 0.1 | 2.32 × 10⁷ | |
| Angle types | Interaction function | ϴ0 degrees | kϴ kJ mol−1 rad−2 |
| H-Ow-H | 109.5 | 434 |
Disclaimer/Publisher’s Note: The statements, opinions and data contained in all publications are solely those of the individual author(s) and contributor(s) and not of MDPI and/or the editor(s). MDPI and/or the editor(s) disclaim responsibility for any injury to people or property resulting from any ideas, methods, instructions or products referred to in the content. |
© 2023 by the authors. Licensee MDPI, Basel, Switzerland. This article is an open access article distributed under the terms and conditions of the Creative Commons Attribution (CC BY) license (https://creativecommons.org/licenses/by/4.0/).
Share and Cite
MDPI and ACS Style
Yan, L.; Balasubramanian, G. Examining the Hydration Behavior of Aqueous Calcium Chloride (CaCl2) Solution via Atomistic Simulations. Physchem 2023, 3, 319-331. https://doi.org/10.3390/physchem3030022
AMA Style
Yan L, Balasubramanian G. Examining the Hydration Behavior of Aqueous Calcium Chloride (CaCl2) Solution via Atomistic Simulations. Physchem. 2023; 3(3):319-331. https://doi.org/10.3390/physchem3030022
Chicago/Turabian StyleYan, Lida, and Ganesh Balasubramanian. 2023. "Examining the Hydration Behavior of Aqueous Calcium Chloride (CaCl2) Solution via Atomistic Simulations" Physchem 3, no. 3: 319-331. https://doi.org/10.3390/physchem3030022