

Identifying the Role of Disulfidptosis in Endometrial Cancer via Machine Learning Methods

1
College of Biomedical Engineering, South-Central Minzu University, Wuhan 430074, China
2
Hubei Key Laboratory of Medical Information Analysis and Tumor Diagnosis & Treatment, Wuhan 430074, China
3
Key Laboratory of Cognitive Science, State Ethnic Affairs Commission, Wuhan 430074, China
*
Authors to whom correspondence should be addressed.
BioMedInformatics 2023, 3(4), 908-925; https://doi.org/10.3390/biomedinformatics3040056
Submission received: 1 July 2023
/
Revised: 29 August 2023
/
Accepted: 15 September 2023
/
Published: 13 October 2023
(This article belongs to the Topic Computational Intelligence and Bioinformatics (CIB))
Abstract
:Uterine corpus endometrial carcinoma (UCEC) is the second most common gynecological cancer in the world. With the increased occurrence of UCEC and the stagnation of research in the field, there is a pressing need to identify novel UCEC biomarkers. Disulfidptosis is a novel form of cell death, but its role in UCEC is unclear. We integrate differential analysis and the XGBoost algorithm to determine a disulfidptosis-related characteristic gene (DRCG), namely LRPPRC. By prediction and verification based on online databases, we construct a regulatory network of ceRNA in line with the scientific hypothesis, including a ceRNA regulatory axis and two mRNA-miRNA regulatory axes, i.e., mRNA LRPPRC/miRNA hsa-miR-616-5p/lncRNA TSPEAR-AS2, mRNA LRPPRC/miRNA hsa-miR-4658, and mRNA LRPPRC/miRNA hsa-miR-6783-5p. We use machine learning methods such as GBM to screen out seven disulfidptosis-related characteristic lncRNAs (DRCLs) as predictors, and build a risk prediction model with good prediction ability. SCORE = (1.136*LINC02449) + (−2.173*KIF9-AS1) + 0.235*ACBD3-AS1) + (1.830*AL354892.3) + (−1.314*AC093677.2) + (0.636*AC113361.1) + (−0.589*CDC37L1-DT). The ROC curve shows that in the training set samples, the AUCs for predicting 1-, 3-, 6-, and 10-year OS are 0.804, 0.724, 0.719, and 0.846, respectively. In the test set samples, the AUCs for predicting 1-, 3-, 6-, and 10-year OS are 0.615, 0.657, 0.687, and 0.702, respectively. In all samples, the AUCs for predicting 1-, 3-, 6-, and 10-year OS are 0.752, 0.706, 0.705, and 0.834, respectively. CP724714 has been screened as a potential therapy option for individuals who have a high risk of developing UCEC. Two subtypes of disulfidptosis-related genes (DRGs) and two subtypes of DRCLs are obtained by NMF method. We find that subtype N1 of DRGs is mainly enriched in various metabolic pathways, and subtype N1 may play a significant role in the process of disulfidptosis. Our study confirms for the first time that disulfidptosis plays a role in UCEC. Our findings help improve the prognosis and treatment of UCEC.
Keywords:
disulfidptosis; endometrial cancer; machine learning; LRPPRC; ceRNA; risk prediction model1. Introduction
UCEC is one of the most common cancers in the female population, and its incidence is increasing worldwide [1]. Although UCEC mortality has continued to decline over the past few years, the increase in its incidence may hinder further reductions in mortality [2]. Previous studies have made significant progress in interpreting the biology of endometrial cancer, but there are still many controversies in treatment, including the role of surgical lymph node evaluation and how to select patients for adjuvant radiotherapy or chemotherapy [3]. Although therapy has improved the prognosis for the majority of early-stage UCEC patients, some still experience tumor recurrence or metastasis [4], which significantly reduces the survival probability of advanced patients with tumor recurrence or metastasis [5]. The uncertainty of the prognosis of endometrial cancer is a very challenging issue for clinicians [6]. Moreover, accumulating evidence suggests that the management of endometrial cancer should be personalized, and gene down-regulation and the in vitro efficacy of drugs are influenced by the molecular profile [7,8,9]. Therefore, exploring new prognostic biomarkers for endometrial cancer is of significant importance to help treat UCEC.
Disulfidptosis is a novel cell death mode found in research [10], which is distinct from other cell death modes such as apoptosis, necrosis, and cuproptosis. Studies show that under glucose starvation conditions, cells with high expression of SLC7A11 would have an abnormal accumulation of intracellular disulfides such as cystine, which would induce disulfide stress and increase the content of disulfide bonds in the actin cytoskeleton. Subsequently, it will cause the contraction of actin filaments, destroy the cytoskeleton structure, and eventually lead to cell death. Studies have shown that the use of glucose transporter inhibitors in metabolic treatment can stop the spread of cancer [11], which may open up a new direction for cancer treatment. Understanding the development of UCEC may be aided by the deterioration of thiol-disulfide equilibrium brought about by oxidative stress [12]. Protein disulfide isomerase inhibitors may enhance endometrial receptivity [13]. Disulfidptosis has some association with endometrial cancer, but no study has reported the role of disulfidptosis in UCEC.
Competing endogenous RNA (ceRNA) participates in cancer pathogenesis, in which mRNA and noncoding RNA compete for the same miRNA to regulate each other. Once their expression imbalance may lead to the development of cancer [14]. Circesrp1 causes proliferation and metastasis of UCEC cells by absorbing miR-874-3p, resulting in the upregulation of cpeb4 expression [15]. Rp11-395g23.3 acts as a sponge for miRNA-205-5p, increasing PTEN expression to inhibit UCEC development [16]. Nevertheless, the function of the disulfidptosis-related ceRNA network in UCEC is still blank. Because noncoding RNAs are involved in tumor transformation and cell metabolism, many studies are exploring the function of lncRNAs in the occurrence and development of cancer [17]. A high-precision UCEC prognostic model was constructed according to seven necroptosis-related lncRNAs [18]. To accurately predict the viability of UCEC, research [19] developed a new prognostic model using five lncRNAs associated with genomic instability. Therefore, it is expected to construct a risk prediction model by disulfidptosis-related characteristic lncRNAs to accurately predict the viability of UCEC patients. In addition, many studies use molecular subtypes to guide treatment, such as studies using the non-negative matrix factorization (NMF) method, which identified four TCGA transcriptional subtypes and three histological subtypes [20]. It is worth noting that no UCEC-related molecular typing has been found under the disulfidptosis mechanism.
In this paper, we study the role of disulfidptosis in the development of UCEC. Our main contributions are as follows: Firstly, we identify a DRCG by using the eXtreme Gradient Boosting (XGBoost) algorithm, screen the miRNA and lncRNA targets of the DRCG by using the online database, and construct a regulatory network of ceRNA in line with the hypothesis. Secondly, we screen seven predictors by univariate Cox regression analysis and the least absolute shrinkage and selection operator (LASSO), and multivariate Cox regression analysis, and construct a UCEC risk prediction model. Thirdly, we obtain two typings by using the NMF clustering method, and discuss the biological characteristics of these two typings. To the best of our knowledge, this is the first time to carry out this work. Our findings will help to understand the mechanism of disulfidptosis in UCEC and provide a novel direction for precision medicine of UCEC.
2. Materials And Methods
2.1. Download and Reprocess Data
The TCGA-UCEC dataset was downloaded from the Cancer Genome Atlas (TCGA) database (https://portal.gdc.cancer.gov/, (accessed on 14 September 2023), and clinical data were also downloaded from the TCGA database. TCGA-UCEC had a total of 577 endometrial samples, including 554 tumor samples and 23 normal samples. Expression data were normalized to fragments per kilobase million (FPKM) by readr (V 2.1.3) and rjson (V 0.2.21) R packages, and mRNA and lncRNA expression profiles were separated.
2.2. Acquisition and Differential Analysis of Disulfidptosis-Related Genes
GYS1, LRPPRC, NCKAP1, NDUFA11, NDUFS1, NUBPL, OXSM, RPN1, SLC3A2, and SLC7A11 are 10 disulfidptosis-related genes (DRGs) reported in the study [10]. Next, we used the limma (V 3.50.3) R package for differential analysis to explore the differential expression of these 10 DRGs between tumor samples and normal samples in TCGA-UCEC. The screening threshold was set at p < 0.05 and |logFC| > 2. That is, genes that meet this condition were considered to be differentially expressed genes.
2.3. Identification of Disulfidptosis-Related Characteristic Genes
Based on the expression matrix of 10 DRGs, we use the eXtreme Gradient Boosting (XGBoost) algorithm to rank the importance of these 10 DRGs. This step is implemented using the xgbtree method in the caret (V 6.0-93) R package. A feature is considered more significant when it appears as a partition attribute more frequently across all trees. Therefore, these DRGs can be sorted by this method. Using the ggplot2 (V 3.3.6) R package, the importance ranking of DRGs was presented as a histogram. Finally, the disulfidptosis-related characteristic genes (DRCGs) were fully identified comprehensively in the results of differential analysis.
2.4. Construction of Cerna Regulatory Network
Through the above steps, we can identify a DRCG in endometrial cancer, and then use the miRDB database (http://www.mirdb.org/ (accessed on 14 September 2023) to select miRNAs that have a targeting relationship to this DRCG. We used miRNAs with (target score) >80 as miRNA targets for this DRCG. After obtaining miRNA targets of DRCG, the expression of these miRNA targets in UCEC was verified through the UALCAN database (https://ualcan.path.uab.edu/ (accessed on 14 September 2023), and miRNAs meeting the ceRNA scientific hypothesis were screened. Next, the RNAIner database (http://www.rnainter.org/ (accessed on 14 September 2023) was used to select lncRNA targets of miRNAs, the UALCAN database was used to verify the differential expression of lncRNA targets between normal UCEC samples and tumor samples, and lncRNAs in line with the ceRNA scientific hypothesis were screened. Finally, the corresponding targeting relationship between mRNA-miRNA-lncRNA was sorted, and the ceRNA regulatory network diagram was drawn by Cytoscape (V 3.7.2) software.
2.5. Identification of Disulfidptosis-Related Characteristic lncRNAs
To explore the function of lncRNAs in UCEC, we performed the co-expression analysis of disulfidptosis-related mRNAs and lncRNAs. Taking p < 0.05 and the correlation coefficient |R| > 0.2 as screening conditions, we screened lncRNAs associated with 10 DRGs, which we named disulfidptosis-related lncRNAs (DRLs). Gradient Boosting Machine (GBM) is a common sorting algorithm that uses different weights to linearly combine base learners so that learners who perform well can be repurposed. Therefore, we use the GBM algorithm to rank the importance of these DRLs. This step is implemented using the GBM method in the GBM (V 2.1.8.1) R package. We considered DRLs with an important score (overall > 0.1) as disulfidptosis-related characteristic lncRNAs (DRCLs).
2.6. Construction of Risk Prediction Model
Through the analysis in the previous step, we obtained 109 DRCLs. After combining clinical survival data from patients with expression data from these DRCLs, all samples were randomly separated into training and test sets at a ratio of 4:1. Univariate Cox regression analysis was used to screen for DRCLs associated with UCEC prognosis in the training set. Then, the predictors were compressed using the Lasso regression model to avoid overfitting the model. The predictors that were eventually employed to construct the risk prediction model were finally filtered out using multivariate Cox regression analysis. The model formula is as follows:
In the formula, SCORE represents the risk score computed on the basis of the model formula, and DRCLC and DRCLE represent the coefficient and expression level of each DRCL in the multivariate Cox regression analysis and the total number of DRCLs used to construct the risk prediction model, respectively.
2.7. Performance Evaluation of Risk Prediction Model
The risk score for each patient can be determined using the model formula, and the median risk score can then be determined, allowing patients to be divided into high- and low-risk groups. Through survival analysis, the model’s prognostic outcomes in the training set, test set, and all samples were evaluated. The model’s potential as a prognostic factor for UCEC without relying on other clinical features was examined using univariate Cox and multivariate Cox regression analysis. Then, the accuracy of the risk prediction model was evaluated by the receiver operating characteristic (ROC) curve and the concordance index (CI) curve. Finally, a nomogram was created using a patient’s clinical characteristics and risk prediction score to estimate survival.
2.8. Mining of Drugs for Treating UCEC Patients
To make this risk prediction model useful for the drug treatment of UCEC, we calculated the half maximal inhibitory concentration (IC50) of anti-UCEC drugs via the pRRophetic (V 0.5) R package. Drugs with p < 0.00001 are considered to have a significant correlation with UCEC, and drugs that meet this requirement are thought to differ significantly across high- and low-risk populations. Finally, drugs suitable for treating high-risk and low-risk patients were screened.
2.9. Cluster Analysis of DRGS
To further understand the mechanism of DRGs in UCEC, we ran an NMF clustering analysis on DRGs. The nmf method in the NMF (V 0.26) R package was used, and the clustering threshold was set to 2–10. According to the expression level of DRGs in UCEC, the initial matrix was decomposed into two non-negative matrices after 10 iterations. That is, two subtypes were obtained. Principal component analysis (PCA) was used to validate whether the two subtypes could be clearly distinguished. Subsequently, survival analysis was used to confirm the difference in survival rates between the two subtypes. Differences in the enrichment of the GO function and KEGG pathway between the two subtypes were explored through GSVA, and the pheatmap (V 1.0.12) R package was used for visualization. Differences in immune cell expression in the two subtypes were investigated by ssGSEA and presented as boxplots. In addition, we further compared the DRG expressions of the two subtypes.
2.10. Cluster Analysis of DRCLS
To further understand the role of DRCLs in UCEC, we ran an NMF clustering analysis on DRCLs using an analysis method similar to that in the previous step. PCA analysis, survival analysis, and differential analysis were performed. Then, we also explored the relationship between the two subtypes and the risk subgroups and survival status of patients and showed it in the form of a Sankey diagram. Finally, we also assessed the differences in risk scores between subtypes of DRGs and DRCLs.
2.11. Statistical Analysis
The Pearson correlation test was used to assess correlation in this study. The significance between survival curves was assessed by the log-rank test. All statistical analyses and plots were performed using R (v 4.1.2) software. * p < 0.05, ** p < 0.01, *** p < 0.001. Statistical significance was considered significant as long as p < 0.05 was satisfied. The flow chart of these analyses is shown in (Figure 1).
3. Results
3.1. Identification of Disulfidptosis-Related Characteristic Genes Combined with the XGBoost Algorithm
We verified the expression differences of 10 DRGs between normal and tumor samples in TCGA-UCEC by differential analysis. Unfortunately, only LRPPRC and OXSM, two genes, were found to be expressed differently between the tumor group and the normal group, and both LRPPRC and OXSM were considerably under-expressed in the tumor group (Figure 2A). To explore the importance of these 10 DRGs in endometrial cancer, we used the XGBoost algorithm to rank the importance of these 10 DRGs. And LRPPRC’s importance score at UCEC was 100, while OXSM’s importance score was only 22 (Figure 2B). Therefore, we combined the results of differential analysis and the XGBoost algorithm to identify LRPPRC as a disulfidptosis-related characteristic gene in endometrial cancer.
3.2. Construction of LRPPRC-Related ceRNA Network
To ascertain if LRPPRC has prognostic significance in UCEC, survival analysis was utilized. Results demonstrated a substantially different overall survival of LRPPRC between the high-risk and low-risk groups of UCEC, and a poorer prognosis for patients in the high-risk group (Figure 2C). To further explore the role of LRPPRC in UCEC, we used the miRDB database to predict miRNAs with a targeting relationship to LRPPRC. We took the (target score) >80 as the screening condition, and obtained 15 miRNAs (Table S1). According to the ceRNA scientific hypothesis, since LRPPRC is significantly down-regulated in the tumor group, miRNA targets that are significantly up-regulated in the tumor group should be screened. In other words, before the next analysis, the expression of these 15 miRNAs in UCEC must be verified to screen for miRNA targets that conform to the scientific hypothesis. We verified the expression of these 15 miRNAs using the UALCAN database and found that only three miRNAs, hsa-miR-616-5p, hsa-miR-4658, and hsa-miR-6783-5p, were significantly up-regulated in the tumor group (Figure 2D–F). Next, we used the RNAInter database to predict lncRNAs that have target relationships with these three miRNAs. The results showed that there were eight lncRNA targets (Table S2) of hsa-miR-616-5p and two lncRNA targets (Table S3) of hsa-miR-4658, but no lncRNA target of hsa-miR-6783-5p was obtained. Then, we used the UALCAN database to explore the difference of these lncRNA targets between UCEC tumor samples and normal samples, trying to screen lncRNAs that conform to the scientific hypothesis of ceRNA, to construct the ceRNA regulatory network. Fortunately, through validation of expression, we found that only the lncRNA target TSPEAR-AS2 of hsa-miR-616-5p was significantly down-regulated in the UCEC tumor group (Figure 2G). Therefore, we obtained (mRNA LRPPRC)-(miRNA hsa-miR-616-5p)-(lncRNA TSPEAR-AS2), the only ceRNA regulatory axis that conforms to the scientific hypothesis. In addition, we also identified two mRNA-miRNA regulatory axes, (mRNA LRPPRC)-(miRNA hsa-miR-4658) and (mRNA LRPPRC)-(miRNA hsa-miR-6783-5p). Finally, Cytoscape was used to build the regulatory network for ceRNA (Figure 2H).
3.3. Identification of Disulfidptosis-Related Characteristic lncRNAs via GBM Algorithm
First, we conducted co-expression analysis in 10 TCGA-UCEC DRGs and lncRNAs and obtained 177 DRLs (Figure 3A). To improve the efficiency of the subsequent construction of the risk prediction model, the GBM algorithm is used to sort the importance of these DRLs to select and delete those DRLs with an importance score of 0. After feature selection of the GBM algorithm (Figure 3B), we obtained 109 DRLs and identified these DRLs as DRCLs.
3.4. Constructing a Risk Prediction Model Based on DRCLS
The expression profiles and clinical survival information of 109 DRCLs obtained above were merged, and all samples were randomly divided into training and test sets in a 4:1 ratio. The prognostic significance of these DRCLs in UCEC was assessed in the training set using univariate Cox regression analysis, and the findings revealed 16 variables associated with UCEC prognosis (Figure 3C). The predictors were selected using lasso regression analysis in the next phase. The lambda equaled 0.03013, which means that the model’s performance is optimal when there are 10 predictors (Figure 3D,E). Multivariate Cox regression analysis was then used to screen predictors for modeling from these 10 predictors, and seven DRCLs were obtained, which were LINC02449, KIF9-AS1, ACBD3-AS1, AL354892.3, AC093677.2, AC113361.1, and CDC37L1-DT, respectively. In addition, according to the regression coefficients of these seven DRCLs, it can be seen that LINC02449, AL354892.3, and AC113361.1 are risk DRCLs, while KIF9-AS1, ACBD3-AS1, AC093677.2, and CDC37L1-DT are protective DRCLs. Therefore, the risk prediction model formula can be obtained, SCORE = (1.136*LINC02449) + (−2.173*KIF9-AS1) + (−0.235*ACBD3-AS1) + (1.830*AL354892.3) + (−1.314*AC093677.2) + (0.636*AC113361.1) + (−0.589*CDC37L1-DT). Finally, we analyzed the correlation between these 7 DRCLs and 10 DRGs. SLC7A11 was not correlated with these seven DRCLs, while other DRGs were correlated with these DRCLs to some extent (Figure 3F).
3.5. Survival Analysis
According to the model formula obtained in the previous step, the risk score of each UCEC patient can be calculated, so the median risk score can also be calculated. Then, all UCEC patients could be divided into high- and low-risk groups based on the median risk score, which was established as the dividing threshold. Data from the training set were introduced to verify the difference in survival between high-risk and low-risk groups through survival analysis. In the training set samples, the overall survival (OS) curve demonstrated that high-risk patients had considerably lower survival rates than low-risk patients (Figure 4A). The median survival time for high-risk patients in the training sample was approximately 8.5 years. The risk curve shows that the mortality risk of UCEC patients will increase with the increase in the risk score, which may ultimately lead to shorter survival time (Figure 4B). The survival status scatter diagram makes it clear that an increase in the risk score corresponds to an increase in patient death (Figure 4C). To test the universality of the risk prediction model, we used data from the test set for survival analysis. The test set survival curve, risk curve, and scatter plot all revealed that low-risk individuals had much greater survival rates than high-risk ones (Figure 4D–F). Finally, we conducted a survival analysis on all samples using the same methodology, and the findings revealed that high-risk patients had a poorer prognosis than low-risk patients (Figure 4G–I). Therefore, the analysis results of training sets, test sets and all samples are consistent, which indicates that the risk prediction model on the basis of seven DRCLs can effectually predict the survival ability of UCEC patients. From these heatmaps (Figure 4J–L), we can see that in the training set, test set, and all samples, LINC02449, AL354892.3, and AC113361.1 were significantly up-regulated in the high-risk group, while KIF9-AS1, ACBD3-AS1, AC093677.2, and CDC37L1-DT were significantly down-regulated in the high-risk group. This is in line with the outcomes of the risk and protection factors we evaluated, which shows that the dataset we divided is reasonable.
3.6. Evaluate the Performance of the Risk Forecasting Model
To determine whether the risk score computed by the risk prediction model can be utilized as a prognostic factor for UCEC independently of other clinical traits, univariate Cox and multivariate Cox regression analyses were employed. Univariate Cox analysis showed that age, grade and risk score could be used as independent prognostic factors (Figure 5A), while multivariate Cox analysis showed that only grade and risk score could be used as independent prognostic factors (Figure 5B). Therefore, we can determine that the risk score may be an independent prognostic factor. Then, the model’s accuracy in predicting patient viability was evaluated by the area under the ROC curve. The ROC curve shows that in the training set samples (Figure 5C), the AUC for predicting 1-, 3-, 6-, and 10-year OS was 0.804, 0.724, 0.719, and 0.846, respectively. In the test set samples (Figure 5D), the AUC for predicting 1-, 3-, 6-, and 10-year OS was 0.615, 0.657, 0.687, and 0.702, respectively. In all samples (Figure 5E), the AUC for predicting 1-, 3-, 6-, and 10-year OS was 0.752, 0.706, 0.705, and 0.834, respectively. In addition, CI was added to test whether the predictive power of the risk prediction model outperformed other clinical traits. The CI value of the risk score was greater than that of all clinical features (Figure 5F). The above analysis shows that the risk prediction model has superior prediction accuracy. Finally, we created a nomogram to predict patient survival by assigning each patient a risk score and some clinical characteristics, then aggregating the scores in accordance with the nomogram. For example, if the total score of a patient is 302 (Figure 5G), it can be predicted that the probability of survival of the patient greater than 1-, 3-, and 5-years is 0.926, 0.714, and 0.617. The calibration curve is used to assess the accuracy of the nomogram. As shown in (Figure 5H), the actual observed value of the patient and the predicted value curve of the model can be well fitted, which proves that the nomogram has good prediction performance.
3.7. Risk Assessment of DRGS and Survival Analysis of Subgroups of Clinical Traits
We investigated the expression of 10 DRGs between high- and low-risk groups through differential analysis, of which only 7 DRGs had significant differential expression between high- and low-risk groups. SLC3A2, RPN1, NCKAP1, and LRPPRC were significantly up-regulated in the high-risk group, while SLC7A11, NDUFA11, and OXSM were significantly down-regulated in the high-risk group (Figure 6A). Then, we divided some clinical traits into two subgroups by age and three subgroups by grade. Survival study results showed that in both age and grade groups, patients in the high-risk group had a lower chance of surviving than those in the low-risk group. In addition, the difference in survival among women younger than 65 years old was more significant than among women older than 65 years old (Figure 6B,C). The difference in survival between G3-grade patients is greater than that between G1 and G2-grade patients (Figure 6D–F).
3.8. Mining Potentially Sensitive Drugs for UCEC Treatment
Through the built-in datasets in the pRRophetic package, potentially sensitive drugs that can be used for UCEC treatment are mined. After the screening, 14 drugs that could be used to treat UCEC were identified, of which the IC50 values of CP724714 and Epothilone B were significantly negatively correlated with the risk score (Figure 7A,B), while 12 drugs such as Bortezomib, Dasatinib, and TGX221 IC50 values were significantly positively correlated with the risk score (Figure 7C–H). Then, we checked the IC50 values of these 14 drugs between high-risk and low-risk groups. The results showed that, except for CP724714 and Epothilone B (Figure 7I,J), which were significantly down-regulated in the high-risk group, the other 12 drugs were significantly down-regulated in the low-risk group (Figure 7K–P). Therefore, CP724714 and Epothilone B may be better for treating high-risk patients with UCEC, while 12 drugs such as Bortezomib, Dasatinib, and TGX221 are better for treating low-risk patients with UCEC. It is worth noting that here, we only show the results of eight drugs. See the Supplementary Materials for all results (Figure S1).
3.9. Biological Characteristics of DRG Cluster
Based on the expression profile of DRGs in UCEC, we ran NMF clustering analysis, and the results obtained two subtypes of DRGs (Figure 8A). The optimal number of subtypes is determined by cophenetics, dispersion, residuals, and silhouette. We named these two subtypes N1 and N2. PCA results showed that subtypes N1 and N2 could be clearly distinguished on the basis of the expression level of DRGs (Figure 8B). We then assessed the viability of N1 and N2. The survival curve showed a substantial difference between subtypes N1 and N2 in overall survival, with subtype N1 having a better prognosis than subtype N2 (Figure 8C). To further reveal the biological characteristics of these two subtypes, we used GSVA to explore GO functions and KEGG pathways enriched in subtypes N1 and N2. Subtype N2 was mainly enriched in biological processes like mRNA methylation, RNA interference, and regulation of nucleobase-containing compound transport. In addition, subtype N2 is also enriched in molecular functions such as histone methyltransferase binding, mRNA methyltransferase activity, and double-stranded RNA binding, suggesting that subtype N2 may play a regulatory role in biological functions such as RNA methylation. Meanwhile, subtype N1 is mainly enriched in the biological process regulation of insulin secretion involved in cellular response to glucose stimulus, and cellular component of the proton-transporting two sector atpase complex proton-transporting domain (Figure 8D). At the same time, we found that subtype N1 was largely enriched in metabolic pathways like linoleic acid metabolism, arachidonic acid metabolism, and phenylalanine metabolism, indicating that subtype N1 played a significant role in cellular metabolic activities, while N2 is mainly enriched in mismatch repair, cell cycle, and spliceosome pathways (Figure 8E). We observed the abundance of immune infiltrating cells in subtypes N1 and N2 by ssGSEA. According to the boxplot, except for the abundance of three immune infiltrating cells—Activated CD4 T cell, Regulatory T cell, and Type 2 T helper cell—which are more abundant in subtype N2, the other 20 immune infiltrating cells in N1 are more abundant than in N2 (Figure 8F). Finally, we verified the expression differences of 10 DRGs in subtypes N1 and N2 by difference analysis. Interestingly, among DRGs with differential expression, SLC7A11, SLC3A2, NCKAP1, NUBPL, LRPPRC, and NDUFS1 were all up-regulated in subtype N2, except NDUFA11, which was down-regulated in subtype N2 (Figure 8G). This indicates that subtype N2 has a strong association with DRGs, which may mean that N2 is involved in the disulfidosis process.
3.10. Biological Characteristics of DRCL Cluster
According to the expression profile of DRCLs in UCEC, we ran cluster analysis via NMF method, and the results obtained two subtypes N1 and N2 (Figure 9A). Similar to the method in the previous section, we first observed whether the two subtypes could be clearly distinguished by PCA. After removing an outlier, we can see that N1 and N2 can be clearly separated (Figure 9B). The survival curve revealed that the prognosis of subtype N1 was much better than that of N2 after we conducted a survival study (Figure 9C). Through differential analysis, we verified the expression differences of 10 DRGs in subtypes N1 and N2. SLC3A2, NCKAP1, NUBPL and LRPPRC were significantly up-regulated in subtype N2, while NDUFA11, OXSM and GYS1 were significantly down-regulated in subtype N2 (Figure 9D). The relationship between patient clusters, risk subgroups, and survival status is shown in the Sankey diagram (Figure 9E). Finally, we evaluated the risk score of the DRG and DRCL clusters. The risk score of subtype N2 in the DRG cluster was greater than that of subtype N1 (Figure 9F). Coincidentally, the risk score of subtype N2 in DRCLs is also higher than that of subtype N1 (Figure 9G), which is similar to the results just now. This may explain why subtype N2 of the DRG cluster and subtype N2 of the DRCL cluster are risk subtypes, which proves the conclusion finally reached in the previous part.
4. Discussion
Increasing incidence makes UCEC an important factor affecting women’s health [21]. UCEC is one of the few cancers with no significant improvement in survival rates since the 1970s, indicating that UCEC research progress has stagnated [22]. The newly discovered role of disulfidptosis in the development of UCEC is still unclear. Therefore, it is necessary to study the role of disulfidptosis in UCEC.
In this work, we first synthesized the results of differential analysis and XGBoost algorithm to identify a DRCG, namely LRPPRC. Then, 15 miRNA targets of LRPPRC were screened through the miRDB database, and expression of these miRNAs was verified in the UALCAN database. miRNA targets hsa-miR-616-5p, hsa-miR-4658, and hsa-miR-6783-5p were in line with the ceRNA scientific hypothesis. Then, the RNAIner database was used to predict lncRNA targets for these three miRNAs, and the expression of these lncRNAs was verified using the UALCAN database again. Only the lncRNA target TSPEAR-AS2 of hsa-miR-616-5p met the ceRNA scientific hypothesis. Therefore, we obtained a ceRNA regulatory axis, i.e., (mRNA LRPPRC)-(miRNA hsa-miR-616-5p)-(lncRNA TSPEAR-AS2). In addition, there are two mRNA-miRNA regulatory axes, i.e., (mRNA LRPPRC)-(miRNA hsa-miR-4658) and (mRNA LRPPRC)-(miRNA hsa-miR-6783-5p). Study by [23] constructed a prognostic model and nomogram for UCEC based on eight m6A regulatory factors, including LRPPRC, suggesting that LRPPRC plays a significant role in UCEC. However, the three miRNA targets were not reported to be UCEC-related in previous studies. Surprisingly, TSPEAR-AS2 has never reported involvement in the development of UCEC as well. This indicates that the ceRNA regulatory network we have constructed is relatively novel.
After co-expression analysis of mRNA-lncRNA based on 10 DRGs, 109 DRCLs were screened using the GBM algorithm. Through LASSO and Cox regression analysis, seven predictive factors were obtained, namely LINC02449, KIF9-AS1, ACBD3-AS1, AL354892.3, AC093677.2, AC113361.1, and CDC37L1-DT, respectively. It is commendable that the performance of the model constructed based on these seven DRCLs is relatively high in the training set, test set, and all samples. The AUC values of this model are comparable to those of these studies [24,25,26,27,28], indicating its good predictive ability. In addition, we have also identified drugs for treating UCEC patients. There are two types of drugs suitable for treating high-risk patients, CP724714 and Epothilone B. There are 12 drugs suitable for treating low-risk patients, including Bortezomib, Dasatinib, and TGX221. Epothilone B may improve the motor neuron differentiation of UCEC cells and may provide a special pathway for neuronal replacement in traumatic spinal cord injury [29]. Epothilone B is active in UCEC cells and has the potential to overcome drug resistance [30]. This is consistent with our results, but CP724714 has not been reported to be used in the treatment of UCEC, so CP724714 may be a potential drug for treating patients at high risk of UCEC. The combination of Sunitinib and Bortezomib may be used to treat UCEC patients after surgery and failed radiotherapy [31]. The combination of Caveolin-1, CRAF/BRAF, and Dasatinib has shown interesting clinical activity in UCEC [32]. Pharmacological inhibition of PI3KC by TGX221 may specifically inhibit patient cancer cells with endogenous PI3KC [33]. Therefore, some drugs have been reported in previous studies, which proves that the drugs we mined are reliable.
Through NMF clustering, we obtained two subtypes of DRGs and two subtypes of DRCLs. Between the two subtypes of DRGs, GSVA results showed that subtype N1 was mainly enriched in certain metabolic pathways like linoleic acid metabolism, arachidonic acid metabolism, and phenylalanine metabolism. Study [34] isolated a variety of important metabolites in a UCEC subtype, including linoleic acid. The study [35] mapped metabolites to the ingenuity pathway analysis database, and the results showed that arachidonic acid metabolism and other metabolites may be strongly related to UCEC. Functional analysis showed that phenylalanine and other metabolites could inhibit tumor cell proliferation, invasion, and migration in a dose-dependent manner [36]. This evidence shows that subtype N1 is closely related to UCEC’s metabolic activities. Activated CD4 + T and other immune infiltrating cells may be involved in the TARS-associated immune response in UCEC [37]. In the UCEC tumor environment, the presence of infiltrating regulatory T cells is associated with worse outcomes [38]. Study [39] found a positive correlation between type 2 T helper cells and genes that may play a special role in tumor immune infiltration. However, more immune infiltrating cells were enriched in subtype N1 than in subtype N2, indicating that subtype N1 may play an important role in UCEC immune infiltrating cell activities. It can be seen that subtype N1 of DRGs may be a key subtype in the development of UCEC. We then assessed the risk of these two subtypes and discovered that the risk score of subtype N1 was much lower than that of subtype N2, indicating that subtype N1 is a protective subtype in UCEC development. We also identified two subtypes, N1 and N2, based on the expression of 109 DRCLs. Through differential analysis, we found that the expression of SLC3A2, NCKAP1, NUBPL, NDUFA11, and LRPPRC was consistent in DRG typing and DRCL typing. Unfortunately, with the exception of the DRCG we identified, LRPPRC, there have been no previous reports proving that the other four genes are UCEC-related.
This study, mainly exploring the role of disulfidptosis in UCEC, demonstrates some distinctive strengths. First, we construct a new ceRNA network and risk prediction model. Second, we screen drugs for the treatment of UCEC. Third, we identified two subtypes of DRGs and two subtypes of DRCLs. However, this study still has some limitations. First, the data for this study are from TCGA and some online databases. We will try to perform experiments in the future. Second, the actual regulatory role of the ceRNA network in UCEC still needs to be verified by biological experiments, and to clarify whether the risk prediction model can be used in clinical applications also needs a large number of clinical trials. We will deal with these issues in the future.
5. Conclusions
In conclusion, we combine machine learning and bioinformatics methods to explore the role of disulfidptosis-related genes and lncRNAs in the occurrence and development of UCEC. First, we identify LRPPRC as DRCG, and construct a ceRNA regulatory network related to LRPPRC that conforms to the scientific hypothesis. Second, we construct a risk prediction model with good predictive performance based on seven DRCLs, and screen 14 potential drugs for UCEC treatment. Third, we identify typings of DRGs and DRCLs and explore their biological characteristics. The results are potentially of theoretical implications for improving the survival rate and treatment effect of UCEC, thus promising to contribute to the research and clinical practice.
Supplementary Materials
The following supporting information can be downloaded at: https://www.mdpi.com/article/10.3390/biomedinformatics3040056/s1, Figure S1: The correlation between 14 potentially sensitive drugs for the treatment of UCEC and the risk score, as well as the difference in IC50 values between high- and low-risk groups; Table S1: 15 miRNAs with targeted relationships with LRPPRC; Table S2: Eight lncRNAs with targeted relationships with hsa-miR-616-5p; Table S3: Two lncRNAs with targeted relationships with hsa-miR-4658.
Author Contributions
Conceptualization, F.F. and Z.L.; data curation, F.F.; formal analysis, F.F.; funding acquisition, Z.L.; methodology, F.F. and X.L.; project administration, Q.X. and Z.L.; resources, Z.L., X.L., Z.Z. and Q.X.; software, X.L. and Z.Z.; supervision, Q.X. and Z.L.; visualization, F.F.; writing—original draft, F.F.; writing—review and editing, Z.L. All authors have read and agreed to the published version of the manuscript.
Funding
This research was funded by Key Research and Development Program of Hubei Province (No. 2022BAA037), Fundamental Research Funds for the Central Universities, South-Central Minzu University (No. CZQ23050), Laboratory Research Project, South-Central Minzu University (No. SYYJ2022003), Teaching Reform Research Project, South-Central Minzu University (No. JYX21042), and Curriculum Reform Topic Research Project, South-Central Minzu University (No. KGZX202018).
Institutional Review Board Statement
Not applicable.
Informed Consent Statement
Not applicable.
Data Availability Statement
Data on corresponding UCEC samples were retrieved from TCGA (https://portal.gdc.cancer.gov/) (accessed on 14 September 2023).
Conflicts of Interest
The authors declare no conflict of interest.
Abbreviations
| UCEC | Uterine Corpus Endometrial Carcinoma |
| TCGA | The Cancer Genome Atlas |
| FPKM | Fragments per kilobase of transcript per million |
| DRGs | disulfidptosis-related genes |
| DRCG | disulfidptosis-related characteristic gene |
| ceRNA | competing endogenous RNA |
| XGBoost | eXtreme Gradient Boosting |
| GBM | Gradient Boosting Machine |
| DRLs | disulfidptosis-related lncRNAs |
| DRCLs | disulfidptosis-related characteristic lncRNAs |
| LASSO | Least absolute shrinkage and selection operator |
| OS | Overall survival |
| ROC | Receiver operating characteristic curve |
| AUC | Area under curve |
| CI | Concordance index |
| IC50 | the half maximal inhibitory concentration |
| NMF | non-negative matrix factorization |
| PCA | Principal Component Analysis |
| GSVA | Gene Set Variation Analysis |
| ssGSEA | single-sample Gene Set Enrichment Analysis |
References
- Crosbie, E.J.; Kitson, S.J.; McAlpine, J.N.; Mukhopadhyay, A.; Powell, M.E.; Singh, N. Endometrial cancer. Lancet 2022, 399, 1412–1428. [Google Scholar] [CrossRef] [PubMed]
- Siegel, R.L.; Miller, K.D.; Wagle, N.S.; Jemal, A. Cancer statistics, 2023. CA A Cancer J. Clin. 2023, 73, 17–48. [Google Scholar] [CrossRef] [PubMed]
- Brooks, R.A.; Fleming, G.F.; Lastra, R.R.; Lee, N.K.; Moroney, J.W.; Son, C.H.; Tatebe, K.; Veneris, J.L. Current recommendations and recent progress in endometrial cancer. CA A Cancer J. Clin. 2019, 69, 258–279. [Google Scholar] [CrossRef] [PubMed]
- Cui, Y.Q.; Xiang, Y.; Meng, F.; Ji, C.H.; Xiao, R.; Li, J.P.; Dai, Z.T.; Liao, X.H. ALDH2 promotes uterine corpus endometrial carcinoma proliferation and construction of clinical survival prognostic model. Aging 2021, 13, 23588. [Google Scholar] [CrossRef] [PubMed]
- Zhang, X.; Yin, X.; Zhang, L.; Ye, Z.; Liang, G. Identification of drug targets and prognosis projection for uterine carcinosarcoma based on alternative splicing events. Comput. Biol. Med. 2023, 152, 106346. [Google Scholar] [CrossRef] [PubMed]
- Budczies, J.; Seidel, A.; Christopoulos, P.; Endris, V.; Kloor, M.; Gyorffy, B.; Seliger, B.; Schirmacher, P.; Stenzinger, A.; Denkert, C. Integrated analysis of the immunological and genetic status in and across cancer types: Impact of mutational signatures beyond tumor mutational burden. Oncoimmunology 2018, 7, e1526613. [Google Scholar] [CrossRef] [PubMed]
- El Khoury, L.Y.; Lin, W.H.; Smadbeck, J.B.; Barrett, M.T.; Sadeghian, D.; McCune, A.F.; Karagouga, G.; Cheville, J.C.; Harris, F.R.; Kinsella, L.M.; et al. Epigenomics may begin to explain in vitro differential response to hypomethylating agents in MMR-D hypermethylated endometrial cancer. Epigenomics 2023, 15, 283–292. [Google Scholar] [CrossRef]
- Riedinger, C.J.; Brown, M.; Haight, P.J.; Backes, F.J.; Cohn, D.E.; Goodfellow, P.J.; Cosgrove, C.M. Epigenetic MMR defect identifies a risk group not accounted for through traditional risk stratification algorithms in endometrial cancer. Front. Oncol. 2023, 13, 1147657. [Google Scholar] [CrossRef]
- Cosgrove, C.M.; Cohn, D.E.; Hampel, H.; Frankel, W.L.; Jones, D.; McElroy, J.P.; Suarez, A.A.; Zhao, W.; Chen, W.; Salani, R.; et al. Epigenetic silencing of MLH1 in endometrial cancers is associated with larger tumor volume, increased rate of lymph node positivity and reduced recurrence-free survival. Gynecol. Oncol. 2017, 146, 588–595. [Google Scholar] [CrossRef]
- Liu, X.; Nie, L.; Zhang, Y.; Yan, Y.; Wang, C.; Colic, M.; Olszewski, K.; Horbath, A.; Chen, X.; Lei, G.; et al. Actin cytoskeleton vulnerability to disulfide stress mediates disulfidptosis. Nat. Cell Biol. 2023, 25, 404–414. [Google Scholar] [CrossRef]
- Zheng, P.; Zhou, C.; Ding, Y.; Duan, S. Disulfidptosis: A new target for metabolic cancer therapy. J. Exp. Clin. Cancer Res. 2023, 42, 103. [Google Scholar] [CrossRef] [PubMed]
- Sezgin, B.; Pirinççi, F.; Camuzcuoğlu, A.; Erel, Ö.; Neşelioğlu, S.; Camuzcuoğlu, H. Assessment of thiol disulfide balance in early-stage endometrial cancer. J. Obstet. Gynaecol. Res. 2020, 46, 1140–1147. [Google Scholar] [CrossRef] [PubMed]
- Fernando, S.R.; Kottawatta, K.S.A.; Jiang, L.; Chen, X.; Cheng, K.W.; Wong, B.P.C.; Ng, E.H.Y.; Yeung, W.S.B.; Lee, K.F. Differential expression of protein disulfide isomerase (PDI) in regulating endometrial receptivity in humans. Reprod. Biol. 2021, 21, 100498. [Google Scholar] [CrossRef] [PubMed]
- Cheng, D.L.; Xiang, Y.Y.; Ji, L.j.; Lu, X.J. Competing endogenous RNA interplay in cancer: Mechanism, methodology, and perspectives. Tumor Biol. 2015, 36, 479–488. [Google Scholar] [CrossRef] [PubMed]
- Shi, R.; Zhang, W.; Zhang, J.; Yu, Z.; An, L.; Zhao, R.; Zhou, X.; Wang, Z.; Wei, S.; Wang, H. CircESRP1 enhances metastasis and epithelial–mesenchymal transition in endometrial cancer via the miR-874-3p/CPEB4 axis. J. Transl. Med. 2022, 20, 1–18. [Google Scholar] [CrossRef] [PubMed]
- Xin, W.; Gao, X.; Zhao, S.; Zhao, P.; Yu, H.; Wu, Q.; Hua, K. LncRNA RP11-395G23. 3 suppresses the endometrial cancer progression via regulating microRNA-205-5p/PTEN axis. Am. J. Transl. Res. 2020, 12, 4422. [Google Scholar]
- Vallone, C.; Rigon, G.; Gulia, C.; Baffa, A.; Votino, R.; Morosetti, G.; Zaami, S.; Briganti, V.; Catania, F.; Gaffi, M.; et al. Non-coding RNAs and endometrial cancer. Genes 2018, 9, 187. [Google Scholar] [CrossRef] [PubMed]
- He, W.P.; Chen, Y.Y.; Wu, L.X.; Guo, Y.; You, Z.S.; Yang, G. A novel necroptosis-related lncRNA signature for predicting prognosis and anti-cancer treatment response in endometrial cancer. Front. Immunol. 2022, 13, 1018544. [Google Scholar] [CrossRef]
- Liu, J.; Cui, G.; Ye, J.; Wang, Y.; Wang, C.; Bai, J. Comprehensive analysis of the prognostic signature of mutation-derived genome instability-related lncRNAs for patients with endometrial cancer. Front. Cell Dev. Biol. 2022, 10, 753957. [Google Scholar] [CrossRef]
- Winterhoff, B.; Hamidi, H.; Wang, C.; Kalli, K.R.; Fridley, B.L.; Dering, J.; Chen, H.W.; Cliby, W.A.; Wang, H.J.; Dowdy, S.; et al. Molecular classification of high grade endometrioid and clear cell ovarian cancer using TCGA gene expression signatures. Gynecol. Oncol. 2016, 141, 95–100. [Google Scholar] [CrossRef]
- Urick, M.E.; Bell, D.W. Clinical actionability of molecular targets in endometrial cancer. Nat. Rev. Cancer 2019, 19, 510–521. [Google Scholar] [CrossRef]
- Miller, K.D.; Nogueira, L.; Devasia, T.; Mariotto, A.B.; Yabroff, K.R.; Jemal, A.; Kramer, J.; Siegel, R.L. Cancer treatment and survivorship statistics, 2022. CA A Cancer J. Clin. 2022, 72, 409–436. [Google Scholar] [CrossRef] [PubMed]
- Miao, C.; Fang, X.; Chen, Y.; Zhao, Y.; Guo, Q. Identification of an eight-m6A RNA methylation regulator prognostic signature of uterine corpus endometrial carcinoma based on bioinformatics analysis. Medicine 2021, 100, e27689. [Google Scholar] [CrossRef] [PubMed]
- Shan, J.; Geng, R.; Zhang, Y.; Wei, J.; Liu, J.; Bai, J. Identification of cuproptosis-related subtypes, establishment of a prognostic model and tumor immune landscape in endometrial carcinoma. Comput. Biol. Med. 2022, 149, 105988. [Google Scholar] [CrossRef] [PubMed]
- Zhang, X.; Ye, Z.; Xiao, G.; He, T. Prognostic signature construction and immunotherapy response analysis for Uterine Corpus Endometrial Carcinoma based on cuproptosis-related lncRNAs. Comput. Biol. Med. 2023, 159, 106905. [Google Scholar] [CrossRef] [PubMed]
- Lin, S.; Xu, Y.; Liu, B.; Zheng, L.; Cao, C.; Wu, P.; Ding, W.; Ren, F. A novel cuproptosis-related gene signature for overall survival prediction in uterine corpus endometrial carcinoma (UCEC). Heliyon 2023, 9, e14613. [Google Scholar] [CrossRef] [PubMed]
- Chen, Y. Identification and validation of cuproptosis-related prognostic signature and associated regulatory axis in uterine corpus endometrial carcinoma. Front. Genet. 2022, 13, 912037. [Google Scholar] [CrossRef] [PubMed]
- Wu, Q.; Tian, R.; Tan, H.; Liu, J.; Ou, C.; Li, Y.; Fu, X. A comprehensive analysis focusing on cuproptosis to investigate its clinical and biological relevance in uterine corpus endometrial carcinoma and its potential in indicating prognosis. Front. Mol. Biosci. 2022, 9, 1048356. [Google Scholar] [CrossRef] [PubMed]
- Mahmoodi, N.; Ai, J.; Ebrahimi-Barough, S.; Hassannejad, Z.; Hasanzadeh, E.; Basiri, A.; Vaccaro, A.R.; Rahimi-Movaghar, V. Microtubule stabilizer epothilone B as a motor neuron differentiation agent for human endometrial stem cells. Cell Biol. Int. 2020, 44, 1168–1183. [Google Scholar] [CrossRef]
- Moxley, K.M.; McMeekin, D.S. Endometrial carcinoma: A review of chemotherapy, drug resistance, and the search for new agents. Oncologist 2010, 15, 1026–1033. [Google Scholar] [CrossRef]
- Sorolla, A.; Yeramian, A.; Valls, J.; Dolcet, X.; Bergadà, L.; Llombart-Cussac, A.; Martí, R.M.; Matias-Guiu, X. Blockade of NFκB activity by Sunitinib increases cell death in Bortezomib-treated endometrial carcinoma cells. Mol. Oncol. 2012, 6, 530–541. [Google Scholar] [CrossRef] [PubMed]
- Coleman, R.L.; Hu, W.; Soliman, P.; Nick, A.; Ramirez, P.T.; Westin, S.N.; Garcia, M.E.; Zhu, Z.; Palancia, J.; Fellman, B.M.; et al. Dasatinib, paclitaxel, and carboplatin in women with advanced-stage or recurrent endometrial cancer: A pilot clinical and translational study. Gynecol. Oncol. 2021, 161, 104–112. [Google Scholar] [CrossRef] [PubMed]
- Pazarentzos, E.; Giannikopoulos, P.; Hrustanovic, G.; St John, J.; Olivas, V.; Gubens, M.; Balassanian, R.; Weissman, J.; Polkinghorn, W.; Bivona, T. Oncogenic activation of the PI3-kinase p110β isoform via the tumor-derived PIK3CβD1067V kinase domain mutation. Oncogene 2016, 35, 1198–1205. [Google Scholar] [CrossRef] [PubMed]
- Troisi, J.; Sarno, L.; Landolfi, A.; Scala, G.; Martinelli, P.; Venturella, R.; Di Cello, A.; Zullo, F.; Guida, M. Metabolomic signature of endometrial cancer. J. Proteome Res. 2018, 17, 804–812. [Google Scholar] [CrossRef] [PubMed]
- Gu, M.; Chen, X.; Sun, Y.; Wang, L.; Shu, H.; Qian, C. A metabolomic signature of FIGO stage I and II endometrial cancer. Neoplasma 2021, 68, 1283–1291. [Google Scholar] [CrossRef] [PubMed]
- Shi, K.; Wang, Q.; Su, Y.; Xuan, X.; Liu, Y.; Chen, W.; Qian, Y.; Lash, G.E. Identification and functional analyses of differentially expressed metabolites in early stage endometrial carcinoma. Cancer Sci. 2018, 109, 1032–1043. [Google Scholar] [CrossRef] [PubMed]
- Si, L.; Liu, L.; Yang, R.; Li, W.; Xu, X. High expression of TARS is associated with poor prognosis of endometrial cancer. Aging 2023, 15, 1524. [Google Scholar] [CrossRef]
- Kolben, T.; Mannewitz, M.; Perleberg, C.; Schnell, K.; Anz, D.; Hahn, L.; Meister, S.; Schmoeckel, E.; Burges, A.; Czogalla, B.; et al. Presence of regulatory T-cells in endometrial cancer predicts poorer overall survival and promotes progression of tumor cells. Cell. Oncol. 2022, 45, 1171–1185. [Google Scholar] [CrossRef]
- Liu, X.; Cheng, C.; Cai, Y.; Gu, Y.; Wu, Y.; Chen, K.; Wu, Z. Pan-cancer analyses reveal the regulation and clinical outcome association of PCLAF in human tumors. Int. J. Oncol. 2022, 60, 66. [Google Scholar] [CrossRef]
Figure 1.
Flow chart.

Figure 2.
Identification of DRCG and construction of ceRNA network related to LRPPRC. (A) The differential expression of 10 DRGs between normal and tumor groups in TCGA-UCEC, with blue indicating normal and red indicating tumor group. (B) The importance score of 10 DRGs and the number in the column is the importance score. (C) LRPPRC survival curve. Expression of (D) hsa-miR-616-5p, (E) hsa-miR-4658, and (F) hsa-miR-6783-5p between normal and tumor groups in UCEC. (G) TSPEAR-AS2 expression between tumor group and normal group in UCEC. (H) ceRNA regulatory network related to LRPPRC.
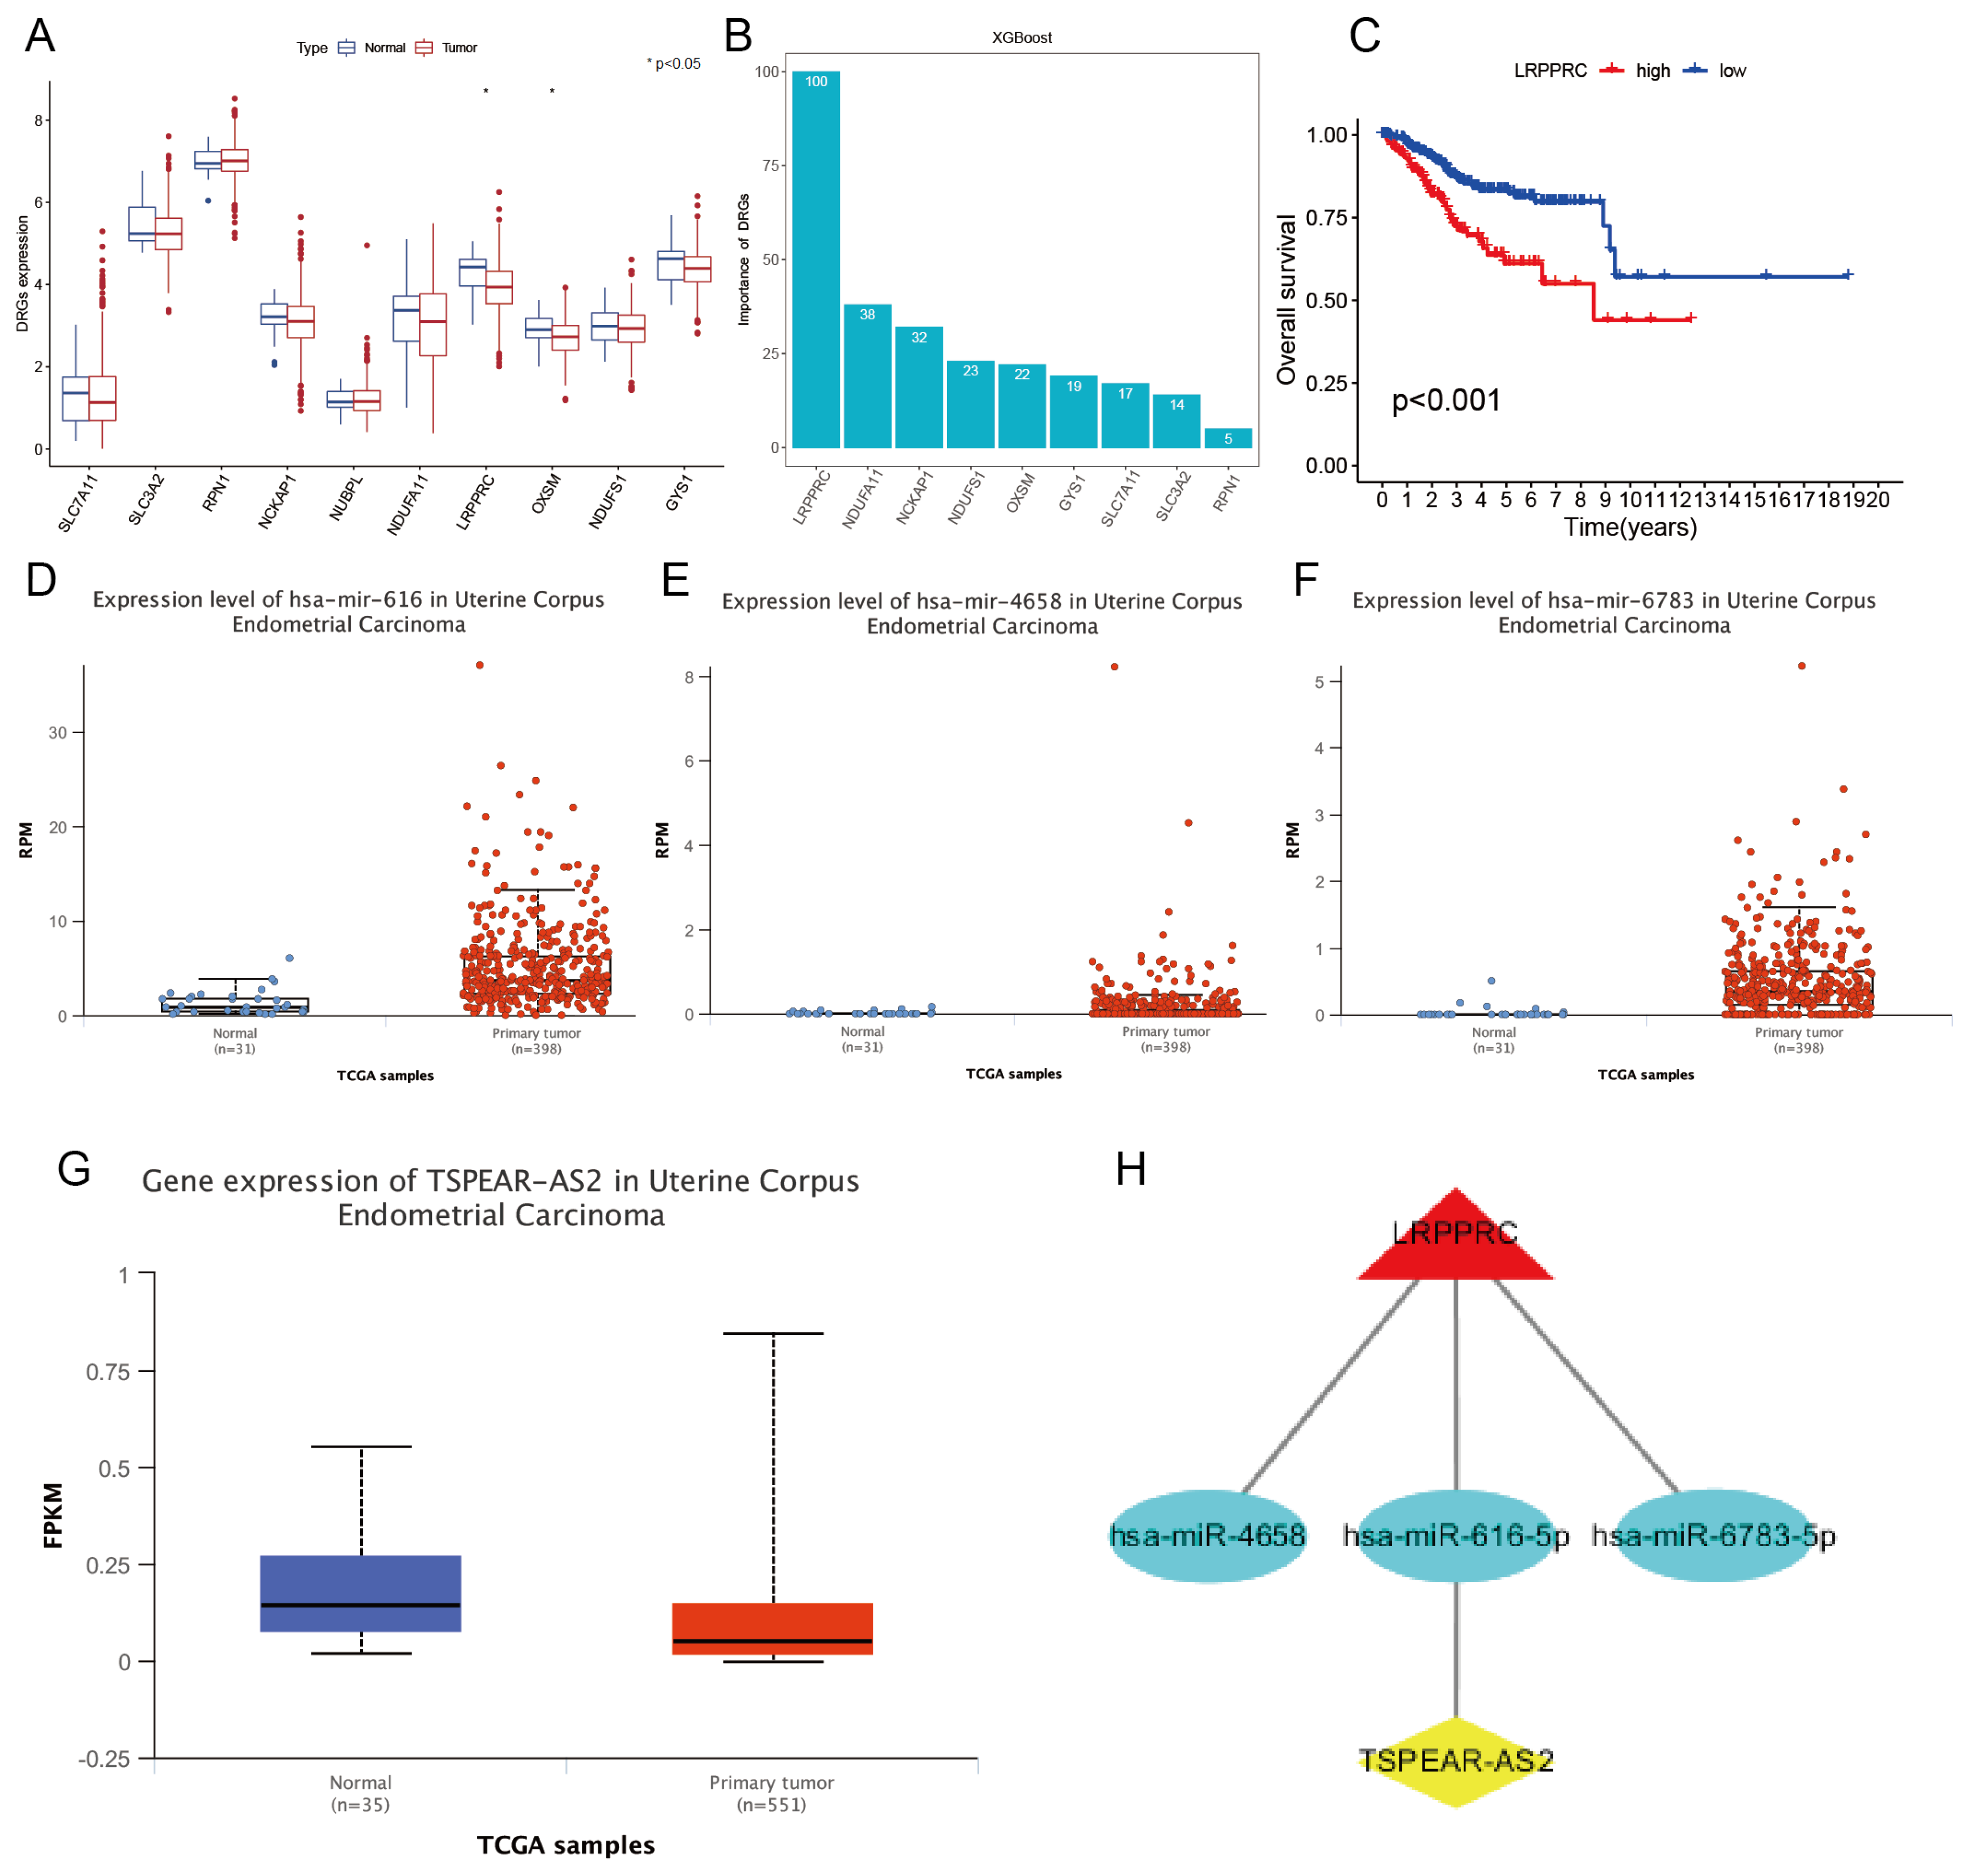
Figure 3.
Identifying. DRCLs and screening predictors for the model. (A) A Sankey plot of the correlation between DRGs and DRLs. (B) Histogram of importance score of DRCLs. (C) Forest plots of 16 predictors related to UCEC prognosis. (D) Variable compression plot of LASSO regression analysis. (E) Feature selection, each curve denoting a DRCL. (F) The correlation heatmap of 7 DRCLs and 10 DRGs, with yellow indicating positive and purple indicating a negative correlation. The correlation between DRCL and DRG is stronger the darker the color.
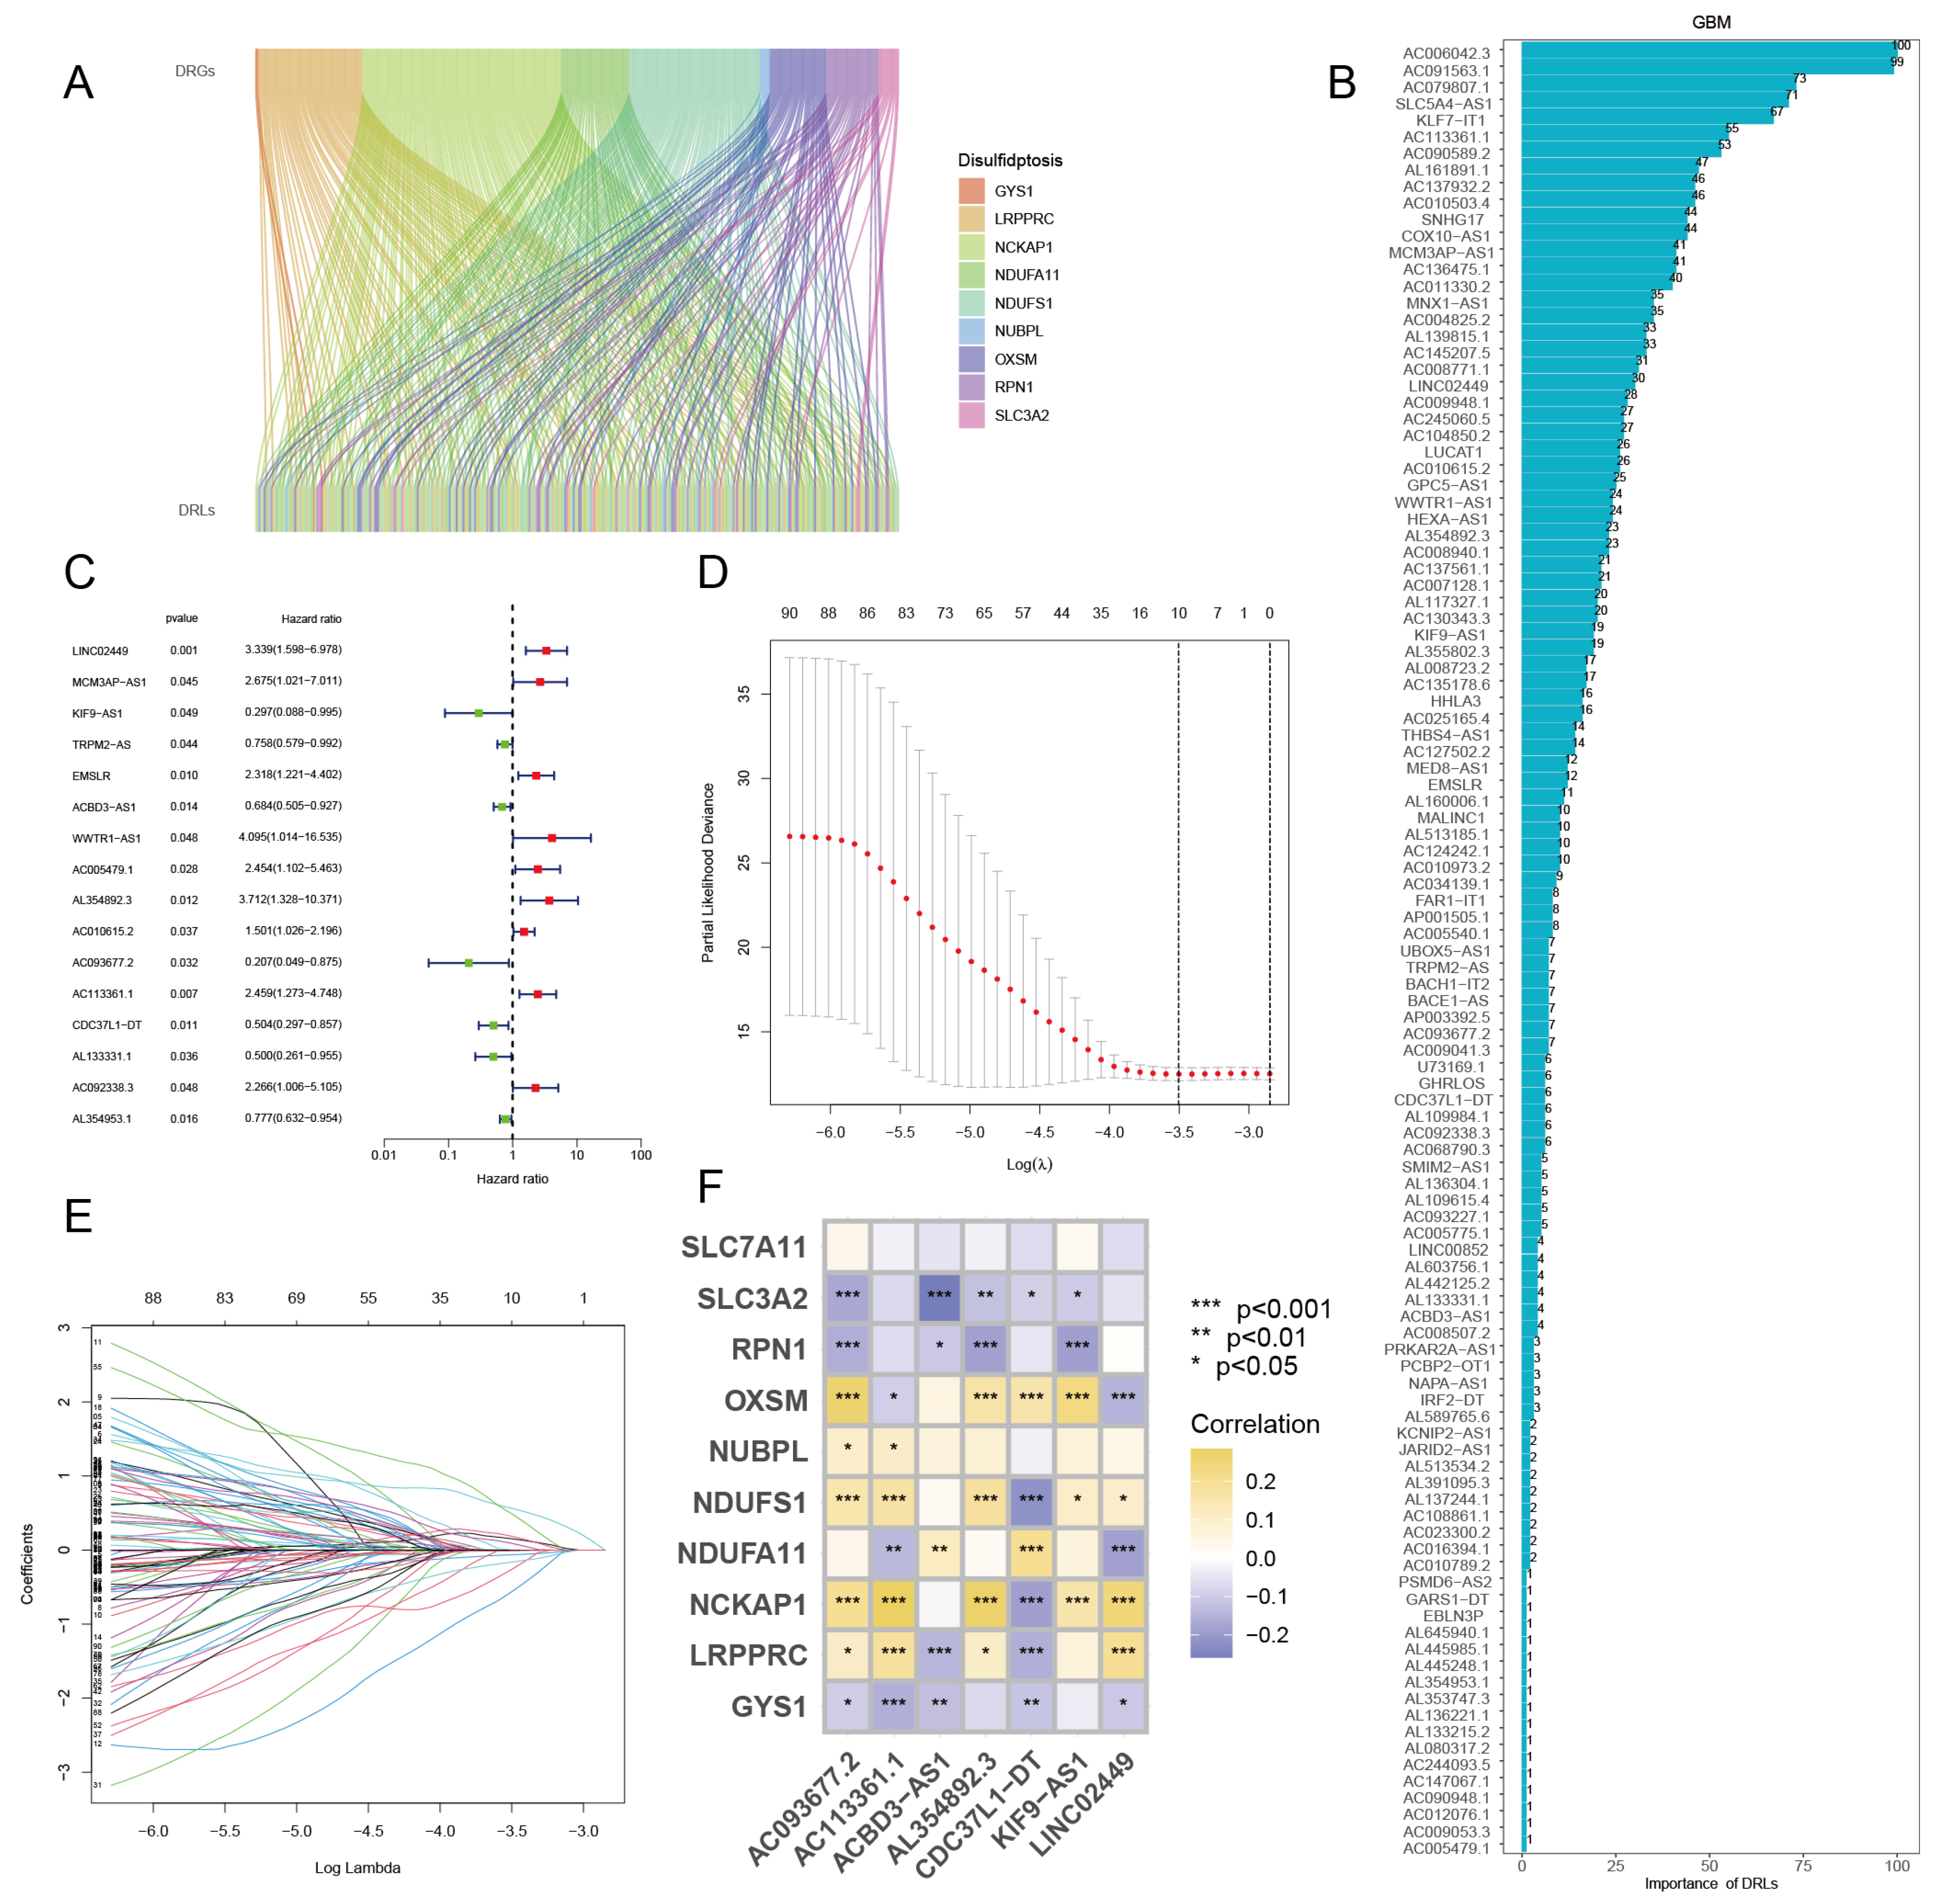
Figure 4.
Survival analysis, and validation of differences in 7 DRCL expression in high- and low-risk groups. (A) OS curve, (B) Risk curve, and (C) Survival status scatter diagram of training set samples. (D) OS curve, (E) risk curve, and (F) survival status scatter plot of test set samples. (G) OS curve, (H) risk curve, (I) survival status scatter plot of all samples. Expression differences of 7 DRCLs in (J) training set, (K) test set, and (L) all samples.
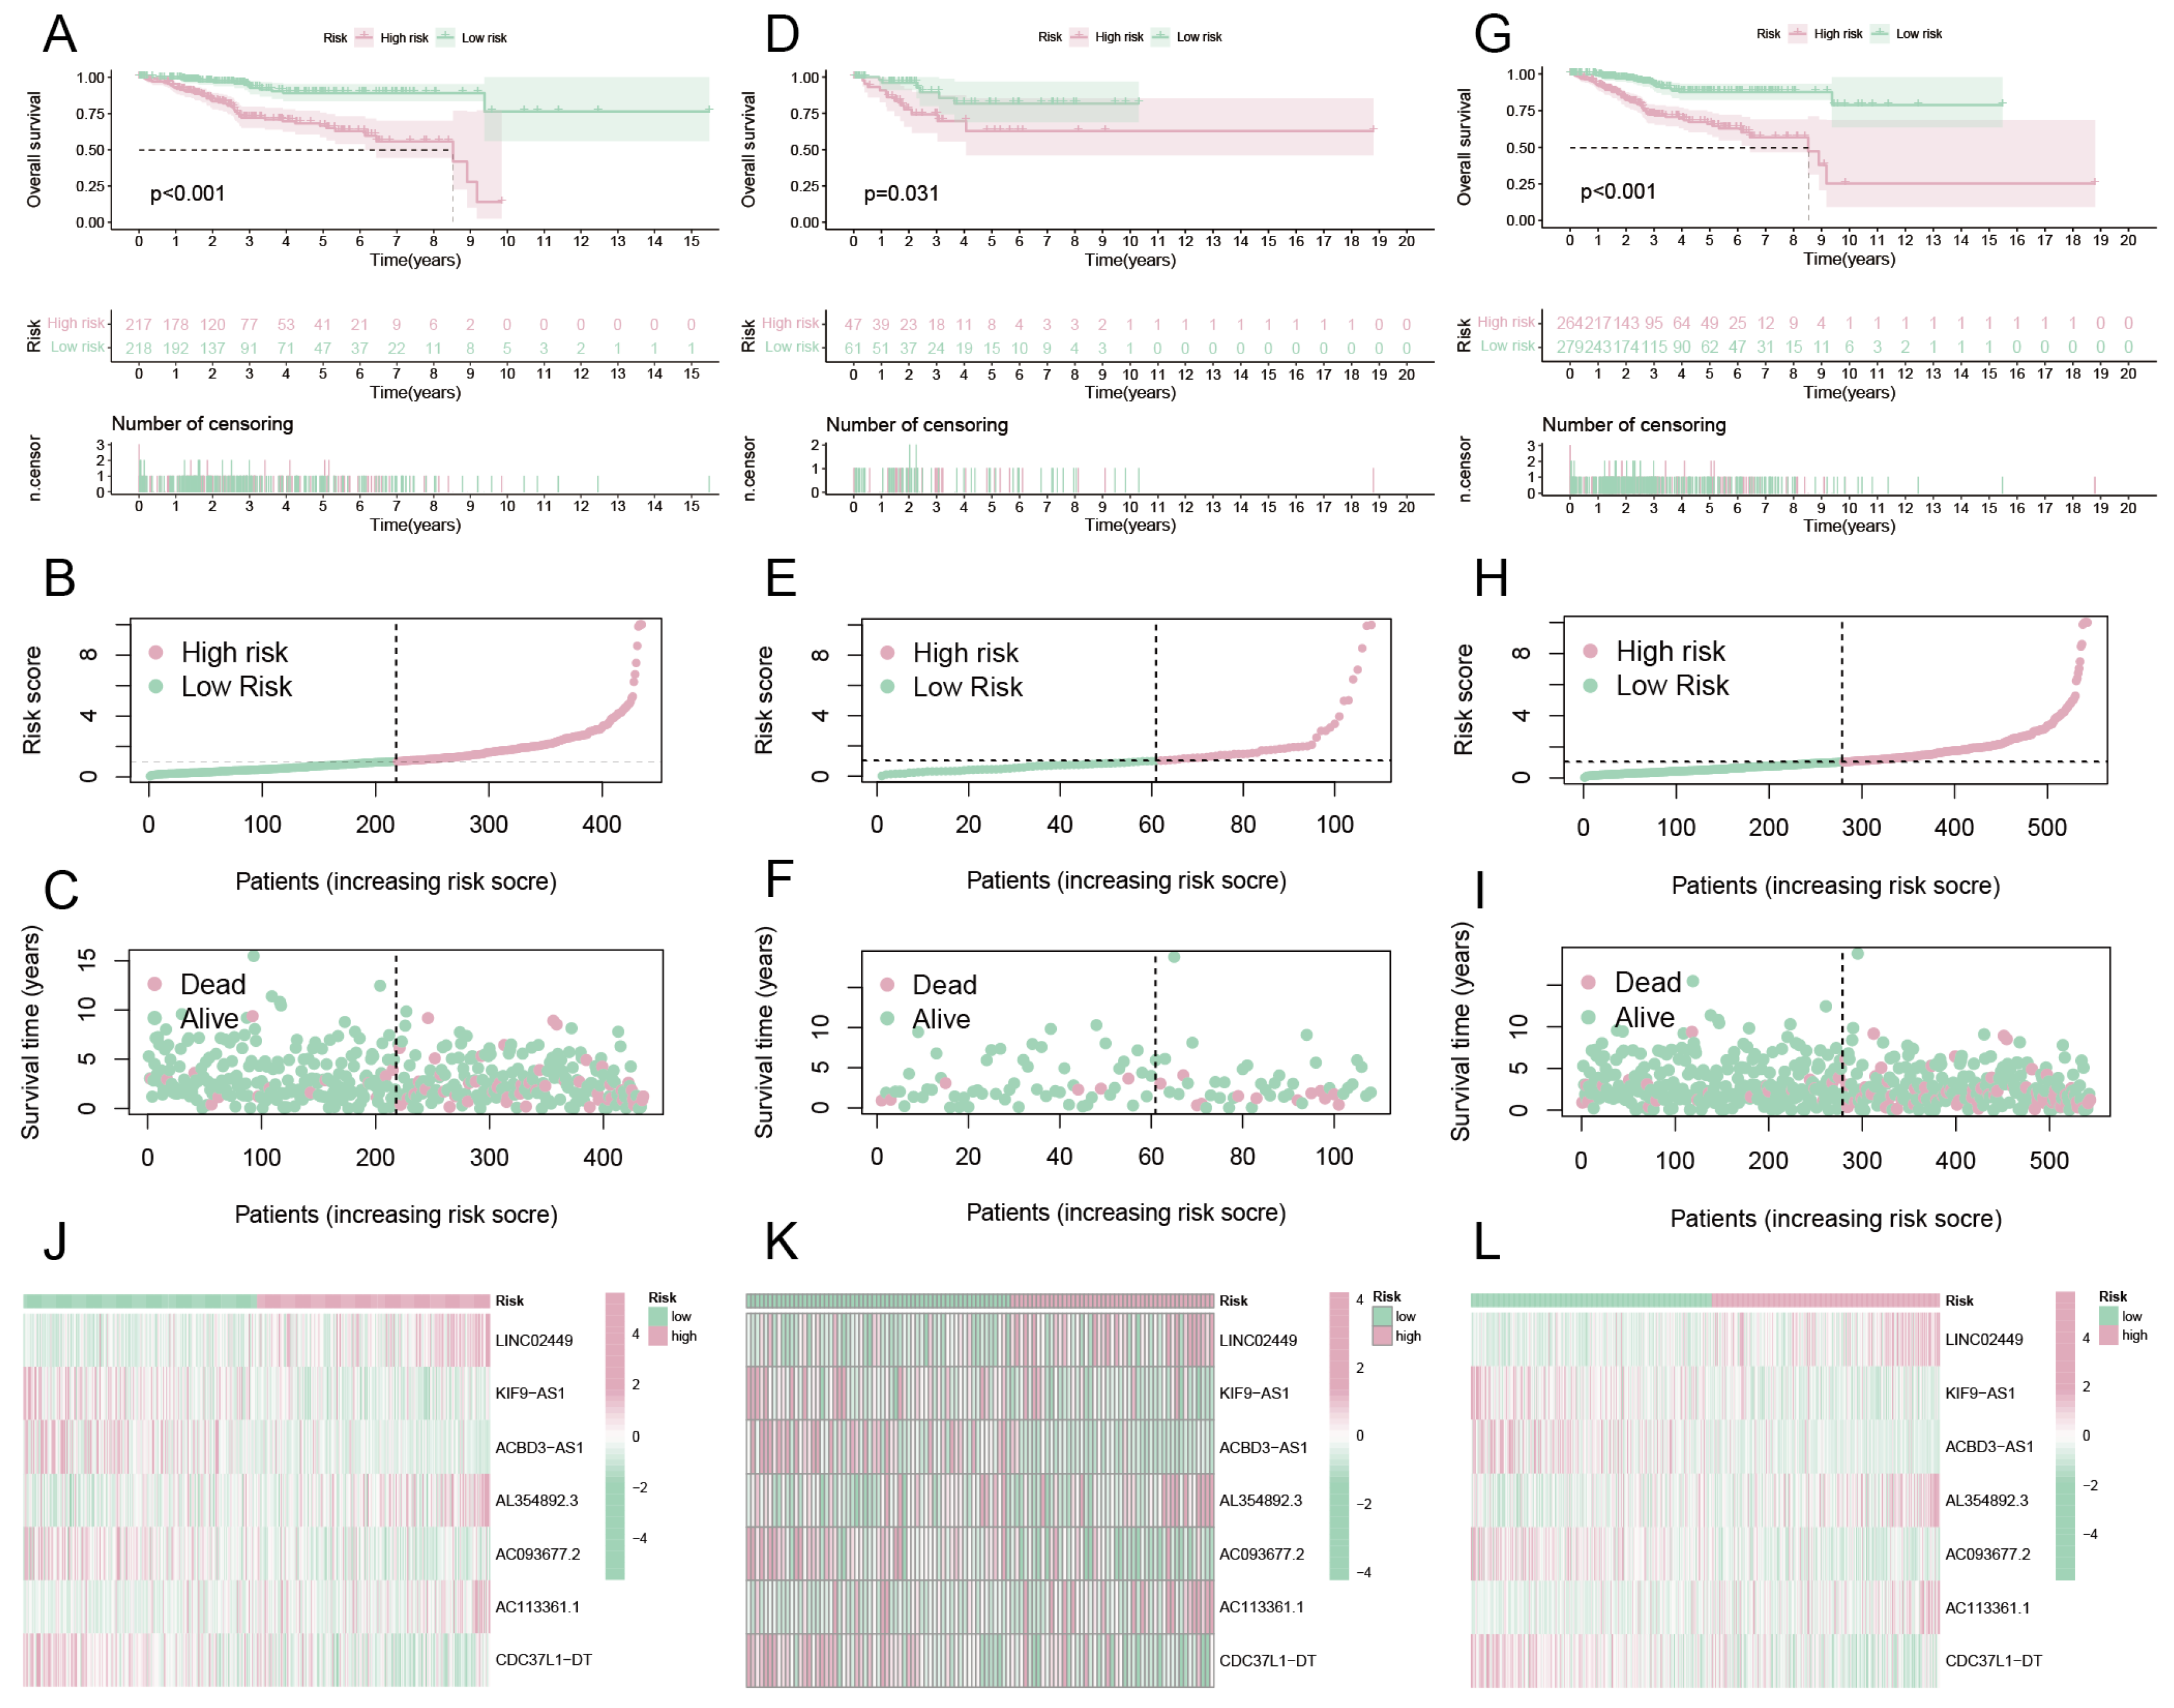
Figure 5.
Evaluation of model performance. Forest plots using (A) univariate Cox and (B) multivariate Cox regression analysis. The ROC of 1-, 3-, 6- and 10-year OS for (C) training set, (D) test set, and (E) all samples. (F) CI curve. (G) Nomogram. Round red dots mean risk scores and various clinical characteristics; diamond red dots mean total score and triangular red dots mean patient survival rate. (H) Calibration curve.

Figure 6.
Differential analysis of 10 DRGs and survival analysis of subgroups of clinical traits. (A) Differential analysis of 10 DRGs, with red meaning high-risk group and blue meaning low-risk group. Survival curve for (B) age ≤ 65 and (C) age > 65. Survival curve of (D) grade G1, (E) G2, and (F) G3.

Figure 7.
Drug sensitivity analysis. Scatter plot of correlation between drugs and risk score. (A) CP724714, (B) Epothilone B, which showed a positive correlation with the risk score. (C–H) The risk score and six of the 12 drugs showed a positive correlation. Drugs with different IC50 values in high-risk and low-risk groups, where (I) is CP724714, (J) is Epothilone B, and (K–P) is 6 of the 12 drugs that significantly up-regulated IC50 values in the high-risk group.
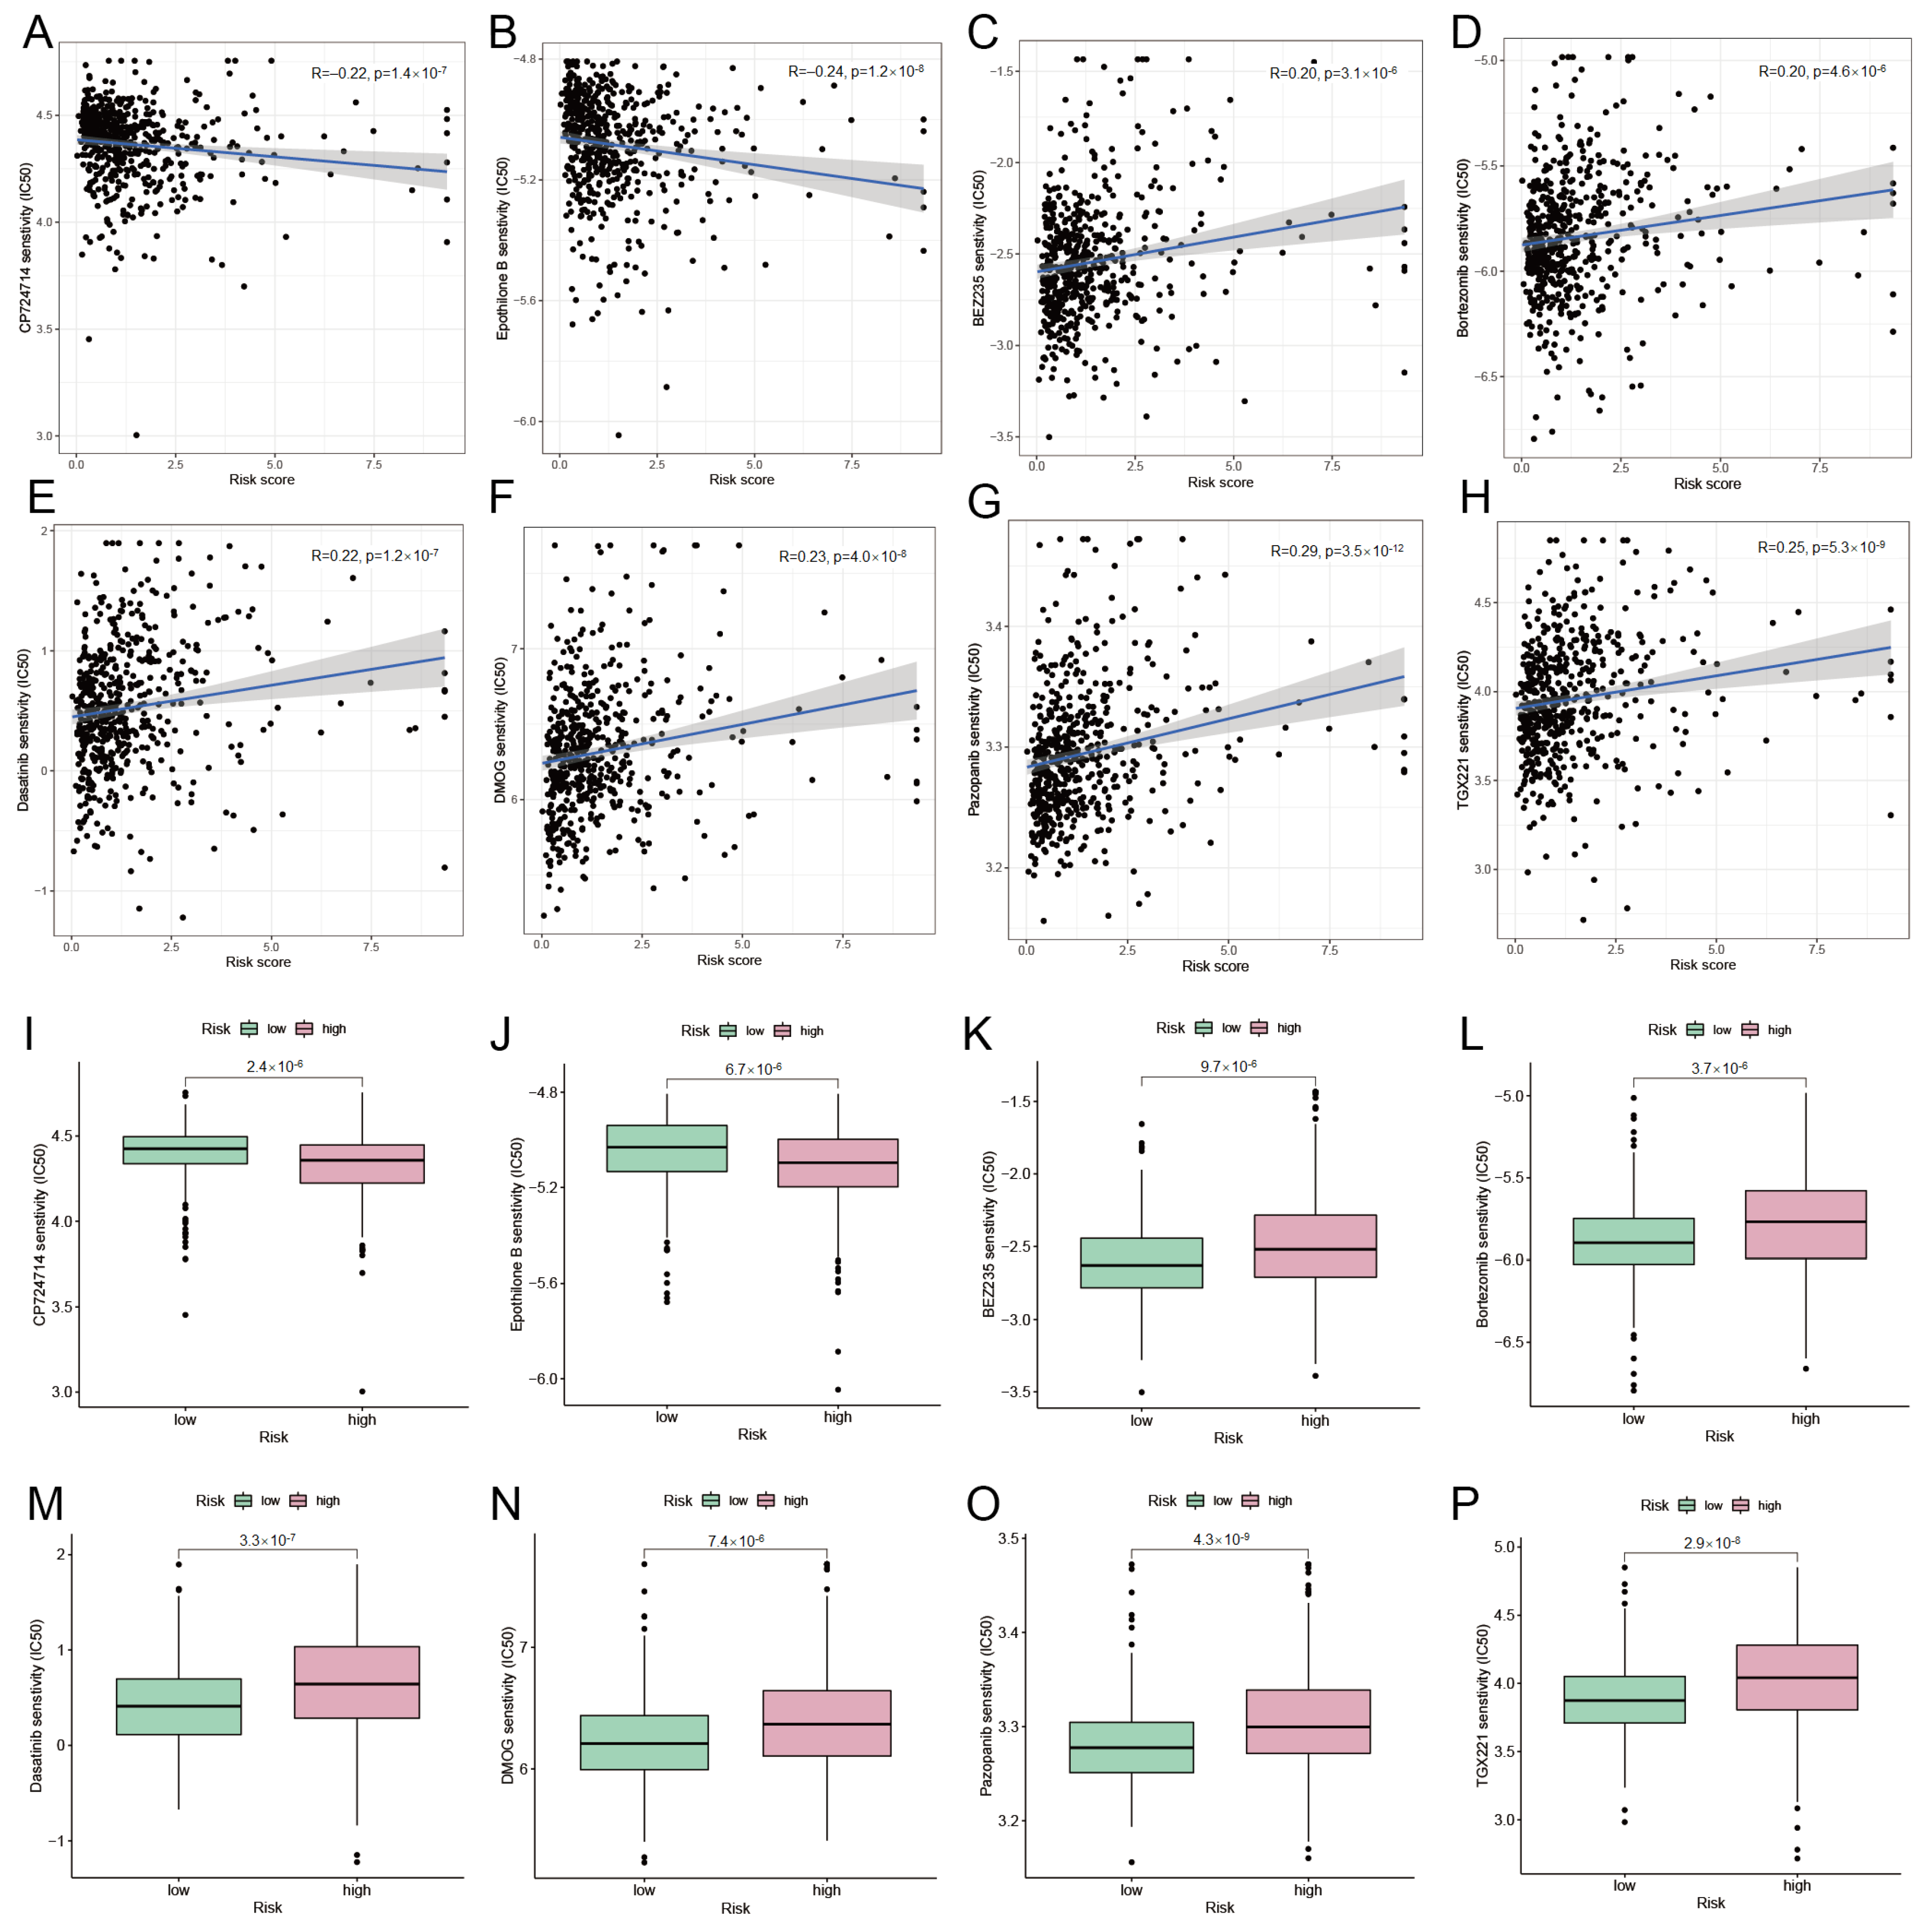
Figure 8.
NMF clustering analysis of DRGs and biological characteristics of subtypes. (A) Consensus matrix plot of DRG cluster. (B) PCA plots of subtypes N1 and N2. (C) Survival curve of subtypes N1 and N2. (D) GSVA. GO functions and (E) KEGG pathways enriched in subtypes N1 and N2. Pink indicates up-regulated and brown indicates down-regulated. (F) ssGSEA. The abundance of immune cell infiltration in subtypes N1 and N2 of DRGs. (G) Expression differences of 10 DRGs in subtypes N1 and N2.

Figure 9.
NMF clustering analysis of DRCLs and biological characteristics of subtypes. (A) Consensus matrix plot of DRCL cluster. (B) PCA plots of subtypes N1 and N2. (C) Survival curve of subtypes N1 and N2. (D) Expression differences of 10 DRGs in subtypes N1 and N2. (E) Sankey diagram. (F) Risk scores for N1 and N2 subtypes of DRGs differ. (G) Risk scores for N1 and N2 DRCL subtypes differ from each other.

Disclaimer/Publisher’s Note: The statements, opinions and data contained in all publications are solely those of the individual author(s) and contributor(s) and not of MDPI and/or the editor(s). MDPI and/or the editor(s) disclaim responsibility for any injury to people or property resulting from any ideas, methods, instructions or products referred to in the content. |
© 2023 by the authors. Licensee MDPI, Basel, Switzerland. This article is an open access article distributed under the terms and conditions of the Creative Commons Attribution (CC BY) license (https://creativecommons.org/licenses/by/4.0/).
Share and Cite
MDPI and ACS Style
Fu, F.; Lu, X.; Zhang, Z.; Li, Z.; Xie, Q. Identifying the Role of Disulfidptosis in Endometrial Cancer via Machine Learning Methods. BioMedInformatics 2023, 3, 908-925. https://doi.org/10.3390/biomedinformatics3040056
AMA Style
Fu F, Lu X, Zhang Z, Li Z, Xie Q. Identifying the Role of Disulfidptosis in Endometrial Cancer via Machine Learning Methods. BioMedInformatics. 2023; 3(4):908-925. https://doi.org/10.3390/biomedinformatics3040056
Chicago/Turabian StyleFu, Fei, Xuesong Lu, Zhushanying Zhang, Zhi Li, and Qinlan Xie. 2023. "Identifying the Role of Disulfidptosis in Endometrial Cancer via Machine Learning Methods" BioMedInformatics 3, no. 4: 908-925. https://doi.org/10.3390/biomedinformatics3040056