

Advancing Early Detection of Breast Cancer: A User-Friendly Convolutional Neural Network Automation System

Computer Science Department, Salem State University, Salem, MA 01970, USA
*
Author to whom correspondence should be addressed.
BioMedInformatics 2024, 4(2), 992-1005; https://doi.org/10.3390/biomedinformatics4020055
Submission received: 8 December 2023
/
Revised: 6 March 2024
/
Accepted: 13 March 2024
/
Published: 1 April 2024
(This article belongs to the Special Issue Feature Papers in Clinical Informatics Section)
Abstract
:Simple Summary
This study aimed to develop a deep learning model based on a convolutional neural network (CNN) architecture to predict Invasive Ductal Carcinoma (IDC), a form of breast cancer. The model also includes a user-friendly graphical interface for healthcare professionals to utilize the tool conveniently. The results of the study showed a high accuracy rate, suggesting the potential of this model in improving early breast cancer detection and personalized treatment strategies.
Abstract
Background: Deep learning models have shown potential in improving cancer diagnosis and treatment. This study aimed to develop a convolutional neural network (CNN) model to predict Invasive Ductal Carcinoma (IDC), a common type of breast cancer. Additionally, a user-friendly interface was designed to facilitate the use of the model by healthcare professionals. Methods: The CNN model was trained and tested using a dataset of high-resolution microscopic images derived from 162 whole-mount slide images of breast cancer specimens. These images were meticulously scanned at 40× magnification using a state-of-the-art digital slide scanner to capture detailed information. Each image was then divided into 277,524 patches of 50 × 50 pixels, resulting in a diverse dataset containing 198,738 IDC-negative and 78,786 IDC-positive patches. Results: The model achieved an accuracy of 98.24% in distinguishing between benign and malignant cases, demonstrating its effectiveness in cancer detection. Conclusions: This study suggests that the developed CNN model has promising potential for clinical applications in breast cancer diagnosis and personalized treatment strategies. Our study further emphasizes the importance of accurate and reliable cancer detection methods for timely diagnosis and treatment. This study establishes a foundation for utilizing deep learning models in future cancer treatment research by demonstrating their effectiveness in analyzing large and complex datasets. This approach opens exciting avenues for further research and potentially improves our understanding of cancer and its treatment.
1. Introduction
Invasive Ductal Carcinoma (IDC) is a prevalent form of breast cancer, comprising approximately 80% of all breast cancer diagnoses [1]. IDC occurs due to genetic mutations in abnormal cells within the milk ducts. If left untreated, IDC can metastasize to the lymph nodes and other organs, posing a significant health threat [1].
The use of deep learning techniques has recently shown efficacy in the detection and diagnosis of breast cancer [2]. Convolutional neural networks (CNNs), in particular, have been extensively used to analyze microscopic images of breast tissue samples. This approach allows for automated identification of cancerous regions, leveraging the high computational power of neural networks to extract meaningful features from images and classify them with high accuracy [2].
Our study builds upon this existing research and incorporates the latest developments in deep learning methodologies to further advance IDC detection [3]. By integrating machine learning algorithms into a user interface, our model aims to provide healthcare professionals with a practical tool for analyzing and interpreting microscopic images of breast tissue. The model scans the images at a patch level, using AI algorithms to predict the likelihood of cancer in each patch. This comprehensive evaluation enables the accurate identification of cancerous regions, aiding healthcare professionals in making informed decisions regarding diagnosis and treatment [3].
Deep learning models, in addition to their diagnostic potential, have shown promise in uncovering disease patterns and enhancing our understanding of breast cancer [4]. By analyzing large-scale datasets, these models can reveal subtle nuances and correlations that may assist in early detection and personalized treatment strategies.
This paper is organized as follows: Section 2 (Related Work) provides a comprehensive review of existing research on employing deep learning techniques for Invasive Ductal Carcinoma (IDC) detection. Section 3 outlines the research methodology adopted in this study. It details the utilized dataset, the chosen model architecture, and the employed evaluation metrics for assessing model performance. Section 4 presents the experimental evaluation conducted and the obtained results. The model’s performance is analyzed in terms of accuracy, precision, and recall. Section 5 delves into the limitations encountered during the research process. Section 6 discusses the key findings of the study and explores their potential impact on breast cancer diagnosis. Section 7 concludes the paper by summarizing the main contributions of the research and suggesting potential directions for future research endeavors.
2. Related Work
In the evolving landscape of deep learning applications for diagnosing Invasive Ductal Carcinoma (IDC) in breast cancer, there has been a notable influx of groundbreaking studies. These works collectively advance the field through diverse methodologies and technological innovations focused on image classification and predictive analytics.
P. Ghosh and colleagues [5] employed XGBoost for the analysis of digitized histology images to tackle multicollinearity, thereby enhancing the model accuracy. Abdelrahman and others [6] made use of CNNs within the PyTorch framework, integrating Network Dissection with Plotly Dash for better interpretability and efficiency in labeling. Our investigation leverages CNNs with ReLu and Sigmoid activations, undergoing a training regime over 30 epochs and utilizing a Jupyter notebook alongside Flask for presenting predictions on microscopic biopsy images. S. Sharma and team [7] ventured into raw mammogram image analysis with fuzzy k-means and c-means clustering, complemented by various edge detection methodologies, proving their utility in cancer cell identification.
S. Pawar [8] conducted an evaluation across five machine learning techniques on the Wisconsin Breast Cancer Dataset, with XGBoost emerging top at a 98.24% accuracy rate. J. Qin and associates [9] introduced a Synchronous Medical Image Augmentation (SMIA) strategy, leveraging stochastic transformations and synthesis for dataset enrichment and performance enhancement in medical image segmentation.
M. Singh and team [10] unveiled a Two-Stage Teaching-Learning-Based Optimization (TS-TLBO) algorithm, effectively navigating the “curse of dimensionality” in feature selection to excel in classification tasks across several datasets. A. Khan and colleagues [11] rolled out the AI-based Medical Image Analysis (AI-MIA) framework, offering a versatile deep learning structure for crafting personalized models suitable for various medical imaging analyses. I. Gulsun and others [12] explored the potential of transfer learning with pre-trained CNN models (VGG16, ResNet50) for breast cancer classification, showing promising outcomes. J. Cheng and co-authors [13] proposed an innovative attention-based CNN architecture for predicting breast cancer metastasis in whole-slide images, outperforming standard models. Y. Liu and team [14] developed a model that harnesses ensemble learning and data augmentation for enhancing breast cancer diagnosis using ultrasound images. A. Amira and collaborators [15] examined the application of Generative Adversarial Networks (GANs) for data augmentation in breast cancer detection, noting significant enhancements in performance. M. Litjens and colleagues [16] provided an extensive overview of deep learning applications in breast cancer detection and diagnosis, discussing various challenges and prospects.
N. Le and team [17] executed a meta-analysis on deep learning methods in breast cancer detection, assessing the effectiveness of different architectures and datasets. J. Yu and colleagues [18] delved into the explainability of deep learning models for breast cancer diagnosis, stressing the necessity of interpretable models in clinical decision making. A. Cruz-Roa et al. [19] were pioneers in applying CNNs for the automatic detection of IDC in whole-slide images, setting the stage for subsequent research endeavors in this field.
Both studies in [20,21] illustrate the increasing role of machine learning and advanced image processing techniques in the medical field, aiming to improve diagnostic accuracy and predict patient outcomes more effectively.
Collectively, these studies not only underscore the effectiveness of deep learning in IDC breast cancer prediction but also emphasize the need for enhanced model interpretability and efficiency. This body of work highlights the imperative for ongoing research to further refine these techniques for early and accurate breast cancer detection.
3. Problem Definition and Deep Learning Model
In this section, we have outlined the main research questions that will be addressed in this study. The primary question focuses on the development and evaluation of a convolutional neural network (CNN) deep learning model for predicting the presence of Invasive Ductal Carcinoma (IDC) breast cancer using a dataset of microscopic biopsy images. The aim is to assess the accuracy of the model and its ability to generalize unseen data. Furthermore, we will investigate the strengths and limitations of the model in accurately distinguishing between benign and malignant cases. Understanding the model’s performance in differentiating between these two categories is crucial for its practical utility in clinical settings. In addition to model development and evaluation, this study aims to create a graphical user interface (GUI) to facilitate convenient use of the model. The GUI will provide an intuitive platform for healthcare professionals to interact with the model, visualize predictions, and streamline the process of detecting cancer in a large volume of patient’s breast tissue. The results and conclusions of this study will contribute to the broader research landscape of deep learning in breast cancer prediction. By demonstrating the potential of the CNN model and highlighting its strengths and limitations, this study may pave the way for future research endeavors and advancements in this field.
Overall, this section sets the stage for investigating the development and evaluation of a CNN deep learning model for predicting IDC breast cancer, the accuracy and generalization of the model, the development of a user-friendly GUI, and the implications for future research in this domain.
3.1. Proposed Research Methodology
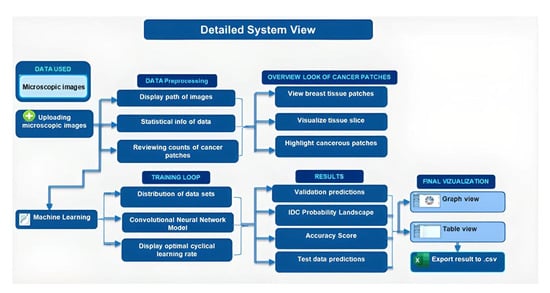
The use of advanced artificial intelligence, neural networks, and deep learning techniques has made it possible to automate the detection of IDC breast cancer with a high level of accuracy. The CNN deep learning approach with supervised learning from pre-classified data has been widely used in research. Previously, Jupyter notebooks were commonly used to perform calculations and experiments. However, as the computational aspect of the research has progressed, it has become necessary to provide a Python interface (GUI) that can handle tasks such as uploading data, data pre-processing, and modifying hyperparameters to find an optimal learning rate. The proposed methodology offers convenience for those familiar with the research concepts but lack programming experience. By incorporating the code into a user interface and allowing for the input of parameter values through text field objects, the time and effort required to navigate through large amounts of code can be eliminated. Why go through the hassle when you can graph data with just one click? Even beginners can easily embed the code into a user interface. As the tool is open-source and available for public access on GitHub, even developers can delve into and enhance its functionality.
3.2. Deep Learning Model
3.2.1. The Functionality and Operations of Convolutional Neural Networks (CNNs)
A convolutional neural network is a machine learning model that mimics the structure and function of the human brain. It comprises interconnected nodes called neurons, connected by a set of weights and biases. The model is trained to identify patterns and make predictions using input data by adjusting the weights and biases during the training process. These neural networks, also known as feedforward neural networks, are the simplest form of neural networks. They have an input layer, one or more hidden layers and an output layer. The input layer receives the data, which is then processed through the hidden layers to extract features and patterns. The output layer then produces the final predictions or outputs based on the processed data. Conventional neural networks are used in a variety of fields such as image classification, natural language processing, speech recognition, and anomaly detection. They are popular in industry due to their ability to learn non-linear relationships in data and generalize to new data.
3.2.2. Mathematical Foundation of Conventional Neural Networks (CNNs)
This subsection will explain the mathematical basics with details about the architecture, layers, and the activation functions used for the CNN model. A conventional neural network (CNN) typically consists of multiple layers, each with a specific purpose and function. Convolutional Layer: The first layer of a CNN is typically a convolutional layer. This layer applies a convolution operation to the input image, which extracts features from the image. The convolutional layer is followed by a non-linear activation function, such as ReLU, to introduce non-linearity into the model. A convolutional layer performs a dot product between a kernel (a set of learnable parameters) and a restricted portion of the input image, known as the receptive field. The kernel is smaller in spatial dimensions (height and width) than the image but has the same depth (number of channels) as the image. This allows the layer to extract features from specific regions of the image, while also allowing the model to learn the relationships between different channels in the image. The receptive field can be thought of as the area of the input image that a particular feature in the output of the convolutional layer is sensitive to. The size of the output volume of a convolutional neural network can be calculated using the following formula:
where the following variables are defined:
(W − F + 2P)/S + 1
- W is the size of the input volume (width and height);
- D is the depth of the input volume (number of channels);
- F is the spatial size of the kernels;
- S is the stride with which the kernels are convolved across the input volume;
- P is the amount of padding used.
This formula calculates the spatial dimension (width and height) of the output volume. The depth of the output volume will be equal to the number of kernels used (Dout). For example, if the input volume is of size 32 × 32 × 3 (width, height, and depth), and you use 64 kernels of size 3 × 3 with a stride of 1 and padding of 1, the output volume will be of size 32 × 32 × 4. (32 − 3 + 2 × 1)/1 + 1 = 32, 32, 64.
Pooling Layer: The next layer is typically a pooling layer. This layer reduces the spatial dimensions of the image by applying a pooling operation, such as max pooling or average pooling. This helps to reduce the computational cost and prevent over-fitting.
The size of the output volume of a pooling layer in a convolutions neural network can be calculated using the following formula:
(W − F)/S + 1
This formula calculates the spatial dimension (width and height) of the output activation map. The depth of the output activation map will be the same as the input activation map. For example, if the input activation map is of size 32 × 32 × 64 (width, height, and depth), and you use a pooling kernel of size 2 × 2 with a stride of 2, the output activation map will be of size 16 × 16 × 64.
Fully Connected Layer: After one or more convolutional and pooling layers, the CNN typically has one or more fully connected layers. These layers take the output from the previous layers and apply a linear transformation to produce the final output. For example, suppose that the output from the previous layers of a CNN is an activation map of size 4 × 4 × 32. This activation map is flattened into a 1D vector of size 4 × 4 × 32 = 512, and then passed through a fully connected layer with 1024 neurons. The operation in this example can be represented as:
where the following are defined:
Output = activation (W × input + b)
- input is the flattened activation map (512 elements);
- W is the weight matrix with dimensions of (1024,512);
- B is the bias term with dimensions of (1024,1);
- activation is a non-linear function applied on the output.
The output of this fully connected layer will be a 1D vector of size 1024, which can then be used as the final output or passed through additional fully connected layers to produce a final output with a desired number of classes.
Dropout Layer: Dropout is a regularization technique that helps prevent overfitting by randomly dropping out neurons during training. It is often used in the fully connected layers of a CNN.
SoftMax Layer: The final layer of a CNN is typically a softmax layer, which produces a probability distribution over the possible classes. These are the basic layers of a CNN. However, depending on the problem and the dataset, other layers such as batch normalization, recurrent layers and other types of pooling can also be used. The activation function in a CNN model is used to introduce non-linearity into the model. The most used activation functions in CNNs are as follows:
Rectified Linear Unit (ReLU): This is a widely used activation function in CNNs. The ReLU activation function applies the function f(x) = max (0, x) to the input, which returns x if x is positive and 0 if x is negative. This function is computationally efficient and helps to reduce the vanishing gradient problem.
Leaky ReLU: This is a variant of the ReLU activation function that allows for small negative values. The function is defined as f(x) = max (x, x), where is a small constant, typically set to 0.01.
Sigmoid: The sigmoid function is another popular activation function that maps input values to the range [0, 1]. It is defined as f(x) = 1/(1 + exp(−x)) tanh (Hyperbolic tangent): the tanh function is similar to the sigmoid function, but it maps input values to the range [−1, 1]. It is defined as f(x) = 2/(1 + exp(−2x)) − 1 softmax: this is a generalization of the sigmoid function that is used in the final output layer of a neural network. It maps the output of the final layer to a probability distribution over the possible classes. These are the most commonly used activation functions in CNNs; however, depending on the problem and the dataset, other activation functions such as leaky relu and softplus can also be used.
3.2.3. Technical Aspects of Conventional Neural Networks (CNNs)
The following section outlines the algorithm utilized in conventional neural networks (CNNs) as shown on the following steps (Algorithm 1).
| Algorithm 1: Conventional Neural Networks (CNN) Model |
|
The selection of the CNN architecture, hyperparameters, and activation functions was made with careful consideration of the specific requirements of IDC detection in breast cancer images. The choice of ReLU and Sigmoid activation functions was influenced by their proven effectiveness in similar image classification tasks, offering a balance between computational efficiency and non-linear data representation. The training across 30 epochs was determined as an optimal duration to achieve convergence without overfitting, considering the complexity of our dataset. The utilization of a Jupyter notebook environment and Flask for displaying predictions was a pragmatic decision, driven by our resource constraints, yet ensuring sufficient computational power for our analysis. It is important to note that these design decisions directly influence the model’s performance. The chosen CNN architecture and hyperparameters are tailored to maximize accuracy in identifying cancerous regions, while the activation functions play a crucial role in the interpretability of the model, allowing for more transparent and understandable prediction processes.
4. Experimental Evaluation
4.1. Data
In this study, the utilized dataset comprises approximately 4.14 GB of high-resolution digital imagery, including 162 whole mount slide images of breast cancer (BCa) specimens. These specimens underwent meticulous scanning at a 40× magnification level to ensure the capture of detailed high-resolution images conducive to comprehensive analysis. The scanning process was conducted using a state-of-the-art digital slide scanner, designed to preserve the integrity of the specimens while converting them into digital format. Each image was saved at a high resolution, allowing for the extraction of 277,524 patches, each measuring 50 × 50 pixels, without compromising on detail or clarity.
The extraction yielded two primary groups of patches: 198,738 categorized as IDC (Invasive Ductal Carcinoma)-negative and 78,786 as IDC-positive, indicating the presence or absence of invasive cancer cells. It is pertinent to mention that our dataset not only focuses on IDC but also includes patches derived from various histological types of breast cancer. This diversity aims to broaden the research applicability by providing a more comprehensive histological representation.
Furthermore, the dataset’s accessibility is facilitated through its availability in public repositories, cited in our references [13,14], promoting research transparency and reproducibility. To quantitatively summarize and describe this dataset, we compiled Table 1, adopting a descriptive statistical approach. This detailed consideration of data, including image resolution and digitalization specifics, ensures a thorough understanding of the dataset’s features, enabling more informed analysis and interpretation of the results.
4.2. Results
4.2.1. Descriptive Analysis
The results of experiments conducted on a dataset of breast tissue images show that the proposed method is effective in detecting IDC. The accuracy of the model is high, with a precision of 0.98 and recall of 0.96. The ROC curve shows that the model has a high true positive rate and a low false positive rate, indicating that it can effectively distinguish between IDC and healthy tissue.
Figure 1 displays the primary graphical user interface (GUI) screen utilized to commence the prediction of Invasive Ductal Carcinoma (IDC) breast cancer, along with facilitating all necessary analyses required by the user.
Figure 2 shows the number of patches per patient in an image for cancer detection. Each column represents a patient, with the height of the column indicating the number of patches analyzed for that patient. The x-axis represents the number of patches, and the y-axis shows the frequency of patches. By looking at Figure 2, one could quickly and easily understand how many patches per patient have been analyzed, which will give an idea about the density of cancerous cells in the patient. This graph can also help identify any outliers or patterns in the data, for example, if one patient has significantly more or fewer patches than the others, which could indicate a problem with the data collection or analysis.
Figure 3 shows the number of patches analyzed per patient for cancer detection. Each column represents a patient, with the height of the column indicating the number of patches analyzed. The x-axis represents the number of patches, and the y-axis shows the frequency of patches. By looking at Figure 3, one can quickly and easily understand how many patches per patient have been analyzed, which can provide an idea about the density of cancerous cells in the patient. This graph can also help identify any outliers or patterns in the data, such as if one patient has significantly more or fewer patches than the others, which could indicate a problem with the data collection or analysis.
Figure 4 presents a column graph illustrating the proportion of patches affected by Invasive Ductal Carcinoma (IDC) and their count. The x-axis shows the labels IDC-negative and IDC-positive, and the y-axis shows the count of patches.
Figure 5 illustrates the usefulness of binary target visualization per tissue slice in detecting Invasive Ductal Carcinoma. It enables the clear identification of IDC within a tissue slice by separating it into two categories, IDC-positive and IDC-negative, making it simpler to spot the existence or absence of cancer in the tissue.
Figure 6 and Figure 7, illustrate the significance of highlighting cancerous patches. It enables the quantification of the extent of Invasive Ductal Carcinoma (IDC) within an image. It displays the proportion of the image that is affected by IDC, which can be beneficial in evaluating the stage and progression of cancer.
4.2.2. Model Performance
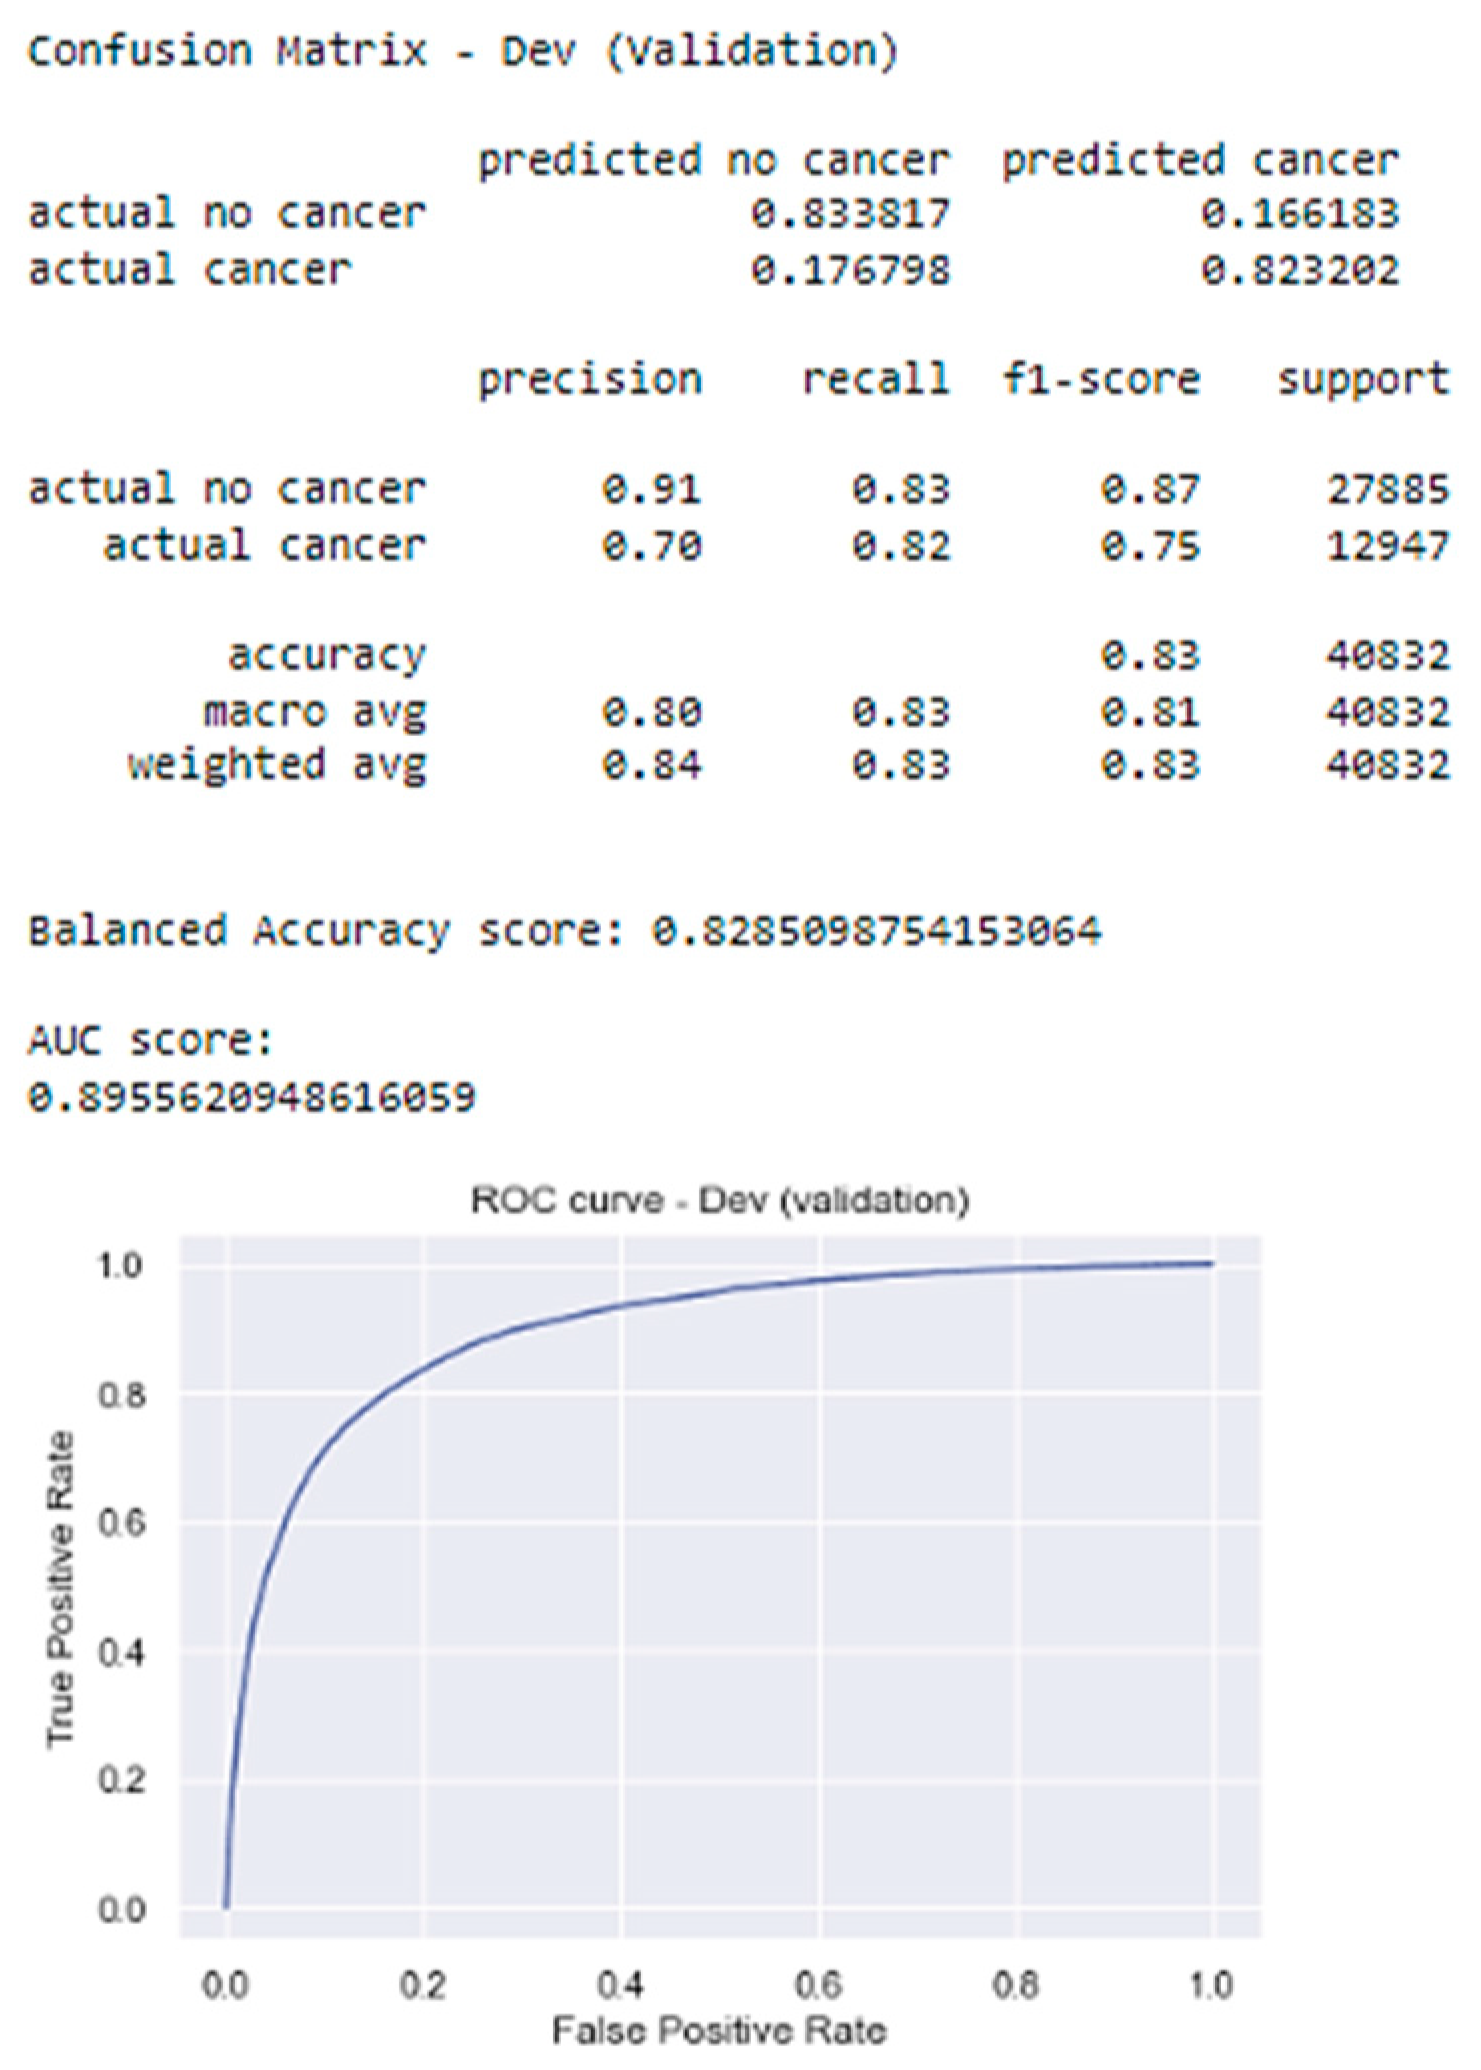
Figure 8 presents various metrics evaluating the performance of our model for Invasive Ductal Carcinoma (IDC) breast cancer prediction. These include a confusion matrix, precision–recall values, F1 scores, accuracy metrics, a Balanced Accuracy score, an AUC score, and an ROC curve.
Confusion Matrix: This matrix details the model’s performance by showing the number of true positives (correctly predicted cancer cases), false positives (incorrectly predicted cancer cases), true negatives (correctly predicted non-cancer cases), and false negatives (incorrectly predicted non-cancer cases). Notably, the model exhibits a higher true positive rate, indicating its effectiveness in minimizing missed cancer diagnoses, which is crucial for early detection and treatment. F1 Score: The F1 score for “actual cancer” is 0.75, signifying a balanced performance between precision and recall for cancer detection. Precision–Recall Values: The model demonstrates higher precision (0.90) for predicting no cancer compared to cancer (0.71). Similarly, the recall is higher for no cancer (0.85) than cancer (0.79). This suggests the model excels at identifying non-cancerous cases but may require improvement in accurately identifying cancerous ones. Accuracy Metrics: The overall accuracy (0.80) and Balanced Accuracy score (0.82) are encouraging. Additionally, the weighted average precision, recall, and F1-score (0.84) are all considered very good. AUC Score: The AUC score (0.89) signifies strong model performance in distinguishing between cancer and non-cancer cases.
5. Limitations
The model does acknowledge certain limitations and challenges of the proposed method in detecting and quantifying Invasive Ductal Carcinoma (IDC) in breast cancer images. One of the notable limitations is the reliance on image quality, as the accuracy of the predictions can be influenced by the clarity and resolution of the images. Additionally, the need for expert annotation is highlighted as a challenge, as obtaining accurate and consistent annotations from medical professionals can be time-consuming and resource intensive. Despite these limitations, the study emphasizes the promising performance of the method compared to existing methods, attributing its success to the utilization of deep learning techniques and image processing algorithms, which enable the identification of cancerous regions with high accuracy. The effectiveness of the model is also influenced by the quality and quantity of the data used in training and testing the algorithm, emphasizing the importance of comprehensive datasets. The study concludes by underscoring the need for further research to address these limitations and to enhance the accuracy and robustness of the method, suggesting that continual refinement and expansion of these methodologies could advance the field of breast cancer detection and improve patient outcomes.
6. Discussion
Our investigation strongly supports the initial hypothesis, demonstrating the effectiveness of our proposed methodology in detecting and quantifying Invasive Ductal Carcinoma (IDC) within breast cancer imagery. The achieved results highlight the capability of our approach to not only accurately identify IDC instances but also quantify them within the datasets examined. This performance signifies a noteworthy step towards enhancing diagnostic accuracy in breast cancer imaging analyses.
However, limitations exist. A crucial factor influencing our model’s accuracy is the quality of the images, as clarity and resolution directly impact its predictive accuracy. Additionally, the process necessitates expert annotation, which involves meticulous and time-consuming work from medical professionals to ensure accurate and consistent annotations. This requirement emphasizes the challenges of scalability and resource allocation in widespread deployment.
Compared to established models like XGBoost, our method exhibits noteworthy advantages. While XGBoost offers a robust framework for structured data, its application to complex image data necessitates pre-defined feature extraction, which may not capture the intricate patterns crucial for IDC detection. Conversely, CNNs, with their adeptness at learning hierarchical feature representations directly from images, present a compelling case for image-based analyses. Our method leverages the strengths of deep learning techniques and advanced image processing algorithms, facilitating the identification of cancerous regions with remarkable accuracy. This synergy enables it to excel where traditional models might falter, particularly in handling the intricate details inherent in histological images. The comparative analysis reveals that while CNNs excel in image classification tasks due to their deep learning capabilities, our method’s integration of specific deep learning techniques with image processing algorithms allows for a tailored approach that addresses the unique challenges of IDC detection and quantification. It is worth noting that, as with any method, the effectiveness is significantly influenced by the data’s quality and diversity used in its training and testing phases. Thus, the development of comprehensive and varied datasets remains paramount in advancing the field.
While image quality and annotation requirements pose challenges, our approach showcases promising potential compared to existing methods. It underscores the critical role of employing sophisticated machine learning algorithms in conjunction with detailed image analysis to bolster the precision of cancer diagnostics. Future work will aim to mitigate these limitations, exploring automated annotation techniques and enhancing model robustness to variations in image quality, thereby broadening the applicability and effectiveness of our methodology in clinical settings.
This study primarily aims to innovate in user interface design, which has been unexplored in public research within this domain. This novelty sets our work apart and offers a unique contribution to the field. Additionally, we have undertaken a detailed comparison of our model’s performance against established models, including the XGBoost model by Pawar et al., to situate our results within the broader research landscape.
Crucially, we delve into the specific challenges associated with employing histological images, particularly those obtained following mammography screenings or under clinical suspicion of cancer. This discussion emphasizes the nuanced difficulties in identifying pathological findings within such a context, highlighting the precision challenge that our model seeks to address. The decision to utilize CNNs was primarily driven by their inherent advantages in handling image data. CNNs excel at automatically learning and extracting features directly from images. This is particularly beneficial for histological images, where texture, shape, and cell arrangement are crucial for accurate classification.
While CNNs can be more computationally intensive and complex to tune, their ability to handle the high dimensionality of image data without extensive feature engineering makes them a better fit for histological images compared to XGBoost, which typically requires manual feature extraction and selection for effective operation. This additional preprocessing step can be a significant drawback when dealing with histological images, where manual feature extraction is challenging and time-consuming.
7. Conclusions
Our study has illustrated the effectiveness of the presented method in detecting and quantifying Invasive Ductal Carcinoma in breast cancer images. The key takeaway from our work is the importance of accurate and reliable cancer detection methods for timely diagnosis and treatment.
For future work, interesting areas of research include exploring the use of deep learning techniques to improve the accuracy of cancer detection and quantification. The major shortcomings of our current method include the need for expert annotation and the reliance on image quality, which can be overcome by incorporating more advanced machine learning models and developing automated annotation tools.
Author Contributions
Conceptualization, A.D. and F.N.; Methodology, A.D. and F.N.; Formal analysis, F.N.; Investigation, A.D. and F.N.; Writing—original draft, F.N.; Writing—review and editing, A.D. and F.N.; Supervision, A.D.; Funding acquisition, A.D. All authors have read and agreed to the published version of the manuscript.
Funding
This research did not receive any specific funding and was conducted without financial support from external sources.
Institutional Review Board Statement
Not applicable.
Informed Consent Statement
Not applicable.
Data Availability Statement
The data that is used in this study is publicly available in https://archive.ics.uci.edu/ml/datasets/breast+cancer+wisconsin+(diagnostic) (accessed on 1 May 2023).
Acknowledgments
This research was supported and assisted by Salem State University.
Conflicts of Interest
The authors declare no conflicts of interest.
References
- American Cancer Society. Breast Cancer Facts & Figures 2021–2022. Available online: https://archive.ics.uci.edu/ml/datasets/breast+cancer+wisconsin+(diagnostic) (accessed on 1 May 2023).
- Esteva, A.; Kuprel, B.; Novoa, R.A.; Ko, J.; Swetter, S.M.; Blau, H.M.; Thrun, S. Dermatologist-level classification of skin cancer with deep neural networks. Nature 2017, 542, 115–118. [Google Scholar] [CrossRef]
- McKinney, S.M.; Sieniek, M.; Godbole, V.; Godwin, J.; Antropova, N.; Ashrafian, H.; Back, T.; Chesus, M.; Corrado, G.S.; Darzi, A.; et al. International evaluation of an AI system for breast cancer screening. Nature 2020, 577, 89–94. [Google Scholar] [CrossRef] [PubMed]
- Li, H.; Giger, M.L.; Olopade, O.I. Margins of breast cancer in mammography and whole-slide histopathology images. In Proceedings of the Signal Processing in Medicine and Biology Symposium (SPMB), Philadelphia, PA, USA, 2 December 2017; pp. 1–6. [Google Scholar]
- Ghosh, P. Applying XGBoost Machine Learning Tool to Digitized Images of Fine Needle Aspirates (FNA) of the Breast. Int. J. Sci. Res. 2022. [Google Scholar]
- Abdelrahman, L.; Al Ghamdi, M.; Collado-Mesa, F.; Abdel-Mottaleb, M. Convolutional neural networks for breast cancer detection in mammography: A survey. Comput. Biol. Med. 2021, 131, 104248. [Google Scholar] [CrossRef] [PubMed]
- Sharma, S.; Sharma, M.; Sharma, A. Breast cancer detection in mammogram images using fuzzy k-means clustering, c-means clustering and edge detection techniques. Int. J. Comput. Appl. 2023, 181, 31–37. [Google Scholar]
- Pawar, S. Evaluation of different machine learning algorithms for breast cancer prediction using Wisconsin Breast Cancer Dataset. Int. J. Adv. Res. 2022, 10, 339–344. [Google Scholar]
- Chen, J.; Yang, N.; Pan, Y.; Liu, H.; Zhang, Z. Synchronous Medical Image Augmentation framework for deep learning-based image segmentation. Comput. Med. Imaging Graph. 2023, 104, 102161. [Google Scholar] [CrossRef] [PubMed]
- Kang, Y.; Wang, H.; Pu, B.; Tao, L.; Chen, J.; Philip, S.Y. A hybrid two-stage teaching-learning-based optimization algorithm for feature selection in bioinformatics. In IEEE/ACM Transactions on Computational Biology and Bioinformatics; IEEE: New York, NY, USA, 2022. [Google Scholar]
- Chen, J.; Yang, N.; Zhou, M.; Zhang, Z.; Yang, X. A configurable deep learning framework for medical image analysis. Neural Comput. Appl. 2022, 34, 7375–7392. [Google Scholar] [CrossRef]
- Gulsun, I.; Acikalin, T.; Ekici, S. Transfer learning-based breast cancer classification using pre-trained convolutional neural networks. Neural Comput. Appl. 2022, 1–12. [Google Scholar]
- Cheng, J.; Han, X.; Chen, H.; Wang, Y.; Xia, Y. Attention-based convolutional neural network for breast cancer metastasis prediction on whole-slide images. Pattern Recognit. Lett. 2023, 166, 272–278. [Google Scholar]
- Liu, Y.; Sun, M.; Wang, Z.; Li, X.; Zhang, Y.; Liu, S. Deep learning ensemble with data augmentation for breast cancer diagnosis on ultrasound images. Expert Syst. Appl. 2022, 209, 118353. [Google Scholar]
- Amira, A.; Mahmood, A.; Ali, E.M. Generative Adversarial Networks for data augmentation in breast cancer detection. Comput. Biol. Med. 2022, 144, 105320. [Google Scholar]
- Litjens, G.; Kooi, T.; Bejnordi, B.E.; Setio, A.A.A.; Ciompi, F.; Ghafoorian, M.; van der Laak, J.A.W.M.; van Ginneken, B.; Sánchez, C.I. A survey on deep learning in medical image analysis. Nat. Methods 2016, 14, 863–882. [Google Scholar] [CrossRef] [PubMed]
- Le, N.; Huynh, V.; Nguyen, V.; Pham, T.; Nam, H. A review on deep learning methods for breast cancer detection. Diagnostics 2021, 11, 2297. [Google Scholar]
- Yu, J.; Shen, L.; Zhou, X.; Yang, J.; Feng, Y. Explainable deep learning for breast cancer diagnosis. In Proceedings of the International Conference on Machine Learning, Vienna, Austria, 12–18 July 2020; pp. 11741–11751. [Google Scholar]
- Cruz-Roa, A.; Basavanhally, A.; González, F.; Gilmore, H.; Feldman, M.; Ganesan, S.; Shih, N.; Tomaszewski, J.; Madabhushi, A. Automatic detection of invasive ductal carcinoma in whole-slide images with convolutional neural networks. In Medical Imaging 2014: Digital Pathology; International Society for Optics and Photonics: Bellingham, WA, USA, 2014; Volume 9041, p. 904103. [Google Scholar]
- Zotin, A.; Simonov, K.; Kurako, M.; Hamad, Y.; Kirillova, S. Edge detection in MRI brain tumor images based on fuzzy C-means clustering. Procedia Comput. Sci. 2018, 126, 1261–1270. [Google Scholar] [CrossRef]
- Chakradeo, K.; Vyawahare, S.; Pawar, P. Breast cancer recurrence prediction using machine learning. In Proceedings of the 2019 IEEE Conference on Information and Communication Technology, Allahabad, India, 6–8 December 2019; pp. 1–7. [Google Scholar]
Figure 1.
The GUI system for IDC detection.
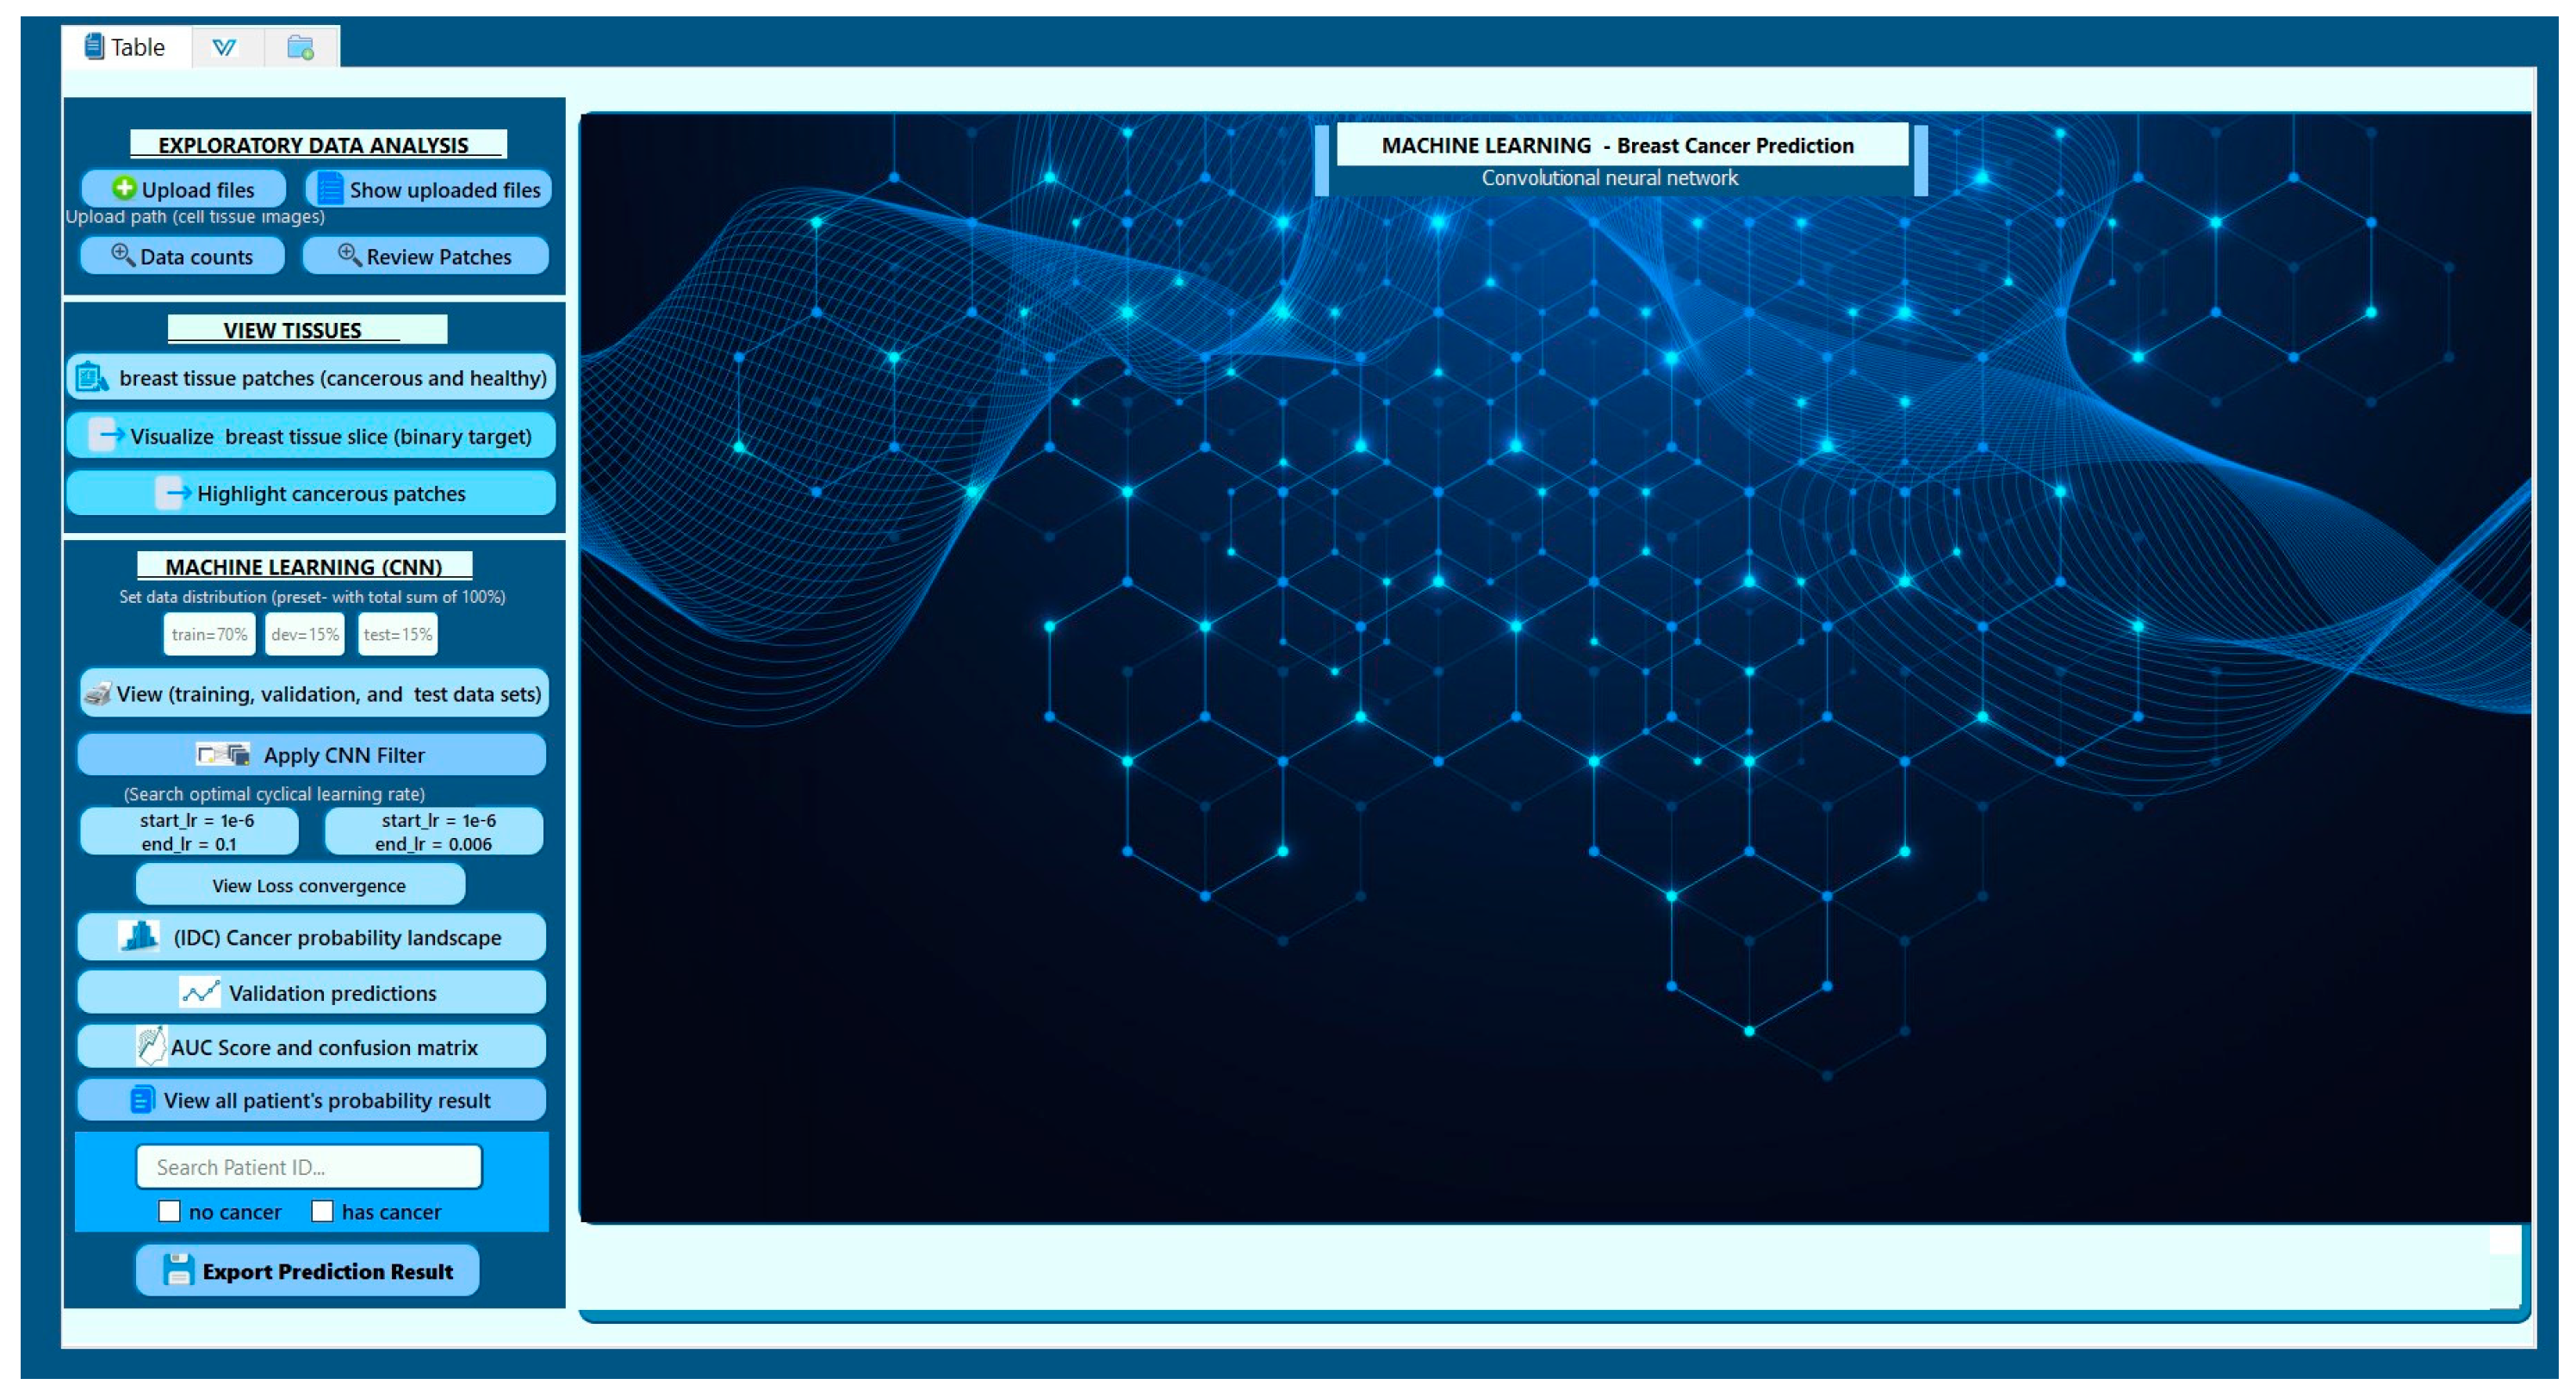
Figure 2.
MLG randomly displays healthy and cancerous patches.

Figure 3.
Shows the number of patches per patient in an image for cancer detection.
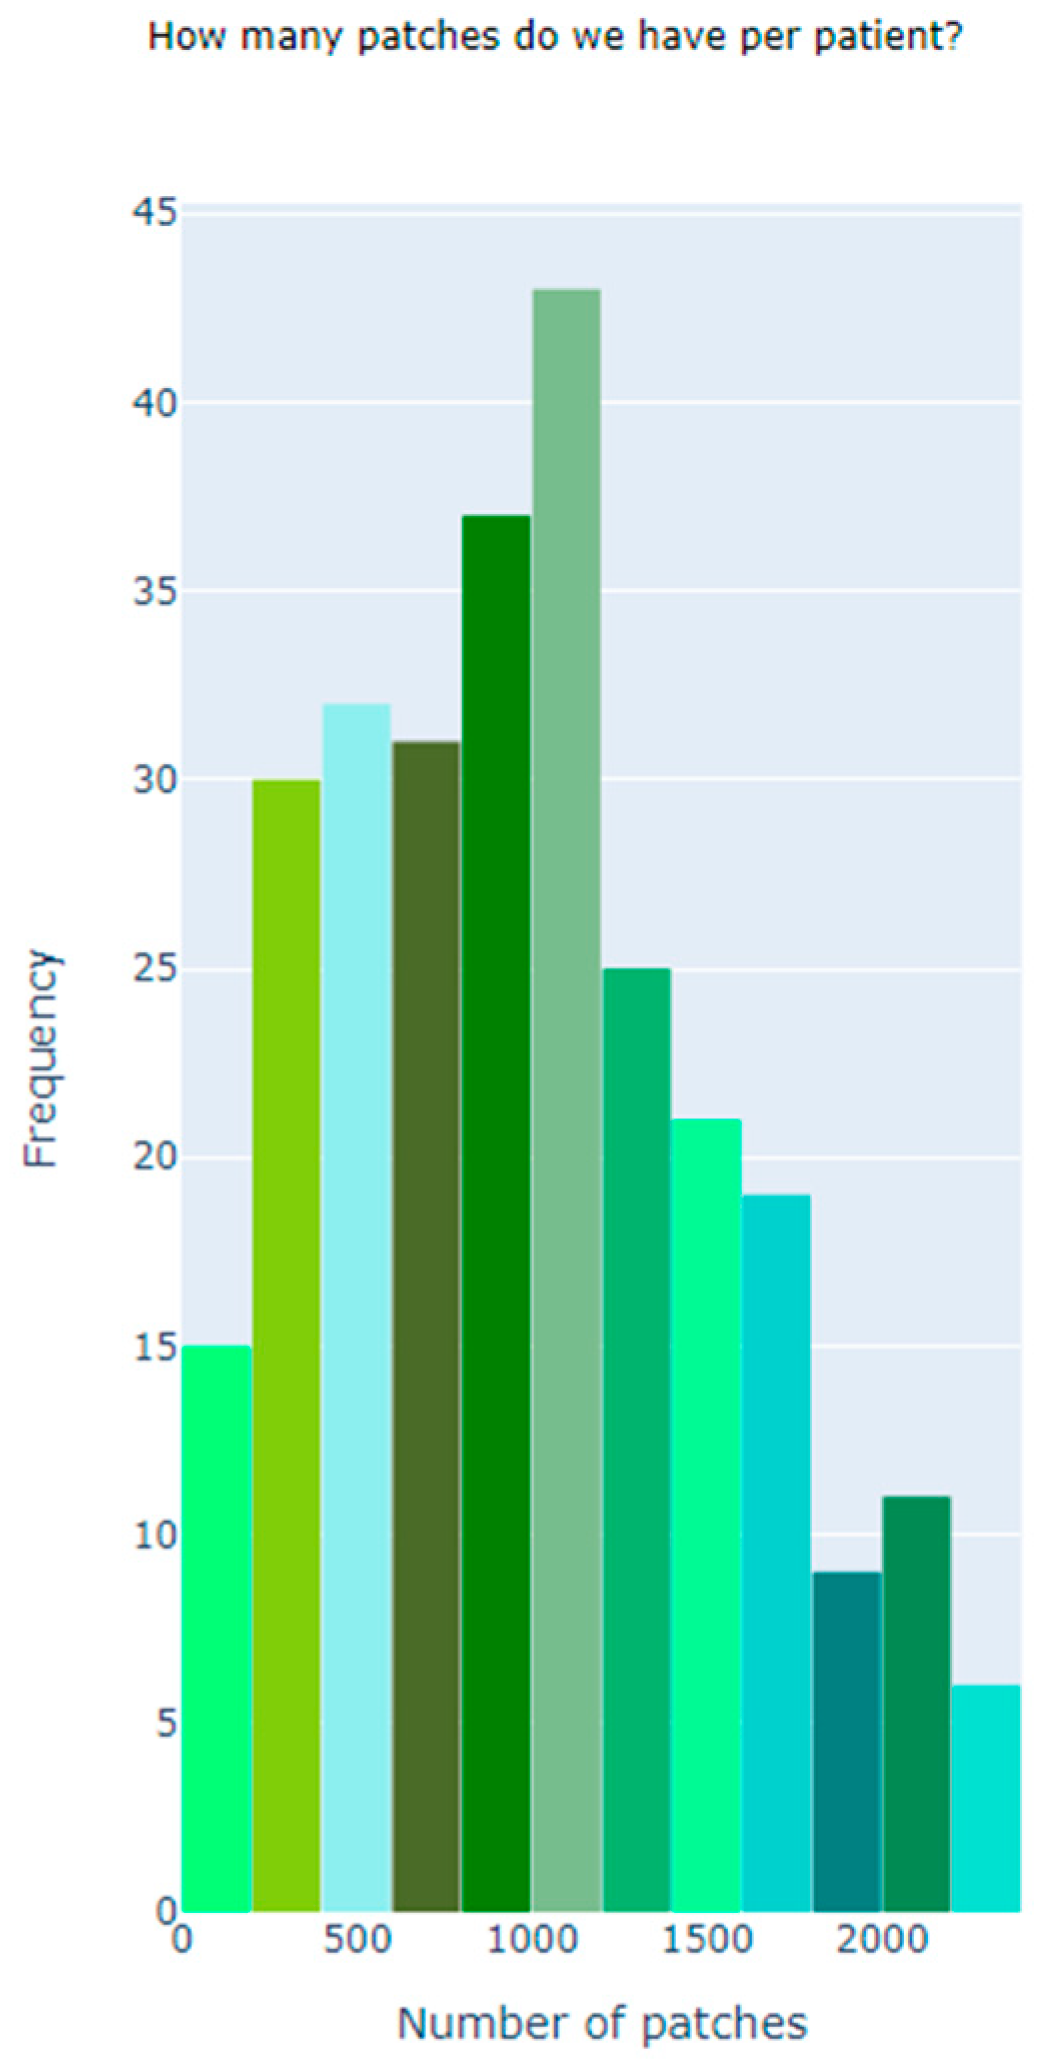
Figure 4.
Shows the number of patches per patient in an image for cancer detection.
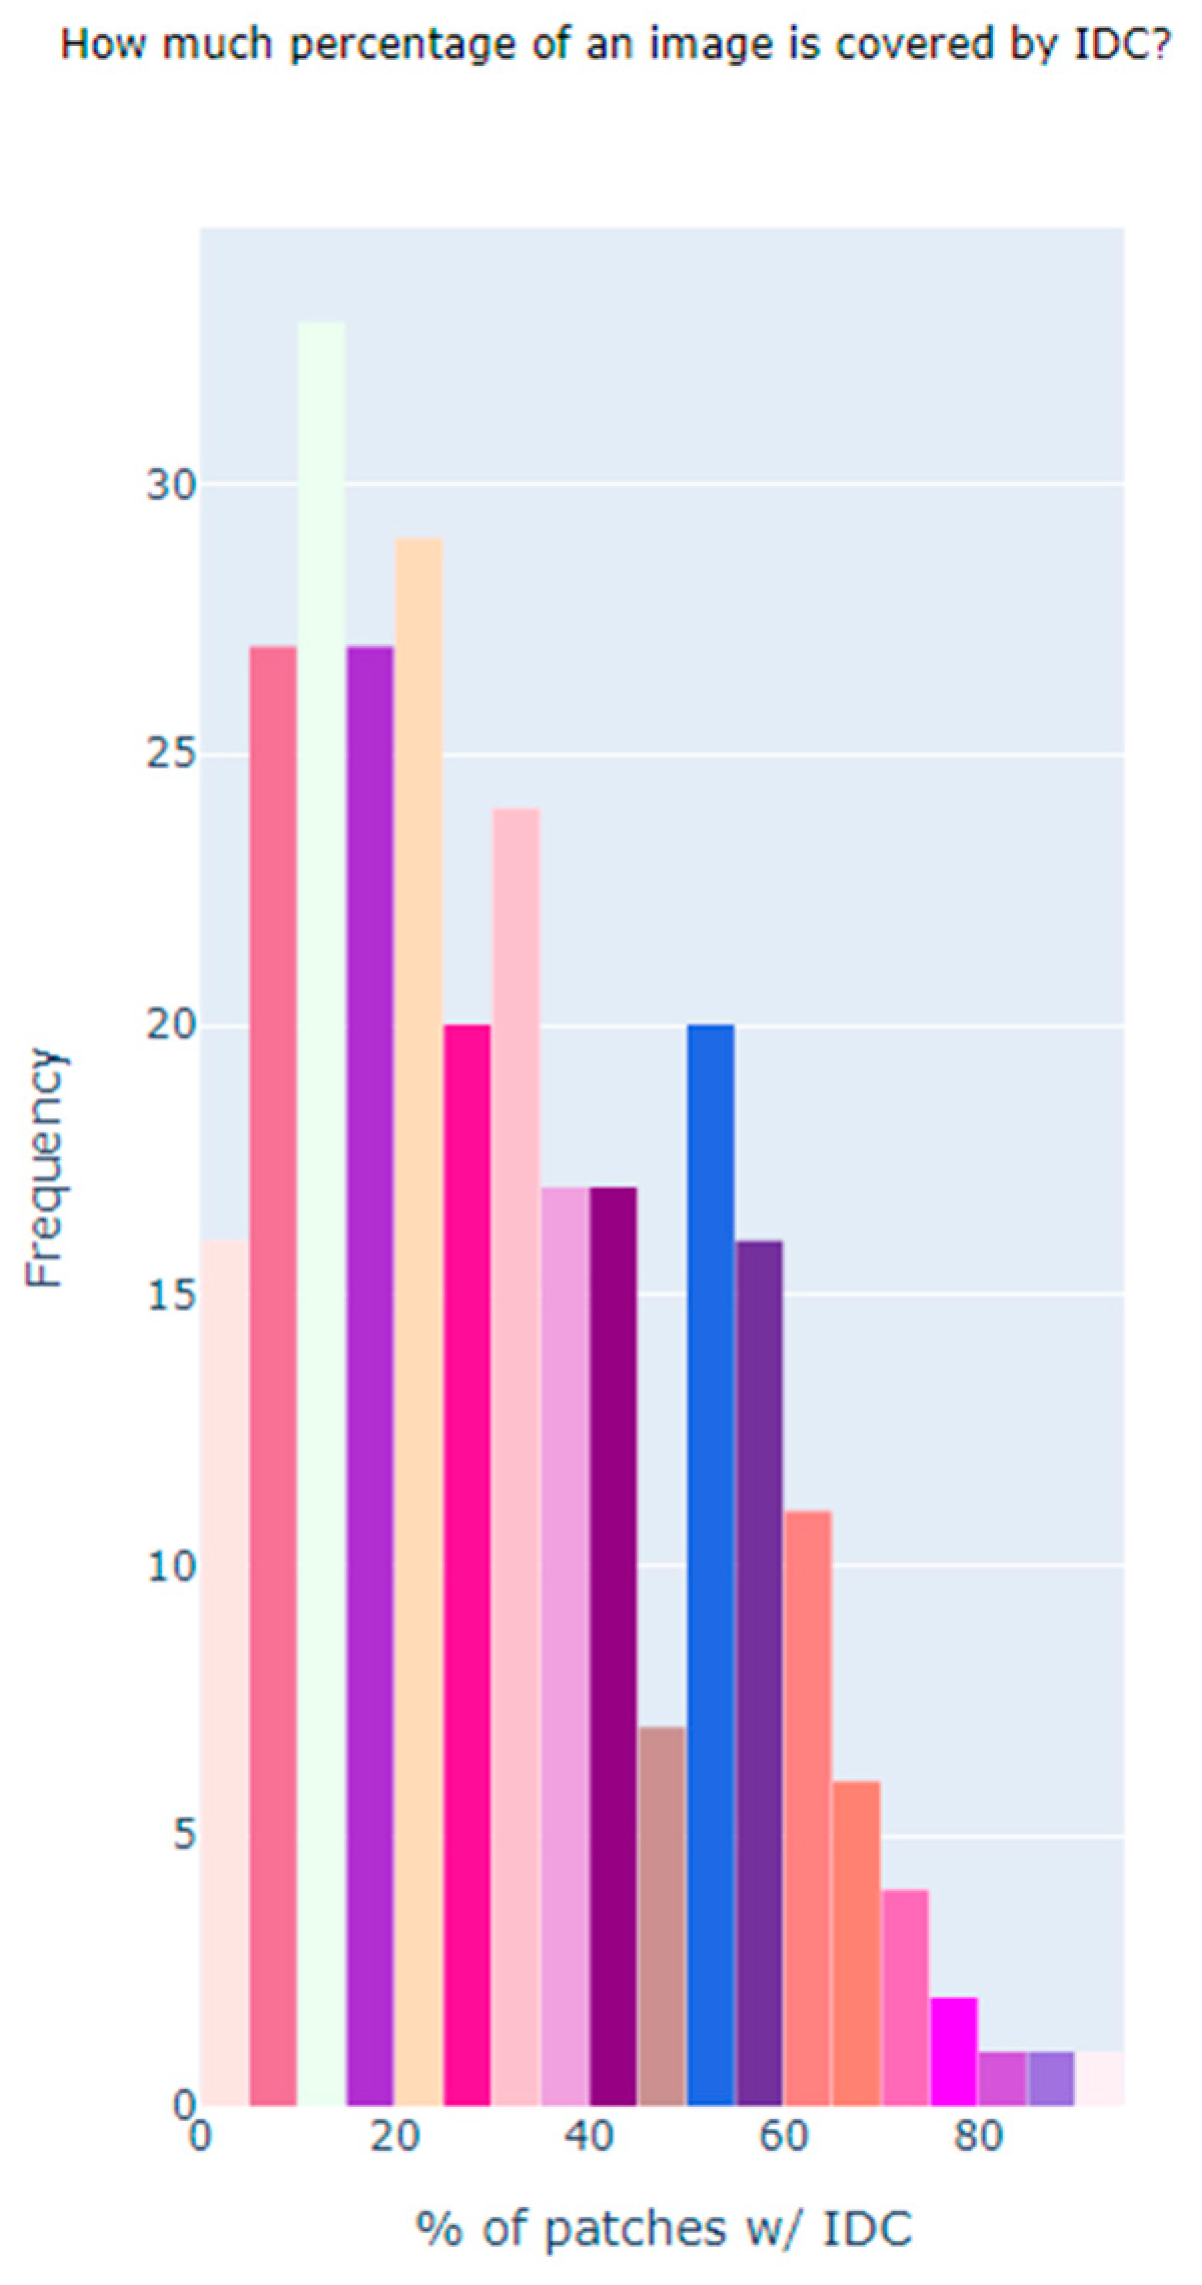
Figure 5.
Distribution of patches affected by Invasive Ductal Carcinoma (IDC).
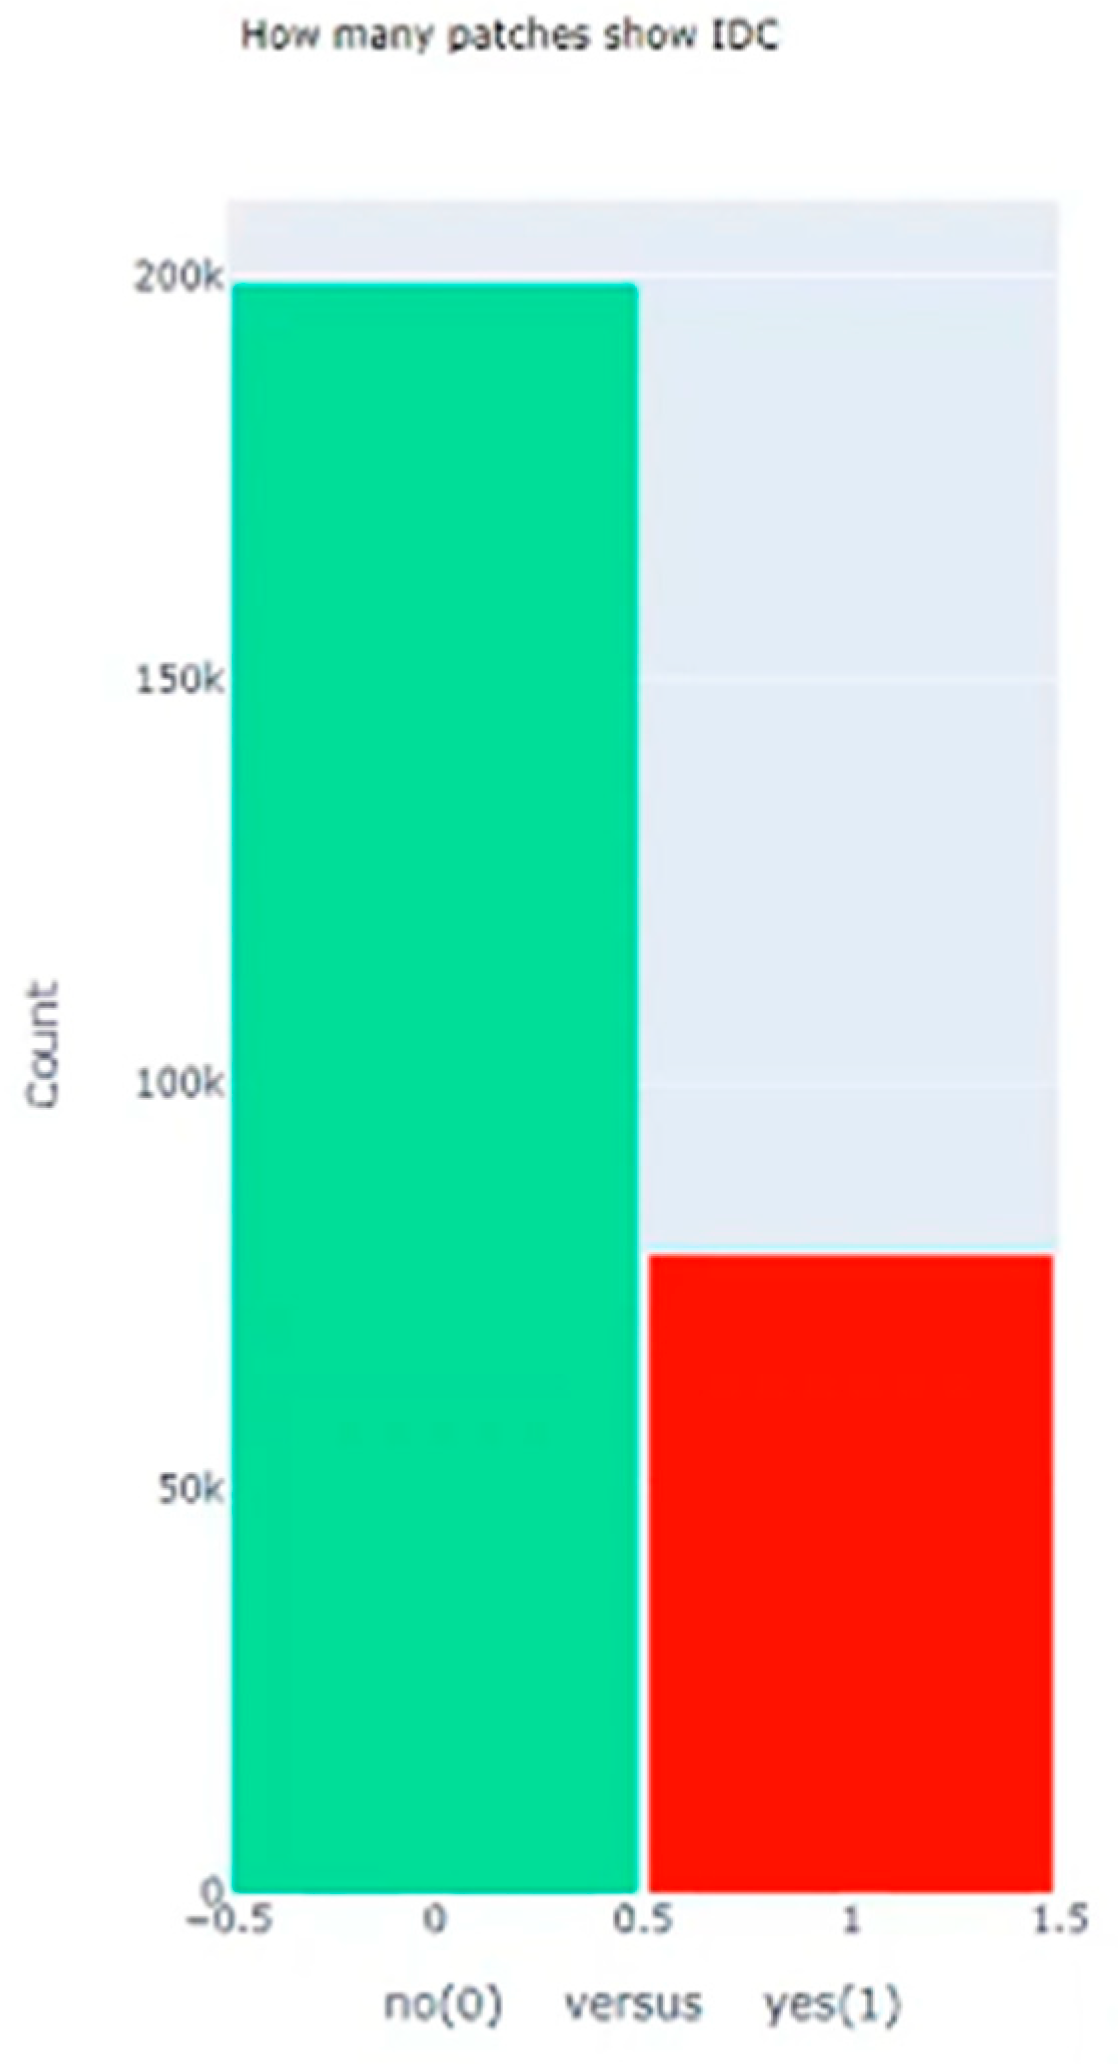
Figure 6.
Binary target visualization per tissue slice for detecting Invasive Ductal Carcinoma (IDC).
Figure 6.
Binary target visualization per tissue slice for detecting Invasive Ductal Carcinoma (IDC).

Figure 7.
Highlighting cancerous patches for quantifying the extent of Invasive Ductal Carcinoma (IDC) within an image.
Figure 7.
Highlighting cancerous patches for quantifying the extent of Invasive Ductal Carcinoma (IDC) within an image.
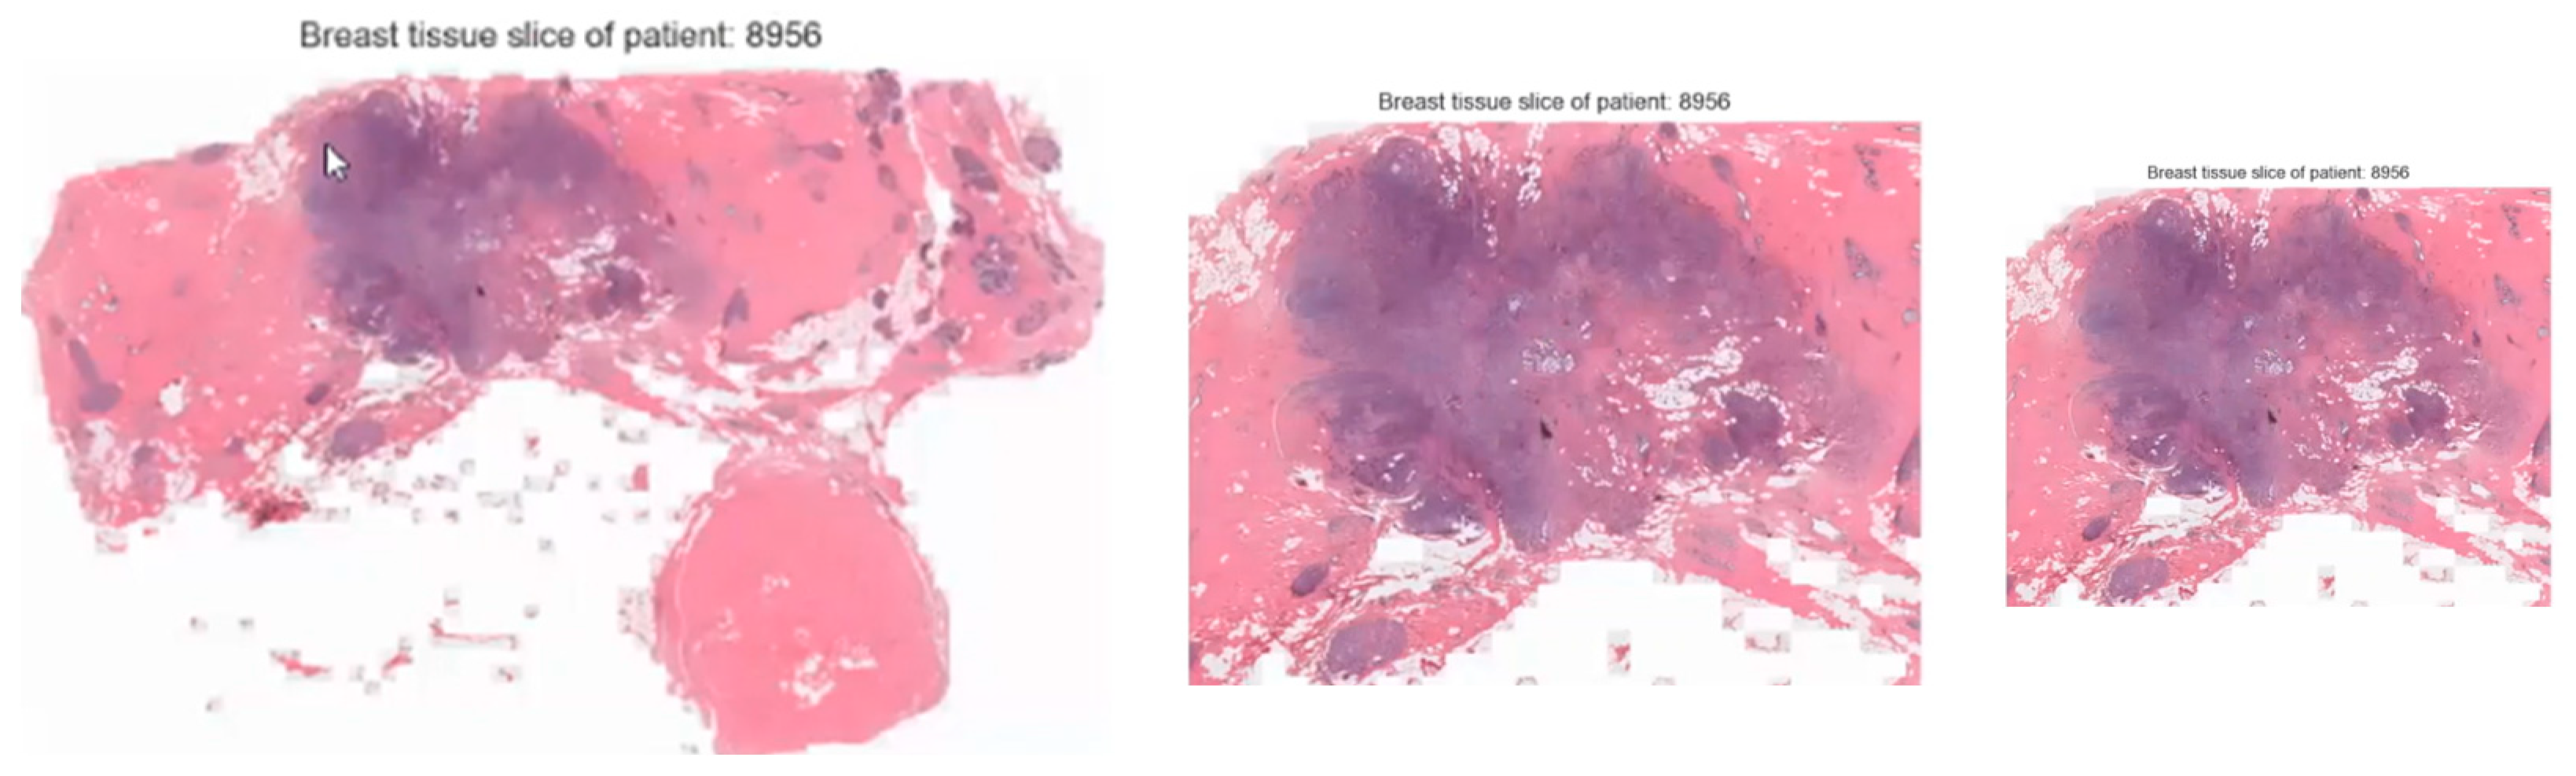
Figure 8.
Evaluation metrics and ROC curve for breast cancer prediction model.

Table 1.
Statistical Information about the dataset.
| Dataset | Size |
|---|---|
| Size of the data | Roughly 4.14 GB |
| Total Number of Images | 277,524 |
| Total Number of Features | 512 |
| Total Number of Patient | 162 |
| Total Number of Images without Cancer | 198,738 |
| Total Number of Images with Cancer | 78,786 |
| Total Number of Images in Training data | 210,602 |
| Total Number of Images in Testing data | 33,013 |
| Total Number of Images in Developing data | 33,909 |
Disclaimer/Publisher’s Note: The statements, opinions and data contained in all publications are solely those of the individual author(s) and contributor(s) and not of MDPI and/or the editor(s). MDPI and/or the editor(s) disclaim responsibility for any injury to people or property resulting from any ideas, methods, instructions or products referred to in the content. |
© 2024 by the authors. Licensee MDPI, Basel, Switzerland. This article is an open access article distributed under the terms and conditions of the Creative Commons Attribution (CC BY) license (https://creativecommons.org/licenses/by/4.0/).
Share and Cite
MDPI and ACS Style
Dequit, A.; Nafa, F. Advancing Early Detection of Breast Cancer: A User-Friendly Convolutional Neural Network Automation System. BioMedInformatics 2024, 4, 992-1005. https://doi.org/10.3390/biomedinformatics4020055
AMA Style
Dequit A, Nafa F. Advancing Early Detection of Breast Cancer: A User-Friendly Convolutional Neural Network Automation System. BioMedInformatics. 2024; 4(2):992-1005. https://doi.org/10.3390/biomedinformatics4020055
Chicago/Turabian StyleDequit, Annie, and Fatema Nafa. 2024. "Advancing Early Detection of Breast Cancer: A User-Friendly Convolutional Neural Network Automation System" BioMedInformatics 4, no. 2: 992-1005. https://doi.org/10.3390/biomedinformatics4020055