

Journal Description
Econometrics
Econometrics
is an international, peer-reviewed, open access journal on econometric modeling and forecasting, as well as new advances in econometrics theory, and is published quarterly online by MDPI.
- Open Access— free for readers, with article processing charges (APC) paid by authors or their institutions.
- High Visibility: indexed within Scopus, ESCI (Web of Science), EconLit, EconBiz, RePEc, and other databases.
- Rapid Publication: manuscripts are peer-reviewed and a first decision is provided to authors approximately 35.4 days after submission; acceptance to publication is undertaken in 6.5 days (median values for papers published in this journal in the second half of 2025).
- Recognition of Reviewers: reviewers who provide timely, thorough peer-review reports receive vouchers entitling them to a discount on the APC of their next publication in any MDPI journal, in appreciation of the work done.
Impact Factor:
1.4 (2024);
5-Year Impact Factor:
1.2 (2024)
Latest Articles
Modeling the Dynamic Relationship Between Stock Market Performance and Key Macroeconomic Indicators in Saudi Arabia: An ARDL-ECM Approach
Econometrics 2026, 14(2), 25; https://doi.org/10.3390/econometrics14020025 - 16 May 2026
Abstract
►
Show Figures
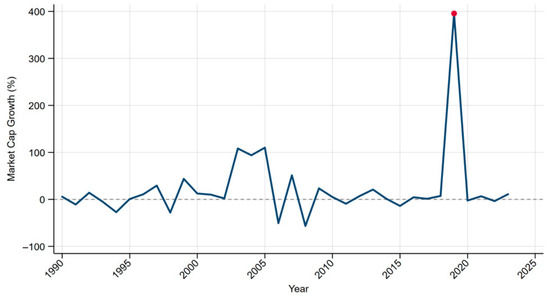
This study investigates the short-term and long-term impacts of gross domestic product (GDP), inflation, foreign capital flows, trade balance and interest rate on stock market performance in Saudi Arabia for the period 1990–2023. The autoregressive distributed lag (ARDL) approach and error correction model
[...] Read more.
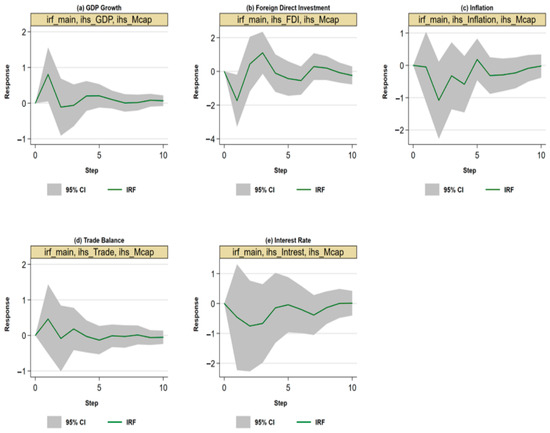
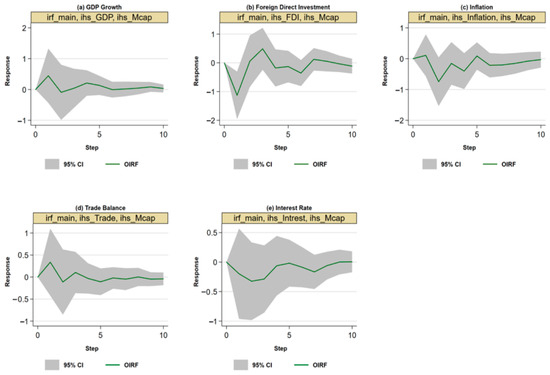
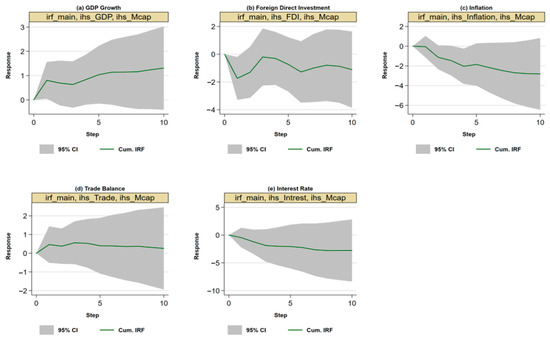
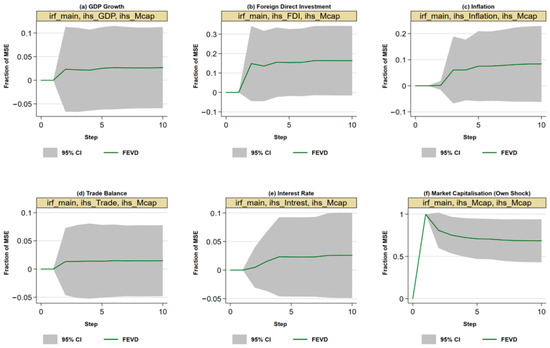
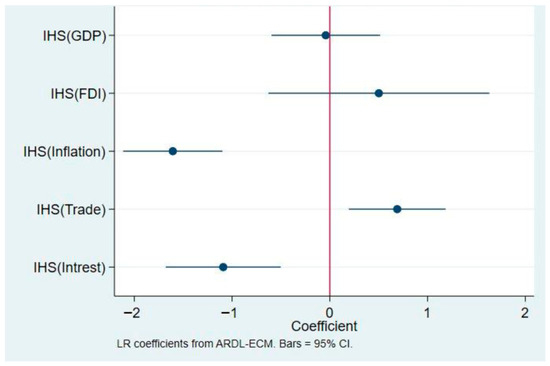
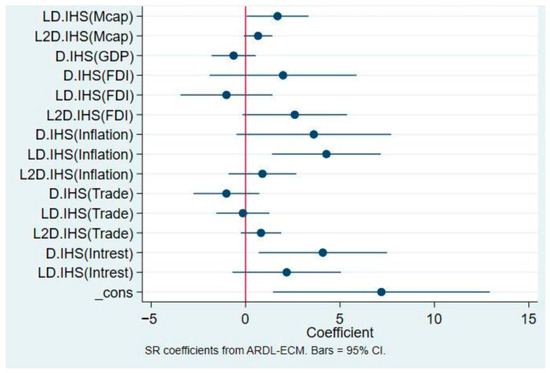
This study investigates the short-term and long-term impacts of gross domestic product (GDP), inflation, foreign capital flows, trade balance and interest rate on stock market performance in Saudi Arabia for the period 1990–2023. The autoregressive distributed lag (ARDL) approach and error correction model (ECM) are employed to empirically examine the short-run and long-run relationships. The ARDL-ECM technique is effective for analyzing cointegration and assessing adjustment processes. Additionally, impulse response function (IRF) analysis based on the vector autoregression (VAR) model, estimated using these macroeconomic indicators, is applied in this paper. This study provides novel insights and addresses emerging gaps in the literature concerning Saudi Arabia as a developing economy. The long-term relationship in the bounds test results confirms its existence. In the long run, inflation and interest rate exert a statistically significant negative effect on stock market performance, while the trade balance has a significant positive impact. GDP and foreign capital inflows do not exhibit statistically significant long-run effects. Short-run dynamics indicate persistence in stock market performance along with significant effects from inflation and interest rate changes, while GDP and foreign capital inflows remain statistically insignificant in the long-run scenario. Forecast error variance decomposition (FEVD) results show that approximately 68.5% of the variation in market performance is explained by its own shocks, followed by foreign capital flows (16.3%) and inflation (8.4%). While foreign capital flow does not exhibit statistical significance in the ARDL long-run estimates, its contribution in variance decomposition highlights its role as an important source of external shocks. These findings are relevant to various stakeholders, including investors and policymakers. Additionally, policy emphasis should be placed on controlling inflation and maintaining stable interest rates while improving trade balance conditions. Although foreign capital flow does not show a direct long-run effect, its role in influencing market variability suggests the need for a stable and well-regulated investment environment.
Full article
Open AccessArticle
Measuring the Return to Online Advertising: Estimation and Inference of Endogenous Treatment Effects
by
Shakeeb Khan, Denis Nekipelov and Justin Rao
Econometrics 2026, 14(2), 24; https://doi.org/10.3390/econometrics14020024 - 12 May 2026
Abstract
►▼
Show Figures
In this paper we aim to conduct inference on the “lift” effect generated by an online advertisement display: specifically we want to analyze if the presence of the brand ad among the advertisements on the page increases the overall number of consumer clicks
[...] Read more.
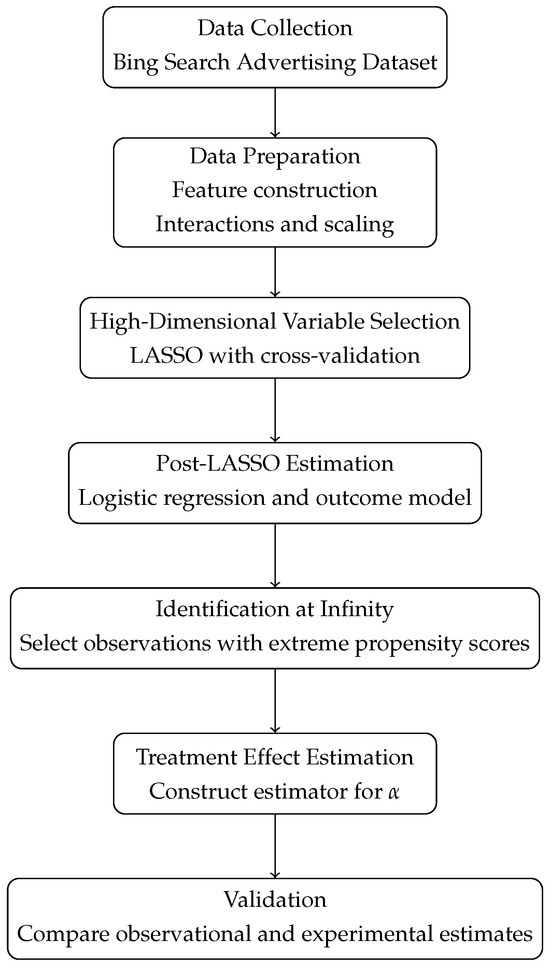
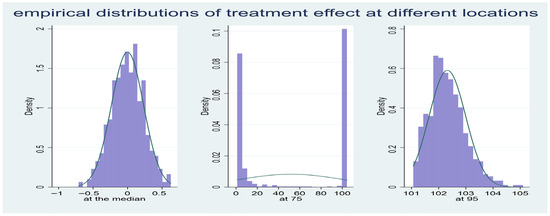
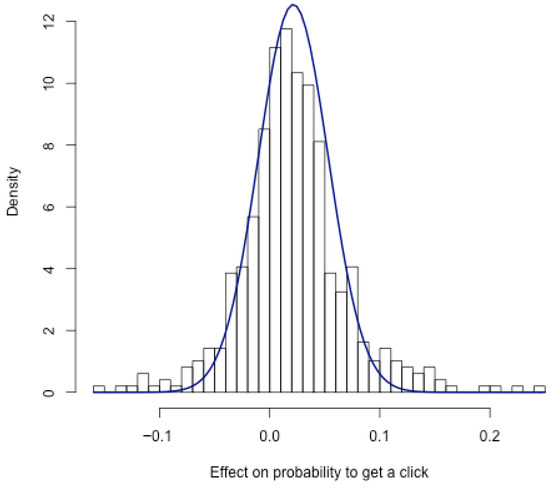
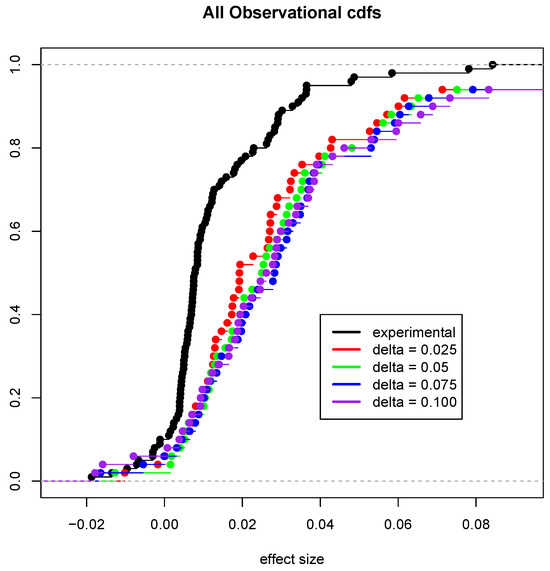
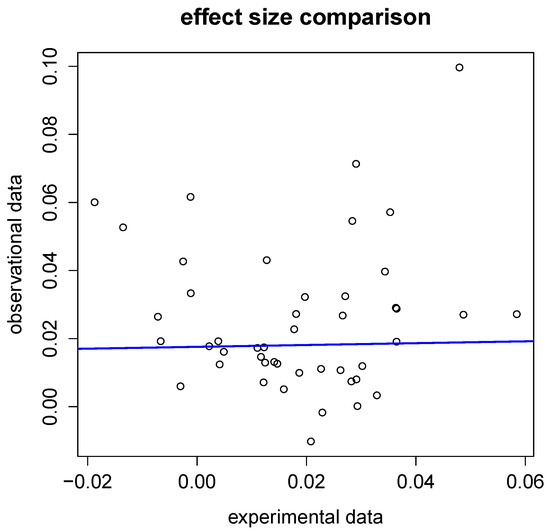
In this paper we aim to conduct inference on the “lift” effect generated by an online advertisement display: specifically we want to analyze if the presence of the brand ad among the advertisements on the page increases the overall number of consumer clicks on that page. A distinctive feature of online advertising is that the ad displays are highly targeted—the advertising platform evaluates the (unconditional) probability of each consumer clicking on a given ad, which leads to a higher probability of displaying the ads that have a higher a priori estimated probability of click. As a result, inferring thecausal effect of the ad display on the page clicks by a given consumer from typical observational data is difficult. To address this we propose a multi-step estimator that focuses on the tails of the consumer distribution to estimate the true causal effect of an ad display. This “identification at infinity” approach alleviates the need for independent experimental randomization but results in nonstandard asymptotic theory, motivating our novel inference method. To validate our results, we use a set of large-scale randomized controlled experiments that Microsoft has run on its advertising platform. Our dataset has a large number of observations and a large number of variables and we employ LASSO to perform variable selection. Providing a basis for comparison with our estimates, we use a study conducted by Microsoft with approximately 9.3 million search sessions focusing on consumer click behavior across search result pages of a major search engine. Randomized experiments indicate that displaying a brand advertisement increases the probability of visiting the advertiser’s website by about 2.27 percentage points relative to a baseline visit rate of roughly 78 percent. Our non-experimental estimates exhibit broadly similar patterns to those obtained from randomized controlled trials, suggesting that the proposed observational estimator can recover qualitatively comparable treatment effects in large-scale advertising data.
Full article

Figure 1
Open AccessArticle
Internationalization and Financing Decisions of Chinese Enterprises: Evidence from Hong Kong Listings
by
Pujie Lin and Tsz Leung Yip
Econometrics 2026, 14(2), 23; https://doi.org/10.3390/econometrics14020023 - 7 May 2026
Abstract
►▼
Show Figures
This study explores the impact of internationalization on the financing decisions and finance costs of Chinese enterprises listed in Hong Kong, extending the pecking order theory to an international context. Utilizing data from 785 companies from 2010 to 2020, the research investigates how
[...] Read more.
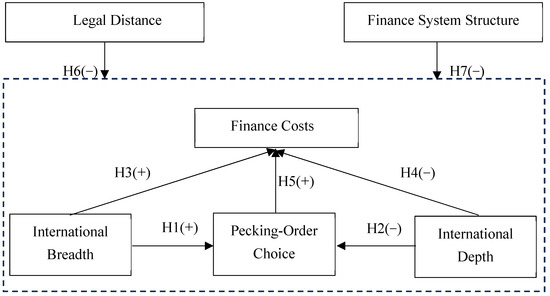
This study explores the impact of internationalization on the financing decisions and finance costs of Chinese enterprises listed in Hong Kong, extending the pecking order theory to an international context. Utilizing data from 785 companies from 2010 to 2020, the research investigates how the degree of internationalization influences corporate finance strategies, with a focus on the mediating role of the pecking order and the moderating effects of international business factors. The findings reveal that while broader internationalization increases finance costs, deeper internationalization reduces them. Legal distance is found to negatively moderate this relationship, whereas the structure of the financial system positively influences it. The results suggest that multinational enterprises with extensive overseas resource allocation demonstrate greater flexibility in financing decisions, particularly in foreign markets characterized by strong investor protection and efficient direct finance mechanisms. Managers should be cautious about pursuing wide geographic expansion without adequate operating depth because a broad but shallow international presence may increase financing frictions. By contrast, deeper resource commitment abroad can strengthen financing flexibility and improve access to lower-cost funds, especially when institutional conditions in the financing market are favorable.
Full article

Figure 1
Open AccessArticle
Estimation of Two-States Proportional Hazard Rates Models with Unobserved Heterogeneity
by
Emilio Congregado, David Troncoso-Ponce, Nicola Rubino and Alejandro Morales-Kirioukhina
Econometrics 2026, 14(2), 22; https://doi.org/10.3390/econometrics14020022 - 28 Apr 2026
Abstract
►▼
Show Figures
This article examines two-state proportional hazard rate models with unobserved heterogeneity specific to each state, a framework that is especially relevant for labor market transitions. To make estimation feasible in large longitudinal datasets, we implement hshaz2s, a Stata routine that uses analytical expressions
[...] Read more.
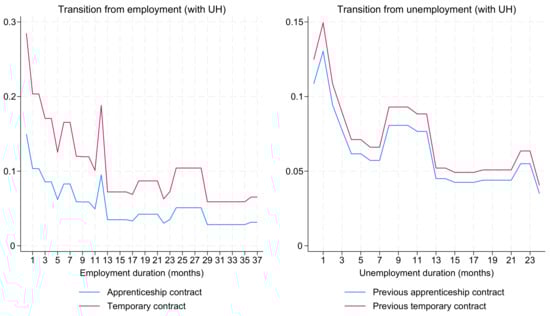
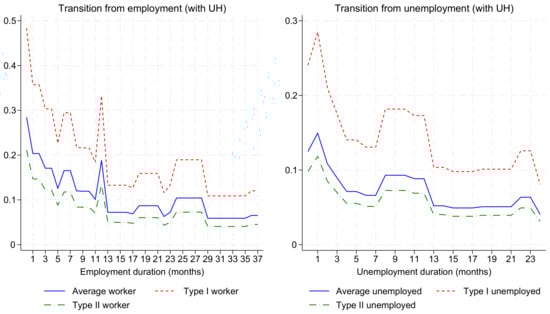
This article examines two-state proportional hazard rate models with unobserved heterogeneity specific to each state, a framework that is especially relevant for labor market transitions. To make estimation feasible in large longitudinal datasets, we implement hshaz2s, a Stata routine that uses analytical expressions for the gradient vector and Hessian matrix of the log-likelihood function through the dual second-order moment (d2 ml) method. The empirical application estimates a discrete-time duration model for transitions between employment and unemployment using Spanish labor market microdata for young low-skilled workers over 2000–2019. The results show that apprenticeship contracts are associated with lower exit rates from employment than other temporary contracts, but not with faster transitions from unemployment back into employment. The estimates also reveal substantial state-specific unobserved heterogeneity, with a large latent group characterized by persistent spells in both states. Analytical second-order information also markedly reduces convergence time under richer heterogeneity structures. Overall, the article makes this class of two-state hazard models operational for applied research and provides new evidence on apprenticeship and temporary contracts in Spain.
Full article

Figure 1

Open AccessArticle
Edgeworth Expansions When the Parameter Dimension Increases with Sample Size
by
Christopher Stroude Withers
Econometrics 2026, 14(2), 21; https://doi.org/10.3390/econometrics14020021 - 27 Apr 2026
Abstract
Suppose that we have a statistical model with q unknown parameters w, and an estimate , based on a sample of size n. A basic question is: what is the covariance of the estimate? The covariance is needed for
[...] Read more.
Suppose that we have a statistical model with q unknown parameters w, and an estimate , based on a sample of size n. A basic question is: what is the covariance of the estimate? The covariance is needed for the Central Limit Theorem (CLT). This gives a first approximation for the distribution of . But what if increases with n? How fast can it increase and the CLT still hold? An answer has so far only been given for the sample mean. The same is true for the Edgeworth expansions. These are expansions in powers of for the density and distribution of . For fixed q, these expansions are important, as they show how small n can be for the CLT to apply. When it does, they can greatly improve the accuracy of the CLT. I give conditions that allow for the Edgeworth expansions to remain valid when increases with n. Earlier Edgeworth expansions when increases, have only been done for a sample mean, and only for a 2nd order Edgeworth expansion. In contrast, I consider a very large class of estimates, the class of non-lattice standard estimates. An estimate is said to be a standard estimate if its mean converges to its true value as n increases, and for , its rth order cumulants have magnitude and can be expanded in powers of . For this class of estimates, I show that the Edgeworth expansions hold if grows as a power of n less than That is, I give these expansions in powers of . This large class of estimates has a huge range of potential applications, as estimates of high dimension are common in nearly all areas of applied statistics. The most important type of standard estimate is when is a smooth function of a sample mean, of dimension p say. When either or both and increase with n, I give conditions on their growth for the Edgeworth expansions for to remain valid: the eighth power of p times the sixth power of q cannot grow as fast as n. This holds for fixed if grows less than a power of n less than . This appears to be the first time when Edgeworth expansions have been given when not one, but two dimensions, are allowed to increase to ∞ with n. This gives two different pathways for allowing an increase in dimensionality. When , I give 5th order Edgeworth-Cornish-Fisher expansions for the standardized distribution and its quantiles of any smooth function of a sample mean of dimension , when is a power of n less than . However for the special case when this function is linear, there is no restriction whatever on how fast can increase! If also the components of the sample mean are independent, then these expansions are in powers of . I also give a method that greatly reduces the number of terms needed for the 2nd and 3rd order terms in the Edgeworth expansions, that is, for the 1st and 2nd order corrections to the CLTs. I also extend these results to the case where is a function of several independent sample means, each of dimension increasing with n, with total dimension p.
Full article
Open AccessArticle
Fuzzy Approach to Analysis of Investment Alternatives
by
Tamara Kyrylych and Yuriy Povstenko
Econometrics 2026, 14(2), 20; https://doi.org/10.3390/econometrics14020020 - 13 Apr 2026
Abstract
►▼
Show Figures
With significant market unsureness, “static” methods fail to account for economic uncertainty, may be less precise and, accordingly, less helpful when selecting investment alternatives. Methods that take into account the current economic situation and allow for adapting the alternative selection to external uncertainty
[...] Read more.
With significant market unsureness, “static” methods fail to account for economic uncertainty, may be less precise and, accordingly, less helpful when selecting investment alternatives. Methods that take into account the current economic situation and allow for adapting the alternative selection to external uncertainty are becoming more relevant. One of such methods is the fuzzy set theory. This article addresses the mathematical framework of such an approach for the economic analysis of investment project selection. A step-by-step scheme for implementing the fuzzy set method for investment projects is presented. Studies performed on the example of three investment alternatives give grounds for asserting the compatibility and feasibility of using two methods (the fuzzy set method may be partly based on the results of pairwise comparisons of experts according to the Saaty method) and confirmation or refutation of previous intuitive decisions of investors based on a comprehensive analysis of the criterion composition and the use of mathematical grounded technique.
Full article

Figure 1
Open AccessArticle
When Better Prediction Reduces Overlap: The Predictability Paradox in Propensity Score Matching with Machine Learning
by
Foong Soon Cheong
Econometrics 2026, 14(2), 19; https://doi.org/10.3390/econometrics14020019 - 1 Apr 2026
Abstract
►▼
Show Figures
Evidence from observational studies plays a central role in shaping public policy in health, education, and financial regulation, where randomized experiments are rarely feasible. Propensity score matching (PSM) is a widely used method to approximate fair comparisons between treatment and control groups. Incorporating
[...] Read more.
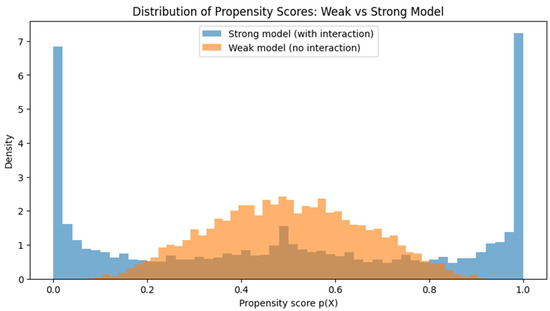
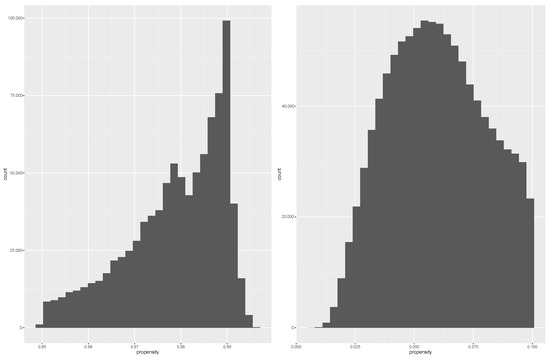
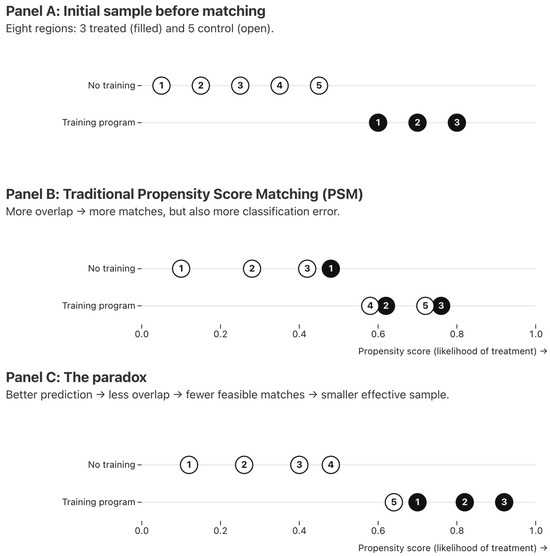
Evidence from observational studies plays a central role in shaping public policy in health, education, and financial regulation, where randomized experiments are rarely feasible. Propensity score matching (PSM) is a widely used method to approximate fair comparisons between treatment and control groups. Incorporating machine learning into the estimation of propensity scores can strengthen prediction and enhance the credibility of findings. However, stronger predictive models create a “predictability paradox”. As predictive accuracy improves, estimated propensity scores for treated and control units become more distinct when treatment assignment is strongly predictable from observed covariates, revealing limited overlap between groups. In the limit, near-perfect prediction produces near-complete separation between groups, rendering traditional matching infeasible and confining inference to a narrow subset of units near the boundary of the propensity score distribution, a setting analogous to a regression discontinuity design (RDD). Researchers thus face perverse incentives to use weaker models for statistically significant but spurious results. These dynamics jeopardize the reliability of evidence for policy. To safeguard decision-making, we propose a simple reform: require that studies using PSM disclose model error rates, including false positive and false negative rates, along with information on overlap and effective sample size.
Full article

Figure 1

Open AccessArticle
Propensity Score and the Double Robust Estimator in the Tails
by
Marilena Furno
Econometrics 2026, 14(2), 18; https://doi.org/10.3390/econometrics14020018 - 31 Mar 2026
Abstract
►▼
Show Figures
This study analyzes the performance of the double robust estimator to compute the treatment effect, not only at the mean but also in the tails in a Monte Carlo experiment. While previous research focused on shifting the regression component of the double robust
[...] Read more.
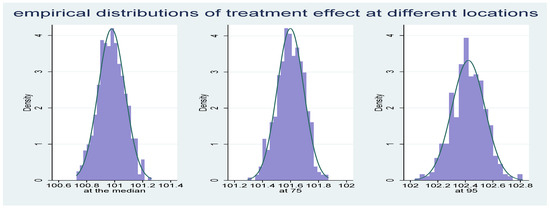
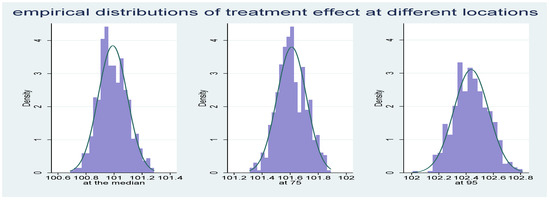
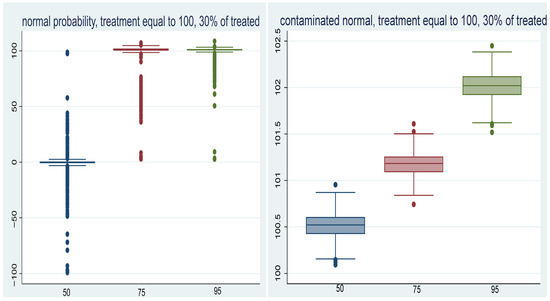
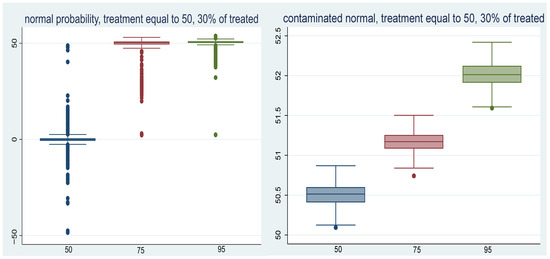
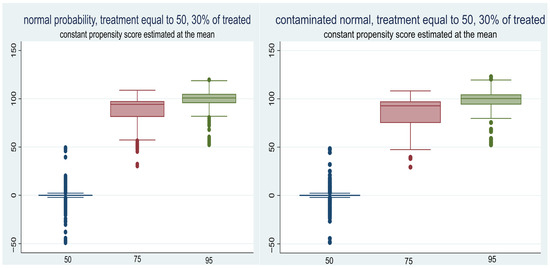
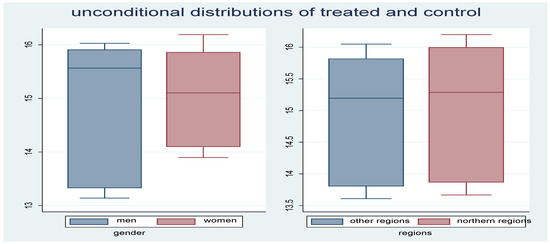
This study analyzes the performance of the double robust estimator to compute the treatment effect, not only at the mean but also in the tails in a Monte Carlo experiment. While previous research focused on shifting the regression component of the double robust estimator toward the tail, here we focus on the behavior of the propensity score away from the mean. Investigating the tails of the regression outcome allows for a closer look at the observations that are either highly or poorly responsive to treatment. Examining the tails of the propensity score distribution scrutinizes the observations with a higher or lower probability of being treated, which can be non-constant and even asymmetric. The goal is to assess the behavior of the double robust estimator when both components are computed away from the sample mean, in the tails of the treatment and control distributions. A case study on Italian education concludes the analysis. We find a positive double robust difference in higher education across regions, larger at the top location, due to the significant internal migration of qualified workers toward the northern regions. Women’s employment is higher for highly educated women, and gender has a significant impact: the analysis of the mismatch between probabilities and outcomes signals that women achieve higher education at rates exceeding their probabilities; they are more likely to exceed their predicted likelihood of attaining higher education.
Full article

Figure 1
Open AccessArticle
Nonparametric Autoregressive Copula Forecasting via Boundary-Reflected Kernel Estimation
by
Guilherme Colombo Soares and Márcio Poletti Laurini
Econometrics 2026, 14(2), 17; https://doi.org/10.3390/econometrics14020017 - 28 Mar 2026
Abstract
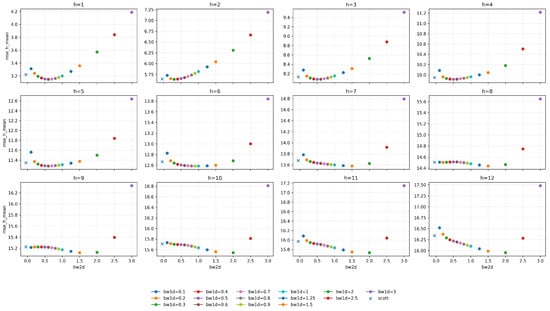
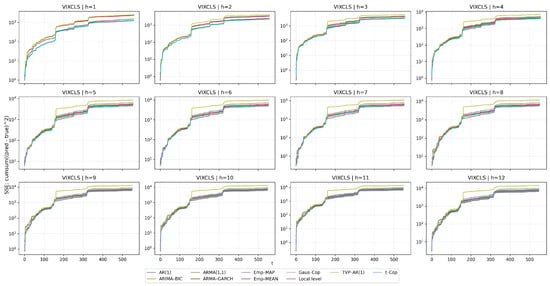
We propose a fully nonparametric empirical autoregressive copula framework for univariate time series, designed to capture nonlinear and asymmetric serial dependence while exactly preserving the empirical marginal distribution. The method decouples marginal behavior from temporal dependence by (i) constructing a shape-preserving empirical marginal
[...] Read more.
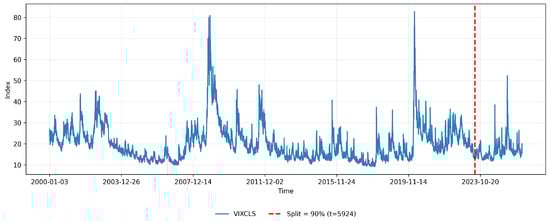
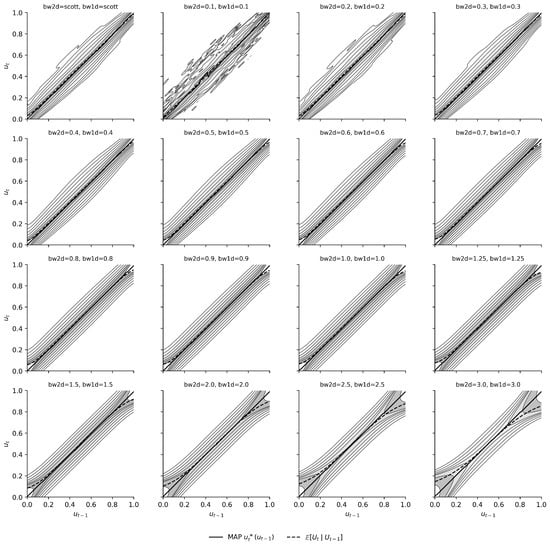
We propose a fully nonparametric empirical autoregressive copula framework for univariate time series, designed to capture nonlinear and asymmetric serial dependence while exactly preserving the empirical marginal distribution. The method decouples marginal behavior from temporal dependence by (i) constructing a shape-preserving empirical marginal via monotone interpolation and mapping observations to the unit interval, and (ii) estimating the lag–lead dependence through a nonparametric conditional AR(1) copula density on . To ensure stable estimation near the boundaries, we employ reflection-based kernel methods that mitigate edge effects and yield well-behaved conditional densities on the unit support. Forecasts are obtained from the implied conditional predictive density: we compute point forecasts either as conditional modes (maximum a posteriori) on the copula scale or as conditional means, and then back-transform exactly using the empirical quantile function, guaranteeing marginal fidelity and support-respecting predictions. Empirically, we evaluate the approach on three CBOE volatility indices (VIX, VXD, and RVX) and benchmark it against linear ARMA models, copula-based parametric competitors, and state-space/heteroskedasticity baselines (Local level, TVP–AR, and ARMA–GARCH). The results highlight that modeling the full conditional transition density nonparametrically can deliver competitive—often best or near-best—forecast accuracy across horizons, particularly in the presence of pronounced volatility regimes and asymmetric adjustments.
Full article
(This article belongs to the Special Issue Advancements in Macroeconometric Modeling and Time Series Analysis)
►▼
Show Figures

Figure 1
Open AccessArticle
Navigating Extreme Market Fluctuations: Asset Allocation Strategies in Developed vs. Emerging Economies
by
Lumengo Bonga-Bonga
Econometrics 2026, 14(1), 16; https://doi.org/10.3390/econometrics14010016 - 17 Mar 2026
Abstract
►▼
Show Figures
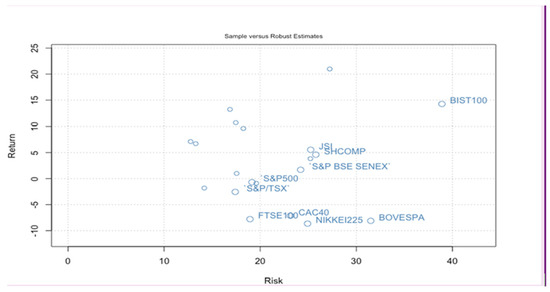
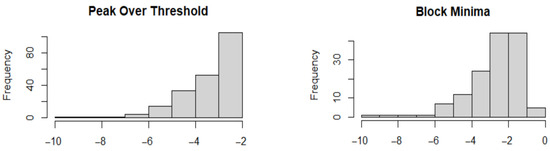
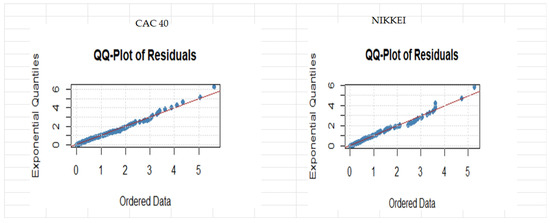
This paper examines how assets from emerging and developed stock markets can be efficiently allocated during periods of financial crisis by integrating traditional portfolio theory with Extreme Value Theory (EVT), using the Generalized Pareto Distribution (GPD) and Generalized Extreme Value (GEV) approaches to
[...] Read more.
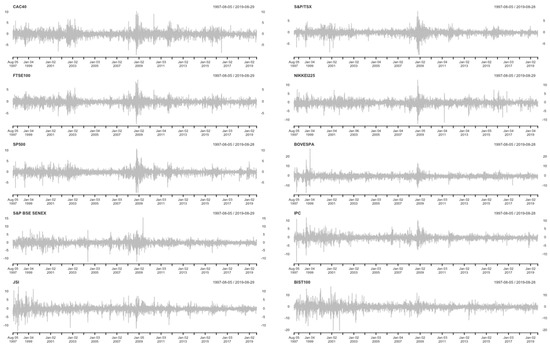
This paper examines how assets from emerging and developed stock markets can be efficiently allocated during periods of financial crisis by integrating traditional portfolio theory with Extreme Value Theory (EVT), using the Generalized Pareto Distribution (GPD) and Generalized Extreme Value (GEV) approaches to model tail risks. This study evaluates mean-variance portfolios constructed under each EVT framework and finds that portfolios based on GPD estimates consistently favour emerging market assets, which outperform both developed market and internationally diversified portfolios during extreme market conditions. In contrast, GEV-based portfolios indicate superior performance for developed market assets, highlighting the distinct behaviour of returns in the upper and lower tails of the distribution. These contrasting results reveal the unique nature of safe-haven characteristics associated with developed economies, the assets of which demonstrate greater stability and resilience during episodes of financial stress. By showing how tail-risk modelling alters optimal portfolio weights across market types, this paper contributes new evidence to the literature on crisis-informed asset allocation and offers practical insights for investors seeking robust diversification strategies under extreme market fluctuations.
Full article

Figure 1
Open AccessArticle
Double-Edged Sword of Diversification: Commodities and African Equity Indices in Robust vs. Optimal Portfolio Strategies
by
Anaclet K. Kitenge, John W. M. Mwamba and Jules C. Mba
Econometrics 2026, 14(1), 15; https://doi.org/10.3390/econometrics14010015 - 16 Mar 2026
Abstract
►▼
Show Figures
This study empirically investigates a central tension in quantitative finance: the divergence between theoretically optimal and robust portfolio construction under real-world estimation uncertainty. Using a dynamic, time-varying optimization framework, we compare the performance of three distinct strategies: the Maximum Sharpe ratio (P1), Minimum
[...] Read more.
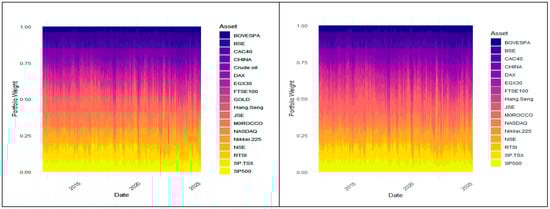
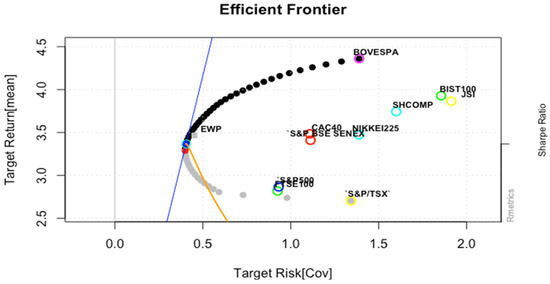
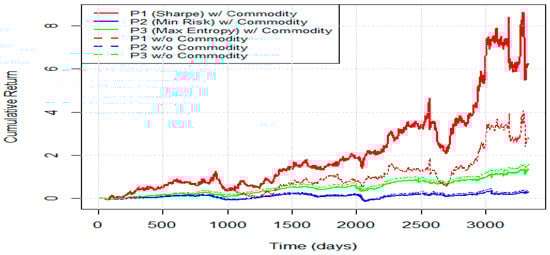
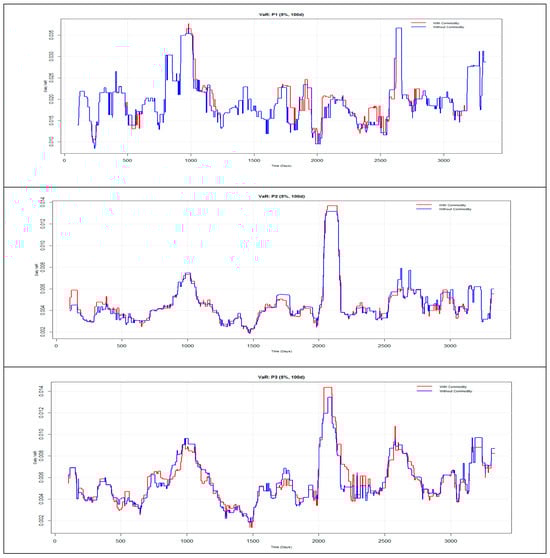
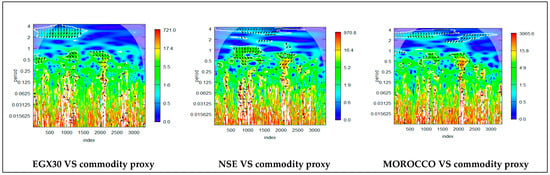
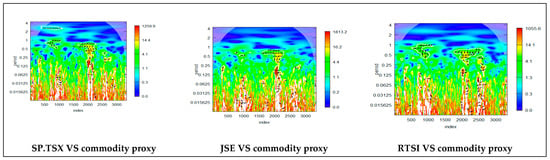
This study empirically investigates a central tension in quantitative finance: the divergence between theoretically optimal and robust portfolio construction under real-world estimation uncertainty. Using a dynamic, time-varying optimization framework, we compare the performance of three distinct strategies: the Maximum Sharpe ratio (P1), Minimum Variance (P2), and Maximum Entropy (P3) portfolios, with and without commodity proxy inclusion (gold and oil) in a multi-asset universe featuring prominent African equity indices. Our key finding challenges classical theory: the robust Maximum Entropy portfolio (P3) achieved superior realized risk-adjusted returns (Sharpe ratio: 1.164) compared to the theoretically optimal Maximum Sharpe portfolio (P1, Sharpe: 0.788). This result validates the “estimation-error maximization” critique, as P1’s performance was undermined by its sensitivity to noisy inputs. Conversely, the Minimum Variance portfolio (P2) successfully fulfilled its objective, achieving the lowest volatility (~5%) at the cost of modest returns (3.01–3.64%), illustrating the classic risk–return trade-off. Euler decomposition revealed that even this low-volatility portfolio exhibited significant concentration risk, with over 40% of its risk attributable to just three assets. The role of commodities is proven to be strategy contingent. They significantly enhanced returns and the Sharpe ratio for the aggressive P1 but were marginally detrimental to the robust P3. African market indices played specialized roles: Egypt and Nigeria acted as return drivers in P1, Morocco became a major risk contributor within the concentrated P2 strategy, and South Africa provided key diversification in the well-balanced P3. Ultimately, the study demonstrates that portfolio risk is determined more by asset concentration and diversification quality than by geographic labels, and that robust diversification methodologies outperform fragile theoretical optima in practice. We conclude that portfolio construction must prioritize robustness to estimation error and explicit risk-balancing to ensure stable, real-world performance.
Full article

Figure 1

Open AccessArticle
A New Functional Setting for Term Structure Modeling Using the Heath–Jarrow–Morton Framework
by
Michael Pokojovy, Ebenezer Nkum and Thomas M. Fullerton, Jr.
Econometrics 2026, 14(1), 14; https://doi.org/10.3390/econometrics14010014 - 11 Mar 2026
Abstract
►▼
Show Figures
The well-known Heath–Jarrow–Morton (HJM) framework provides a universal and efficacious instrument for modeling the stochastic evolution of an entire yield curve by explaining the interest rate dynamics in continuous time under no-arbitrage conditions. Existing implementations involve exponentially weighted function spaces as theoretical settings
[...] Read more.
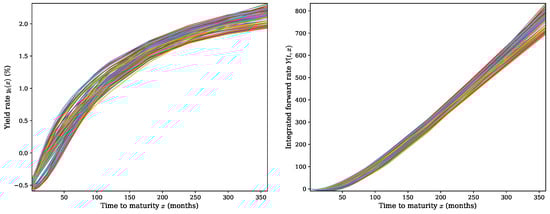
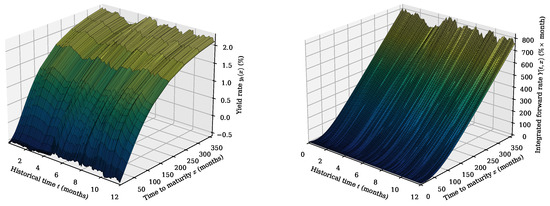
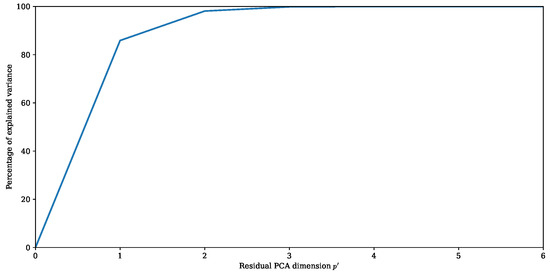
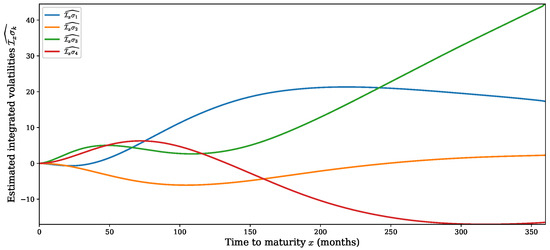
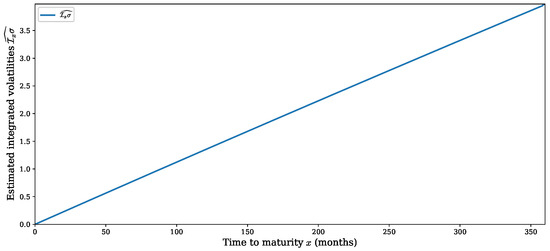
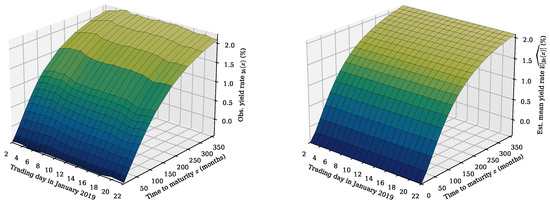
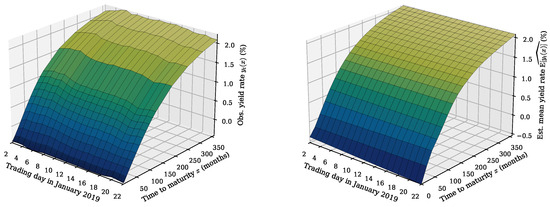
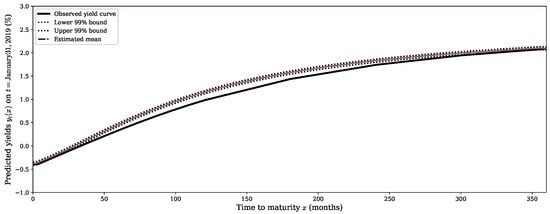
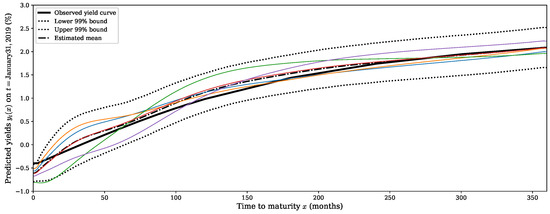
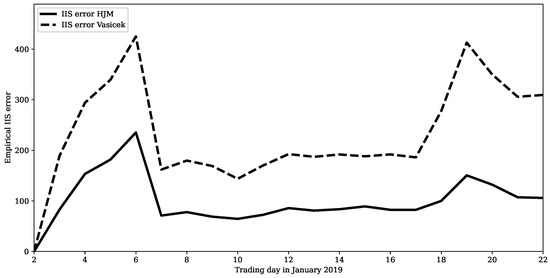
The well-known Heath–Jarrow–Morton (HJM) framework provides a universal and efficacious instrument for modeling the stochastic evolution of an entire yield curve by explaining the interest rate dynamics in continuous time under no-arbitrage conditions. Existing implementations involve exponentially weighted function spaces as theoretical settings for the former stochastic evolution. While the choice of weight can have a drastic effect on model calibration and subsequent forecasting, it cannot be estimated from market data and does not allow for any objective interpretation. The proposed approach does not have this shortcoming as it adopts a suitably designed unweighted function space. The HJM equation is discretized using a finite difference approach. The resulting semiparametric model is then calibrated on real-world yield data with a new type of functional principal component analysis (PCA)-based approach. Backtesting and benchmarking are conducted against the one-factor Vasicek model using historical data to illustrate its simulation capabilities for prediction and uncertainty quantification. Additionally, in contrast to widely studied US treasuries, negative interest rates are observed for AAA Euro Bonds during the sample period employed for this study. Accordingly, the framework allows for the possibility of negative yields.
Full article

Figure 1
Open AccessArticle
Analysis of School Absenteeism for Single- vs. Two-Parent Families: A Finite Mixture Roy Approach
by
Murat K. Munkin and David Zimmer
Econometrics 2026, 14(1), 13; https://doi.org/10.3390/econometrics14010013 - 9 Mar 2026
Abstract
This paper analyzes factors affecting school absenteeism due to an injury or illness among the US school student population between 6 and 15 years of age. The number of missed school days displays overdispersion and is modeled using the Finite Mixture Roy (FMR)
[...] Read more.
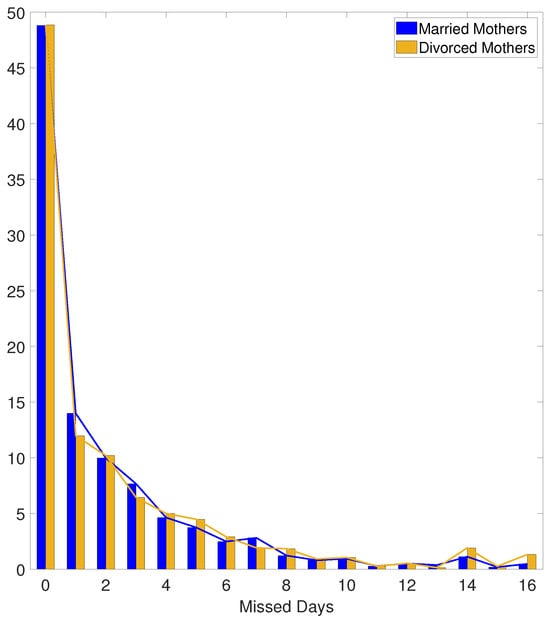
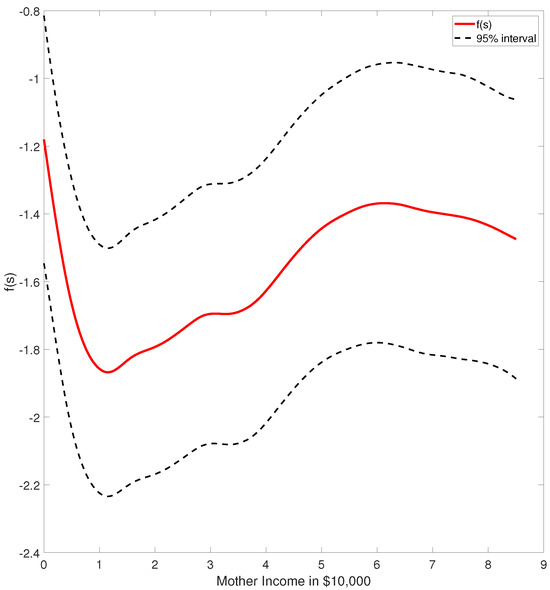
This paper analyzes factors affecting school absenteeism due to an injury or illness among the US school student population between 6 and 15 years of age. The number of missed school days displays overdispersion and is modeled using the Finite Mixture Roy (FMR) model for count variables. The married/single parent family status (treatment) is potentially endogenous to the dependent variable (missed days). The Roy structure controls observed heterogeneity due to the mother’s marital status. Finite mixtures are intended to control unobserved heterogeneity due to healthy and unhealthy children in the sample. This approach facilitates identification of latent subpopulations in which treatment and marginal effects are relatively homogeneous. The model also incorporates two application-driven extensions. First, probabilities of the latent components are modeled as functions of regressors. Secondly, the mother’s income affects treatment nonparametrically. The FMR model is estimated with two latent components in each state, corresponding to healthy and unhealthy students. The results indicate that maternal marital status decreases annual missed school days by approximately 13 percent for a randomly drawn child; however, this increases absenteeism by about 14 percent among families that self-select into two-parent households, which is evidence of adverse selection.
Full article
(This article belongs to the Special Issue Innovations in Bayesian Econometrics: Theory, Techniques, and Economic Analysis)
►▼
Show Figures

Figure 1
Open AccessEditor’s ChoiceArticle
Using Subspace Algorithms for the Estimation of Linear State Space Models for Over-Differenced Processes
by
Dietmar Bauer
Econometrics 2026, 14(1), 12; https://doi.org/10.3390/econometrics14010012 - 28 Feb 2026
Abstract
►▼
Show Figures
Subspace algorithms like canonical variate analysis (CVA) are regression-based methods for the estimation of linear dynamic state space models. They have been shown to deliver accurate (consistent and asymptotically equivalent to quasi-maximum likelihood estimation using the Gaussian likelihood) estimators for stably invertible stationary
[...] Read more.
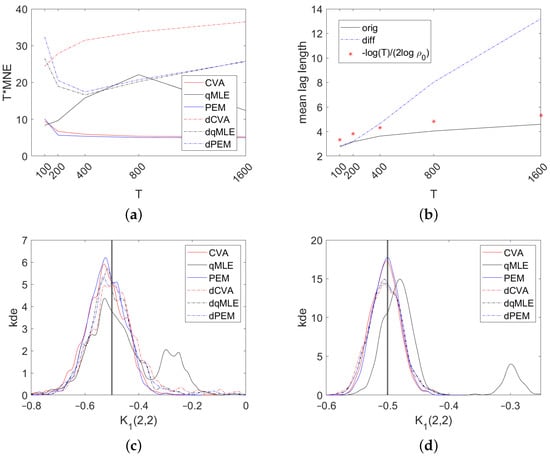
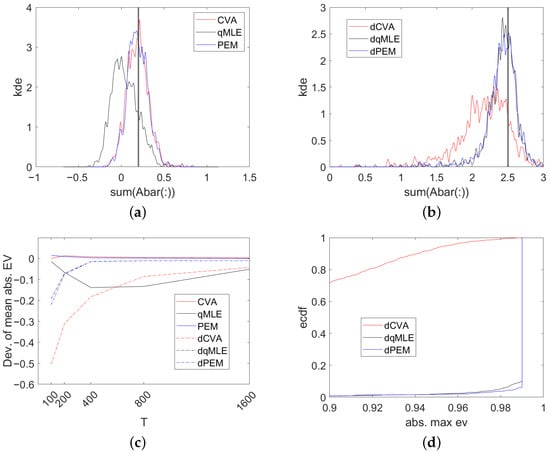
Subspace algorithms like canonical variate analysis (CVA) are regression-based methods for the estimation of linear dynamic state space models. They have been shown to deliver accurate (consistent and asymptotically equivalent to quasi-maximum likelihood estimation using the Gaussian likelihood) estimators for stably invertible stationary autoregressive moving average (ARMA) processes. These results use the assumption that there are no zeros of the spectral density on the unit circle corresponding to the state space system. In this technical study, we consider vector processes made stationary by applying differencing to all variables, ignoring potential co-integrating relations. This leads to spectral zeros violating the above mentioned assumptions. We show consistency for the CVA estimators, closing a gap in the literature. However, a simulation exercise shows that over-differencing (while leading to consistent estimation of the transfer function) also complicates inference for CVA estimators, not just maximum likelihood-based estimators. This is also demonstrated in a real-world data example. The result also applies to seasonal differencing. The present paper hence suggests working with original data, not working in differences.
Full article

Figure 1
Open AccessEditor’s ChoiceArticle
Graph Attention Networks in Exchange Rate Forecasting
by
Joanna Landmesser-Rusek and Arkadiusz Orłowski
Econometrics 2026, 14(1), 11; https://doi.org/10.3390/econometrics14010011 - 25 Feb 2026
Abstract
►▼
Show Figures
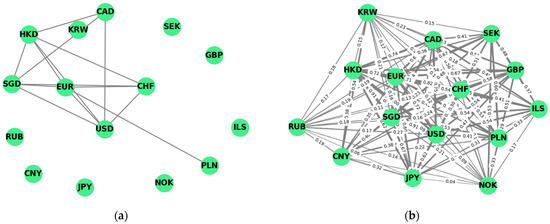
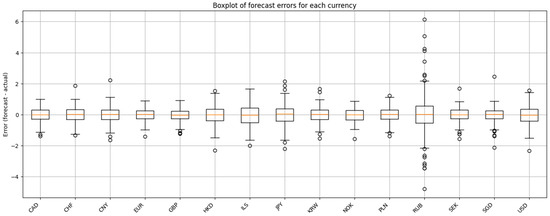
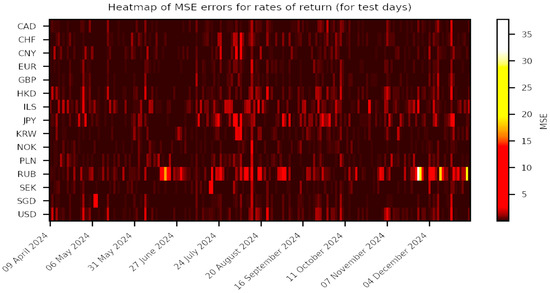
Exchange rate forecasting is an important issue in financial market analysis. Currency rates form a dynamic network of connections that can be efficiently modeled using graph neural networks (GNNs). The key mechanism of GNNs is the message passing between nodes, allowing for better
[...] Read more.
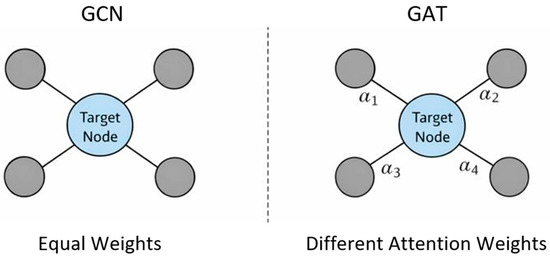
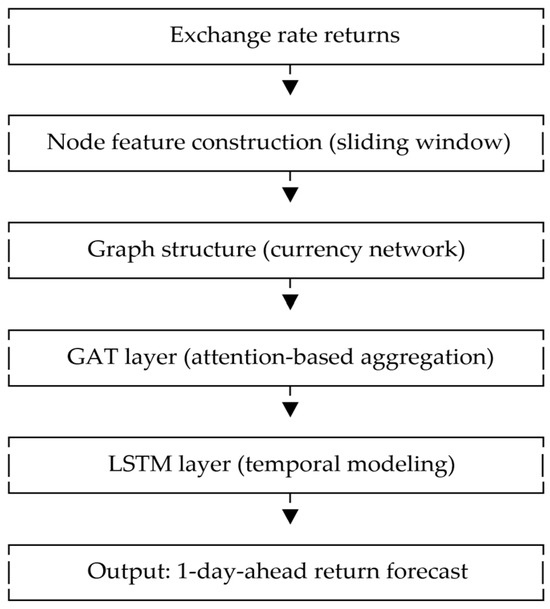
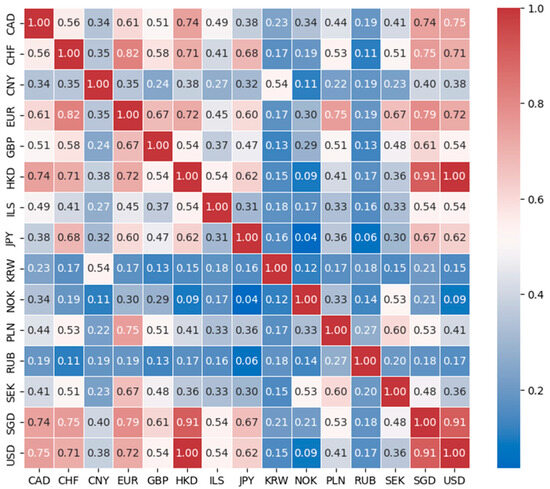
Exchange rate forecasting is an important issue in financial market analysis. Currency rates form a dynamic network of connections that can be efficiently modeled using graph neural networks (GNNs). The key mechanism of GNNs is the message passing between nodes, allowing for better modeling of currency interactions. Each node updates its representation by aggregating features from its neighbors and combining them with its own. In convolutional graph neural networks (GCNs), all neighboring nodes are treated equally, but in reality, some may have a greater influence than others. To account for this changing importance of neighbors, graph attention networks (GAT) have been introduced. The aim of the study was to evaluate the effectiveness of GAT in forecasting exchange rates. The analysis covered time series of major world currencies from 2020 to 2024. The forecasting results obtained using GAT were compared with those obtained from benchmark models such as ARIMA, GARCH, MLP, GCN, and LSTM-GCN. The study showed that GAT networks outperform numerous methods. The results may have practical applications, supporting investors and analysts in decision-making.
Full article

Figure 1
Open AccessArticle
Application of Resolution Regression and Resolution Graphs in Evaluating Probability Forecasts Generated Using Binary Choice Models
by
Senarath Dharmasena, David A. Bessler and Oral Capps, Jr.
Econometrics 2026, 14(1), 10; https://doi.org/10.3390/econometrics14010010 - 24 Feb 2026
Abstract
►▼
Show Figures
Binary choice models are widely used in econometric modeling when the dependent variable corresponds to discrete outcomes. With appropriate decision rules, these models provide predictions of binary choices generated from predicted probabilities. The accuracy of these predictions in terms of classifying probabilities to
[...] Read more.
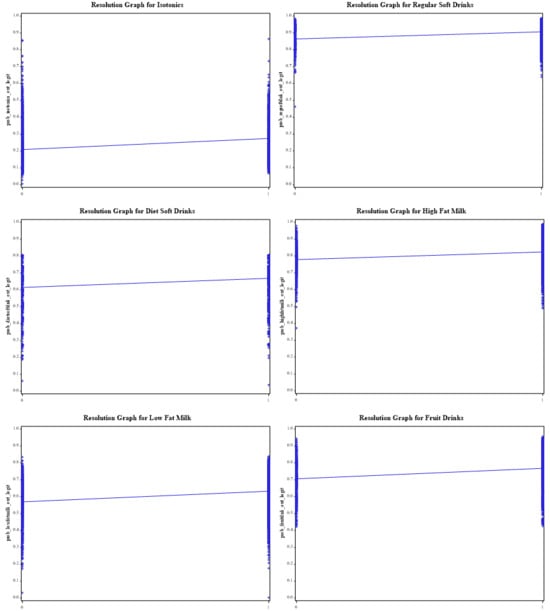
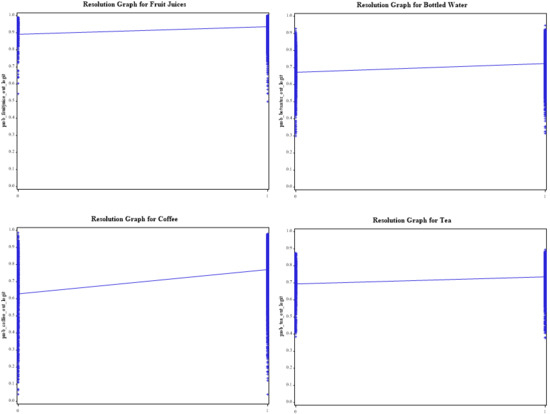
Binary choice models are widely used in econometric modeling when the dependent variable corresponds to discrete outcomes. With appropriate decision rules, these models provide predictions of binary choices generated from predicted probabilities. The accuracy of these predictions in terms of classifying probabilities to events that occurred versus those that did not is a key issue. The use of expectation-prediction success at present is the standard method used to assess the accuracy of these predictions. However, this method is limited in its ability to correctly classify probabilities in the absence of appropriate predetermined cut-off levels. We propose alternative methods to classify probabilities generated through binary choice models, namely resolution graphs and resolution regressions that measure the ability to sort predicted probabilities against observed outcomes. Using probabilities generated from the use of logit models applied to purchasing decisions of various non-alcoholic beverages made by U.S. households, we compare probability sorting power using expectation-prediction success as well as resolution graphs and resolution regressions. Based on expectation-prediction success, the logit models performed better at classifying outcomes related to purchasing isotonic drinks, regular soft drinks, diet drinks, bottled water, and tea. Based on resolution regressions, the null hypothesis of perfect sorting of probabilities was rejected for all non-alcoholic beverages. Although the logit models generated upward-sloping resolution graphs as expected, they were relatively flat compared to the 45-degree perfect sorting line. Going forward, we recommend using resolution regression and resolution graphs to capture sorting of probabilities in addition to the conventional metrics used in ascertaining the ability of binary choice models to predict out-of-sample behavior.
Full article

Figure 1
Open AccessArticle
Econometric Analysis and Forecasts on Exports of Emerging Economies from Central and Eastern Europe
by
Liviu Popescu, Mirela Găman, Laurențiu Stelian Mihai, Cristian Ovidiu Drăgan, Daniel Militaru and Ion Buligiu
Econometrics 2026, 14(1), 9; https://doi.org/10.3390/econometrics14010009 - 14 Feb 2026
Abstract
►▼
Show Figures
This study examines the evolution, heterogeneity, and short-term prospects of export performance in seven Central and Eastern European (CEE) economies—Croatia, Czech Republic, Hungary, Poland, Romania, Bulgaria, and Slovakia—over the period 1995–2024. Using annual World Bank data, exports are modeled as a share of
[...] Read more.
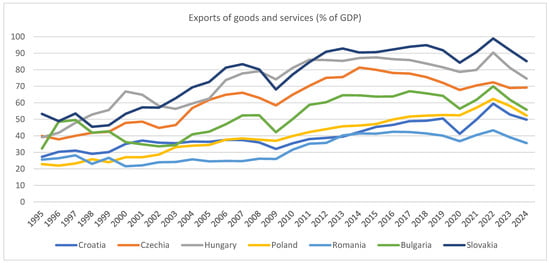
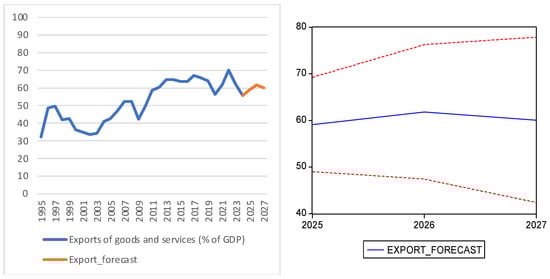
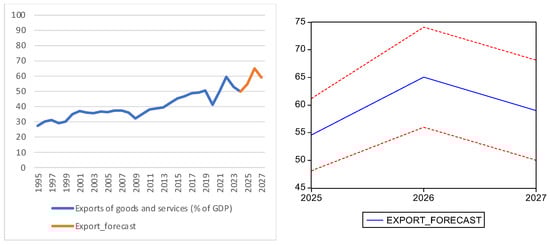
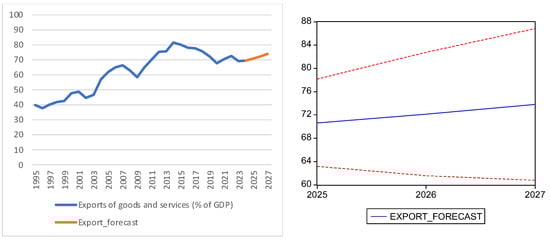
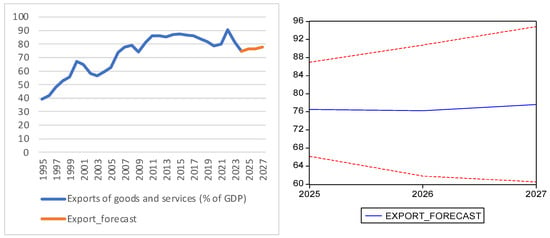
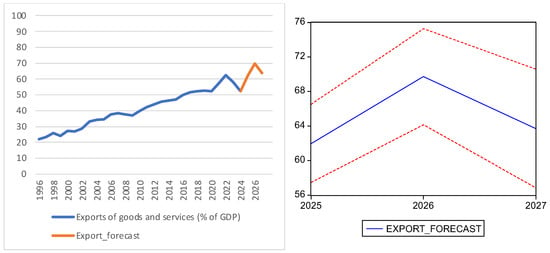
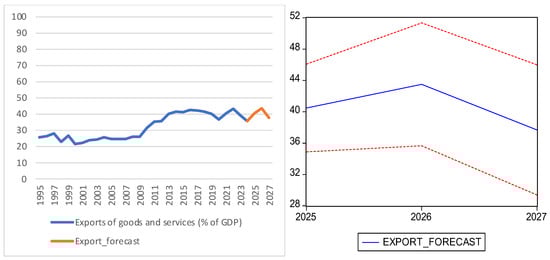
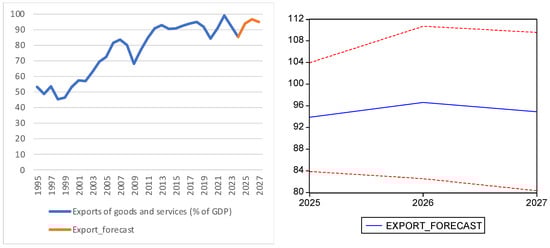
This study examines the evolution, heterogeneity, and short-term prospects of export performance in seven Central and Eastern European (CEE) economies—Croatia, Czech Republic, Hungary, Poland, Romania, Bulgaria, and Slovakia—over the period 1995–2024. Using annual World Bank data, exports are modeled as a share of GDP to ensure cross-country comparability and to capture differences in trade dependence. The analysis combines descriptive and inferential statistics with Augmented Dickey–Fuller tests, non-parametric comparisons, Granger causality analysis, and country-specific ARIMA models to investigate export dynamics, the role of foreign direct investment (FDI), and future export trajectories. The results reveal a common long-term upward trend in export intensity across all countries, driven by European integration and structural transformation, but with pronounced cross-country differences in export dependence and volatility. Highly open economies such as Slovakia, Hungary, and the Czech Republic exhibit strong export performance alongside greater exposure to external shocks, while larger domestic markets such as Poland and Romania display lower export intensity and greater stabilization. Granger causality tests indicate that FDI contributes to export growth in several economies, often with multi-year lags, highlighting the importance of absorptive capacity and institutional quality in translating investment inflows into export competitiveness. ARIMA-based forecasts for 2025–2027 suggest continued export expansion and relative stabilization despite recent global disruptions. This study’s primary contribution lies in integrating comparative export analysis, causality testing, and short-term forecasting within a unified econometric framework, offering policy-relevant insights into export-led growth and economic convergence in post-transition European economies.
Full article

Figure 1
Open AccessEditor’s ChoiceArticle
Posterior Probabilities of Dominance for Wealth Distributions
by
William Griffiths and Duangkamon Chotikapanich
Econometrics 2026, 14(1), 8; https://doi.org/10.3390/econometrics14010008 - 12 Feb 2026
Abstract
Probability distributions, which are typically used to describe income distributions, are not suitable to describe a population’s distribution of wealth because of the existence of negative observations and a large concentration of values close to zero. To overcome these problems, we describe how
[...] Read more.
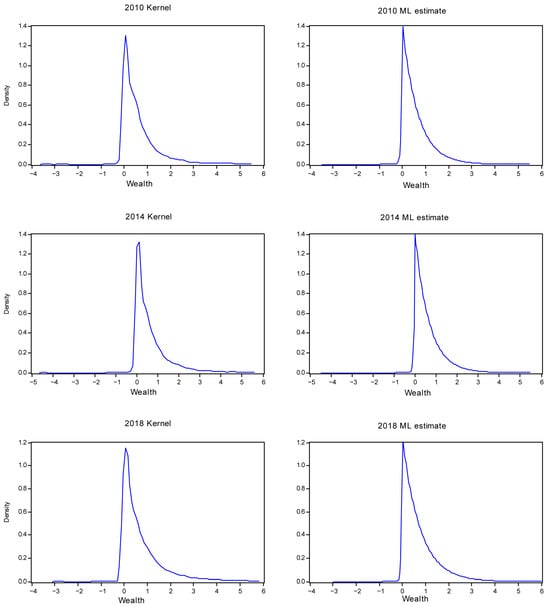
Probability distributions, which are typically used to describe income distributions, are not suitable to describe a population’s distribution of wealth because of the existence of negative observations and a large concentration of values close to zero. To overcome these problems, we describe how the asymmetric Laplace distribution can be used for modelling wealth distributions and illustrate how it can be used to compute the posterior probabilities of first- and second-order stochastic dominance. Stochastic dominance concepts are useful for comparing wealth distributions and assessing whether changes in welfare have increased or decreased welfare in society. We use three distributions to make two such comparisons. The results are such that, in one comparison, one distribution clearly dominates the other. There is more uncertainty about dominance in the other comparison, with no dominance being the most likely outcome.
Full article
(This article belongs to the Special Issue Innovations in Bayesian Econometrics: Theory, Techniques, and Economic Analysis)
►▼
Show Figures

Figure 1
Open AccessArticle
Social Security Transfers and Fiscal Sustainability in Turkey: Evidence from 1984–2024
by
Huriye Gonca Diler, Nurgül E. Barın, Ercan Özen and Simon Grima
Econometrics 2026, 14(1), 7; https://doi.org/10.3390/econometrics14010007 - 31 Jan 2026
Abstract
Social security systems constitute a structurally significant component of public finance in developing economies and often generate persistent fiscal pressures through budgetary transfers. Demographic transformation, widespread informality in labor markets, and weaknesses in contribution-based financing increase the dependence of social security systems on
[...] Read more.
Social security systems constitute a structurally significant component of public finance in developing economies and often generate persistent fiscal pressures through budgetary transfers. Demographic transformation, widespread informality in labor markets, and weaknesses in contribution-based financing increase the dependence of social security systems on public resources. The objective of this study is to examine whether budget transfers to the social security system affect fiscal sustainability in Turkey by analyzing their relationship with the budget deficit and the public sector borrowing requirement. The analysis employs annual data for Turkey covering the period of 1984–2024. A comprehensive time-series econometric framework is adopted, incorporating conventional and structural-break unit root tests, the ARDL bounds testing approach with error correction modeling, and the Toda–Yamamoto causality method. The empirical findings provide evidence of a stable long-run relationship among the variables. The results indicate that social security budget transfers exert a statistically significant and persistent effect on the public sector borrowing requirement, while no direct long-run effect on the headline budget deficit is detected. Causality results further confirm that fiscal pressures associated with social security financing materialize primarily through borrowing dynamics rather than short-term budgetary imbalances. By explicitly modelling social security budget transfers as an independent fiscal channel over a long historical horizon, this study contributes to the literature by offering new empirical insights into the fiscal sustainability implications of social security financing in Turkey. The findings also provide policy-relevant evidence for developing economies facing similar institutional, demographic, and fiscal challenges.
Full article
Open AccessEditor’s ChoiceArticle
Binance USD Delisting and Stablecoins Repercussions: A Local Projections Approach
by
Papa Ousseynou Diop and Julien Chevallier
Econometrics 2026, 14(1), 6; https://doi.org/10.3390/econometrics14010006 - 16 Jan 2026
Abstract
►▼
Show Figures
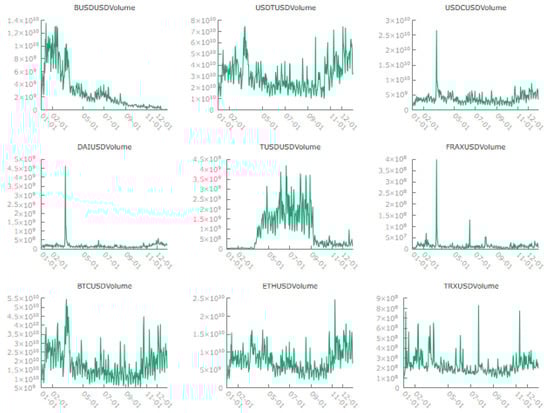
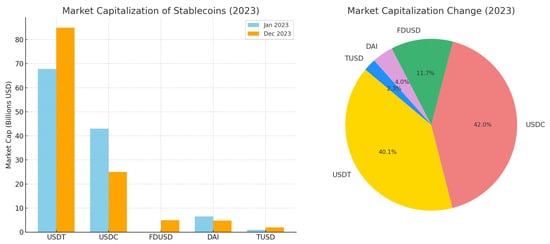
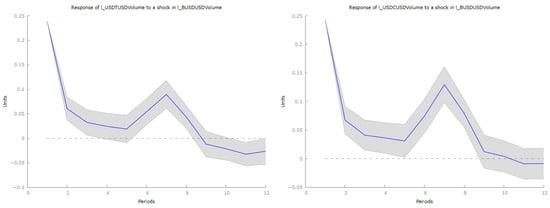
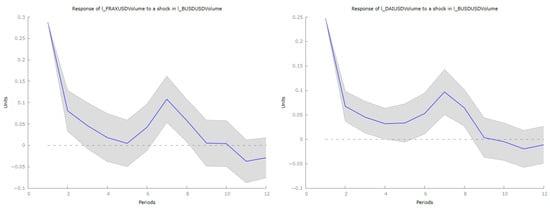
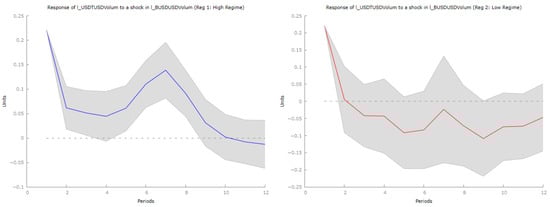
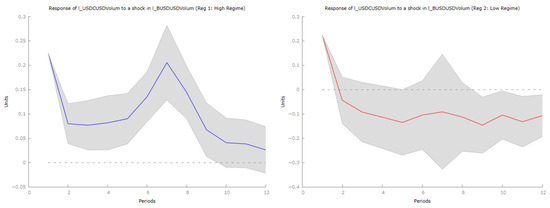
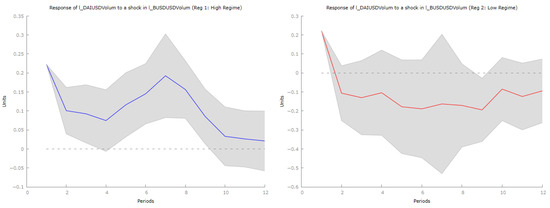
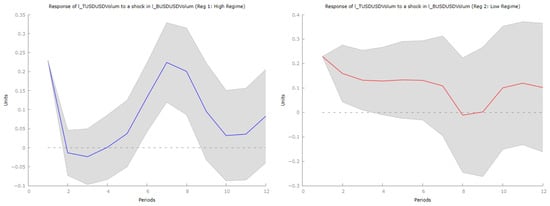
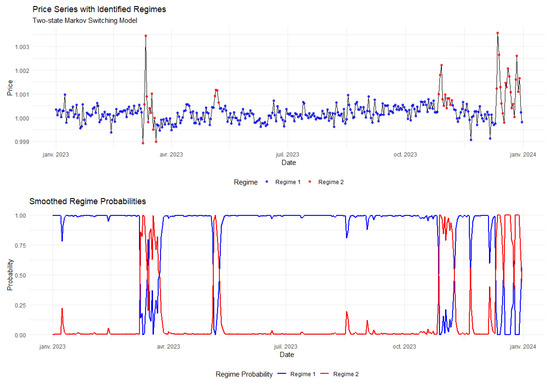
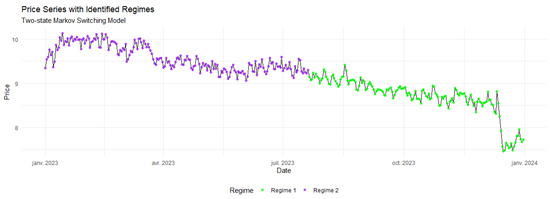
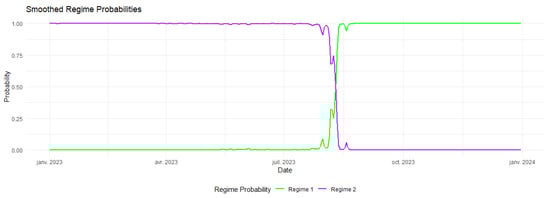
The delisting of Binance USD (BUSD) constitutes a major regulatory intervention in the stablecoin market and provides a unique opportunity to examine how targeted regulation affects liquidity allocation, market concentration, and short-run systemic risk in crypto-asset markets. Using daily data for 2023 and
[...] Read more.
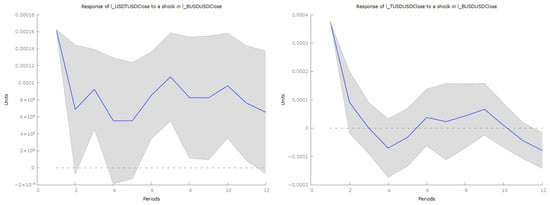
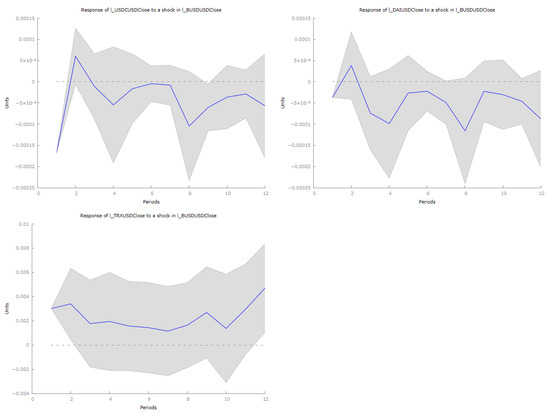
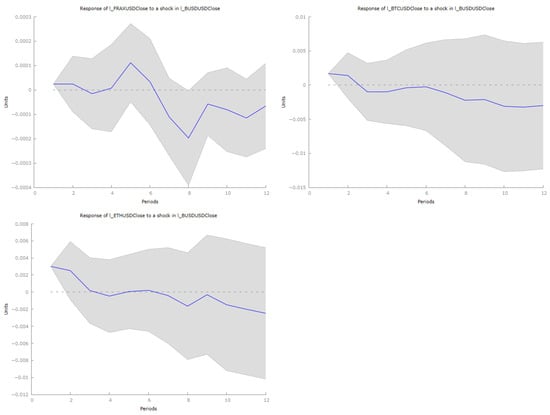
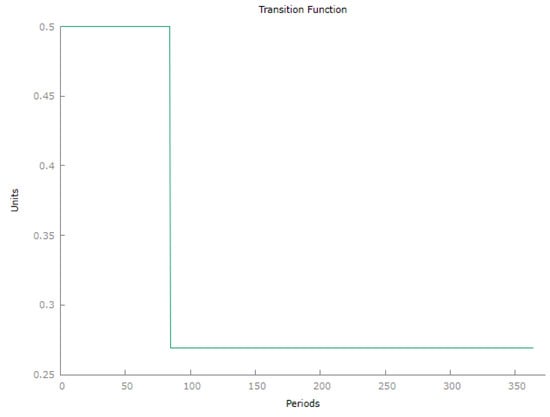
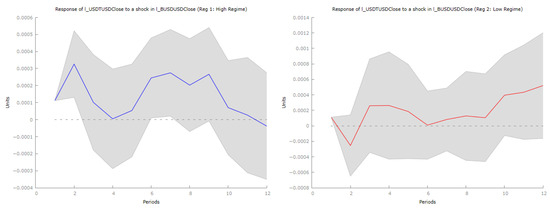
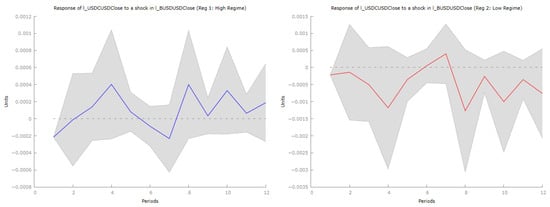
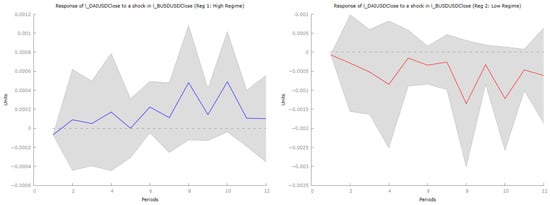
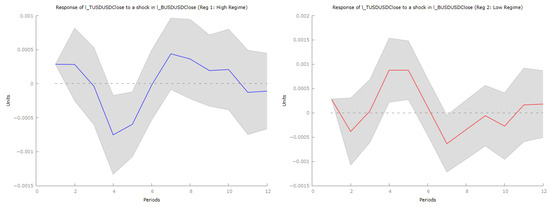
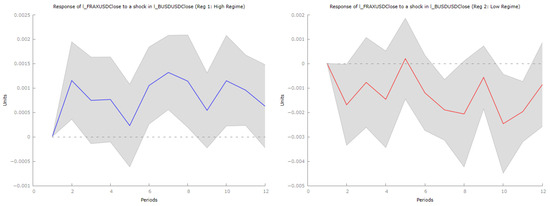
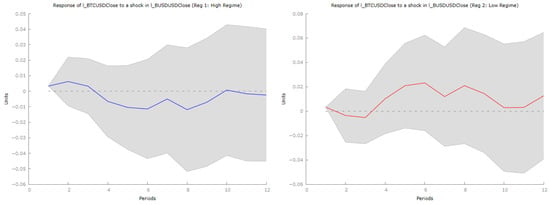
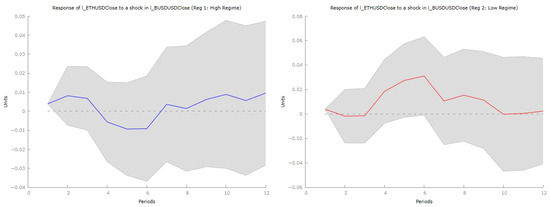
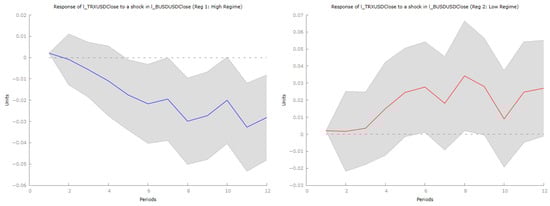
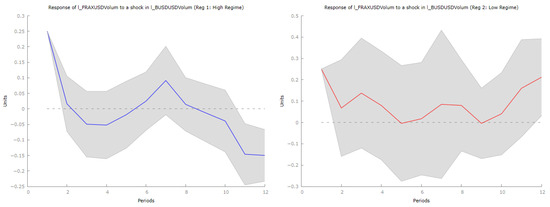
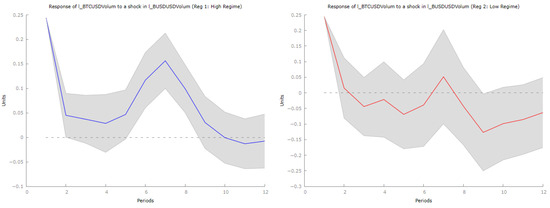
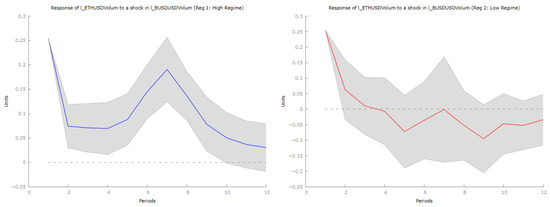
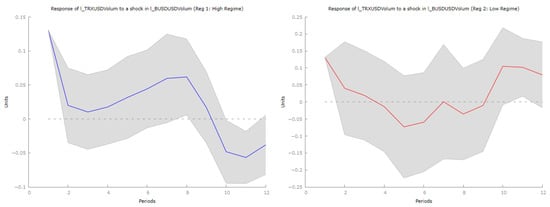
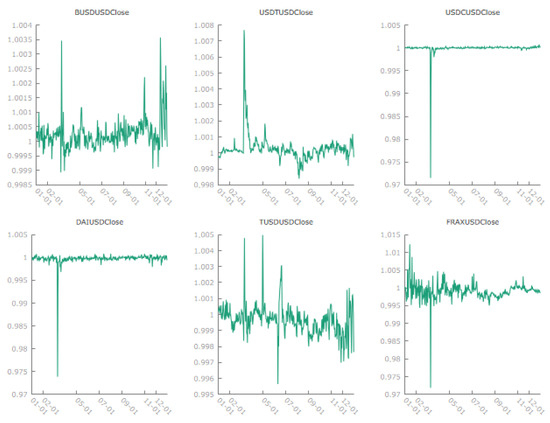
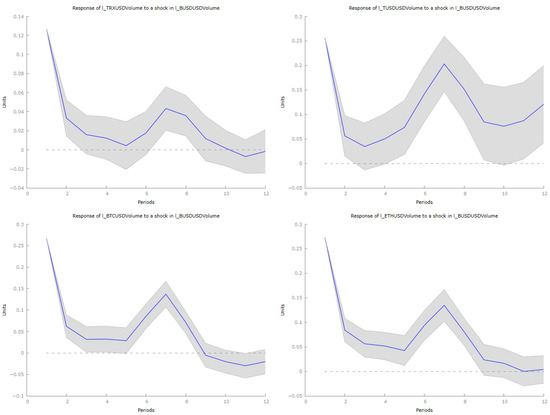
The delisting of Binance USD (BUSD) constitutes a major regulatory intervention in the stablecoin market and provides a unique opportunity to examine how targeted regulation affects liquidity allocation, market concentration, and short-run systemic risk in crypto-asset markets. Using daily data for 2023 and a linear and nonlinear Local Projections event-study framework, this paper analyzes the dynamic market responses to the BUSD delisting across major stablecoins and cryptocurrencies. The results show that liquidity displaced from BUSD is reallocated primarily toward USDT and USDC, leading to a measurable increase in stablecoin market concentration, while decentralized and algorithmic stablecoins absorb only a limited share of the shock. At the same time, Bitcoin and Ethereum experience temporary liquidity contractions followed by a relatively rapid recovery, suggesting conditional resilience of core crypto-assets. Overall, the findings document how a regulatory-induced exit of a major stablecoin reshapes short-run market dynamics and concentration patterns, highlighting potential trade-offs between regulatory enforcement and market structure. The paper contributes to the literature by providing the first empirical analysis of the BUSD delisting and by illustrating the usefulness of Local Projections for studying regulatory shocks in cryptocurrency markets.
Full article

Figure 1
Highly Accessed Articles
Latest Books
E-Mail Alert
News
Topics
Topic in
Econometrics, Economies, JRFM, Forecasting
Modern Challenges and Innovations in Financial Econometrics
Topic Editors: Agnieszka Szmelter-Jarosz, Hamed NozariDeadline: 31 August 2027

Conferences
Special Issues
Special Issue in
Econometrics
Labor Market Dynamics and Wage Inequality: Econometric Models of Income Distribution
Guest Editor: Marc K. ChanDeadline: 25 June 2026
Special Issue in
Econometrics
Advancements in Macroeconometric Modeling and Time Series Analysis
Guest Editor: Julien ChevallierDeadline: 31 October 2026
Special Issue in
Econometrics
Innovations in Bayesian Econometrics: Theory, Techniques, and Economic Analysis
Guest Editor: Deborah GefangDeadline: 31 May 2027