Are Clean Eating Blogs a Source of Healthy Recipes? A Comparative Study of the Nutrient Composition of Foods with and without Clean Eating Claims


Abstract
:1. Introduction
2. Materials and Methods
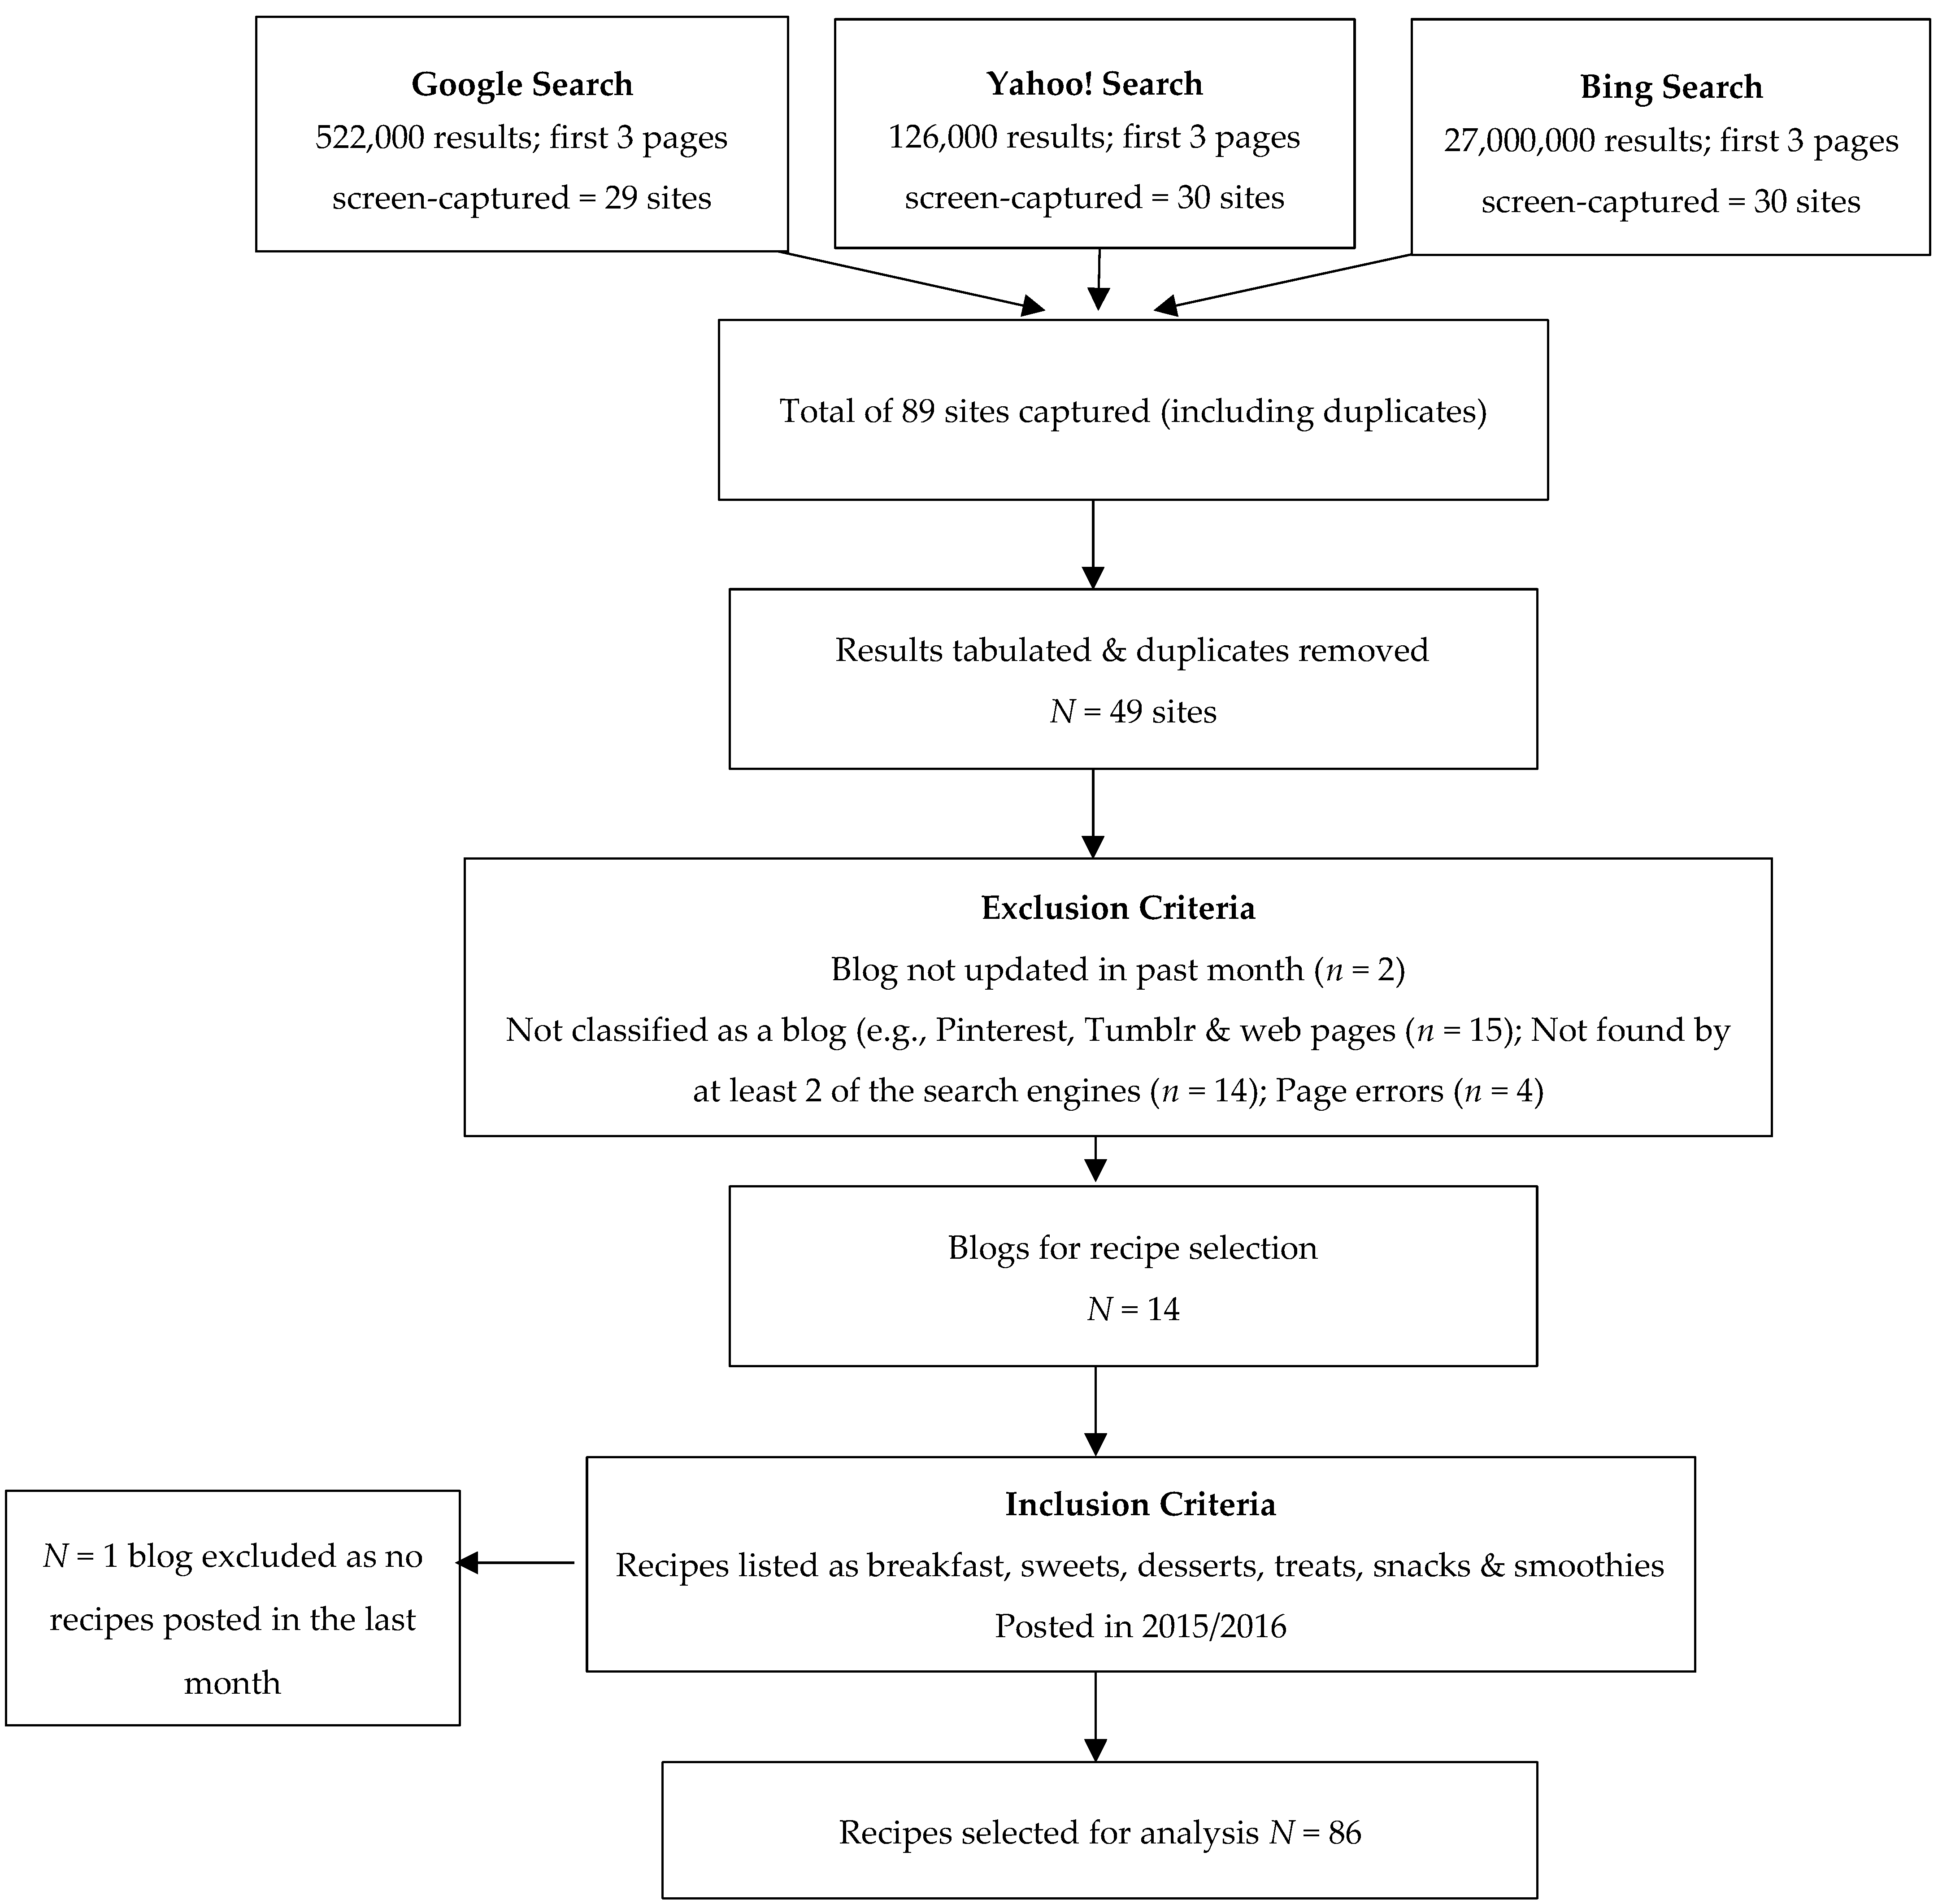
2.1. Selection of Clean Eating Blogs and Recipes
2.2. Selection of Control Recipes without Clean Eating Claims
2.3. Nutritional Content of Included Recipes
2.4. Statistical Analysis
3. Results
3.1. Nutrient Content of Clean Eating Recipes According to Food Category
3.2. Comparison of Clean Eating Recipes with Control Recipes without Clean Eating Claims
3.3. Evaluation of Foods Using WHO Guidelines for Chronic Disease Prevention and FSA Traffic Light Criteria
4. Discussion
5. Conclusions
Supplementary Materials
Author Contributions
Acknowledgments
Conflicts of Interest
References
- McCartney, M. Clean eating and the cult of healthism. BMJ 2016. [Google Scholar] [CrossRef]
- Hardman, I.; Prendergast, L. Not Just a Fad: The Dangerous Reality of ‘Clean Eating’. Available online: https://www.spectator.co.uk/2015/08/why-clean-eating-is-worse-than-just-a-silly-fad/ (accessed on 28 March 2018).
- Bissonnette-Maheux, V.; Provencher, V.; Lapointe, A.; Dugrenier, M.; Dumas, A.-A.; Pluye, P.; Straus, S.; Gagnon, M.-P.; Desroches, S. Exploring women’s beliefs and perceptions about healthy eating blogs: A qualitative study. J. Med. Internet Res. 2015, 17. [Google Scholar] [CrossRef] [PubMed]
- Schneider, E.P.; McGovern, E.E.; Lynch, C.L.; Brown, L.S. Do food blogs serve as a source of nutritionally balanced recipes? An analysis of 6 popular food blogs. J. Nutr. Educ. Behav. 2013, 45, 696–700. [Google Scholar] [CrossRef] [PubMed]
- Allen, M.; Dickinson, K.M.; Prichard, I. The dirt on clean eating: A cross sectional analysis of dietary intake, restrained eating and opinions about clean eating among women. Nutrients 2018. [Google Scholar] [CrossRef] [PubMed]
- Ho, H.-Y.; Chang Chien, P.-H. Influence of message trust in online word-of-mouth on consumer behavior–by the example of food blog. Available online: https://ieeexplore.ieee.org/document/5559850/ (accessed on 1 February 2016).
- Buis, L.R.; Carpenter, S. Health and medical blog content and its relationships with blogger credentials and blog host. Health Commun. 2009, 24, 703–710. [Google Scholar] [CrossRef] [PubMed]
- Lynch, M. Healthy habits or damaging diets: An exploratory study of a food blogging community. Ecol. Food Nutr. 2010, 49, 316–335. [Google Scholar] [CrossRef] [PubMed]
- Stein, K. Severely restricted diets in the absence of medical necessity: The unintended consequences. J. Acad. Nutr. Diet. 2014, 114, 986–994. [Google Scholar] [CrossRef] [PubMed]
- Dunn, T.M.; Bratman, S. On orthorexia nervosa: A review of the literature and proposed diagnostic criteria. Eat. Behav. 2016, 21, 11–17. [Google Scholar] [CrossRef] [PubMed]
- Bratman, S.; Knight, D. Health food junkies: Orthorexia nervosa: Overcoming the obsession with healthful eating. JAMA 2001, 285, 2255–2256. [Google Scholar]
- Hunter, J.D.; Crudo, D.F. Unintended consequences of restrictive diets: Two case reports and a review of orthorexia. Clin. Pediatr. (Phila) 2018. [Google Scholar] [CrossRef] [PubMed]
- Ostry, A.; Young, M.L.; Hughes, M. The quality of nutritional information available on popular websites: A content analysis. Health Educ. Res. 2008, 23, 648–655. [Google Scholar] [CrossRef] [PubMed]
- WHO. Population Nutrient Intake Goals for Preventing Diet-Related Chronic Diseases. Available online: http://www.who.int/dietphysicalactivity/publications/trs916/en/gsfao_overall.pdf (accessed on 28 March 2018).
- Food Standards Agency. Guide to Creating a Front of Pack (Fop) Nutrition Label for Pre-Packed Products Sold through Retail Outlets. Available online: https://www.gov.uk/government/uploads/system/uploads/attachment_data/file/300886/2902158_FoP_Nutrition_2014.pdf (accessed on 18 September 2018).
- Boepple, L.; Thompson, J.K. A content analysis of healthy living blogs: Evidence of content thematically consistent with dysfunctional eating attitudes and behaviors. Int. J. Eat. Disord. 2014, 47, 362–367. [Google Scholar] [CrossRef] [PubMed]
- Google. Facts about Google and Competition. Available online: http://web.archive.org/web/20171101174239/https://www.google.com/search/howsearchworks/ (accessed on 11 January 2016).
- Howard, S.; Adams, J.; White, M. Nutritional content of supermarket ready meals and recipes by television chefs in the United Kingdom: Cross sectional study. BMJ 2012. [Google Scholar] [CrossRef] [PubMed]
- Trattner, C.; Elsweiler, D.; Howard, S. Estimating the healthiness of internet recipes: A cross-sectional study. Front. Public Health. 2017. [Google Scholar] [CrossRef] [PubMed]
- Goldberg, J.P.; Tanskey, L.A.; Sanders, E.A.; Edge, M.S. The IFIC Foundation Food & Health Survey 2015: 10-Year trends and emerging issues. J. Acad. Nutr. Diet. 2017, 117, 355–360. [Google Scholar] [PubMed]
- Howarth, N.C.; Saltzman, E.; Roberts, S.B. Dietary fiber and weight regulation. Nutr. Rev. 2001, 59, 129–139. [Google Scholar] [CrossRef] [PubMed]
- Clark, M.J.; Slavin, J.L. The effect of fiber on satiety and food intake: a systematic review. J. Am. Coll. Nutr. 2013, 32, 200–211. [Google Scholar] [CrossRef] [PubMed]
- Roe, B.; Levy, A.S.; Derby, B.M. The impact of health claims on consumer search and product evaluation outcomes: Results from FDA experimental data. J. Public Policy Mark. 1999, 18, 89–105. [Google Scholar]
- Provencher, V.; Polivy, J.; Herman, C.P. Perceived healthiness of food. If it’s healthy, you can eat more! Appetite 2009, 52, 340–344. [Google Scholar] [CrossRef] [PubMed]
- Provencher, V.; Jacob, R. Impact of perceived healthiness of food on food choices and intake. Curr. Obes. Rep. 2016, 5, 65–71. [Google Scholar] [CrossRef] [PubMed]
- Szocs, C.; Lefebvre, S. The blender effect: Physical state of food influences healthiness perceptions and consumption decisions. Food Qual. Prefer. 2016, 54, 152–159. [Google Scholar] [CrossRef]


| Nutrients per Serving | Recipe Category | |||||||||||
|---|---|---|---|---|---|---|---|---|---|---|---|---|
| Total (n = 86) | Breakfast (n = 11) | Snacks (n = 29) | Smoothies (n = 10) | Desserts (n = 11) | Treats (n = 25) | |||||||
| Mean | SD | Mean | SD | Mean | SD | Mean | SD | Mean | SD | Mean | SD | |
| Serving Weight (g) | 175.7 | 195.3 | 257.2 | 134.7 | 90.9 | 75.0 | 526.0 | 326.5 | 193.4 | 93.1 | 90.2 | 82.0 |
| Energy (kJ) | 1280.2 | 714.8 | 1521.3 | 505.7 | 1089.4 | 740.0 | 1489.0 | 693.1 | 1582.6 | 651.1 | 1178.7 | 752.3 |
| Energy density (kJ/g) | 11.8 | 6.4 | 13.1 | 4.0 | 3.2 | 1.4 | 9.3 | 4.5 | 16.5 | 6.4 | 7.9 | 4.9 |
| Protein (kJ) | 8.1 | 7.3 | 11.1 | 5.3 | 7.2 | 5.5 | 13.8 | 13.7 | 6.6 | 3.7 | 6.2 | 6.5 |
| Energy from protein (%) | 10.4 | 7.3 | 13.3 | 8.2 | 11.2 | 6.5 | 15.0 | 12.0 | 6.8 | 2.7 | 8.1 | 5.1 |
| Total fat (g) | 15.8 | 10.6 | 16.2 | 6.1 | 12.7 | 7.2 | 10.7 | 10.0 | 22.5 | 13.7 | 18.2 | 12.6 |
| Energy from fat (%) | 46.5 | 21.5 | 41.4 | 15.2 | 46.3 | 20.5 | 26.0 | 23.2 | 48.8 | 23.5 | 56.1 | 18.5 |
| Saturated fat (g) | 6.4 | 6.4 | 7.9 | 6.0 | 5.1 | 4.3 | 2.0 | 2.0 | 8.6 | 7.9 | 8.2 | 7.9 |
| Polyunsaturated fat (g) | 2.8 | 2.5 | 2.6 | 1.8 | 2.8 | 2.1 | 2.7 | 2.9 | 3.9 | 3.7 | 2.3 | 2.4 |
| Monounsaturated fat (g) | 5.5 | 5.0 | 4.4 | 2.7 | 4.0 | 3.0 | 5.2 | 5.8 | 8.5 | 7.1 | 6.5 | 5.7 |
| Carbohydrate (g) | 31.5 | 27.3 | 40.8 | 20.7 | 28.2 | 29.8 | 47.7 | 43.0 | 36.1 | 21.5 | 22.6 | 16.8 |
| Energy from carbohydrate (%) | 38.1 | 20.8 | 37.4 | 19.1 | 39.2 | 21.0 | 49.5 | 25.0 | 40.7 | 24.6 | 31.4 | 16.4 |
| Sugar (g) | 21.1 | 20.9 | 17.8 | 12.5 | 16.7 | 14.2 | 42.0 | 41.2 | 28.9 | 19.5 | 15.9 | 13.5 |
| Dietary fibre (g) | 5.0 | 4.3 | 6.5 | 3.1 | 4.3 | 4.0 | 8.1 | 3.6 | 5.9 | 5.4 | 3.6 | 4.2 |
| 196.7 | 269.0 | 115.2 | 87.6 | 295.0 | 305.3 | 128.3 | 129.2 | 134.3 | 147.1 | 173.2 | 331.8 | |
| Nutrient | Per Serving | Per 100 g | ||||||||||
|---|---|---|---|---|---|---|---|---|---|---|---|---|
| Clean | Control | Mean Diff | p | Clean | Control | Mean Diff | p | |||||
| Mean | SD | Mean | SD | Mean | SD | Mean | SD | |||||
| Weight (g) | 175.7 | 195.3 | 144.6 | 134.8 | 31.1 | 0.23 | ||||||
| Energy (kJ) | 1280.2 | 714.8 | 1137.3 | 600.1 | 142.9 | 0.16 | 1176.6 | 640.0 | 1221.6 | 648.0 | −45.0 | 0.65 |
| Protein (kJ) | 8.1 | 7.3 | 5.7 | 4.1 | 2.4 | 0.01 | 6.6 | 4.5 | 5.3 | 2.8 | 1.3 | 0.03 |
| Total fat (g) | 15.8 | 10.6 | 12.4 | 9.3 | 3.3 | 0.03 | 17.2 | 14.2 | 15.2 | 12.0 | 2.1 | 0.30 |
| Saturated fat (g) | 6.4 | 6.4 | 5.9 | 5.6 | 0.6 | 0.53 | 7.5 | 9.6 | 7.2 | 7.0 | 0.3 | 0.80 |
| Polyunsaturated fat (g) | 2.8 | 2.5 | 1.7 | 1.9 | 1.0 | 0.00 | 2.7 | 2.5 | 2.2 | 3.4 | 0.6 | 0.21 |
| Monounsaturated fat (g) | 5.5 | 5 | 4.0 | 3.4 | 1.5 | 0.02 | 5.9 | 5.8 | 4.8 | 5.1 | 1.1 | 0.21 |
| Carbohydrate (g) | 31.5 | 27.3 | 33.9 | 19.4 | −2.4 | 0.51 | 24.1 | 14.3 | 33.6 | 16.6 | −9.5 | 0.00 |
| Sugar (g) | 21.1 | 20.9 | 23.2 | 14.9 | −2.0 | 0.46 | 16.1 | 11.3 | 22.5 | 13.9 | −6.4 | 0.00 |
| Dietary fibre (g) | 5 | 4.3 | 2.8 | 2.9 | 2.2 | 0.00 | 4.0 | 2.8 | 2.4 | 1.9 | 1.5 | 0.00 |
| Sodium (mg) | 196.7 | 269 | 155.8 | 160.8 | 40.9 | 0.23 | 187.6 | 244.2 | 165.5 | 161.3 | 22.1 | 0.48 |
| Nutrient | Clean Eating Recipes | Control Recipes | WHO Recommendations | Chi Squared | p Value | ||
|---|---|---|---|---|---|---|---|
| n | % within World Health Organisation (WHO) Range | n | % within WHO Range | ||||
| Protein | 14 | 16 | 19 | 22 | 10–15% | 0.937 | 0.333 |
| Total Fat | 4 | 5 | 6 | 7 | 15–30% | 0.425 | 0.515 |
| Polyunsaturated fat | 20 | 23 | 15 | 17 | 6–10% | 0.897 | 0.344 |
| Monounsaturated fat | 23 | 27 | 40 | 47 | 9–20% | 7.239 | 0.007 |
| Saturated fat | 28 | 33 | 23 | 27 | <10% | 0.697 | 0.404 |
| Carbohydrate | 13 | 15 | 32 | 37 | 55–75% | 10.865 | 0.001 |
| Sugar | 11 | 13 | 5 | 6 | <10% | 2.481 | 0.115 |
| Nutrient | No. for Clean Eating Recipes | No. for Control Recipes | ||||
|---|---|---|---|---|---|---|
| Red | Amber | Green | Red | Amber | Green | |
| Sugar | 39 | 42 | 5 | 20 | 53 | 13 |
| Fat | 32 | 41 | 13 | 39 | 26 | 21 |
| Saturated Fat | 47 | 17 | 22 | 39 | 26 | 21 |
| Salt | 3 | 47 | 36 | 7 | 32 | 47 |
| Recipe Type (Per Average Portion) | Energy | Fat (g) | Saturated Fat (g) | Sugar (g) | Salt (g) |
|---|---|---|---|---|---|
| Clean Eating Recipes | 1280 kJ | 15.8 a | 6.4 b | 21.1 a | 0.5 a |
| %RI | 15% | 23% a | 32% b | 23% a | 8% a |
| Control Recipes | 1176 kJ | 12.4 a | 5.9 b | 23.2 b | 0.4 a |
| %RI | 14% | 18% a | 30% b | 26% b | 7% a |
| Note.a moderate (amber) rating, b high (red) rating %RI (Percent Reference Intake) | |||||
© 2018 by the authors. Licensee MDPI, Basel, Switzerland. This article is an open access article distributed under the terms and conditions of the Creative Commons Attribution (CC BY) license (http://creativecommons.org/licenses/by/4.0/).
Share and Cite
Dickinson, K.M.; Watson, M.S.; Prichard, I. Are Clean Eating Blogs a Source of Healthy Recipes? A Comparative Study of the Nutrient Composition of Foods with and without Clean Eating Claims. Nutrients 2018, 10, 1440. https://doi.org/10.3390/nu10101440
Dickinson KM, Watson MS, Prichard I. Are Clean Eating Blogs a Source of Healthy Recipes? A Comparative Study of the Nutrient Composition of Foods with and without Clean Eating Claims. Nutrients. 2018; 10(10):1440. https://doi.org/10.3390/nu10101440
Chicago/Turabian StyleDickinson, Kacie M., Michelle S. Watson, and Ivanka Prichard. 2018. "Are Clean Eating Blogs a Source of Healthy Recipes? A Comparative Study of the Nutrient Composition of Foods with and without Clean Eating Claims" Nutrients 10, no. 10: 1440. https://doi.org/10.3390/nu10101440
APA StyleDickinson, K. M., Watson, M. S., & Prichard, I. (2018). Are Clean Eating Blogs a Source of Healthy Recipes? A Comparative Study of the Nutrient Composition of Foods with and without Clean Eating Claims. Nutrients, 10(10), 1440. https://doi.org/10.3390/nu10101440