Abstract
This paper presents an empirical analysis of e-commerce data obtained through Google Analytics (GA) from two small businesses’ perspectives: an IT components company and a tourism agency website located within the same county in Romania. The objective of our study is to examine the enduring effects of the COVID-19 pandemic and seasonal variations over the last four years. The data collection spanned from January 2019, predating the onset of the COVID-19 pandemic, until mid-February 2023. To facilitate our analysis, we categorize the GA metrics into groups that encompassed website performance, site accessibility, and user behavior for the IT company. As for the tourism agency, we focus on website accessibility, user behavior, and marketing campaigns. Our goal is to empirically group or associate GA metrics according to their intrinsic meaning and check if each group reflects a certain latent concept (such as user behavior or site accessibility). Furthermore, our study aims to formulate and test five hypotheses regarding the immediate and long-lasting impact of the COVID-19 pandemic on the operations of small businesses. Our contribution consists of formulating and verifying the five hypotheses by providing descriptive data from the results of the Pearson correlation test, empirically grouping the GA metrics and verifying whether they reflect certain latent factors or topics, interpreting the results from the application of the ANOVA technique and Scarpello’s adaptation of the one factor test, respectively.
1. Introduction
The COVID-19 pandemic emerged suddenly and somehow unexpectedly and heavily influenced human habits and lifestyle as it imposed reduced mobility and shopping, leading the population to use delivery services and buy online. The population learned that buying online brings more time and the habit that was accentuated in pandemic times persisted even after the COVID-19 pandemic diminished its effects [1,2,3]. According to several sources [4,5,6], the COVID-19 pandemic has changed consumer behavior in several ways: (a) consumers have become more focused on their basic needs and hygiene products while reducing spending on non-essential items [5,6]; (b) consumers have developed a “buy local” trend to support their communities and reduce environmental impact [5]; (c) consumers have increased their online shopping and delivery services while avoiding physical stores and crowded places [6,7,8]; (d) consumers have experienced more anxiety and stress, which may have led to compulsive or erratic buying behaviors [4].
These changes have affected small businesses in different ways depending on their industry, location, and customer base. Some small businesses have faced challenges, such as reduced demand, supply chain disruptions, cash flow problems, and health risks [9,10]. Others found opportunities, such as new markets, digital transformation, innovation, and customer loyalty [5]. Small businesses were forced to adapt to these changes by responding to customer needs, resetting their strategies, and renewing their capabilities [5,11].
The main idea of this article is to track how consumers increased their online shopping and delivery service requests during the pandemic, and to do this, we will proceed in the following sections to analyze datasets on typical businesses that before, during, and after the pandemic used both online and offline commerce to market their products and services. We will look at how the ratio of online to offline activity of the companies has varied over time based on data obtained for the online traffic of these companies.
The technical contribution of this paper consists in: grouping the metrics of an IT components company and performing analyses, such as correlograms and monthly distributions for each year from the interval January 2019–February 2023, using GA metrics that reflect site performance, website access, and users’ behavior and grouping the metrics of a tourism agency performing analyses, such as correlograms and monthly distributions for each year from interval January 2019–February 2023, using similar metrics plus the marketing side. The association between Google Analytics (GA) metrics and site performance, access to the website, user behavior, and marketing is our proposal to empirically group (from our experience) or associate them based on their intrinsic meaning and check if each group reflects a certain concept, such as user behavior, for instance. We test it by analyzing the strength of intercorrelations within each group. By doing this, we aim to point out the trends and the effect of the COVID-19 pandemic on the two different small business cases located in one county in Romania, analyzing the GA data collected over the last four years.
The rest of this manuscript is organized into five sections. The second section is dedicated to the relevant literature in the field, followed by materials and methods in section three. In the fourth section, we present the results, and last, we present the conclusion and direction for future research in the fifth section.
2. Literature Review
The purpose of this section is to review various scientific studies that have been carried out in other papers on the influence of the COVID-19 pandemic on the online commerce run by small businesses [12,13]. Also, described here are the reasons, together with relevant bibliographical references, for the choice of data source that has been subjected to analysis in the following sections.
According to OECD [14], the COVID-19 pandemic has accelerated an already existing expansion of the e-commerce technology towards new firms, customers, and types of products. It has also increased e-commerce’s share of global retail trade from 14% in 2019 to about 17% in 2020 [15]. However, some small businesses may face challenges such as competition from large platforms, digital skills gaps, and regulatory barriers [16,17].
Consumers have increased their online purchasing while avoiding physical stores and crowded places for several reasons [18]: (a) consumers are concerned about their health and safety and want to minimize their exposure to the virus [19,20]; (b) consumers are spending more time at home due to remote work, school closures, and lockdowns and need more essentials and home-entertainment products [20]; (c) consumers are looking for convenience, speed, and variety and find online shopping more satisfying than offline shopping [19,21]; and (d) consumers are influenced by social media and online reviews and recommendations and trust online brands more than before [19,20].
These reasons have led to a surge in e-commerce sales during the pandemic across many categories [21]. E-commerce has grown by 32.4% in 2020 compared to 2019 in the United States [21]. Some of the most popular categories for online shopping include groceries [22,23], household supplies, personal care products, books, games, toys, and electronics [20].
According to some web sources [21,24,25,26,27], consumers’ preferences towards online shopping and delivery services are likely to persist after the pandemic but not at the same level. Some of the factors that may influence consumers’ preferences are: (a) the availability and effectiveness of vaccines and treatments for the COVID-19 pandemic, which may reduce health risks and encourage more physical shopping [25,26]; (b) the quality and convenience of online shopping and delivery services, which may retain or attract more customers who value speed, variety, and safety [24,27]; (c) the loyalty and satisfaction of customers with their online brands, which may prevent them from switching back to their previous brands or offline channels [21,25]; and (d) the social and emotional aspects of shopping, which may motivate some customers to seek more human interaction and experience in physical stores [26].
These factors may vary depending on the product category, customer segment, and geographic location. Therefore, it is hard to predict how consumers’ preferences will change after the pandemic [28]. However, some surveys suggest that online shopping will remain popular for certain categories such as groceries, household supplies, personal care products, and electronics [24,27], while physical shopping will regain some ground for categories such as clothing, footwear, jewelry and cosmetics [25,26]. Some of the challenges faced by small businesses in e-commerce are [29,30,31,32,33,34,35]: (a) finding the right niche and products to sell; (b) sourcing the products from reliable suppliers; (c) targeting a relevant audience and increasing store visits; (d) managing inventory and shipping efficiently; (e) reducing cart abandonment and increasing conversions; (f) integrating e-commerce data into the overall business structure; (g) competing with large platforms and other online sellers; and (h) dealing with cybersecurity threats and data breaches.
Analyzing web traffic data from various sources can provide solutions or components of solutions to many of these challenges, but it is particularly important for targeting a relevant audience, increasing store visits, reducing cart abandonment, and increasing conversions [36].
There are many possible sources of web traffic data (e.g., on the web analytics segment alone, Google Analytics (GA), Adobe Analytics, IBM Digital Analytics, Webtrends, AT Internet, Ahrefs, Semrush, BuzzSumo, MozBar, etc.), but the most widely used of them is (and will probably remain for the foreseeable future) traffic tracking via GA. According to several reports from Statista and other sources [37,38,39,40,41], the GA market share in the web analytics software, worldwide, was 55.9% in 2022 (the biggest market share), with the second competitor credited with 15.1% of the market share.
Google Analytics is a tool that can help in measuring and optimizing e-commerce performance. Google Analytics can be used to [42,43,44,45]: (a) track website traffic and understand where your visitors are coming from; (b) set up e-commerce tracking to see how many sales, revenue, transactions and products are generated; (c) create Urchin Tracking Module (UTM) parameters for smarter tracking of marketing campaigns; (d) test configurations with a dummy profile to make sure everything is working correctly; (e) set conversion goals in GA to measure how well the desired outcomes are achieved; (f) use shopping behavior and checkout behavior reports to see how users interact with the products and the checkout process; (g) create a durable and flexible tracking code that can handle different scenarios such as discounts, refunds, taxes, etc.; and (h) Segment users for better context and analysis of their behavior, preferences and needs.
Studies such as those by [46] have employed Pearson correlation to analyze user engagement metrics like pageviews and average session duration. The research found a positive correlation, suggesting that users who view more pages tend to spend more time on the website [47]. In the realm of e-commerce, the Pearson correlation has been used to analyze the relationship between bounce rate and conversion rate [48]. A negative correlation was generally observed, indicating that a higher bounce rate often corresponds to a lower conversion rate. It is worth noting that the Pearson correlation only captures linear relationships and is sensitive to outliers [49]. Moreover, correlation does not imply causation, a point often overlooked in applied settings [50].
The metrics provided by GA can serve as dependent variables in an ANOVA model, with independent variables often being factors, like time, user demographics, or marketing channels [49,51]. Research by [52] utilized ANOVA to analyze the impact of different marketing channels on user engagement metrics, like pageviews and average session duration. The study found significant differences between the means, suggesting that the choice of marketing channel does affect user engagement. In e-commerce settings, ANOVA has been applied to examine how seasonal trends affect conversion rates [52]. The study revealed that conversion rates were significantly higher during holiday seasons compared to non-holiday periods. It is worth noting that ANOVA assumes homogeneity of variances and normally distributed data, assumptions that may not always hold in real-world analytics data [53]. Moreover, ANOVA is not designed to establish causality but rather to identify differences in means that are statistically significant.
The one-factor test is traditionally used to assess the impact of a single independent variable on a dependent variable across multiple groups. Scarpello’s adaptation introduces refinements to better accommodate non-normal distributions and unequal sample sizes, among other considerations [54]. The GA metrics can serve as dependent variables in Scarpello’s adapted one-factor test, with the independent variable often being a categorical factor, like user demographics or source of traffic [49]. Given the specialized nature of Scarpello’s adaptation, the literature specifically applying this method to Google Analytics data is limited. However, the technique has been employed in related fields, offering insights that could be transferable to web analytics. Scarpello’s adaptation has been used to analyze job satisfaction but also consumer behavior metrics, such as customer satisfaction and purchase intent [55,56,57]. These applications could be extended to Google Analytics metrics, like conversion rate or average session duration. Studies in HCI have employed Scarpello’s adapted one-factor test to analyze user engagement and usability metrics [58]. These findings could be relevant when examining similar metrics in Google Analytics. It is worth noting that Scarpello’s adaptation, while versatile, still requires careful consideration of underlying assumptions such as independence of observations and homogeneity of variances [54].
Taking into account the above, we selected two companies with different profiles (travel services and IT equipment and services respectively) for which we obtained relevant traffic data recorded via GA. Our contribution consists of grouping the GA metrics and associating them with a concept. This is similar to the confirmation factor analysis (CFA) that is performed usually with survey data. In the CFA, questions are grouped by researchers based on sense and the CFA allows data scientists or researchers to verify whether they reflect a latent factor or concept [59,60]. CFA is applied to the answers offered by respondents. Additionally, when dealing with data as text, latent Dirichlet allocation can be applied to identify topics or latent concepts from large datasets of strings [61,62,63]. Thus, our contribution consists of empirically grouping the GA metrics and verifying whether they reflect certain latent factors or concepts. Moreover, we graphically analyze the GA metrics and trends over the last four years, unraveling valuable insights.
In the following section, we will focus on the materials in terms of input data and the proposed method to further analyze the e-commerce data.
3. Materials and Methods
During a generous interval (more than 4 years from January 2019 to February 2023), the GA metrics of two websites were recorded. We focus first on the IT components company’s website analytics. The following ten indices were recorded: Avg. Document Content Loaded Time (s), Avg. Document Interactive Time (s), Avg. Page Load Time (s), Organic Searches, Entrances, Entrances/Page Views, Session Duration, Sessions, Unique Page Views, and Users. They are the main variables of the first data sample referring to the IT components company, depicted in Table 1.

Table 1.
Metrics from the IT components company’s website analytics.
In Table 1, the GA metrics for the website of an IT components company are displayed and included into one of the three categories. In this paper, we propose three categories in which one of the metric falls: website performance, accessibility, and users’ behavior.
For the second company—a tourism agency located in the same county as the first analyzed company—we identified 15 relevant metrics that represent the main variables of the second data sample, depicted in Table 2, and they were grouped into three categories that reflect accessibility (Organic Searches), marketing (Cost per Conversion, CPC, CPM, ROI), and users’ behavior that includes the rest of the metrics. One idea that should be pointed out is that the 15 metrics were not always present in the yearly selected data sets. Therefore, a smaller number of metrics is analyzed depending on the year recordings.
Table 2.
Description of the 15 metrics extracted from Google Analytics.
Table 2 displays the 15 metrics that characterize the operation of the e-commerce of a tourism agency that sells various tourism packages.
Therefore, we propose to empirically group the GA metrics and verify whether they reflect a certain latent factor or concept. For instance, metrics related to the loading time may reflect the website performance.
By grouping the GA metrics, for the e-commerce IT components business, we aim to verify the following hypotheses:
H0:
The following GA metrics, Avg. Document Content Loaded Time (s), Avg. Document Interactive Time (s), and Avg. Page Load Time (s), reflect the website performance.
H1:
The following GA metrics, Organic Searches, Entrances, Entrances/Page Views, Session Duration, Sessions, and Unique Page Views, reflect the access to the website.
H2:
The following GA metrics, Session Duration, Sessions, and Unique Page Views, reflect the users’ behavior.
Furthermore, for the tourism agency, we aim to verify the following hypotheses:
H0′:
The following GA metrics, Sessions, Avg. Session Duration, Avg. Time on Page, Pages/Session, Bounce Rate, Clicks, Goal 1 Completions, Goal Conversion Rate, and CTR, reflect the users’ behavior.
H1′:
The following GA metrics, Cost per Conversion, CPC, CPM, and ROI, reflect the marketing.
The hypotheses are tested by analyzing the intercorrelations within each group of metrics. Furthermore, we graphically analyze trends over the last four years to understand seasonal variations and the effects of the COVID-19 pandemic.
4. Results
After grouping the GA metrics by the proposed categories, we proceed to annually analyze the metrics. Except for Organic Search, which is only correlated with Session Duration, the rest of the metrics are moderately (over 0.5) or highly correlated (0.98).
Table 3 displays the Pearson correlation indices among the ten analyzed metrics in the proposed interval, whereas Table 2 shows the Pearson correlation indices among the ten analyzed metrics in 2019, before the outbreak of the COVID-19 pandemic.
Table 3.
Pearson correlation indices among the ten analyzed metrics: Jan. 2019–Feb. 2023.
Table 4 displays the Pearson correlation indices among the ten analyzed metrics in 2019. The three metrics related to site performance are highly correlated. Also, the metrics related to the users’ behavior are highly correlated, whereas the group of metrics related to access are weakly correlated.
Table 4.
Pearson correlation indices among the ten analyzed metrics in 2019.
Table 5 displays the Pearson correlation indices among the ten analyzed metrics in 2020. Similar correlations as in 2019 are noticed in 2020. The effects of the COVID-19 pandemic were not dominant. Stronger correlations emerged between Users and Session Duration, Users and Organic Searches, Entrances and Organic Searches, and Organic Searches and Sessions in comparison with 2019.
Table 5.
Pearson correlation indices among the ten analyzed metrics in 2020.
Table 6 displays the Pearson correlation indices among the ten analyzed metrics in 2021. This correlogram is similar to the mixed one when the entire dataset was considered. Weak correlations were encountered between Session Duration, Organic Searches, and the other metrics. However, like the interval 2019–2023, there is a strong correlation between Session Duration and Organic Searches.
Table 6.
Pearson correlation indices among the ten analyzed metrics in 2021.
Table 7 displays the Pearson correlation indices among the ten analyzed metrics in 2022. Strong correlations were recorded between metrics from the first and third categories of metrics. Entrances from the second category are weakly correlated with the other metrics.
Table 7.
Pearson correlation indices among the ten analyzed metrics in 2022.
Table 8 displays the Pearson correlation indices among the ten analyzed metrics in 2023. Strong correlations are recorded between the first group of metrics that reflect the site’s performance. Furthermore, strong correlations are recorded between the third group of metrics, which reflect the users’ behavior. A very weak correlation was recorded between the second group of metrics that reflect access to the website. However, the 2023 case is not very relevant as only the first month and a half were considered in analyzing correlations.
Table 8.
Pearson correlation indices among the ten analyzed metrics in 2023.
After analyzing correlograms for each year, we can conclude that the first group of metrics that reflect the site performance (Avg. Document Content Loaded Time (s), Avg. Document Interactive Time (s), Avg. Page Load Time (s)) are strongly correlated. The same finding is valid for the third category. There are similarities between correlograms in 2019 and 2020, and 2021 shows higher correlations, but in 2022, they gradually weakened. The correlogram in 2021 stands out compared to the others, showing the impact of the COVID-19 pandemic.
From Table 3, Table 4, Table 5, Table 6, Table 7 and Table 8, one can conclude that both H0 and H2 are valid. They reflect the site performance and users’ behavior as the correlations are prevalent at these groups’ levels. At the second group level, which reflects the access to the website, the correlations are missing in 2019 and 2023 or are limited, as in 2020 and 2022. In 2021, even for the second group of metrics, the correlations are stronger and more numerous.
The period between half of 2020 and 2021 was a non-typical period for multiple domains as it corresponded with the period of lockdowns and other restrictions related to the pandemic. But in the case of IT companies especially the hardware industry, the influence was much higher, as due to online school and remote working, people needed much more equipment, so there has been an increase in traffic, organic searches, and clicks on the website. Due to the pandemic situation on the other side, there were issues related to hardware supply so many companies could not satisfy the demand so there was no need for usual advertising campaigns.
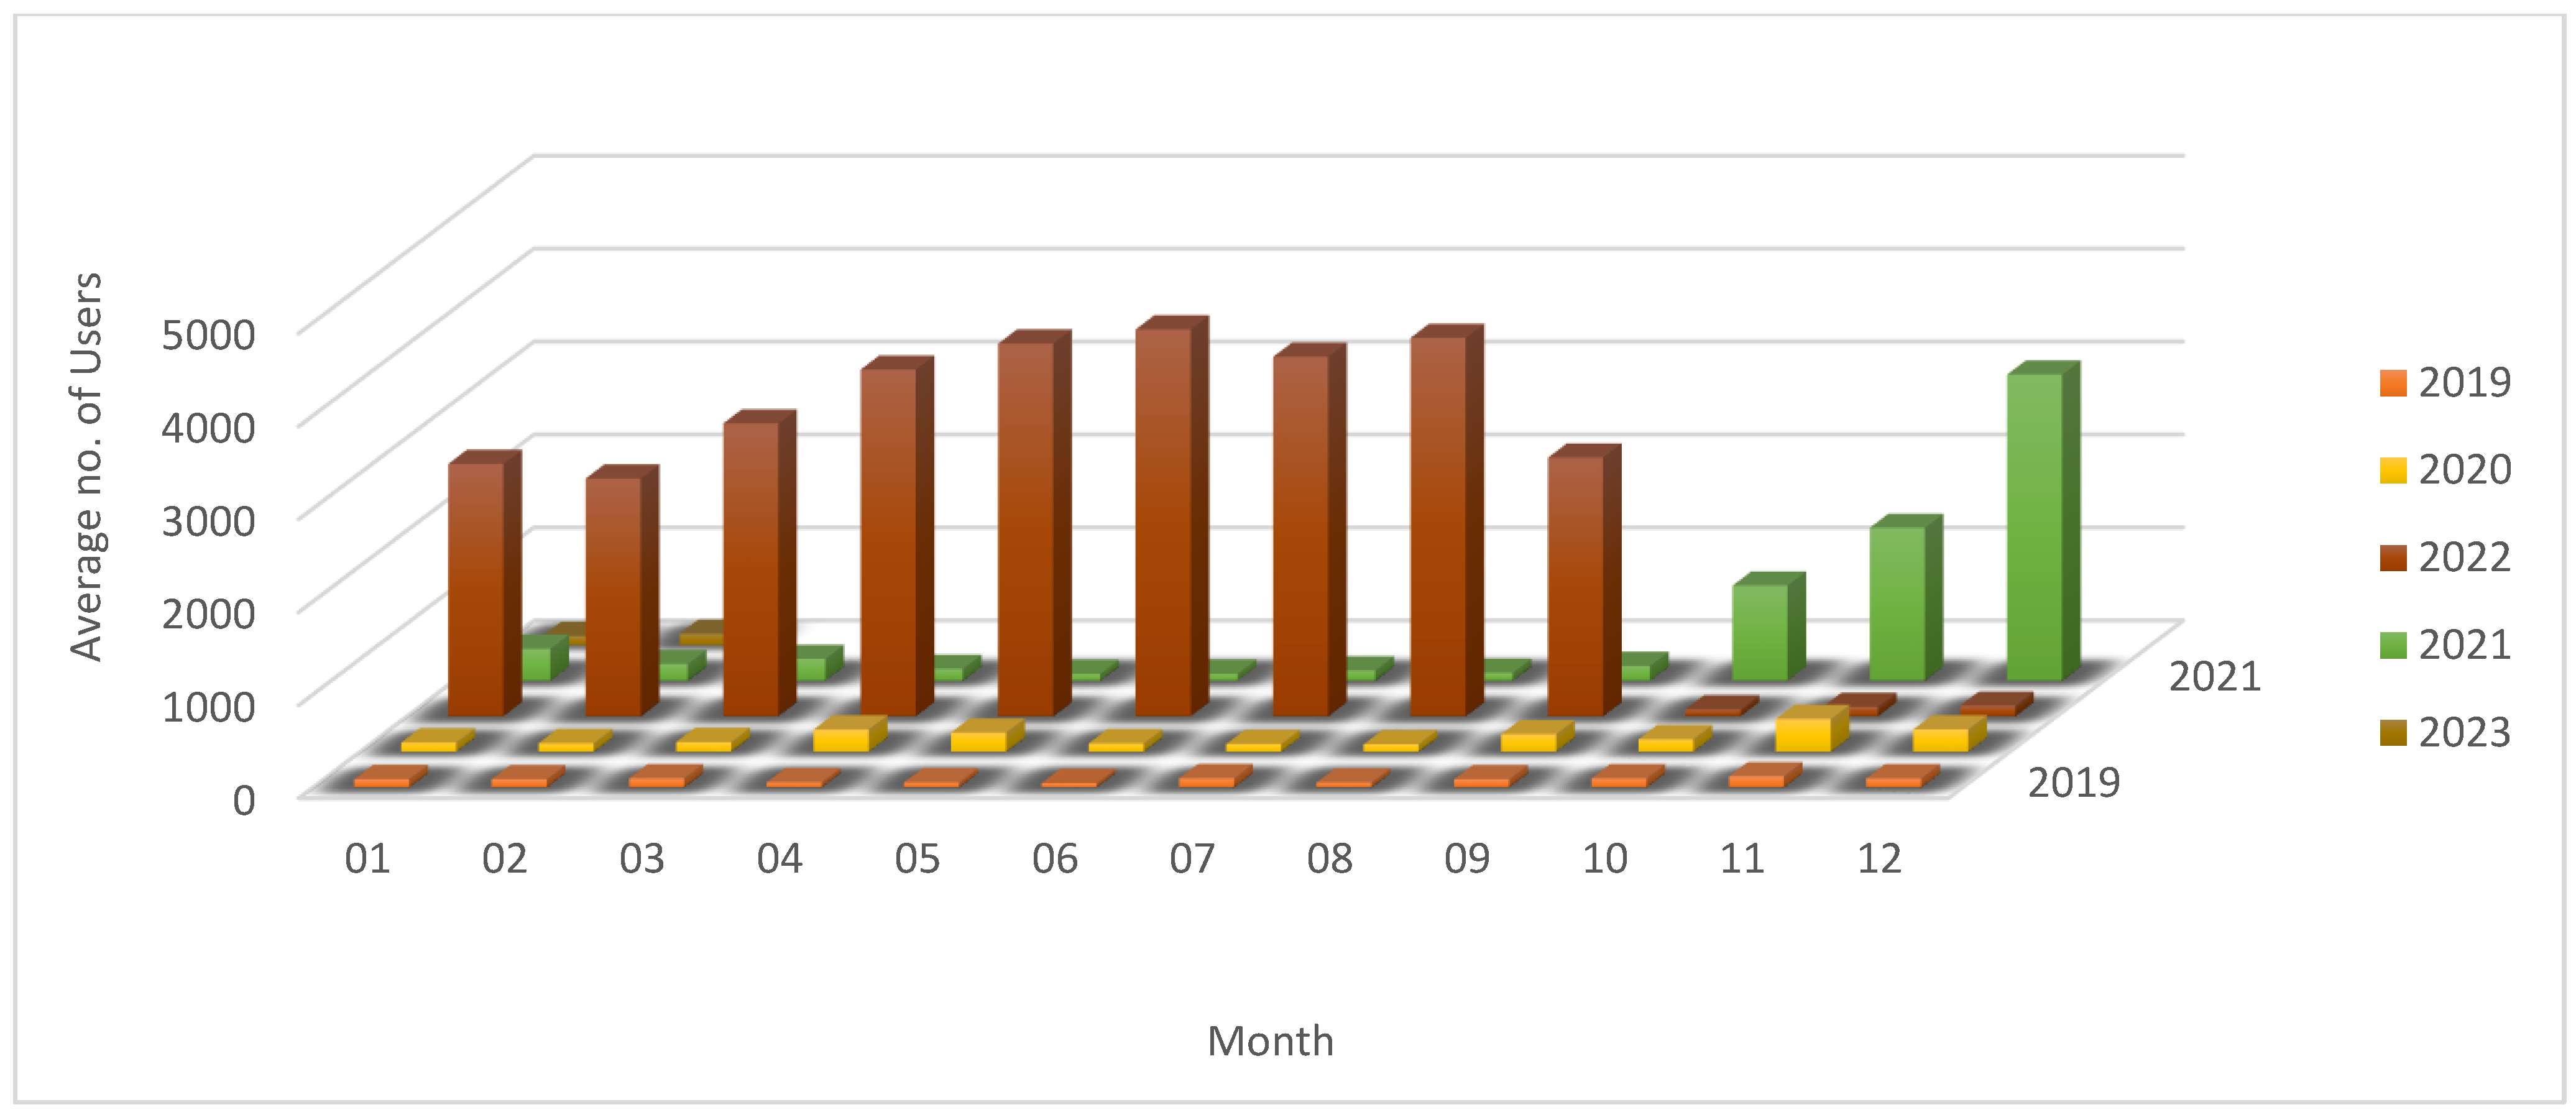
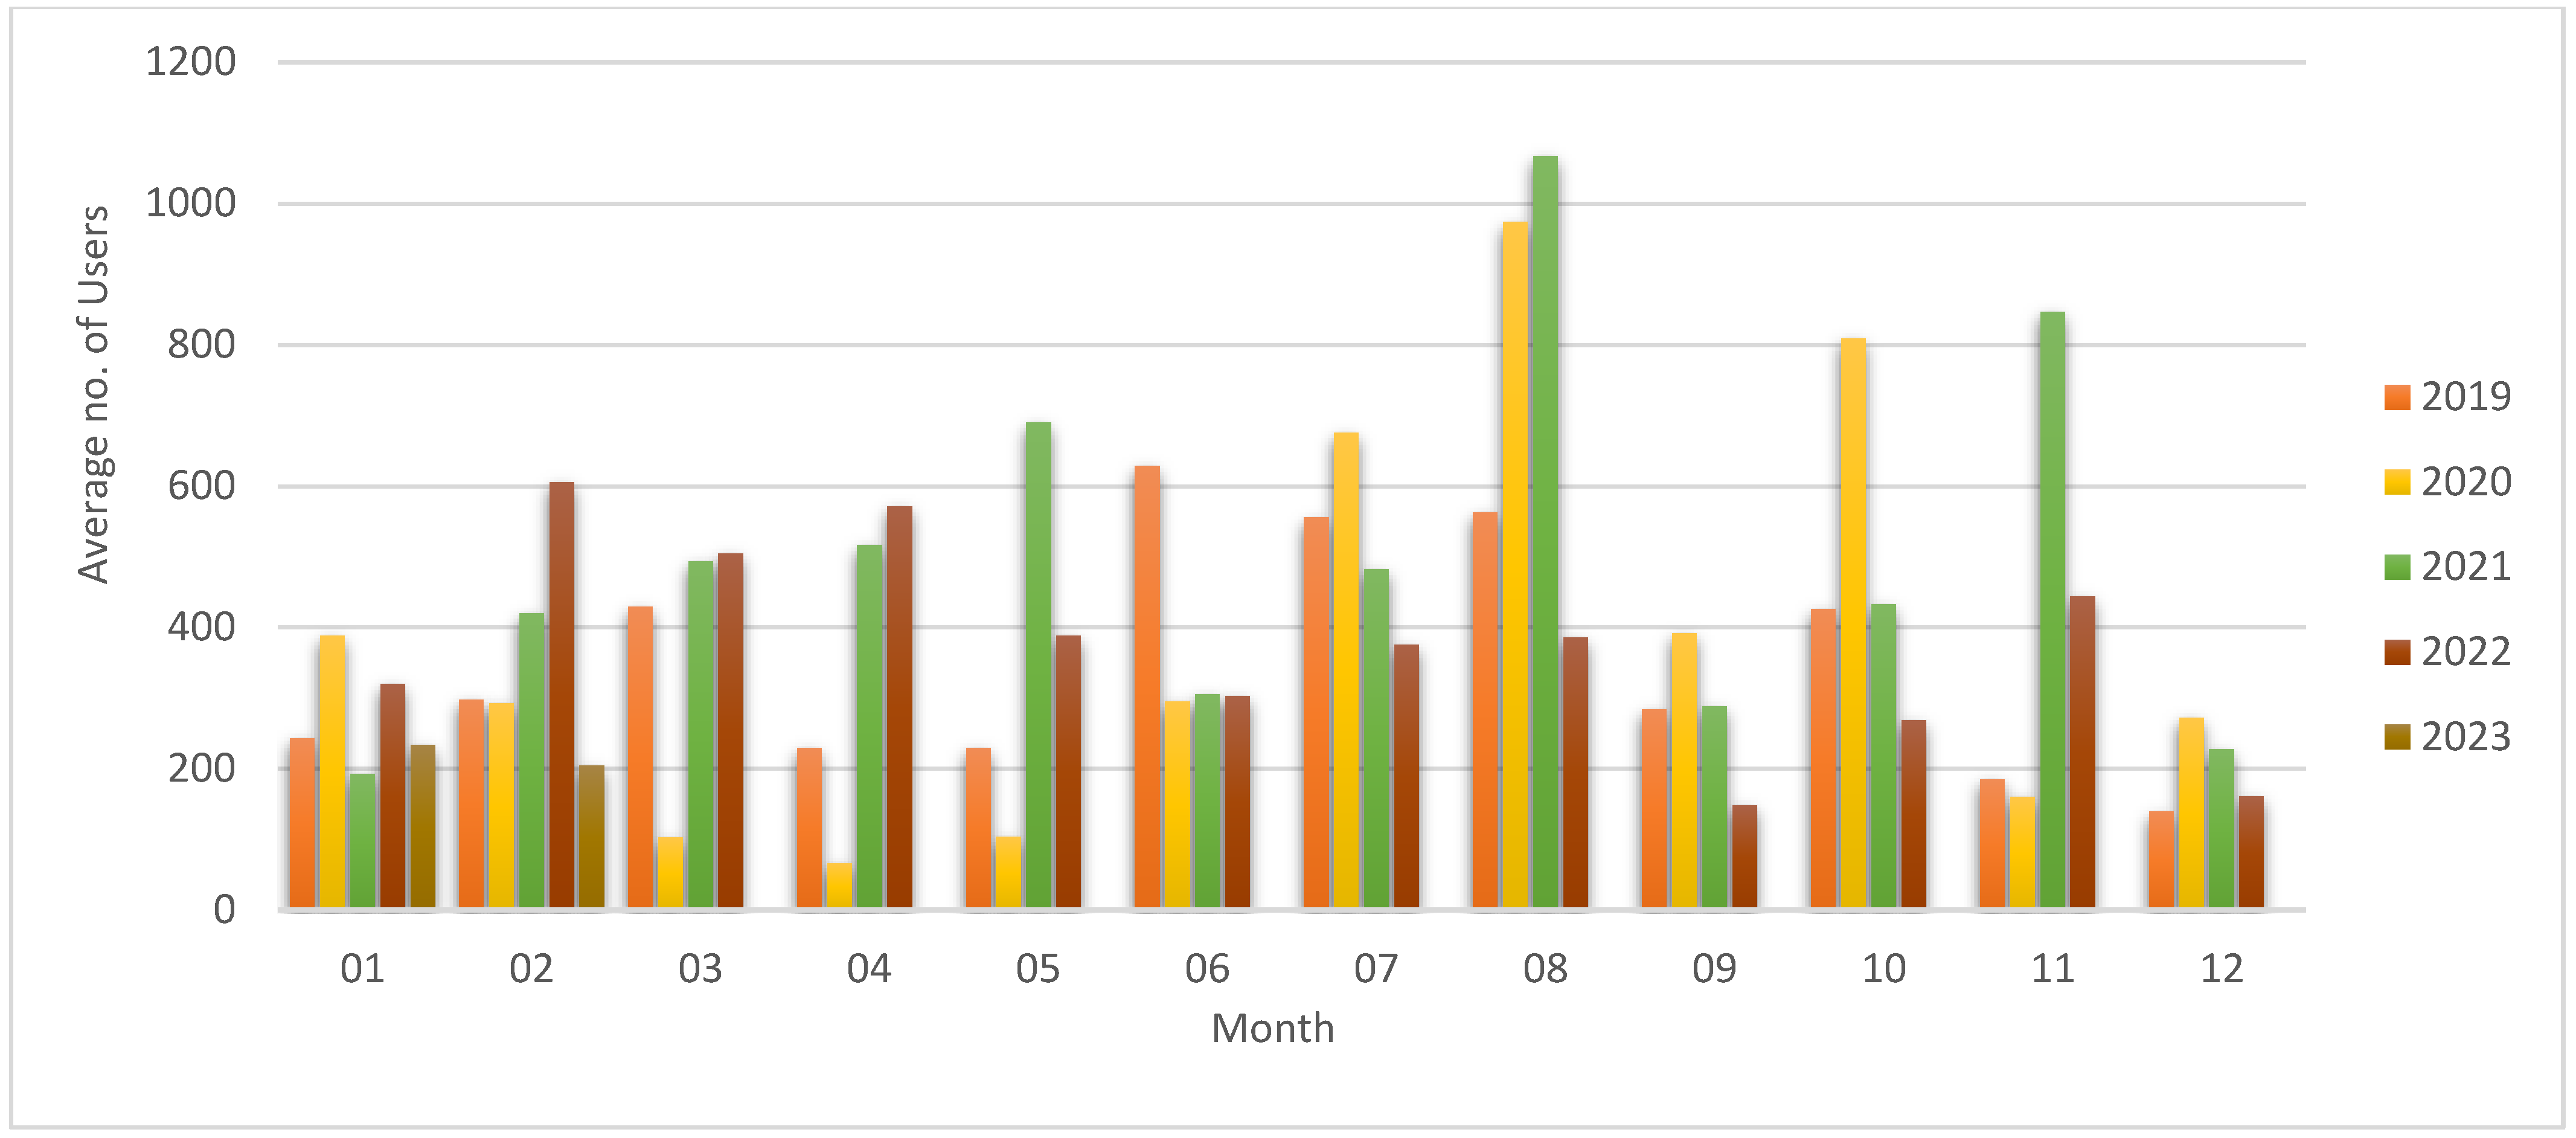
Analyzing the monthly distribution of the average number of Users, one can notice that it increased starting from the end of 2021 when it went to more than 3250 users in December 2021. In 2022, the trend continued to rise to over 4150 users in June 2022. However, by the end of 2022, the number of Users significantly decreased below 500 users (as in Figure 1). A small increase was signaled from March to April and May in the number of Users, but it decreased from June up to November when it slightly increased to around 350.

Figure 1.
Average number of Users’ monthly distribution for interval 2019–2023.
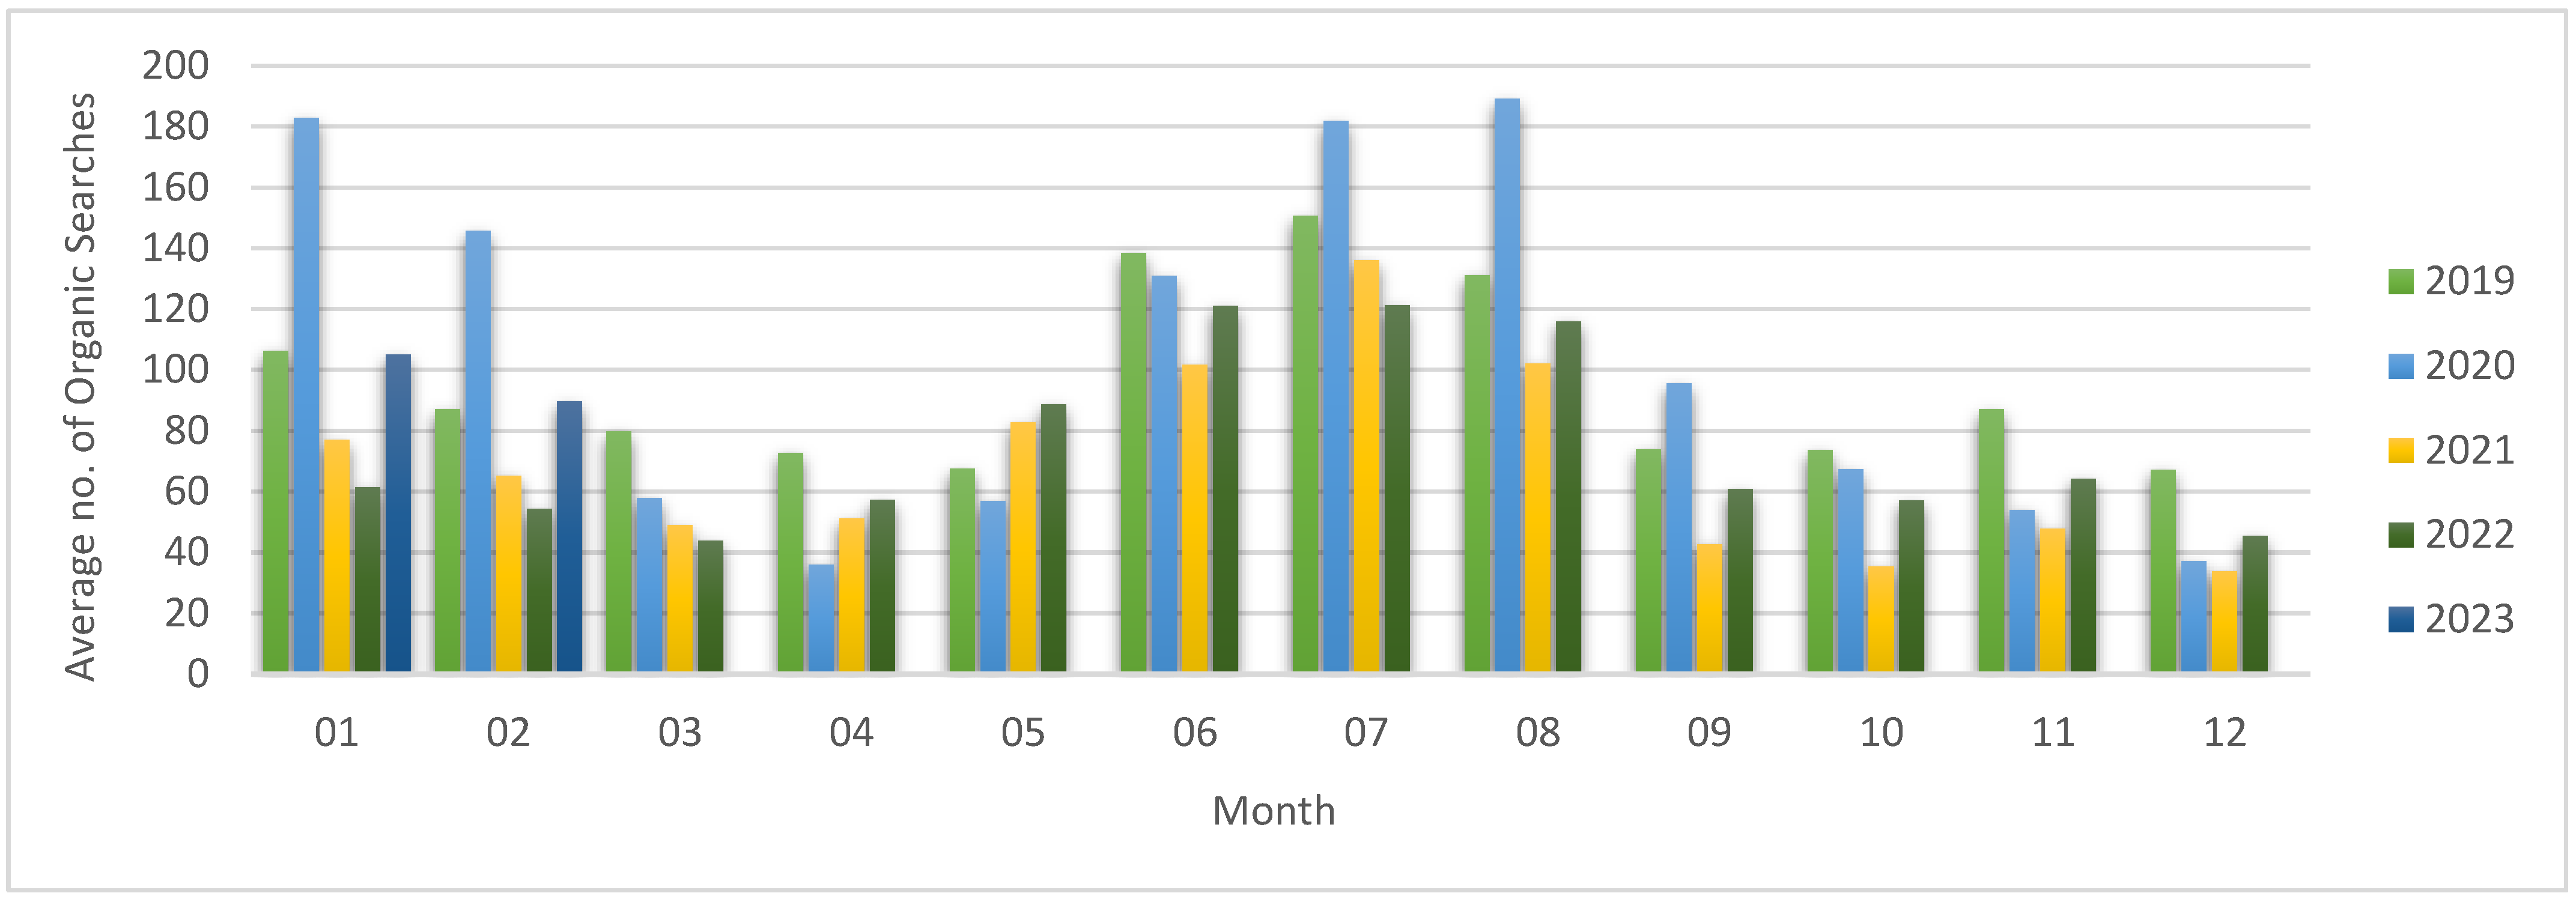
However, the Users’ distribution at the year level is less relevant than Organic Searches, which is depicted in Figure 2.
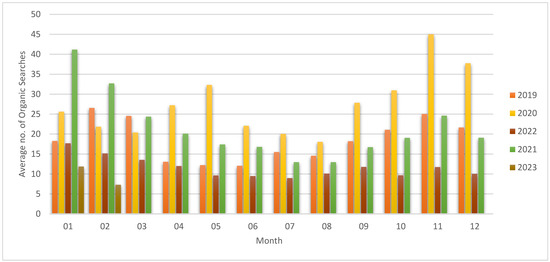
Figure 2.
Average number of Organic Searches, monthly distribution for 2019–2023.
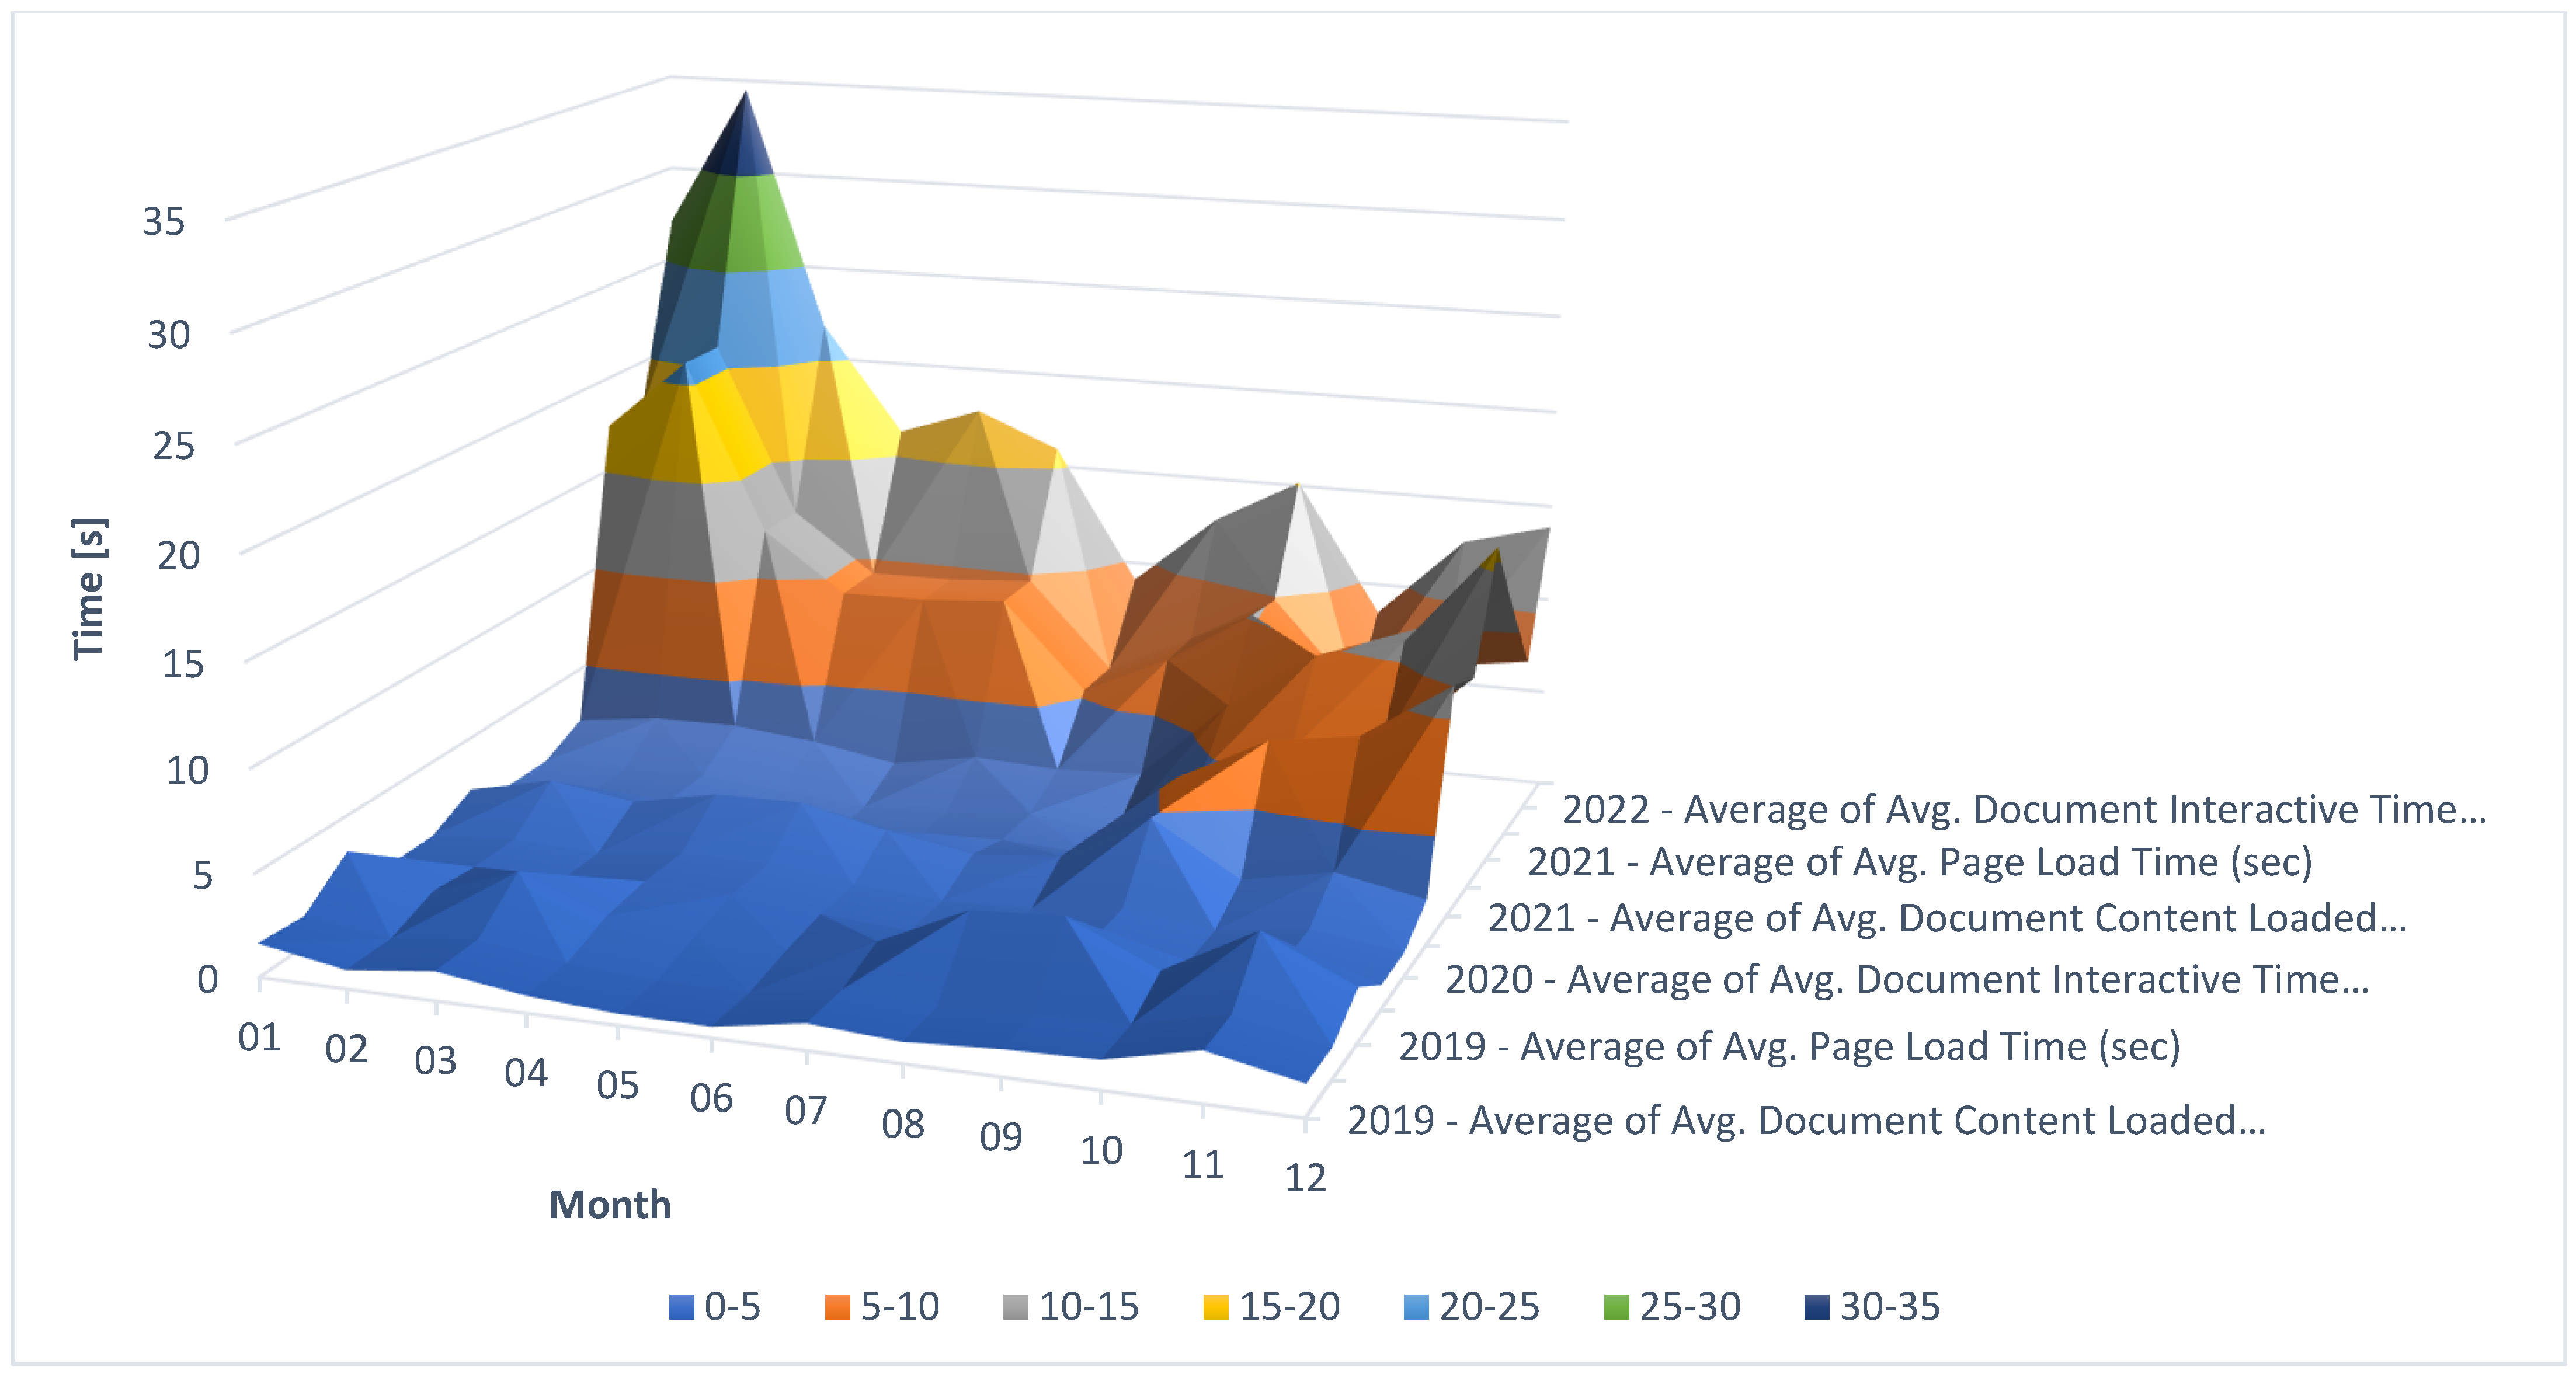
Analyzing the monthly distribution of the first group of metrics, one can see that the site performance was better during 2019 and 2020, when the three metrics were below 5 s (as in Figure 3).

Figure 3.
Average monthly distribution of the metrics from the first category—site performance.
The average time to load the content, become interactive, and fully load the page increased to almost 35 s in the wintertime of 2021 and 2022.
The thin line in Figure 4 depicts Entrances on average. They abruptly increased from almost 200 in September 2021 to 3300 in December 2021 and continued this trend in 2022 (4180 in July) until October, similar to the Users’ monthly distribution.

Figure 4.
Average monthly distribution of the metrics from the first category—site performance.
The highest number of Users who arrived at the IT website by conducting a search on a search engine was recorded in 2020 (45), and the trend continued in 2020 (41). The highest number of Users was recorded in colder months (starting from September until May). However, in 2022, the number of Users who arrived at the IT website by conducting a search on a search engine decreased to 9 on average in July.
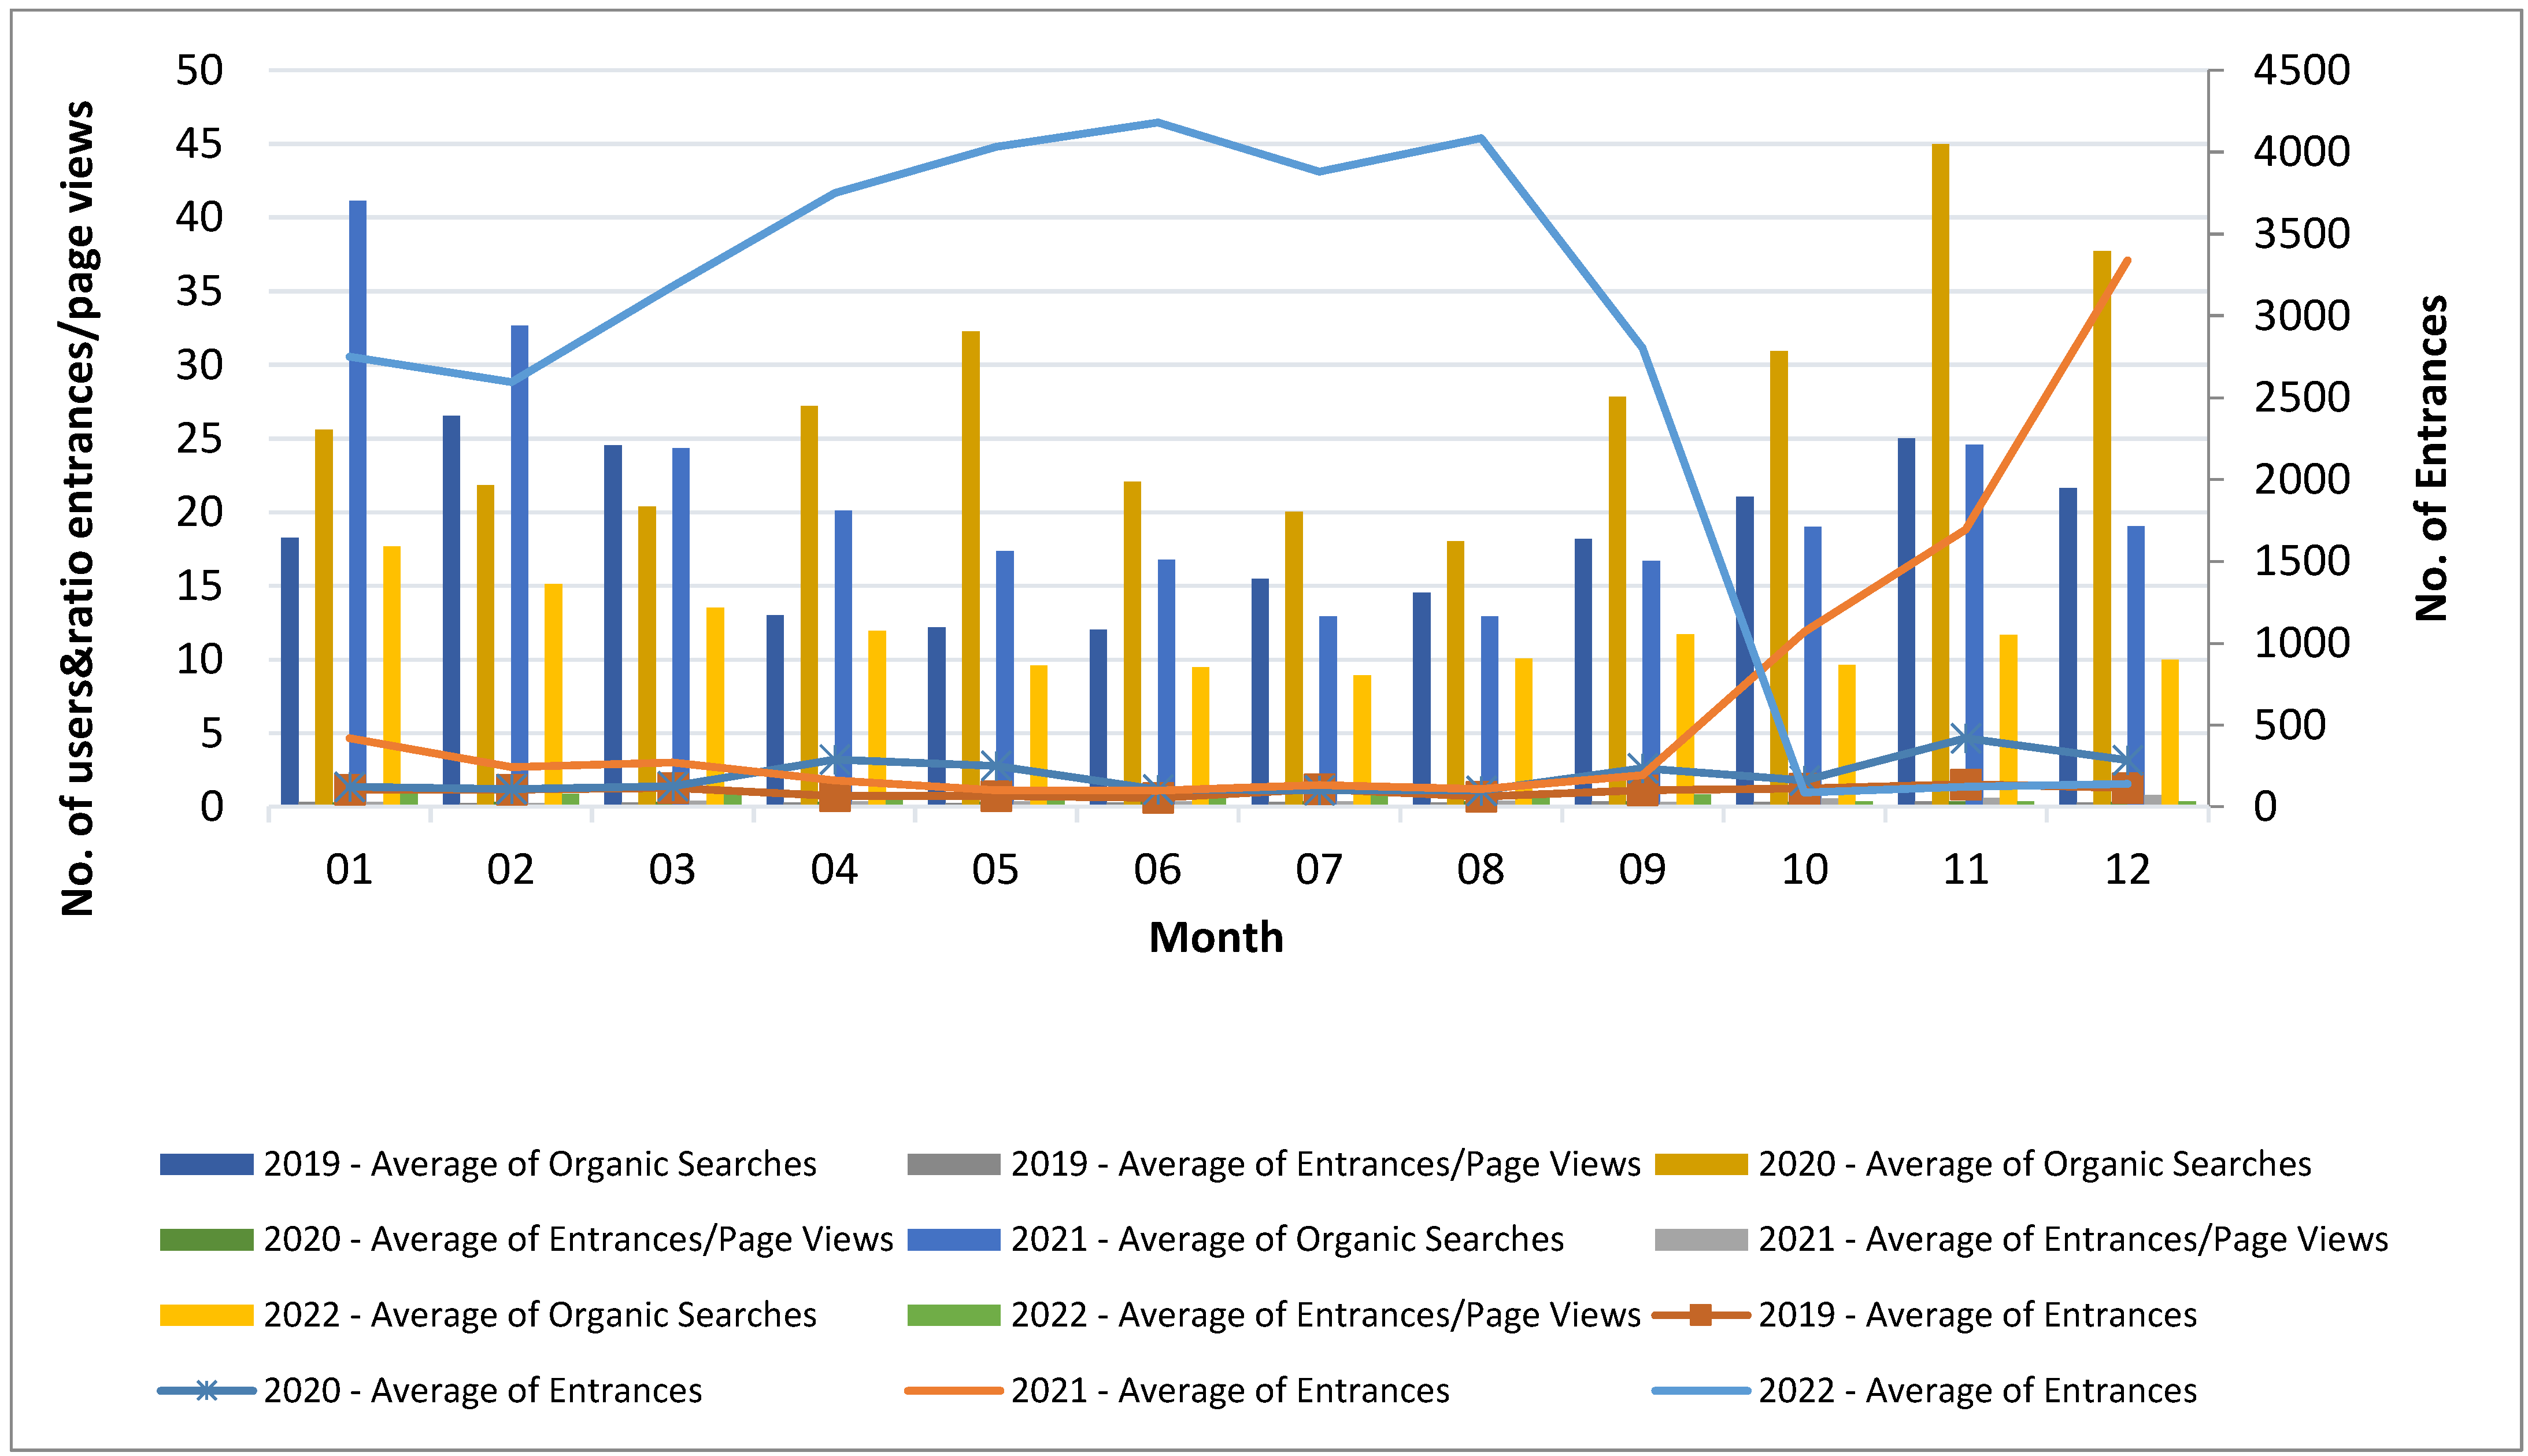
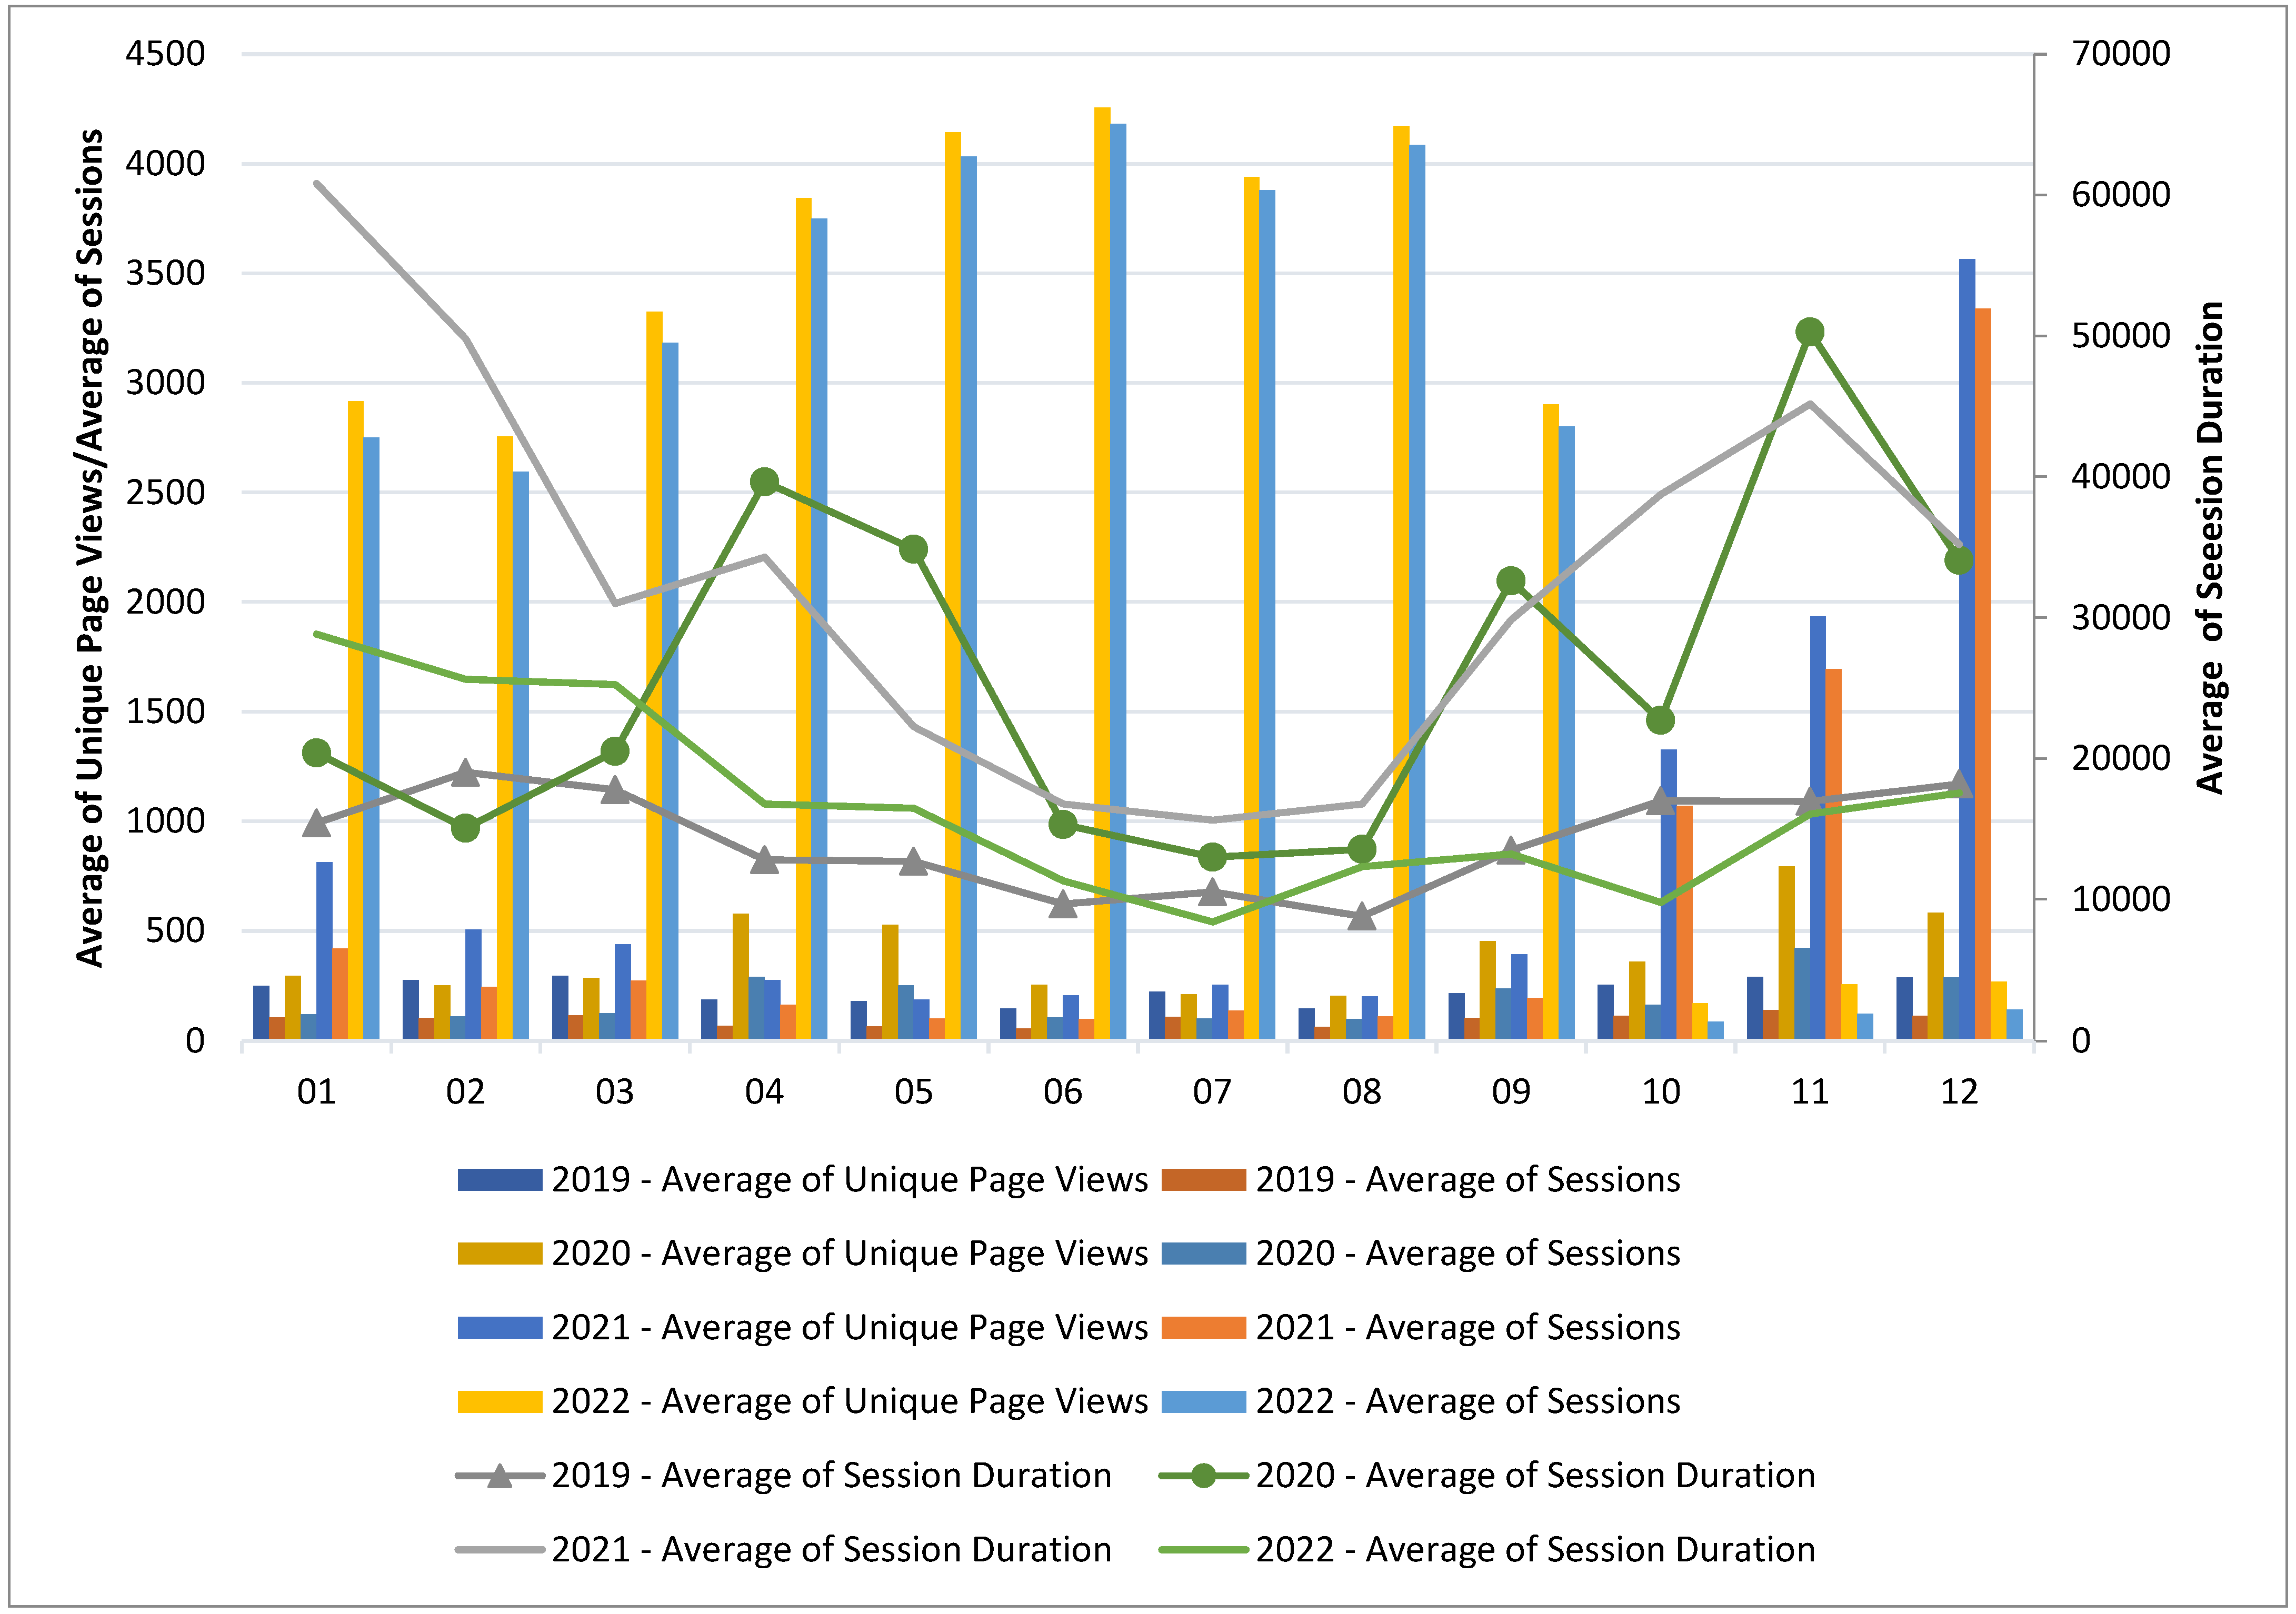
The third group of metrics, which reflect users’ behavior, is depicted in Figure 5. The Session Duration’s shape is similar with the shape of Organic Searches, especially in 2021 when longer sessions took place in colder months. During summer in all years, the Session Duration was shorter. From March 2020, when the COVID-19 pandemic erupted, there was an increase in the Session Duration until the summer months, when, despite lockdowns, they did not contribute to a longer Session Duration. The highest number of Sessions was recorded in 2022. The trend is followed by Unique Page Views. They started to increase in 2021 in tandem and continued this trend until September 2022.
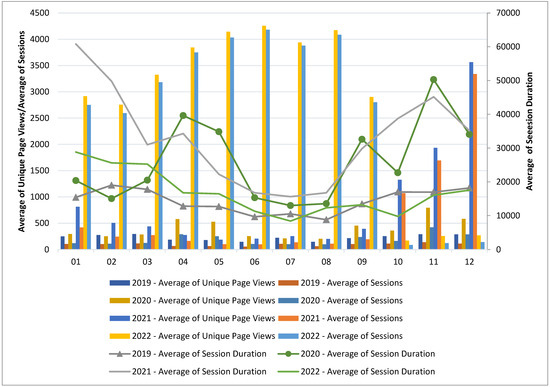
Figure 5.
Average monthly distribution of the third group of metrics.
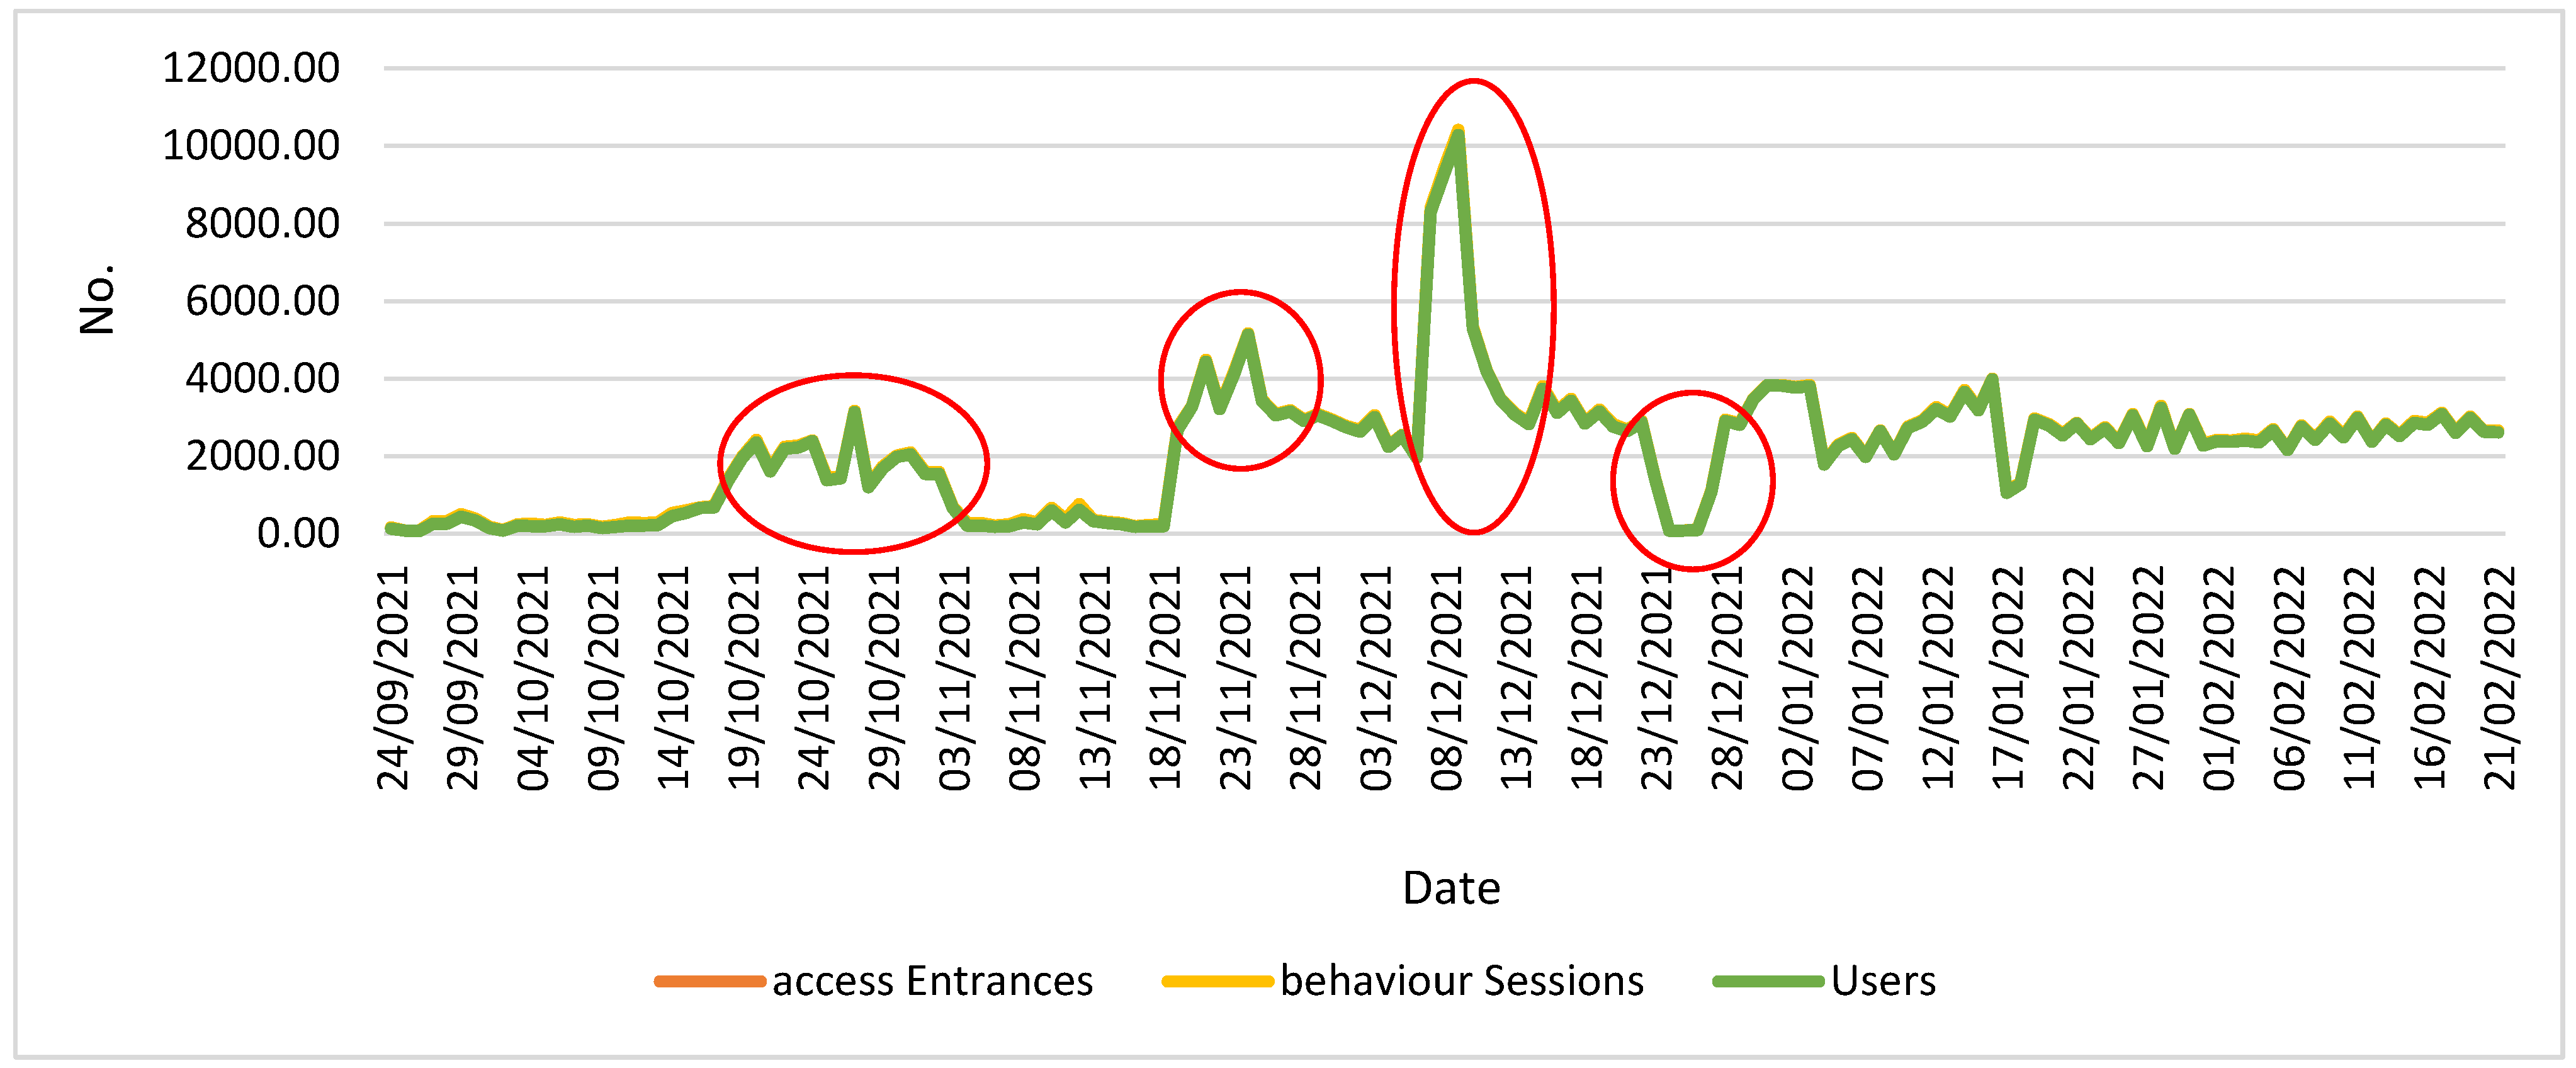
Analyzing the evolution of the Users and several metrics in the second and third groups, a similar trend is emphasized by the evolution of the Entrances, Sessions, Unique Page Views, and Users that started in 2021 by September/October and continued in 2022.
With a closer look at the evolution of the Users, Sessions, and Entrances metrics, one can identify the events that triggered the trend, such as Black Friday in October 2021 and the Christmas holidays.
In this case, we can see an unusual pattern in the second half of December 2021; usually there should have been a flat line, but due to some technical issues, the site was mostly unavailable during that period, which explains the sudden drop in all lines, as seen in Figure 6.

Figure 6.
Trend of the Entrances, Sessions, and Users.
The second website refers to the e-commerce activity of a tourism agency located in Romania in the same county as the IT components company. Table 9 displays the Pearson correlation coefficients between metrics during the entire interval of 2019–2023.
Table 9.
Pearson correlation coefficients for the tourism agency in 2019–2023.
Except for Organic Searches, Bounce Rate, Cost per Conversion, and ROI, there is at least one correlation among metrics extracted from Google Analytics. There are strong direct overall correlations (>0.8) between Sessions and Users, Users and Clicks, and Sessions and Clicks. Strong correlations are recorded between CPM and CPC (0.76), Goal Conversion Rate and Goal 1 Completions (0.78), Pages/Session and Avg. Session Duration, and CPM and CTR (0.59). There is a moderate correlation between CTR and Clicks (0.48). Furthermore, moderate inverse correlations are recorded between Avg. Session Duration and Sessions (−0.4), Avg. Session Duration and Clicks (−0.49), and Avg. Session Duration and Users (−0.41).
Several strong and moderate correlations are identified for the 2019 data set, as shown in Table 10. Except for Avg. Time on Page, all metrics show at least one correlation. The first group of metrics that reflects the users’ behavior is well correlated at the group level (except Avg. Time on Page) and between groups (except Goal Conversion Rate).
Table 10.
Pearson correlation coefficients for the tourism agency in 2019.
Several strong and moderate correlations are identified for the 2020 data set, as shown in Table 11. Except for Bounce Rate, all metrics show at least one correlation. The first group of metrics that reflects the users’ behavior is well correlated at the group level (except Bounce Rate) and between groups (except Pages/Session, Bounce Rate, Avg. Time on Page, Goal 1 Completions, and Goal Conversion Rate).
Table 11.
Pearson correlation coefficients for the tourism agency in 2020.
More strong and moderate correlations are identified for the 2021 data set, as shown in Table 12. Except for Organic Searches, all metrics show at least one correlation. The first group of metrics that reflects the users’ behavior is well correlated at the group level (with no exception) and between groups (except Bounce Rate and Avg. Time on Page). From Table 11 and Table 12, it indicates that marketing campaigns were conducted during 2020 and 2021.
Table 12.
Pearson correlation coefficients for the tourism agency in 2021.
Less strong and moderate correlations are identified for the 2022 data set, as shown in Table 13. Except for Organic Searches, Cost per Conversion, and ROI, all metrics show at least one correlation. The first group of metrics that reflects the users’ behavior is well correlated at the group level (except Goal Conversion Rate) and between groups (except several metrics).
Table 13.
Pearson correlation coefficients for tourism agency in 2022.
Even less strong and moderate correlations are identified for the 2023 data set. Except for the Goal Conversion Rate, all metrics show at least one correlation. However, the relevance of 2023 metrics is very low as the data were analyzed only for one month and a half.
From Table 9, Table 10, Table 11, Table 12, Table 13 and Table 14, one can conclude that both H0′ and H1′ are valid. They reflect the users’ behavior and marketing campaigns as the correlations at the groups’ level are prevalent. It can be seen that 2021 was an atypical year with multiple stronger correlations than the rest of the years for both companies reflecting the effects of the COVID-19 pandemic lockdowns. For the tourism industry, the same pandemic period had a completely different effect than on the IT companies. Due to travel restrictions, tourism activities almost completely shut down, and when restrictions were lowered there was a sudden increase in interest (Organic Searches). Tourism companies tried to increase their revenue as much as possible and ran multiple advertising campaigns, which also led to increasing costs for acquiring clients. Figure 7 displays the evolution of CPC over the years 2019–2023.
Table 14.
Pearson correlation coefficients for tourism agency in 2023.
Figure 7.
Evolution of CPC over the years 2019–2023.
A different approach in terms of Organic Searches is evident in Figure 8. Almost the same users searched for tourism packages exactly when the holiday should take place (during the summer months) in comparison with searches for IT components, which are more predominant in the colder months (as in Figure 8).
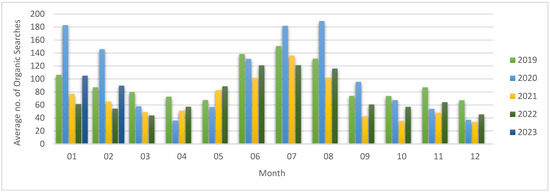
Figure 8.
Average monthly distribution of the Organic Searches.
Looking at Figure 8, one can observe that there is a significant seasonal pattern in data that is maintained in all years even during the COVID-19 period. We can observe that there is a higher search volume during summer months (June–August) than in cold season/months. Additionally, there is a slight increase in volume at the beginning of the year as this is the period for early booking.
Furthermore, there is a decline in search volumes from 2019 to 2020 in almost all months after March 2020 due to the COVID-19 pandemic effects related to travel restrictions, except in the summer months, when some restrictions were relaxed after the first lockdown. During the following years, one can see an increasing tendency, but still below the volumes recorded in 2019 and beginning of 2020.
The average monthly distribution of the Users chart (Figure 9) expresses the same seasonality patterns as Organic Searches, with the highest volumes in the summer months. Unlike Organic Searches, the distribution of the Users chart has also the influence of paid campaigns as we can observe in the autumn months of 2020 and 2021, when the company invested more in advertising (also due to COVID-19 pandemic influence) than before the pandemic and 2022.

Figure 9.
Average monthly distribution of the Users.
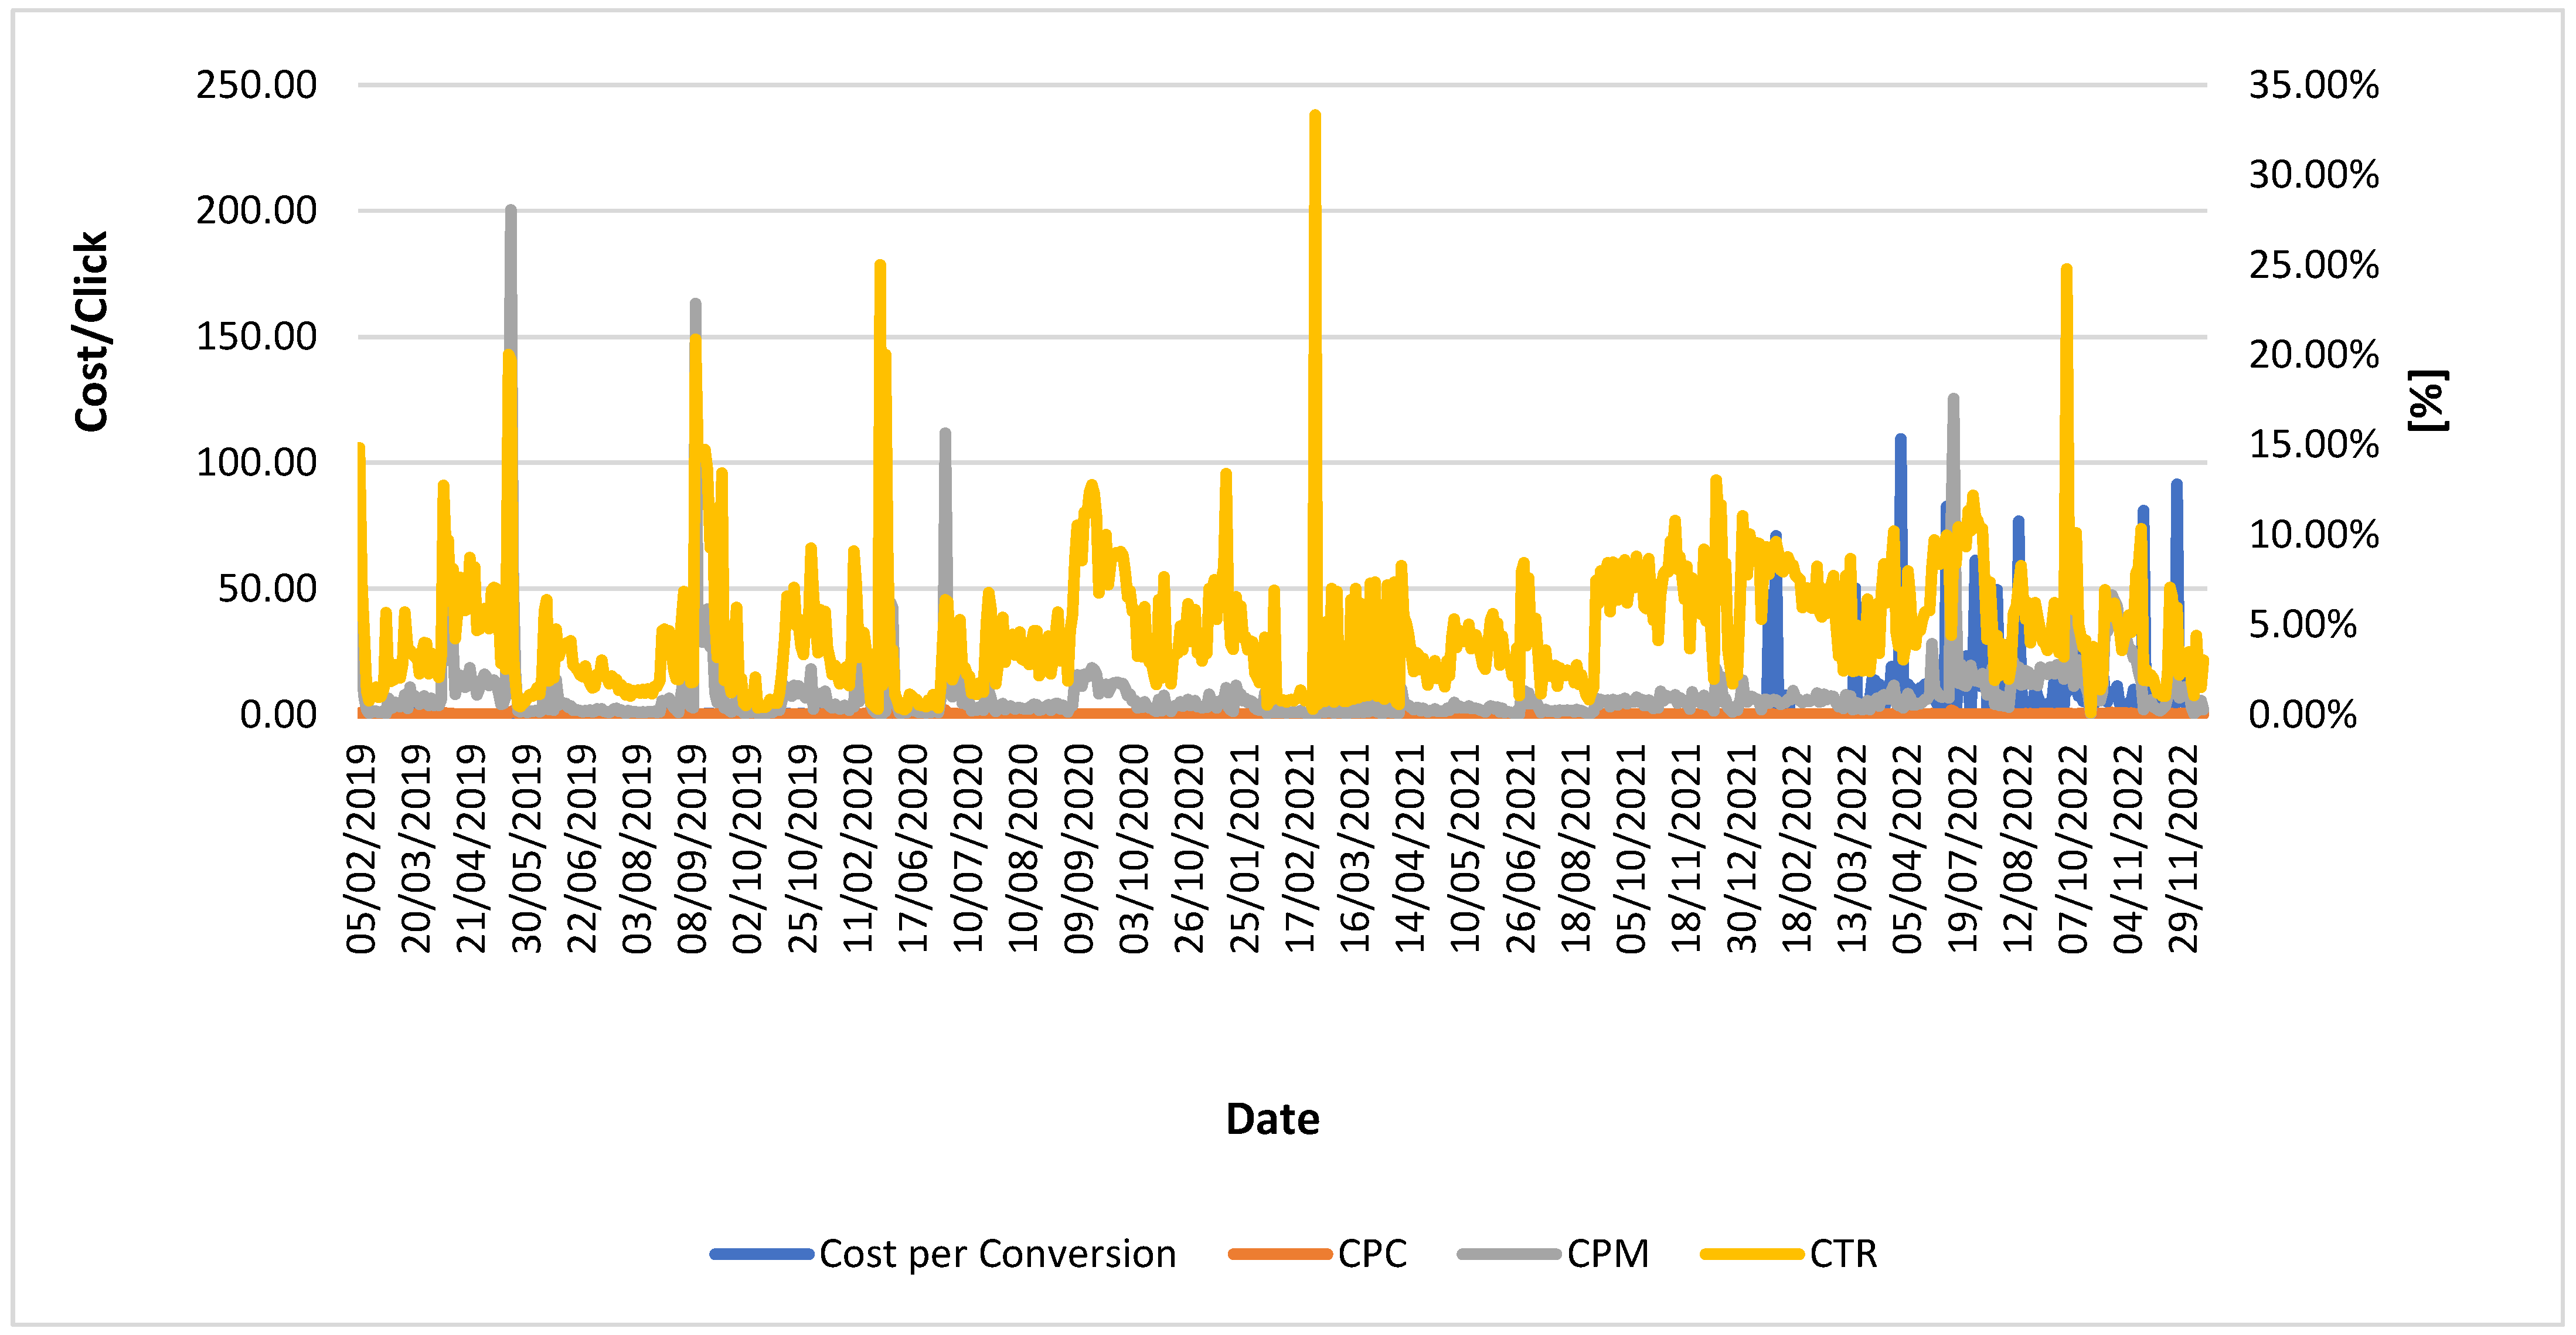
In the evolution of Cost per Conversion (Figure 10), we notice CTR depends usually on the specific campaign but on average remained the same in all periods. We notice an increase in CPC during the end of 2022 as the majority of companies in tourism increased their advertising budgets.
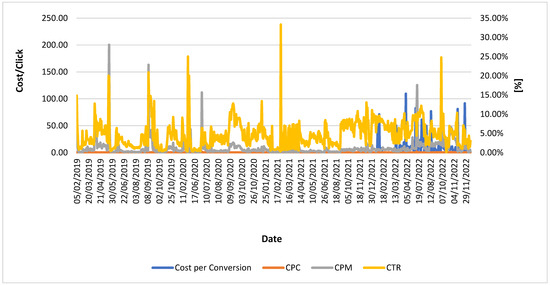
Figure 10.
Evolution of Cost per Conversion, CPC, CPM, CTR.
From Figure 11, we can see the there is a high variation in goal completion and it was tracked mainly in 2019. The Avg. Time on Page has some small fluctuations from month to month but generally is consistent. The number of users has a considerable variation during the studied interval, but we can notice the period between the summer of 2020 and the beginning of 2022 where the numbers were higher as restrictions were lowered after the lockdown period, a period during which that company invested more in advertising campaigns.
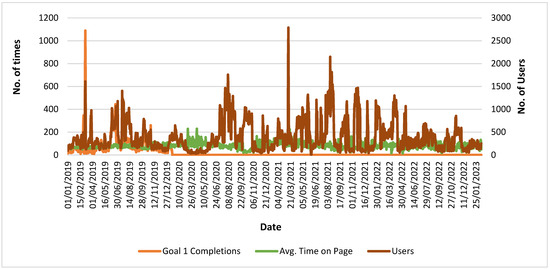
Figure 11.
Evolution of Goal 1 Completions, Avg. Time on Page, Users.
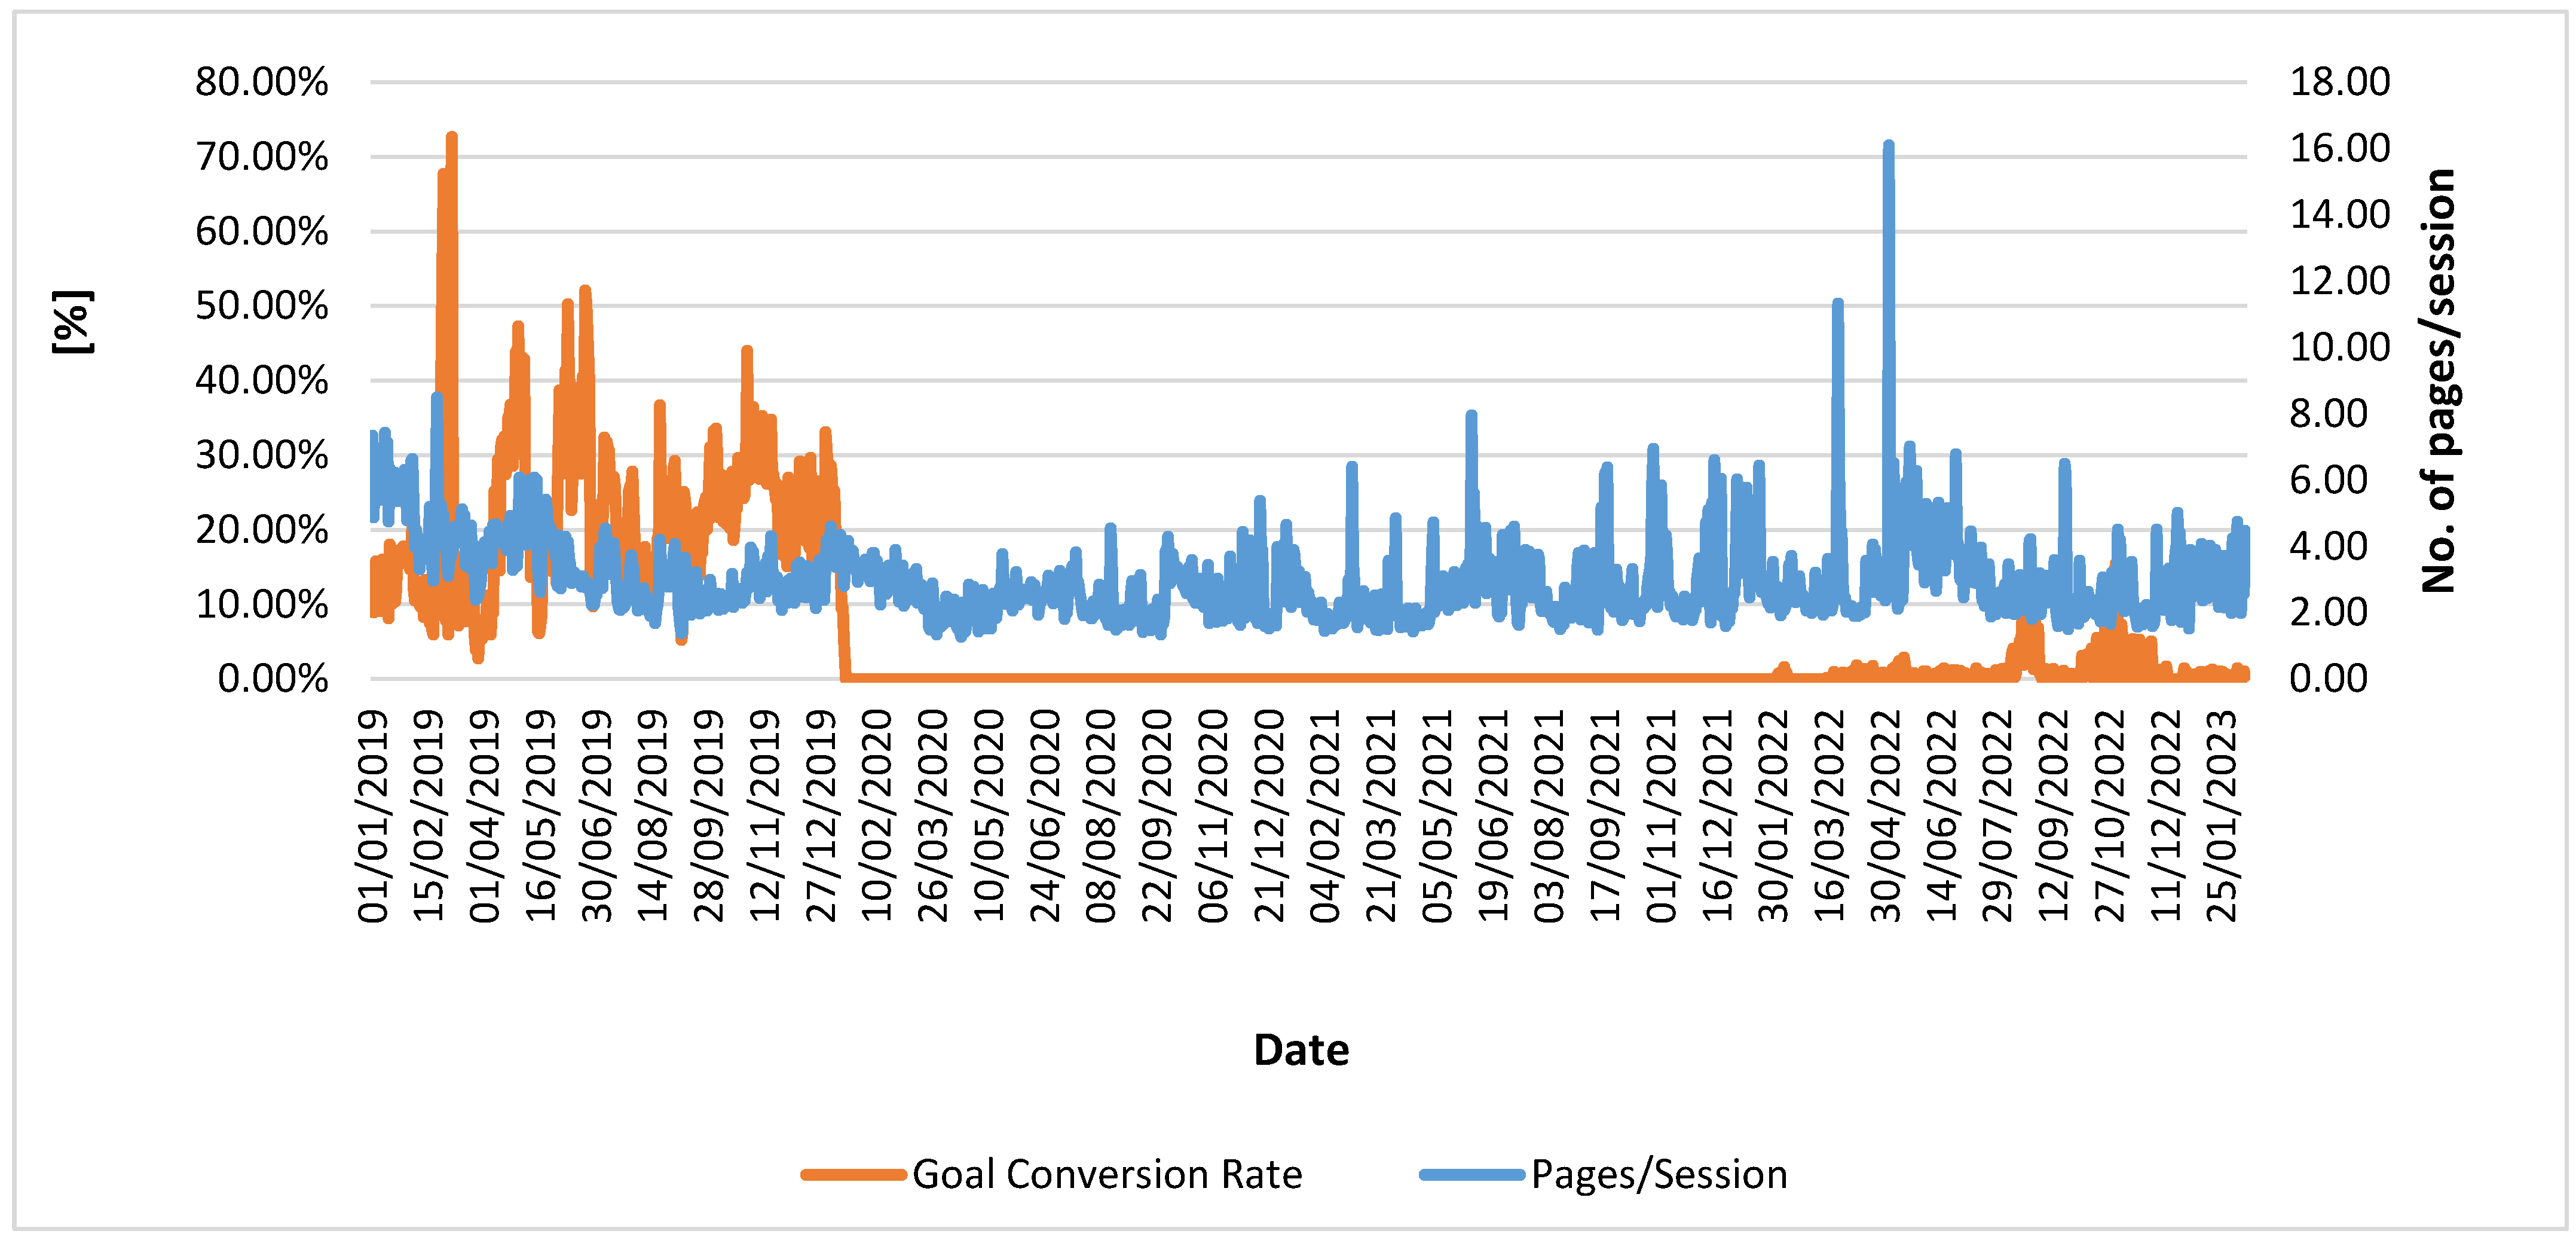
From Figure 12, we can see that the conversion rate was higher during 2019 and starting to gradually increase in 2022, but it was still well below the pre-pandemic period. Also, on average, the number of pages viewed by users during visits on-site was constant with some punctual spikes correlated with the increase in traffic due to campaigns.
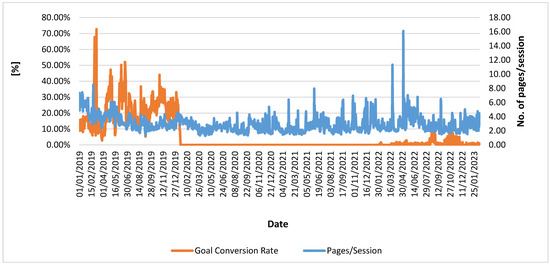
Figure 12.
Evolution of Goal Conversion Rate and Pages/Users.
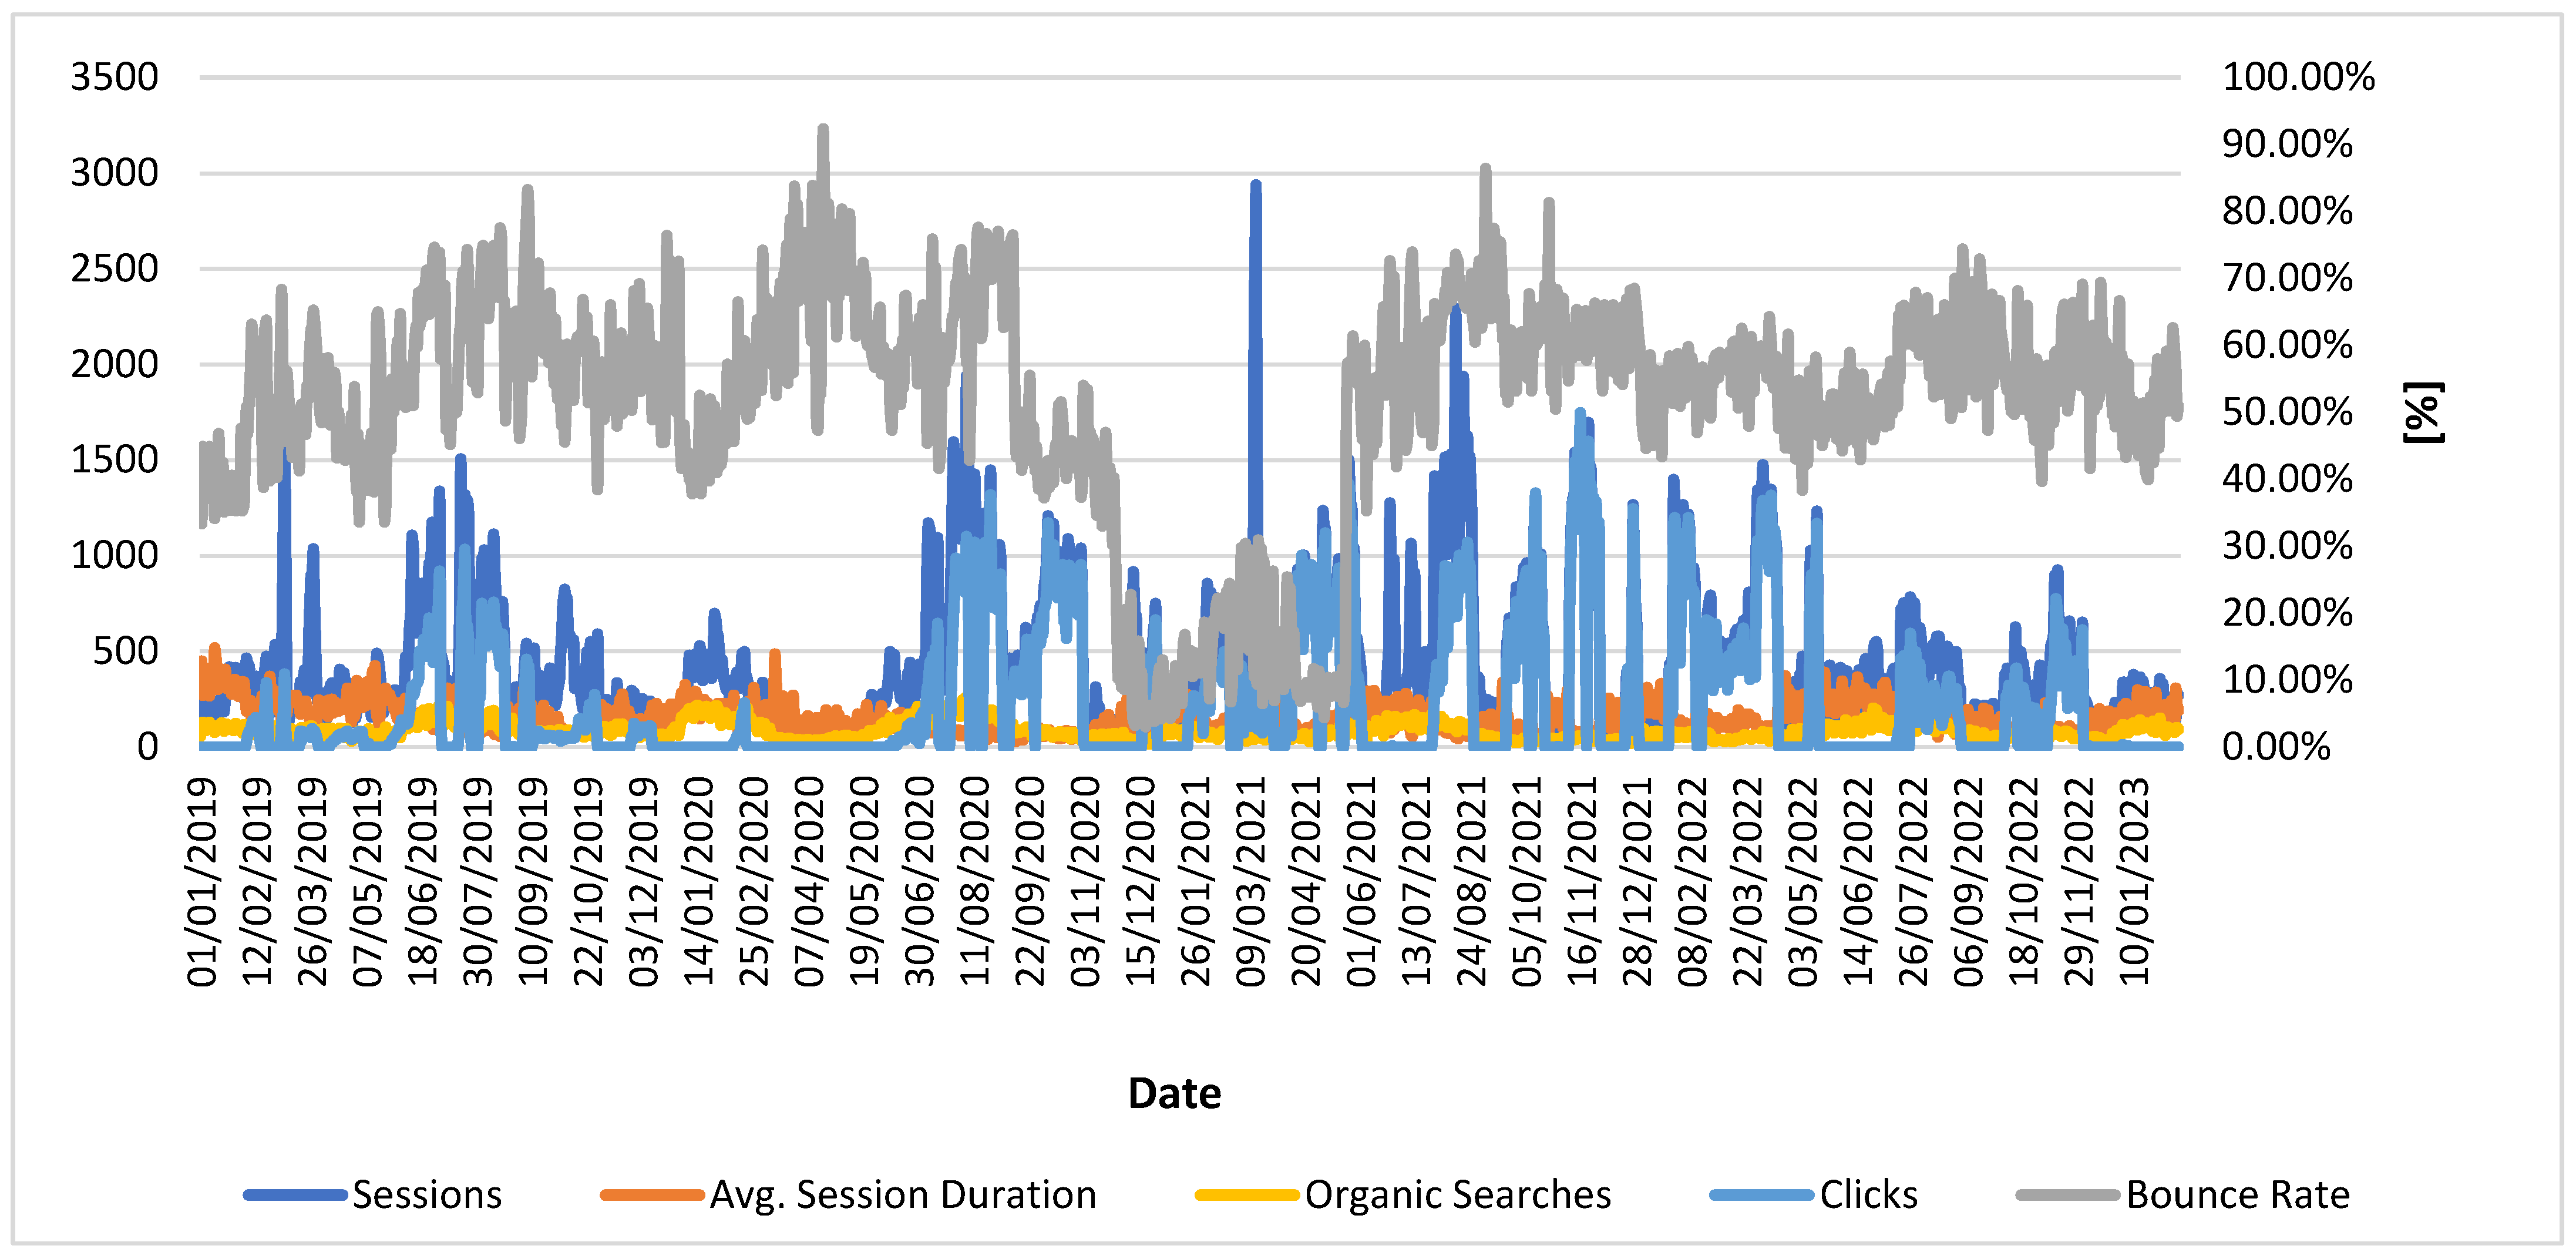
Studying the Evolution of Sessions, Avg. Session Duration, Organic Searches, Clicks, and Bounce Rate (as in Figure 13), we can notice that there is an inverse correlation between the Number of Sessions, Users, and Bounce Rate. Bounce Rate variation was greater between the years 2019–2021, and, moreover, we notice a more constant pattern in 2022 and forward. But during these periods, we notice a much lower Bounce Rate corresponding with higher volumes of traffic. Overall, the average Bounce Rates remain the same for the entire 3-year interval. When there is no influence of advertising, actually there is a direct correlation between Avg. Session Duration, Organic Searches, Sessions, and Clicks.
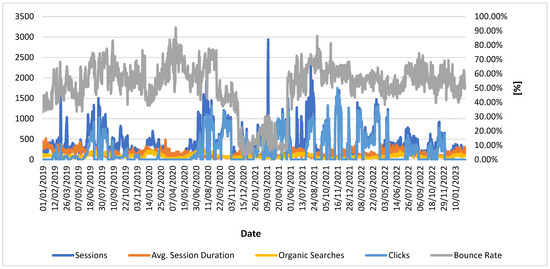
Figure 13.
Evolution of Sessions, Avg. Session Duration, Organic Searches, Clicks, Bounce Rate.
To further explore the correlations already identified, as well as other possible interconnections, we proceeded by conducting a series of ANOVA analyses on the data obtained from the GA for the IT shop.
Given the nature of the data and the context, ANOVA is typically used to compare means across different groups. From the literature review of similar analyses, we identified some potential analyses we might consider:
Time Metrics: Analyzing the average times (like “Avg. Document Content Loaded Time”, “Avg. Document Interactive Time”, and “Avg. Page Load Time”) across different months or years would help us understand if there are significant differences in load times across different time periods, which could be influenced by factors like website updates, server changes, or increased traffic.
Engagement Metrics: Metrics like “Entrances”, “Session Duration”, “Sessions”, “Unique Page Views”, and “Users” can be analyzed across different months or years to see if there are significant changes in user engagement over time.
Search Metrics: “Organic Searches” can be analyzed across different months or years to understand if there is a significant change in how users are finding the site through search engines.
Given the context of the article theme, we were interested in seeing if there were significant changes in user engagement (like “Sessions” or “Users”) or website performance (like “Avg. Page Load Time”) during the lockdown periods compared to other times.
The ANOVA analysis for the “Sessions” metric across different years has been performed. The results are showcased in Table 15:
Table 15.
The ANOVA analysis results for the “Sessions” metric across different years.
The F-statistic is 305.092, which is quite large, indicating that there are significant differences in the number of sessions across the years. The p-value is extremely small (3.92929 × 10−192), which is way below the common alpha level of 0.05. This means that the differences in the number of sessions across the years are statistically significant. This suggests that there were significant changes in user engagement (as measured by the number of sessions) over the years. This could be influenced by various factors, including the impact of lockdowns.
We intended to analyze the changes between all dataset years, so we performed pairwise comparison using Tukey’s HSD test for the “Sessions” metric across different years. The results can be seen in Table 16:
Table 16.
The results of pairwise comparison using Tukey’s HSD test for the “Sessions” metric across different years.
Performing the comparison, we can note that the “Reject Null Hypothesis” column indicates whether the mean number of sessions is significantly different between the two years being compared. A “Yes” means there is a significant difference, while a “No” means there is not. For instance, there is a significant increase in the number of sessions from 2019 to 2021 and 2019 to 2022. However, there is no significant difference between 2019 and 2020 or 2019 and 2023. Similarly, there is a significant decrease in sessions from 2022 to 2023.
These results provide insights into how user engagement, as measured by the number of sessions, changed over the years. This is particularly useful in understanding the impact of events like lockdowns on user engagement.
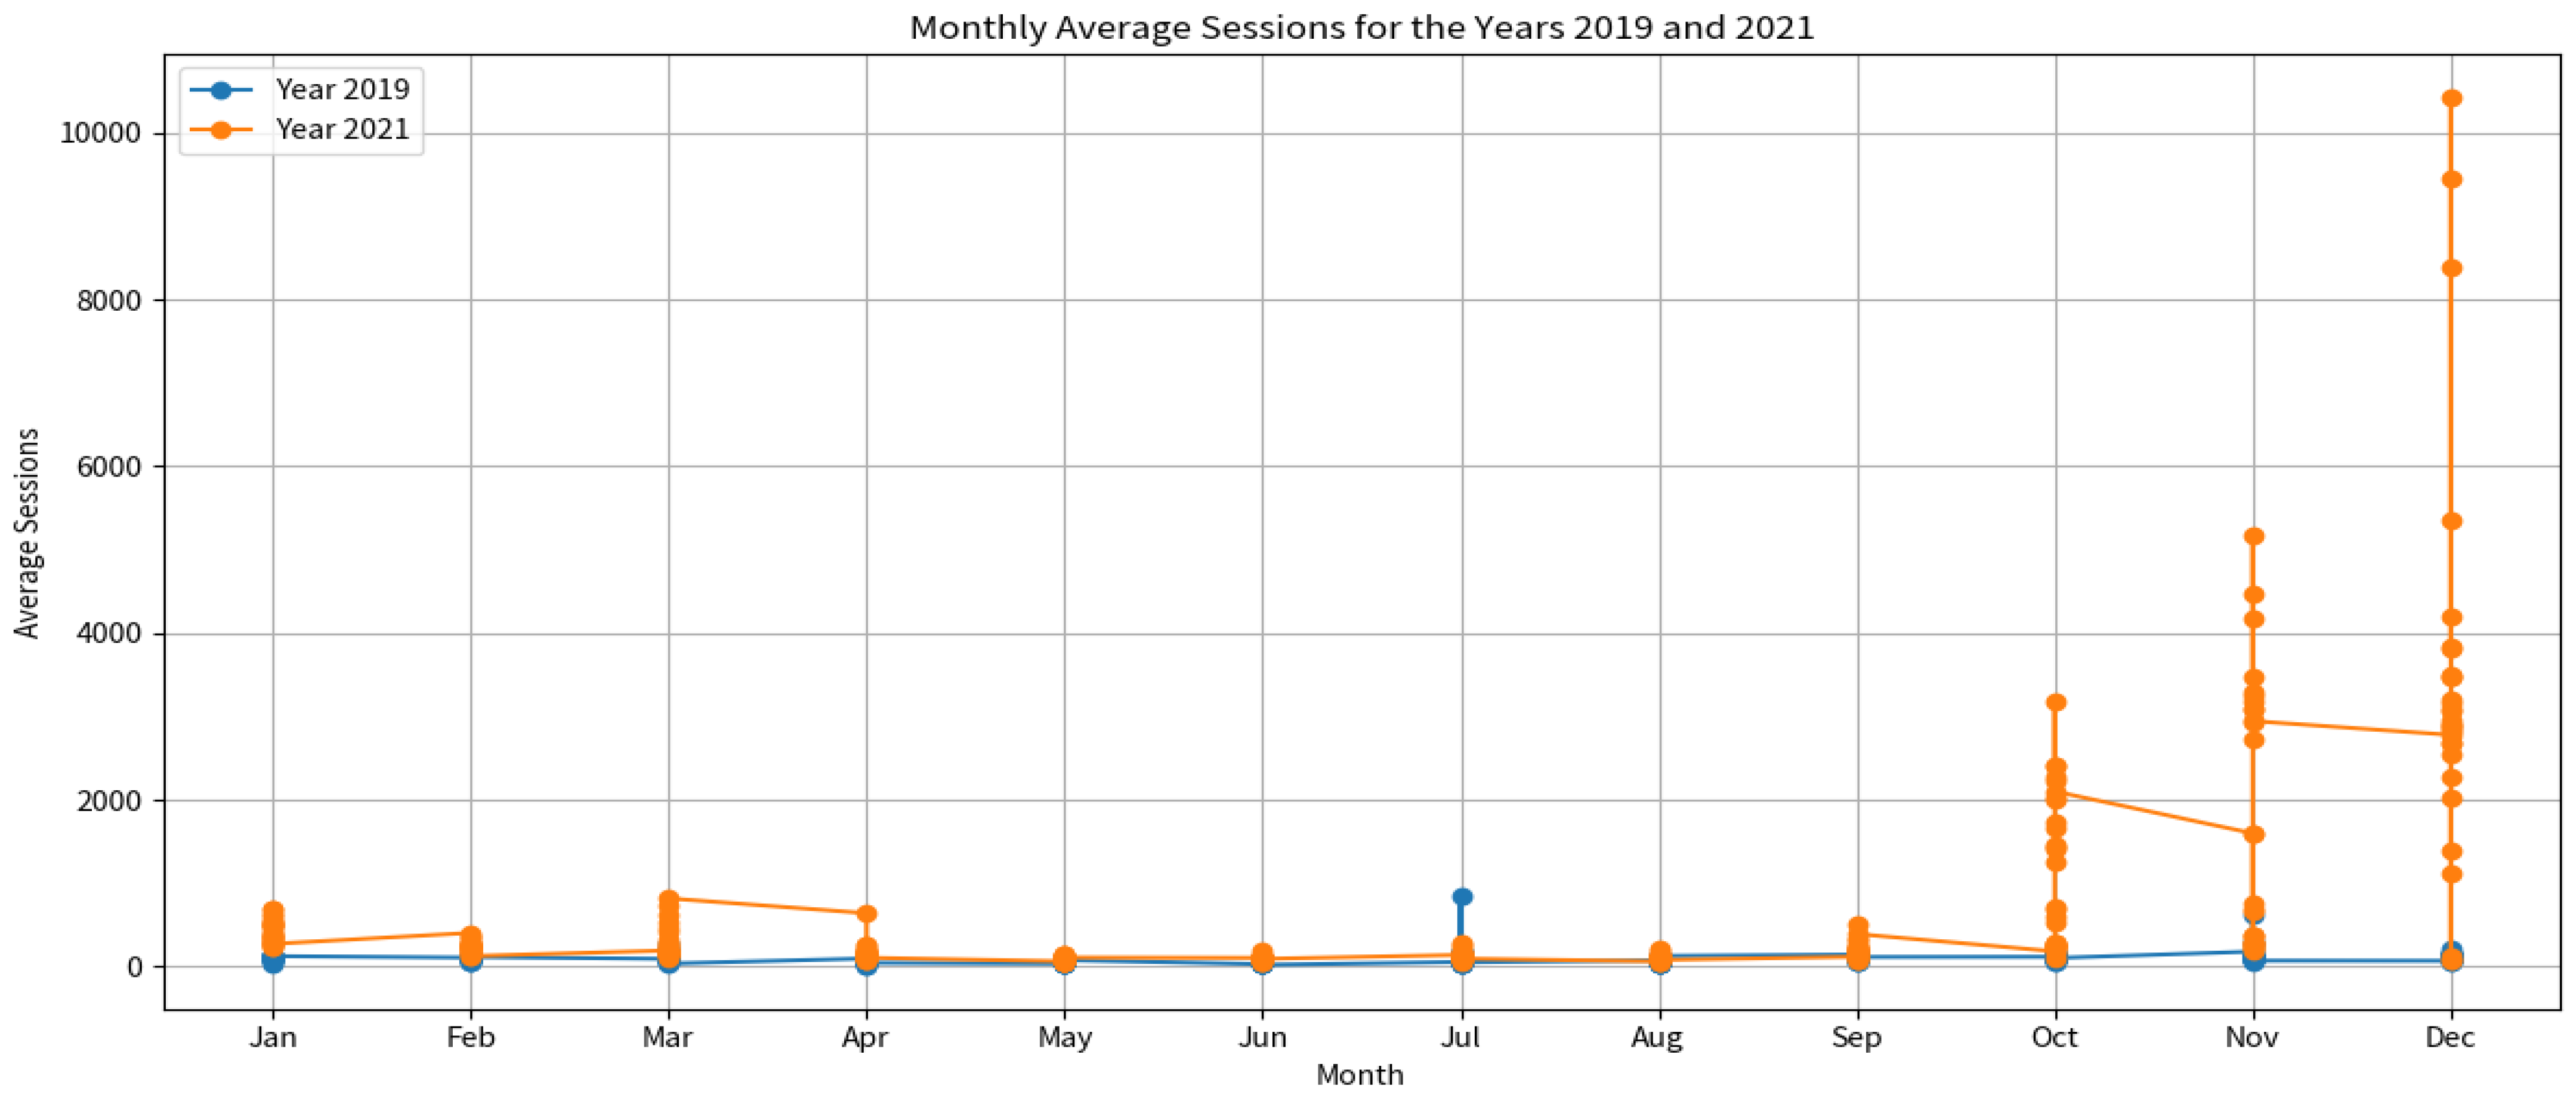
As we intended to compare the pre-pandemic period with effects of the pandemic period, we further compared for the years 2019 and 2021. The visualization of the monthly average sessions for the years 2019 and 2021 is given in Figure 14:
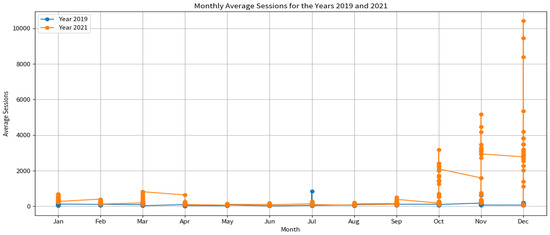
Figure 14.
The monthly average sessions for the years 2019 and 2021.
In 2019, there is a relatively steady number of sessions throughout the year, with a slight increase towards the end. In 2021, there is a noticeable increase in sessions starting from January, peaking around April, then showing a decline towards the end of the year. This trend in 2021 could be influenced by various factors, including the impact of lockdowns, changes to the website, marketing campaigns, or other external events.
To further this analysis, we looked into descriptive statistics for the number of sessions in these years and explored specific months, as shown in Table 17.
Table 17.
The descriptive statistics for the number of sessions in the years 2019 and 2021.
These statistics further emphasize the significant increase in user engagement in 2021 compared to 2019. The high standard deviation in 2021 suggests that there were specific days or periods with a surge in user activity, which could be related to external events or factors. As we already discussed earlier, there were some infrastructure anomalies during some time periods.
The months in 2021 with the highest average sessions are December—average of 3338.65 sessions; November—average of 1692.83 sessions; October—average of 1069.32 sessions. These months, especially December, saw a significant surge in user activity compared to the rest of the year. This could be attributed to various factors such as marketing campaigns, promotions, website updates, or external events. To understand the reasons behind these spikes, we can correlate these months with the IT sector promotional period and high sales seasonality.
We further continue with ANOVA analysis for the “Users” metric across different years. The results are showcased in Table 18:
Table 18.
The results of ANOVA analysis for the “Users” metric across different years.
The F-statistic is 306.661, indicating that there are significant differences in the number of users across the years. The p-value is extremely small (6.98898 × −193), which is way below the common alpha level of 0.05. This means that the differences in the number of users across the years are statistically significant.
We continued with the pairwise comparison using Tukey’s HSD test for the “Users” metric between the years 2019 and 2021, as shown by Table 19.
Table 19.
The results of pairwise comparison using Tukey’s HSD test for the “Users” metric between the years 2019 and 2021.
The mean difference in the number of users between 2019 and 2021 is 535.68. The p-value is 0.0, which is below the common alpha level of 0.05. This means that the difference in the number of users between 2019 and 2021 is statistically significant.
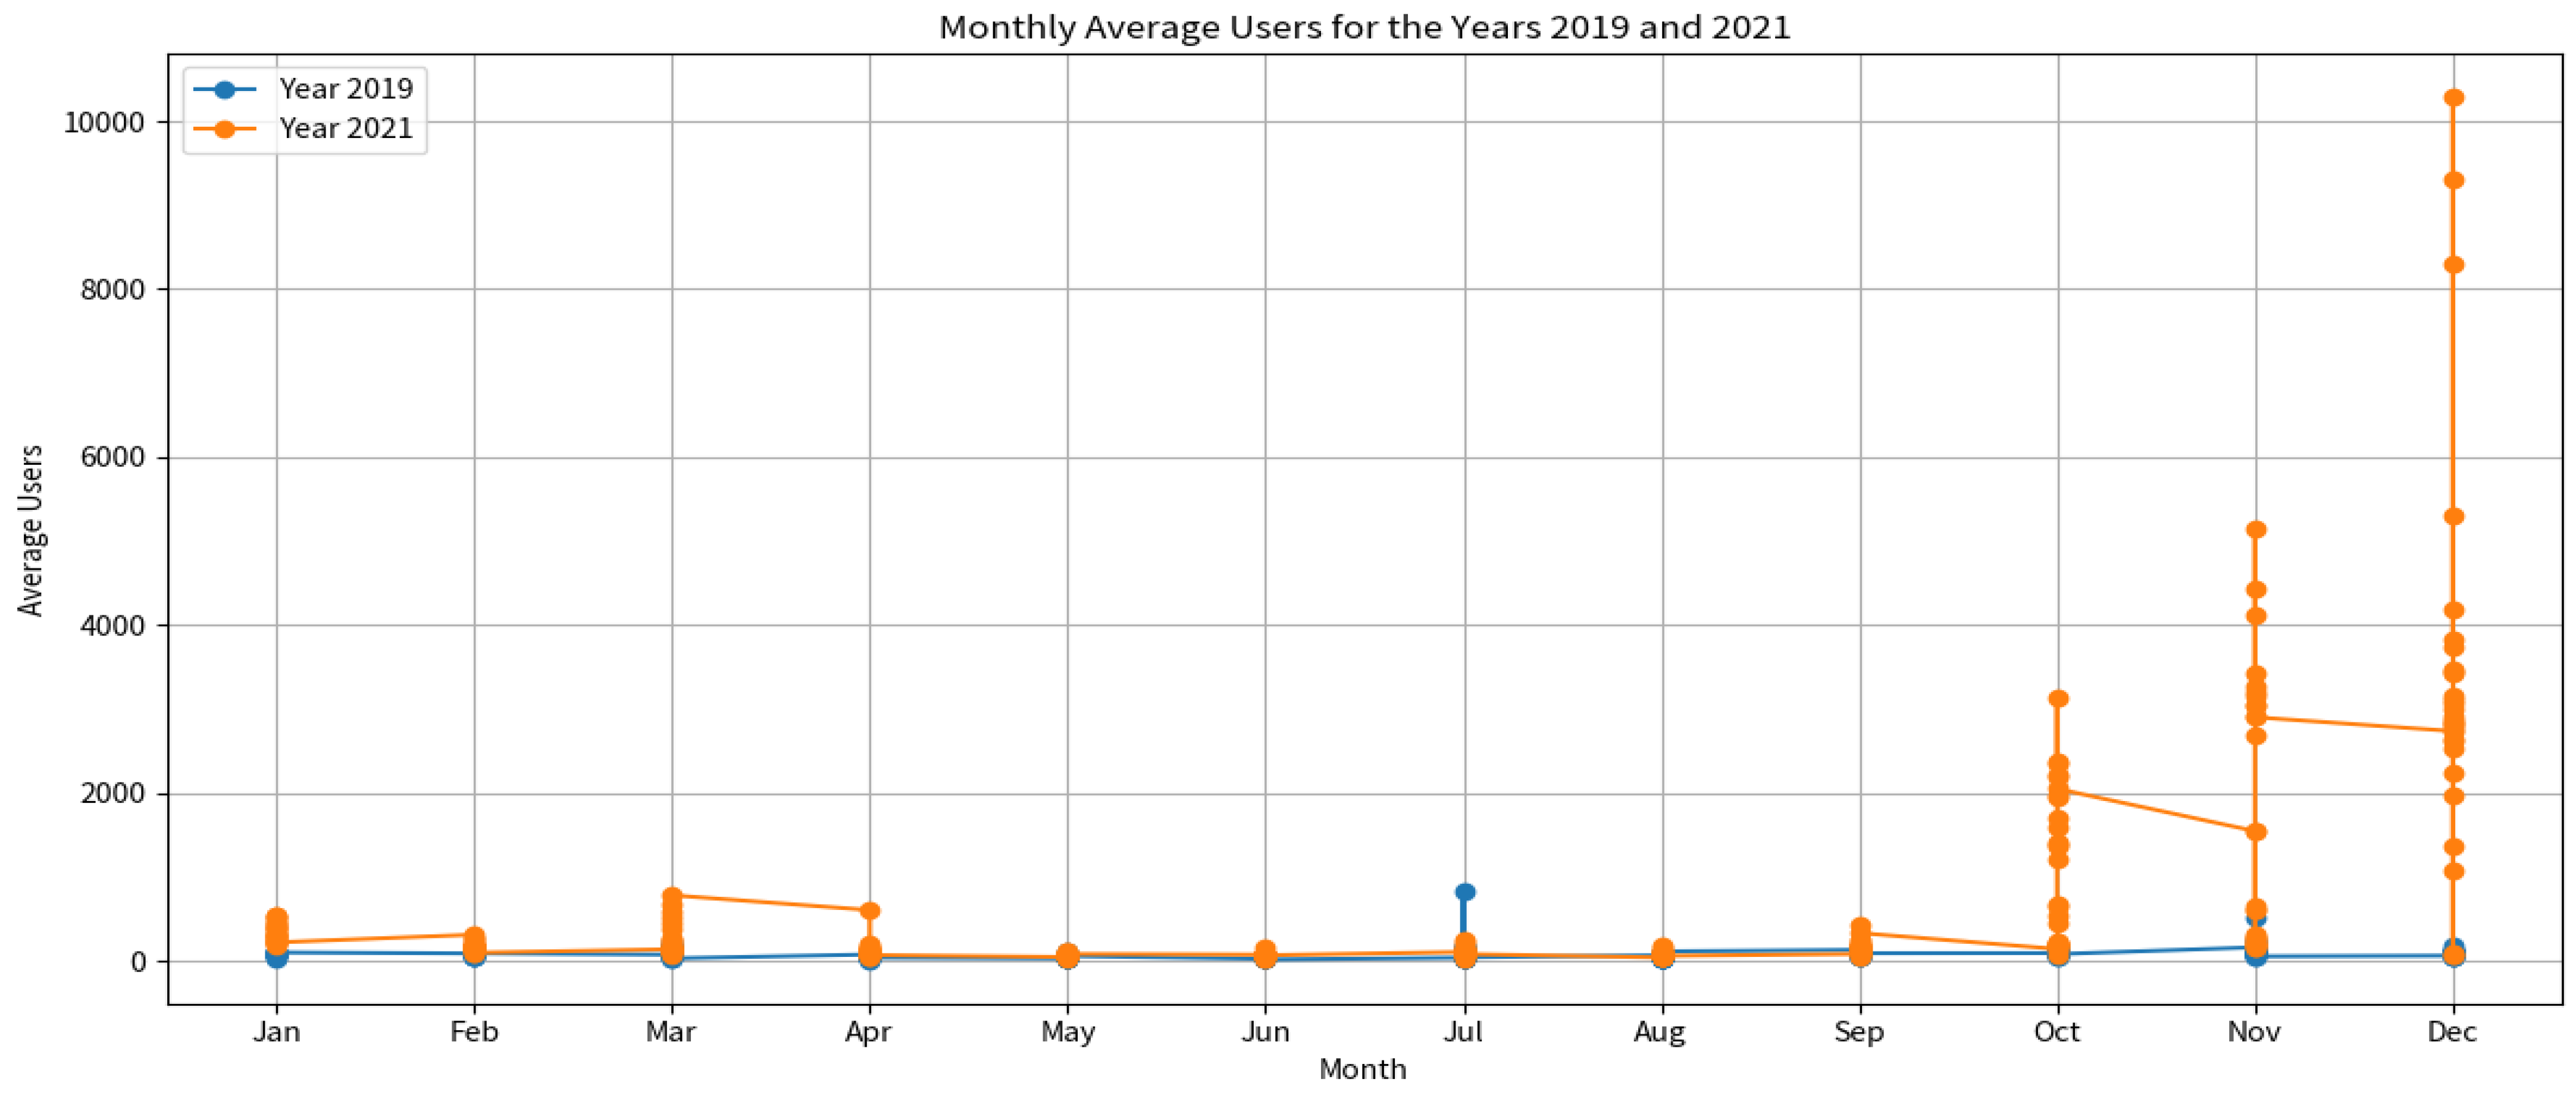
The trends for Monthly Average Users for 2019 and 2021 are presented in Figure 15.
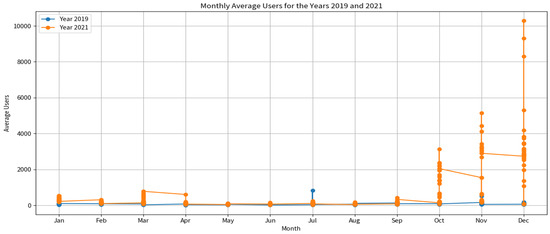
Figure 15.
The monthly average users for the years 2019 and 2021.
In 2019, the number of users remains relatively consistent throughout the year, with some fluctuations. In 2021, there is a noticeable increase in users starting from January, peaking around April, and then showing a decline towards the end of the year. Similar to the “Sessions” metric, this trend in 2021 is influenced by various factors, including the impact of lockdowns, changes to the website, marketing campaigns, and specific industry seasonality.
Below, in Table 20, are the descriptive statistics for the number of users in the years 2019 and 2021.
Table 20.
The descriptive statistics for the number of users during 2019 and 2021.
The months in 2021 with the highest average users are December—average of 3294.55 users; November—average of 1645.6 users; October—average of 1023.65 users. These months, especially December, saw a significant surge in user activity compared to the rest of the year. As with the “Sessions” metric, this could be attributed to various factors, such as marketing campaigns, promotions, website updates, or external events.
To provide a comprehensive comparison, we analyzed the three metrics “Sessions,” “Users,” and “Organic Searches” for the months of October, November, and December in 2021 by descriptive statistics and visual comparison. The results were as follows: Sessions—there is a clear upward trend from October to December, with December having the highest number of sessions; Users—the trend for users is similar to sessions, with a noticeable increase from October to December; and Organic Searches—the number of organic searches also shows an upward trend in the first two months, with December having a lower count.
The results for the same analysis for October, November, and December 2019 were as follows: Sessions—the number of sessions remains relatively consistent across the three months, with an increase in the November/Black Friday promotion period; Users—the trend for users is similar to sessions, with an increase in November; and Organic Searches—the number of organic searches remains relatively stable across the three months.
Compared to 2021, the metrics for 2019 show more stability and less variability. The significant spikes observed in 2021, especially in December, are not present in 2019. This suggests that there were specific factors or events in 2021 that led to increased user engagement and organic visibility.
We also looked at the percentage change in the metrics “Sessions,” “Users,” and “Organic Searches” from 2019 to 2021 for the months of October, November, and December. The results are showcased in Table 21:
Table 21.
“Sessions,” “Users,” and “Organic Searches” for October, November, and December 2019 vs. 2021.
We observed the following: Sessions—there is a substantial increase in the number of sessions in all three months in 2021 compared to 2019. The increase is most pronounced in December, with a staggering 2822.02% growth; Users—similar to sessions, the number of users has seen a massive surge in 2021. December again leads with a 3295.31% increase compared to the same month in 2019; and Organic Searches—interestingly, while sessions and users have seen a significant rise, organic searches decreased in October and December of 2021 compared to 2019. This suggests that while more users are visiting the site and engaging in sessions, they might be coming from sources other than organic searches, such as direct links, referrals, or paid campaigns.
The data indicate that while the website experienced a tremendous increase in user engagement in 2021, it might need to focus on improving its organic search visibility.
In summary, while there is a clear surge in user engagement in 2021, especially in December, the organic search performance does not show a corresponding increase. This could indicate that the growth in user engagement might be driven by factors other than organic search, such as marketing campaigns, direct traffic, or referrals.
We also performed intercorrelation analysis to understand the relationships between multiple variables in a dataset. If many variables are highly correlated with each other, it can indicate multicollinearity, which can be problematic in certain analyses, especially regression.
Scarpello’s adaptation of the one-factor test is a method to detect multicollinearity. The procedure involves the following:
Factor Analysis: Conduct a factor analysis on the variables.
Examine the Eigenvalues: If the first eigenvalue from the factor analysis is substantially larger than the others, it indicates that a single factor (or a few factors) is accounting for most of the variance in the data, suggesting multicollinearity.
We proceeded with the intercorrelation analysis using Scarpello’s adaptation of the one-factor test on the relevant metrics from the dataset.
The eigenvalues obtained from the factor analysis on the selected metrics are as follows: [0.366, 0.342, 0.380, 0.630, 0.219, 0.278, 0.667, 0.219, 0.226, 0.219]. The eigenvalues are not substantially different from each other. There is not a single eigenvalue that is much larger than the others. Based on Scarpello’s adaptation of the one-factor test, the absence of a single dominant eigenvalue suggests that there is not a strong indication of multicollinearity among the selected metrics. This means that no single factor is accounting for most of the variance in the data.
Scarpello’s adaptation of the one-factor test provides a few more diagnostic measures to assess multicollinearity as follows: Percentage of Variance Explained by the First Factor—if a single factor explains a large portion of the variance (e.g., more than 50%), it is an indication of multicollinearity; Condition Index—it is the square root of the ratio of the largest eigenvalue to each successive eigenvalue. A condition index greater than 30 is often considered a sign of severe multicollinearity; Variance Proportions—for each variable, the proportion of its variance that is associated with each factor. If a variable has a large variance proportion associated with the first factor, it is influenced by multicollinearity.
These are the additional diagnostic measures based on Scarpello’s adaptation of the one-factor test:
Percentage of Variance Explained by the First Factor: 62.16%—the first factor explains a significant portion of the variance, which is more than 50%. This suggests potential multicollinearity.
Condition Indices. The condition indices for the metrics are as follows: [1.0, 1.04, 0.98, 0.76, 1.29, 1.15, 0.74, 1.29, 1.27, 1.29]. None of the condition indices exceed the threshold of 30, indicating that severe multicollinearity is not present based on this criterion.
Variance Proportions for the First Factor: The variance proportions associated with the first factor for the metrics are [0.092, 0.100, 0.092, 0.017, 0.141, 0.136, 0.0004, 0.141, 0.139, 0.141]. Several metrics have a large variance proportion associated with the first factor, suggesting they are influenced by multicollinearity. The significant percentage of variance explained by the first factor and the high variance proportions for several metrics suggest potential multicollinearity.
However, the condition indices do not indicate severe multicollinearity.
In conclusion, while there are indications of multicollinearity among some of the metrics, it may not be severe.
5. Conclusions
This article presented how traffic data obtained from Google Analytics over the last four years for two companies in two very common categories (tourism products and services and IT products and services) can be effectively used to obtain insights beyond the usual uses for such data. We thus tried to determine how customer buying behavior changed during the COVID-19 pandemic and to what extent these changes persisted after the end of the pandemic.
In order to answer such questions, it is important to find out relevant identifiers of consumer behavior. To this end, based on the web traffic data available for the two companies with different profiles, we were able to test five working hypotheses:
H0:
The following GA metrics, Avg. Document Content Loaded Time (s), Avg. Document Interactive Time (s), and Avg. Page Load Time (s) reflect the site performance.
H1:
The following GA metrics, Organic Searches, Entrances, Entrances/Page Views, Session Duration, Sessions, and Unique Page Views, reflect the access to the website.
H2:
The following GA metrics, Session Duration, Sessions, and Unique Page Views, reflect the users’ behavior.
H0′:
The following GA metrics, Sessions, Avg. Session Duration, Avg. Time on Page, Pages/Session, Bounce Rate, Clicks, Goal 1 Completions, Goal Conversion Rate, and CTR, reflect the users’ behavior.
H1′:
The following GA metrics, Cost per Conversion, CPC, CPM, and ROI, reflect the marketing.
By empirically grouping the GA metrics for each of the two small businesses—as some of them are applicable only for the tourism products and services (it is the only one that ran marketing campaigns tracked via Google Analytics during the period considered)—we formulated the above-mentioned hypotheses considering the intrinsic meaning of the GA metrics and tested whether each group reflected a concept or a latent factor. We checked at the annual level whether the intercorrelations of the metrics within the same group were significant. As illustrated in the literature review, this approach is similar to other statistical measurements methods, such as confirmatory factor analysis, which processes responses from surveys or questionnaires, or natural language processing techniques, such as latent Dirichlet allocation that identifies topics out of large datasets in text format.
The direct findings were the following: (a) except H1, all hypotheses are valid; (b) H0 and H2 reflect the site performance and users’ behavior as the correlations are prevalent at these groups’ level. At the second group level which reflects the access to the website, the correlations are missing in 2019 and 2023 or are limited as in 2020 and 2022. In 2021, even for the second group of metrics, the correlations are stronger and more numerous; (c) H1 is a composite image of the customers’ activity on the companies’ websites; (d) H0′ and H1′ reflect the users’ behavior and marketing campaigns as the correlations at the groups’ level are prevalent. It can be seen that 2021 was an atypical year with multiple stronger correlations than the rest of the years for both companies reflecting the effects of the COVID-19 lockdowns.
Once we concluded that we can construct relevant identifiers of consumer behavior based on the available data, we were able to draw, as applications of these identifiers, some derived conclusions or practical implications, such as (a) customer shopping behavior was indeed significantly influenced during the pandemic period, both in terms of product categories targeted as a priority and in terms of preference for e-commerce over traditional commerce; (b) there were both similarities and significant differences between the two types of companies analyzed; (c) after the perceived end of the pandemic, the preference for e-commerce has declined sharply, but not to pre-pandemic levels, so we can say with some degree of certainty that there will be persistent, even if not extreme, effects on customer shopping behavior; (d) the period between half of 2020 and 2021 was a non-typical period for multiple business areas as it corresponded with the period of lockdown and other restrictions related to the pandemic. But in the case of IT companies, especially the hardware industry, the influence was much higher, as due to online school and remote working, people needed much more equipment, so there was an increase in traffic, organic searches, and clicks on the website. Due to the pandemic situation on the other side, there were issues related to hardware supply so many companies could not satisfy the demand so there was no need for usual advertising campaigns; and (e) for the tourism industry, the same pandemic period had a completely different effect than for IT companies. Due to travel restrictions, tourism activities almost completely shut down, and when restrictions were lowered, there was a sudden increase in interest reflected by the Organic Searches metric. Tourism companies tried to increase their revenue as much as possible and ran multiple advertising campaigns which also lead to increasing costs for acquiring clients.
One limitation of this study is related to the area of applicability. We studied the GA metrics from two small businesses located in Romania. Therefore, as future work, we plan to extend our studies to small businesses in other countries in the region.
Also, future research could focus on the application of more advanced statistical models like MANOVA (multivariate analysis of variance) or mixed-effects models for a more nuanced understanding.
As for a closing conclusion, Scarpello’s adaptation of the one-factor test has not been extensively applied, until this study, to Google Analytics data, but its broader applications in related fields indicate a promising avenue for future research. Further empirical studies may validate and extend this methodology in the context of web analytics.
Author Contributions
Methodology, A.B.; Data curation, C.B.; Writing—original draft, S.-V.O.; Writing—review & editing, B.-G.T. All authors have read and agreed to the published version of the manuscript.
Funding
This work was supported by a grant from the Ministry of Research, Innovation and Digitization, CNCS-UEFISCDI, project number PN-III-P4-PCE-2021-0334, within PNCDI III.
Conflicts of Interest
The authors declare no conflict of interest.
References
- Delcea, C.; Cotfas, L.-A.; Crăciun, L.; Molănescu, A.G. New Wave of COVID-19 Vaccine Opinions in the Month the 3rd Booster Dose Arrived. Vaccines 2022, 10, 881. [Google Scholar] [CrossRef]
- Ionescu, Ș.; Chiriță, N.; Nica, I.; Delcea, C. An Analysis of Residual Financial Contagion in Romania’s Banking Market for Mortgage Loans. Sustainability 2023, 15, 12037. [Google Scholar] [CrossRef]
- Delcea, C.; Cotfas, L.-A.; Mierzwiak, R.; Ioanas, C. Grey Clustering of the Variations in Reverse Pyramid Boarding Method Considering Pandemic Restrictions. J. Grey Syst. 2022, 34, 53–69. [Google Scholar]
- Tao, H.; Sun, X.; Liu, X.; Tian, J.; Zhang, D. The Impact of Consumer Purchase Behavior Changes on the Business Model Design of Consumer Services Companies Over the Course of COVID-19. Front. Psychol. 2022, 13, 818845. [Google Scholar] [CrossRef] [PubMed]
- Accenture COVID-19: Impact on Consumer Behavior Trends|Accenture; 2020. Available online: https://www.accenture.com/dk-en/insights/consumer-goods-services/coronavirus-consumer-behavior-research (accessed on 13 March 2023).
- World Economic Forum. How Has Coronavirus Changed Consumer Spending?|World Economic Forum. Available online: https://www.weforum.org/agenda/2020/05/coronavirus-covid19-consumers-shopping-goods-economics-industry/ (accessed on 13 March 2023).
- Office of Advocacy. The Effects of the COVID-19 Pandemic on Small Businesses—SBA’s Office of Advocacy. Available online: https://advocacy.sba.gov/2021/03/02/the-effects-of-the-covid-19-pandemic-on-small-businesses/ (accessed on 13 March 2023).
- Acquila-Natale, E.; Chaparro-Peláez, J.; Del-Río-Carazo, L.; Cuenca-Enrique, C. Do or Die? The Effects of COVID-19 on Channel Integration and Digital Transformation of Large Clothing and Apparel Retailers in Spain. J. Theor. Appl. Electron. Commer. Res. 2022, 17, 439–457. [Google Scholar] [CrossRef]
- Blue, A. COVID-19 Has Changed Consumer Behavior. What Does It Mean for the Future?|University of Arizona News. Available online: https://news.arizona.edu/story/covid19-has-changed-consumer-behavior-what-does-it-mean-future (accessed on 13 March 2023).
- Dragotă, V.; Delcea, C. How Long Does It Last to Systematically Make Bad Decisions? An Agent-Based Application for Dividend Policy. J. Risk Financial Manag. 2019, 12, 167. [Google Scholar] [CrossRef]
- Boloș, M.-I.; Bradea, I.-A.; Delcea, C. Optimization of Financial Asset Neutrosophic Portfolios. Mathematics 2021, 9, 1162. [Google Scholar] [CrossRef]
- Scutariu, A.-L.; Șuşu, Ș.; Huidumac-Petrescu, C.-E.; Gogonea, R.-M. A Cluster Analysis Concerning the Behavior of Enterprises with E-Commerce Activity in the Context of the COVID-19 Pandemic. J. Theor. Appl. Electron. Commer. Res. 2021, 17, 47–68. [Google Scholar] [CrossRef]
- Boloș, M.-I.; Bradea, I.-A.; Delcea, C. Neutrosophic Portfolios of Financial Assets Minimizing the Risk of Neutrosophic Portfolios. Mathematics 2019, 7, 1046. [Google Scholar] [CrossRef]
- OECD. E-Commerce in the Time of COVID-19; OECD: Paris, France, 2020. [Google Scholar]
- UNCTAD. How COVID-19 Triggered the Digital and E-Commerce Turning Point; UNCTAD: Geneva, Switzerland, 2021. [Google Scholar]
- International Trade Administration. Impact of COVID Pandemic on eCommerce; International Trade Administration: Washington, DC, USA, 2021. [Google Scholar]
- Ellison, M.A. E-Commerce’s Impact on Small Business in the Age of COVID-19. The National Law Review, 22 February 2021. [Google Scholar]
- Morgan, B. More Customers Are Shopping Online Now Than at Height of Pandemic, Fueling Need for Digital Transformation. Available online: https://www.forbes.com/sites/blakemorgan/2020/07/27/more-customers-are-shopping-online-now-than-at-height-of-pandemic-fueling-need-for-digital-transformation/?sh=15f36a2c6bb9 (accessed on 13 March 2023).
- Charm, T.; Coggins, B.; Robinson, K.; Wilkie, J. The Great Consumer Shift: Ten Charts That Show How US Shopping Behavior Is Changing|McKinsey. Available online: https://www.mckinsey.com/capabilities/growth-marketing-and-sales/our-insights/the-great-consumer-shift-ten-charts-that-show-how-us-shopping-behavior-is-changing (accessed on 13 March 2023).
- Brewster, M. E-Commerce Sales Surged during the Pandemic. Available online: https://www.census.gov/library/stories/2022/04/ecommerce-sales-surged-during-pandemic.html (accessed on 13 March 2023).
- Torkington, S. We’re All Shopping More Online as Consumer Behaviour Shifts|World Economic Forum. Available online: https://www.weforum.org/agenda/2021/07/global-consumer-behaviour-trends-online-shopping/ (accessed on 13 March 2023).
- Gruntkowski, L.M.; Martinez, L.F. Online Grocery Shopping in Germany: Assessing the Impact of COVID-19. J. Theor. Appl. Electron. Commer. Res. 2022, 17, 984–1002. [Google Scholar] [CrossRef]
- Gomes, S.; Lopes, J.M. Evolution of the Online Grocery Shopping Experience during the COVID-19 Pandemic: Empiric Study from Portugal. J. Theor. Appl. Electron. Commer. Res. 2022, 17, 909–923. [Google Scholar] [CrossRef]
- Maria Haggerty. 4 Ways COVID-19 Has Changed Online Consumer Behavior|Inc.Com. Available online: https://www.inc.com/maria-haggerty/four-ways-covid-19-changed-online-consumer-behavior.html (accessed on 13 March 2023).
- Catherine Tymkiw. How Shopping Habits Changed Due to COVID-19. Available online: https://www.investopedia.com/how-shopping-habits-changed-due-to-covid-5186278 (accessed on 13 March 2023).
- Gramling, K.; Orschell, J.; Chernoff, J. How E-Commerce Fits into Retail’s Post-Pandemic Future. Available online: https://hbr.org/2021/05/how-e-commerce-fits-into-retails-post-pandemic-future (accessed on 13 March 2023).
- Jensen, K.L.; Yenerall, J.; Chen, X.; Yu, T.E. US Consumers’ Online Shopping Behaviors and Intentions During and After the COVID-19 Pandemic. J. Agric. Appl. Econ. 2021, 53, 416–434. [Google Scholar] [CrossRef]
- Yang, Y.; Chen, H.; Liang, H. Did New Retail Enhance Enterprise Competition during the COVID-19 Pandemic? An Empirical Analysis of Operating Efficiency. J. Theor. Appl. Electron. Commer. Res. 2023, 18, 352–371. [Google Scholar] [CrossRef]
- Wells, S. 6 Common Challenges New E-Commerce Businesses Face. Forbes, 14 December 2022. [Google Scholar]
- Ahmed, N. The Top 11 Ecommerce Challenges and How to Overcome Them. Available online: https://www.cloudways.com/blog/ecommerce-challenges/ (accessed on 13 March 2023).
- eMarspro. Top Challenges Faced by Small to Medium-Sized E-Commerce Businesses. Available online: https://www.linkedin.com/pulse/top-challenges-faced-small-medium-sized-e-commerce-businesses- (accessed on 13 March 2023).
- Post, J. Common E-Commerce Challenges Businesses Face. Available online: https://www.businessnewsdaily.com/6028-small-ecommerce-challenges.html (accessed on 13 March 2023).
- Raimi, L.; Panait, M.; Grigorescu, A.; Vasile, V. Corporate Social Responsibility in the Telecommunication Industry—Driver of Entrepreneurship. Resources 2022, 11, 79. [Google Scholar] [CrossRef]
- Dobrowolski, Z.; Drozdowski, G.; Panait, M. Understanding the Impact of Generation Z on Risk Management—A Preliminary Views on Values, Competencies, and Ethics of the Generation Z in Public Administration. Int. J. Environ. Res. Public Health 2022, 19, 3868. [Google Scholar] [CrossRef] [PubMed]
- Boloș, M.-I.; Bradea, I.-A.; Delcea, C. Linear Programming and Fuzzy Optimization to Substantiate Investment Decisions in Tangible Assets. Entropy 2020, 22, 121. [Google Scholar] [CrossRef]
- Cotfas, L.-A.; Delcea, C.; Nica, I. Analysing Customers’ Opinions Towards Product Characteristics Using Social Media. In Eurasian Business Perspectives; Springer: Berlin/Heidelberg, Germany, 2020; pp. 129–138. [Google Scholar] [CrossRef]
- Vailshery, L.S. Global Web Analytics Software Market Share 2022. Statista, 13 September 2022. [Google Scholar]
- IMARC Group. Web Analytics Market Share, Size, Growth, Opportunity and Forecast 2023–2028; IMARC Group: Brooklyn, NY, USA, 2022. [Google Scholar]
- Munde, S. Web Analytics Market Size, Outlook—2030—Market Research Future. Market Research Future, August 2023. Available online: https://www.marketresearchfuture.com/reports/web-analytics-market-9556(accessed on 1 March 2023).
- GlobeNewswire Web Analytics Global Market Report 2022. GlobeNewswire, 16 September 2022. Available online: https://www.globenewswire.com/news-release/2022/09/16/2517473/0/en/Web-Analytics-Global-Market-Report-2022.html(accessed on 1 March 2023).
- Mordor Intelligence. Web Analytics Market Analysis—Industry Report—Trends, Size & Share; Mordor Intelligence: Hyderabad, India, 2022. [Google Scholar]
- Taylor, V. 9 Amazing Ways to Use Google Analytics for E-Commerce. Available online: https://blog.wishpond.com/post/115675437814/google-analytics-ecommerce (accessed on 13 March 2023).
- Ugbaja, L. How to Set Up ECommerce Tracking in Google Analytics: 7 Tips from Experts. Databox Blog. Available online: https://databox.com/google-analytics-ecommerce-tracking (accessed on 13 March 2023).
- Ashraf, S. How to Set Up Ecommerce Tracking in Google Analytics [Guide]. Available online: https://www.cloudways.com/blog/ecommerce-tracking-in-google-analytics/ (accessed on 13 March 2023).
- Smith, R. A Basic Introduction To Google Analytics For Ecommerce. Available online: https://www.ekm.com/blog/ecommerce/google-analytics-ecommerce/ (accessed on 13 March 2023).
- Kumar, R.; Novak, J.; Tomkins, A. Structure and Evolution of Online Social Networks. In Link Mining: Models, Algorithms, and Applications; Springer: New York, NY, USA, 2010; pp. 337–357. ISBN 978-1-4419-6515-8. [Google Scholar] [CrossRef]
- Lee Rodgers, J.; Alan Nice Wander, W. Thirteen Ways to Look at the Correlation Coefficient. Am. Stat. 2012, 42, 59–66. [Google Scholar] [CrossRef]
- Clifton, B. Advanced Web Metrics with Google Analytics; Wiley: Hoboken, NJ, USA, 2012; 574p. [Google Scholar]
- Kaushik, A. Web Analytics 2.0: The Art of Online Accountability & Science of Customer Centricity; Wiley: Hoboken, NJ, USA, 2010; 475p. [Google Scholar]
- Spirtes, P.; Glymour, C.; Scheines, R. Causation, Prediction, and Search; MIT Press: Cambridge, MA, USA, 1993; Volume 81. [Google Scholar] [CrossRef]
- Montgomery, D.C. Design and Analysis of Experiments, 10th ed.; Wiley: Hoboken, NJ, USA, 2019; pp. 1–688. [Google Scholar]
- Chaffey, D.; Patron, M. From Web Analytics to Digital Marketing Optimization: Increasing the Commercial Value of Digital Analytics. J. Direct, Data Digit. Mark. Pract. 2012, 14, 30–45. [Google Scholar] [CrossRef]
- Glass, G.V.; Peckham, P.D.; Sanders, J.R. Consequences of Failure to Meet Assumptions Underlying the Fixed Effects Analyses of Variance and Covariance. Rev. Educ. Res. 1972, 42, 237–288. [Google Scholar] [CrossRef]
- Scarpello, V.; Vandenberg, R.J. The Satisfaction with My Supervisor Scale: Its Utility for Research and Practical Applications. J. Manage. 1987, 13, 447–466. [Google Scholar] [CrossRef]
- Scarpello, V.; Campbell, J.P. Job Satisfaction: Are all the parts there? Pers. Psychol. 1983, 36, 577–600. [Google Scholar] [CrossRef]
- Scarpello, V.; Carraher, S.M. Are Pay Satisfaction and Pay Fairness the Same Construct? A Cross-Country Examination among the Self-Employed in Latvia, Germany, the UK, and the USA. Balt. J. Manag. 2008, 3, 23–39. [Google Scholar] [CrossRef]
- Scarpello, V.; Campbell, J.P. Job Satisfaction and the Fit between Individual Needs and Organizational Rewards. J. Occup. Psychol. 1983, 56, 315–328. [Google Scholar] [CrossRef]
- Nielsen, J. Usability Engineering; Morgan Kaufmann: Cambridge, MA, USA, 1993; 358p. [Google Scholar]
- Oprea, S.-V.; Bâra, A. A Measurement Model for Electricity Consumers’ Awareness with Covariance Structure Analyses. A Solid Pillar for Boosting Demand Response Programs. Sustain. Energy Technol. Assess. 2022, 53, 102738. [Google Scholar] [CrossRef]
- Bâra, A.; Oprea, S.V. What Makes Electricity Consumers Change Their Behavior? Influence of Attitude and Perceived Impact of DR Programs on Awareness. Kybernetes 2023. ahead of print. [Google Scholar] [CrossRef]
- Jelodar, H.; Wang, Y.; Yuan, C.; Feng, X.; Jiang, X.; Li, Y.; Zhao, L. Latent Dirichlet Allocation (LDA) and Topic Modeling: Models, Applications, a Survey. Multimed. Tools Appl. 2019, 78, 15169–15211. [Google Scholar] [CrossRef]
- Blei, D.M.; Ng, A.Y.; Jordan, M.I. Latent Dirichlet Allocation. J. Mach. Learn. Res. 2003, 3, 993–1022. [Google Scholar] [CrossRef]
- Sharma, C.; Sharma, S. Sakshi Latent DIRICHLET Allocation (LDA) Based Information Modelling on BLOCKCHAIN Technology: A Review of Trends and Research Patterns Used in Integration. Multimed. Tools Appl. 2022, 81, 36805–36831. [Google Scholar] [CrossRef] [PubMed]


Disclaimer/Publisher’s Note: The statements, opinions and data contained in all publications are solely those of the individual author(s) and contributor(s) and not of MDPI and/or the editor(s). MDPI and/or the editor(s) disclaim responsibility for any injury to people or property resulting from any ideas, methods, instructions or products referred to in the content. |
© 2023 by the authors. Licensee MDPI, Basel, Switzerland. This article is an open access article distributed under the terms and conditions of the Creative Commons Attribution (CC BY) license (https://creativecommons.org/licenses/by/4.0/).