

A Two-Stage Nonlinear User Satisfaction Decision Model Based on Online Review Mining: Considering Non-Compensatory and Compensatory Stages


Abstract
:1. Introduction
2. Literature Review
2.1. User Satisfaction and User Preferencess
2.1.1. User Satisfaction
2.1.2. User Preferences
2.2. Post-Purchase Evaluation Decision-Making Behavior
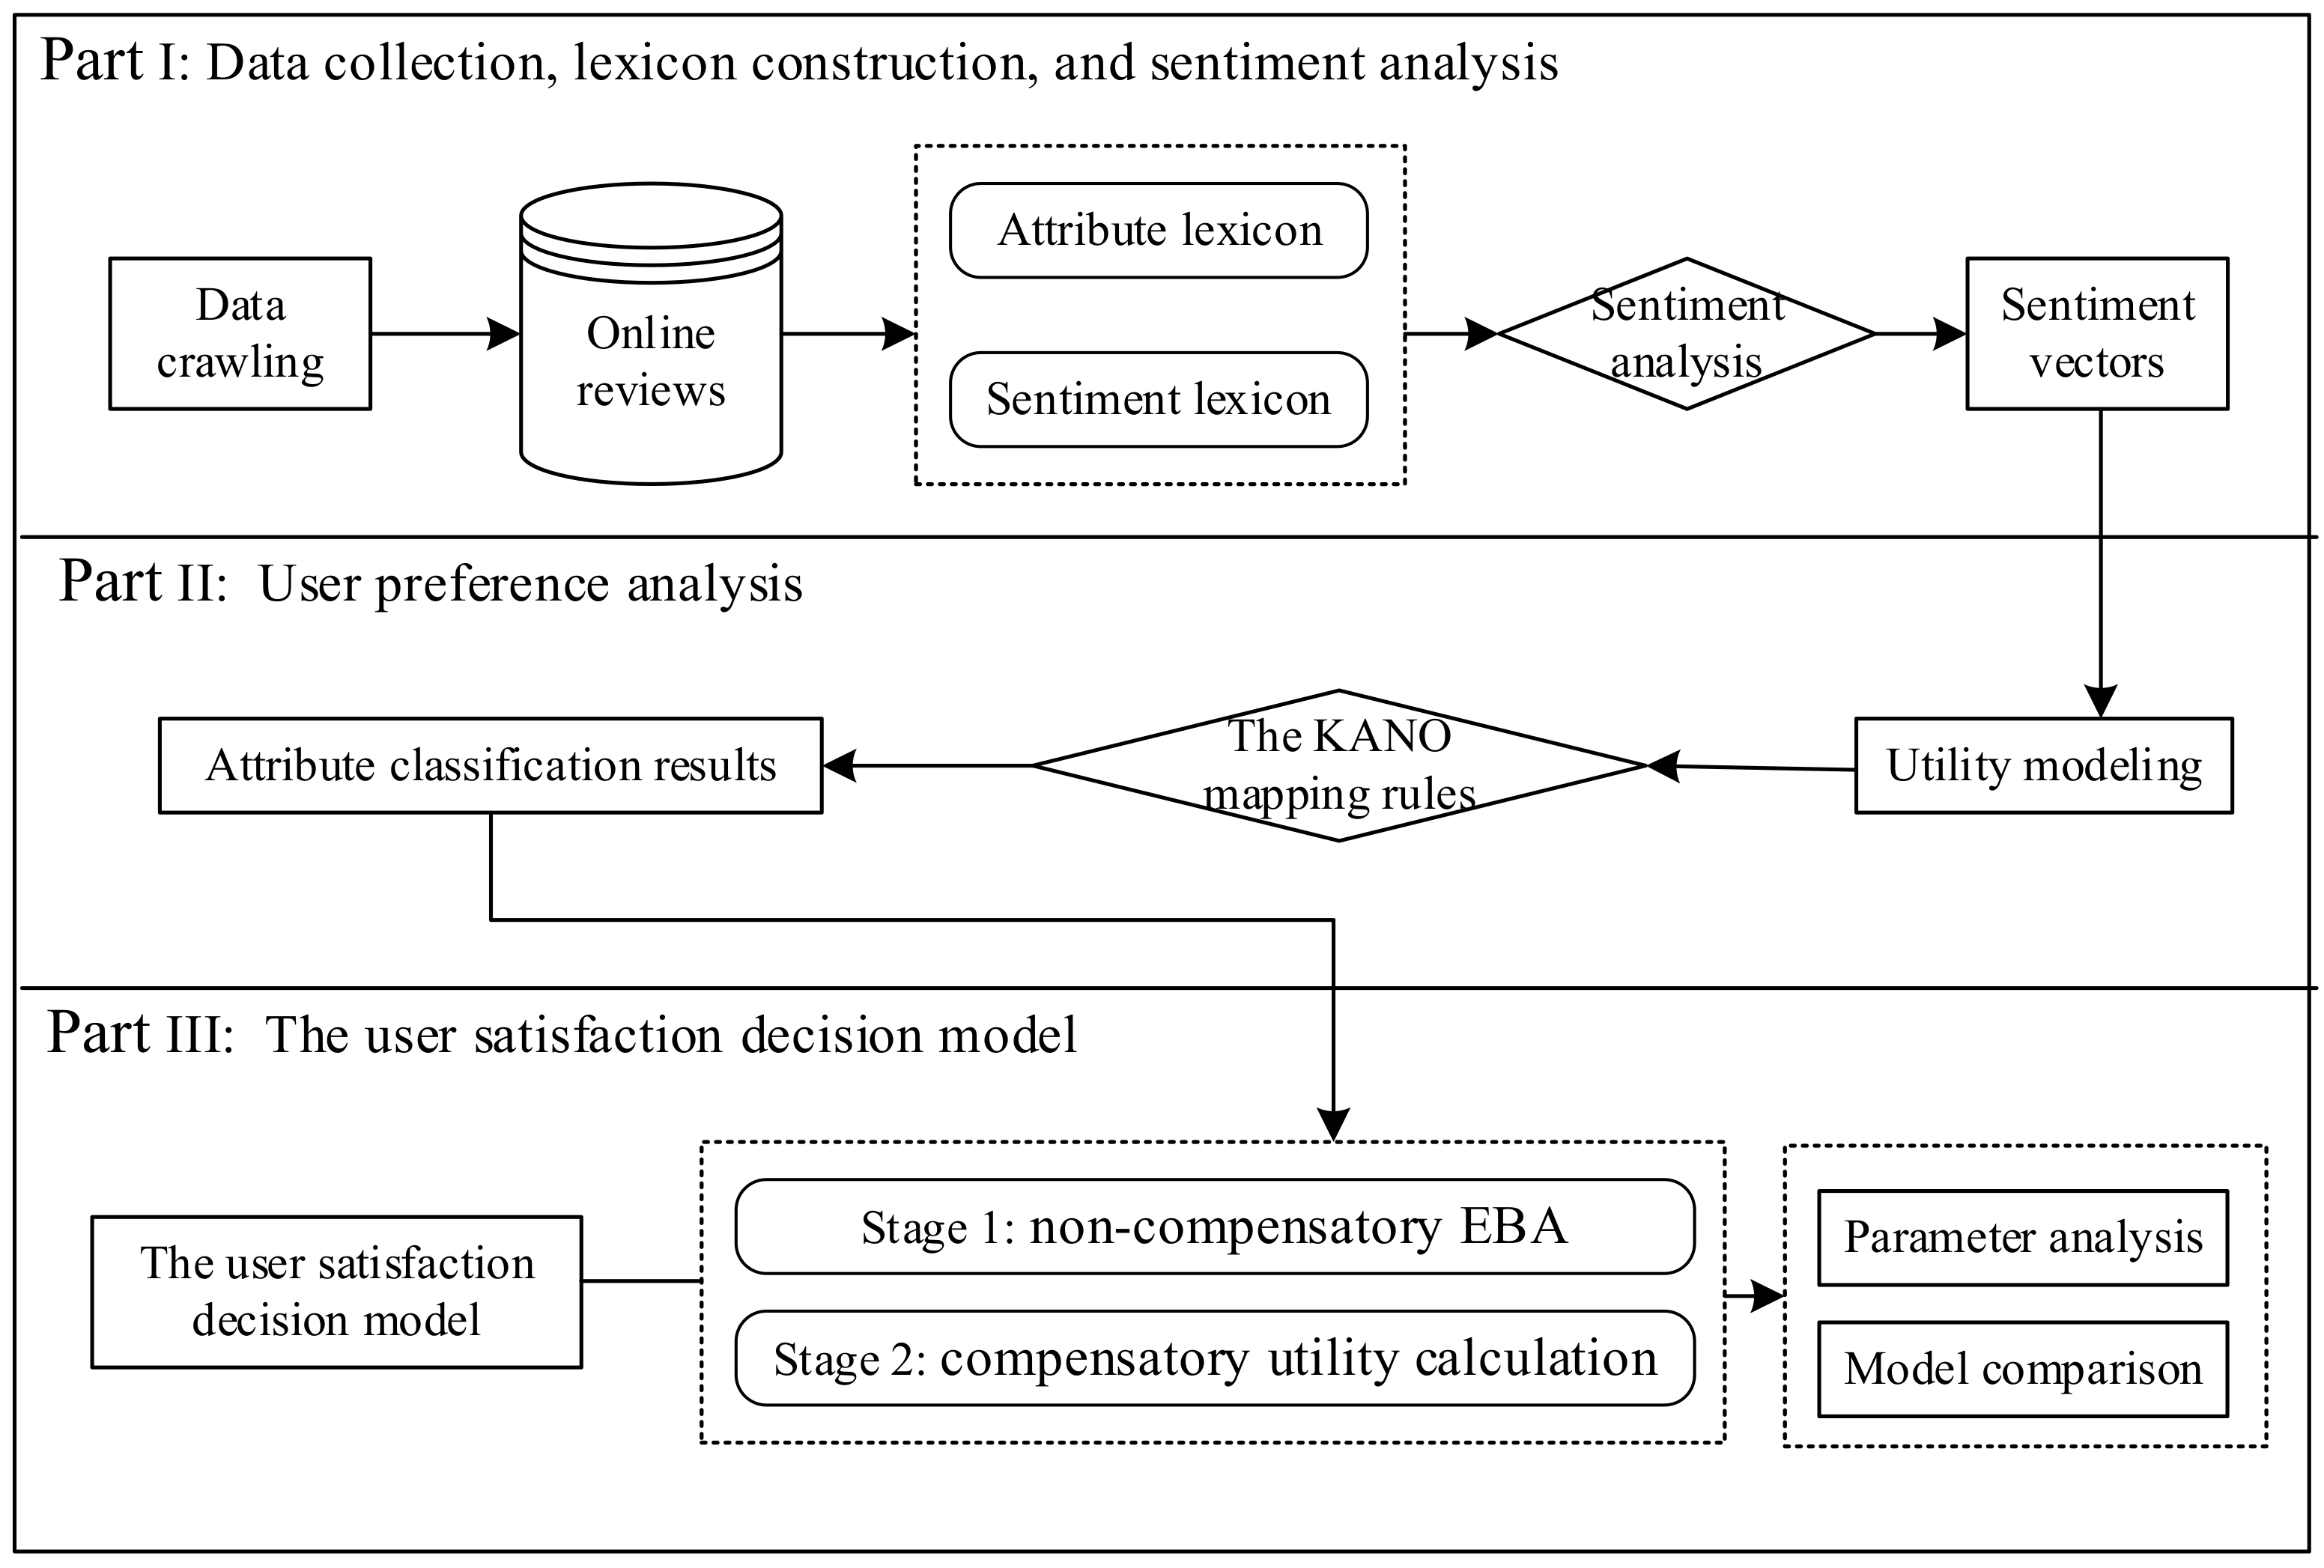
3. Research Framework
4. Data Processing and User Preference Analysis
4.1. Data Collection
4.2. Data Processing
4.3. User Preference Analysis
4.3.1. The Consumer Utility Function Model
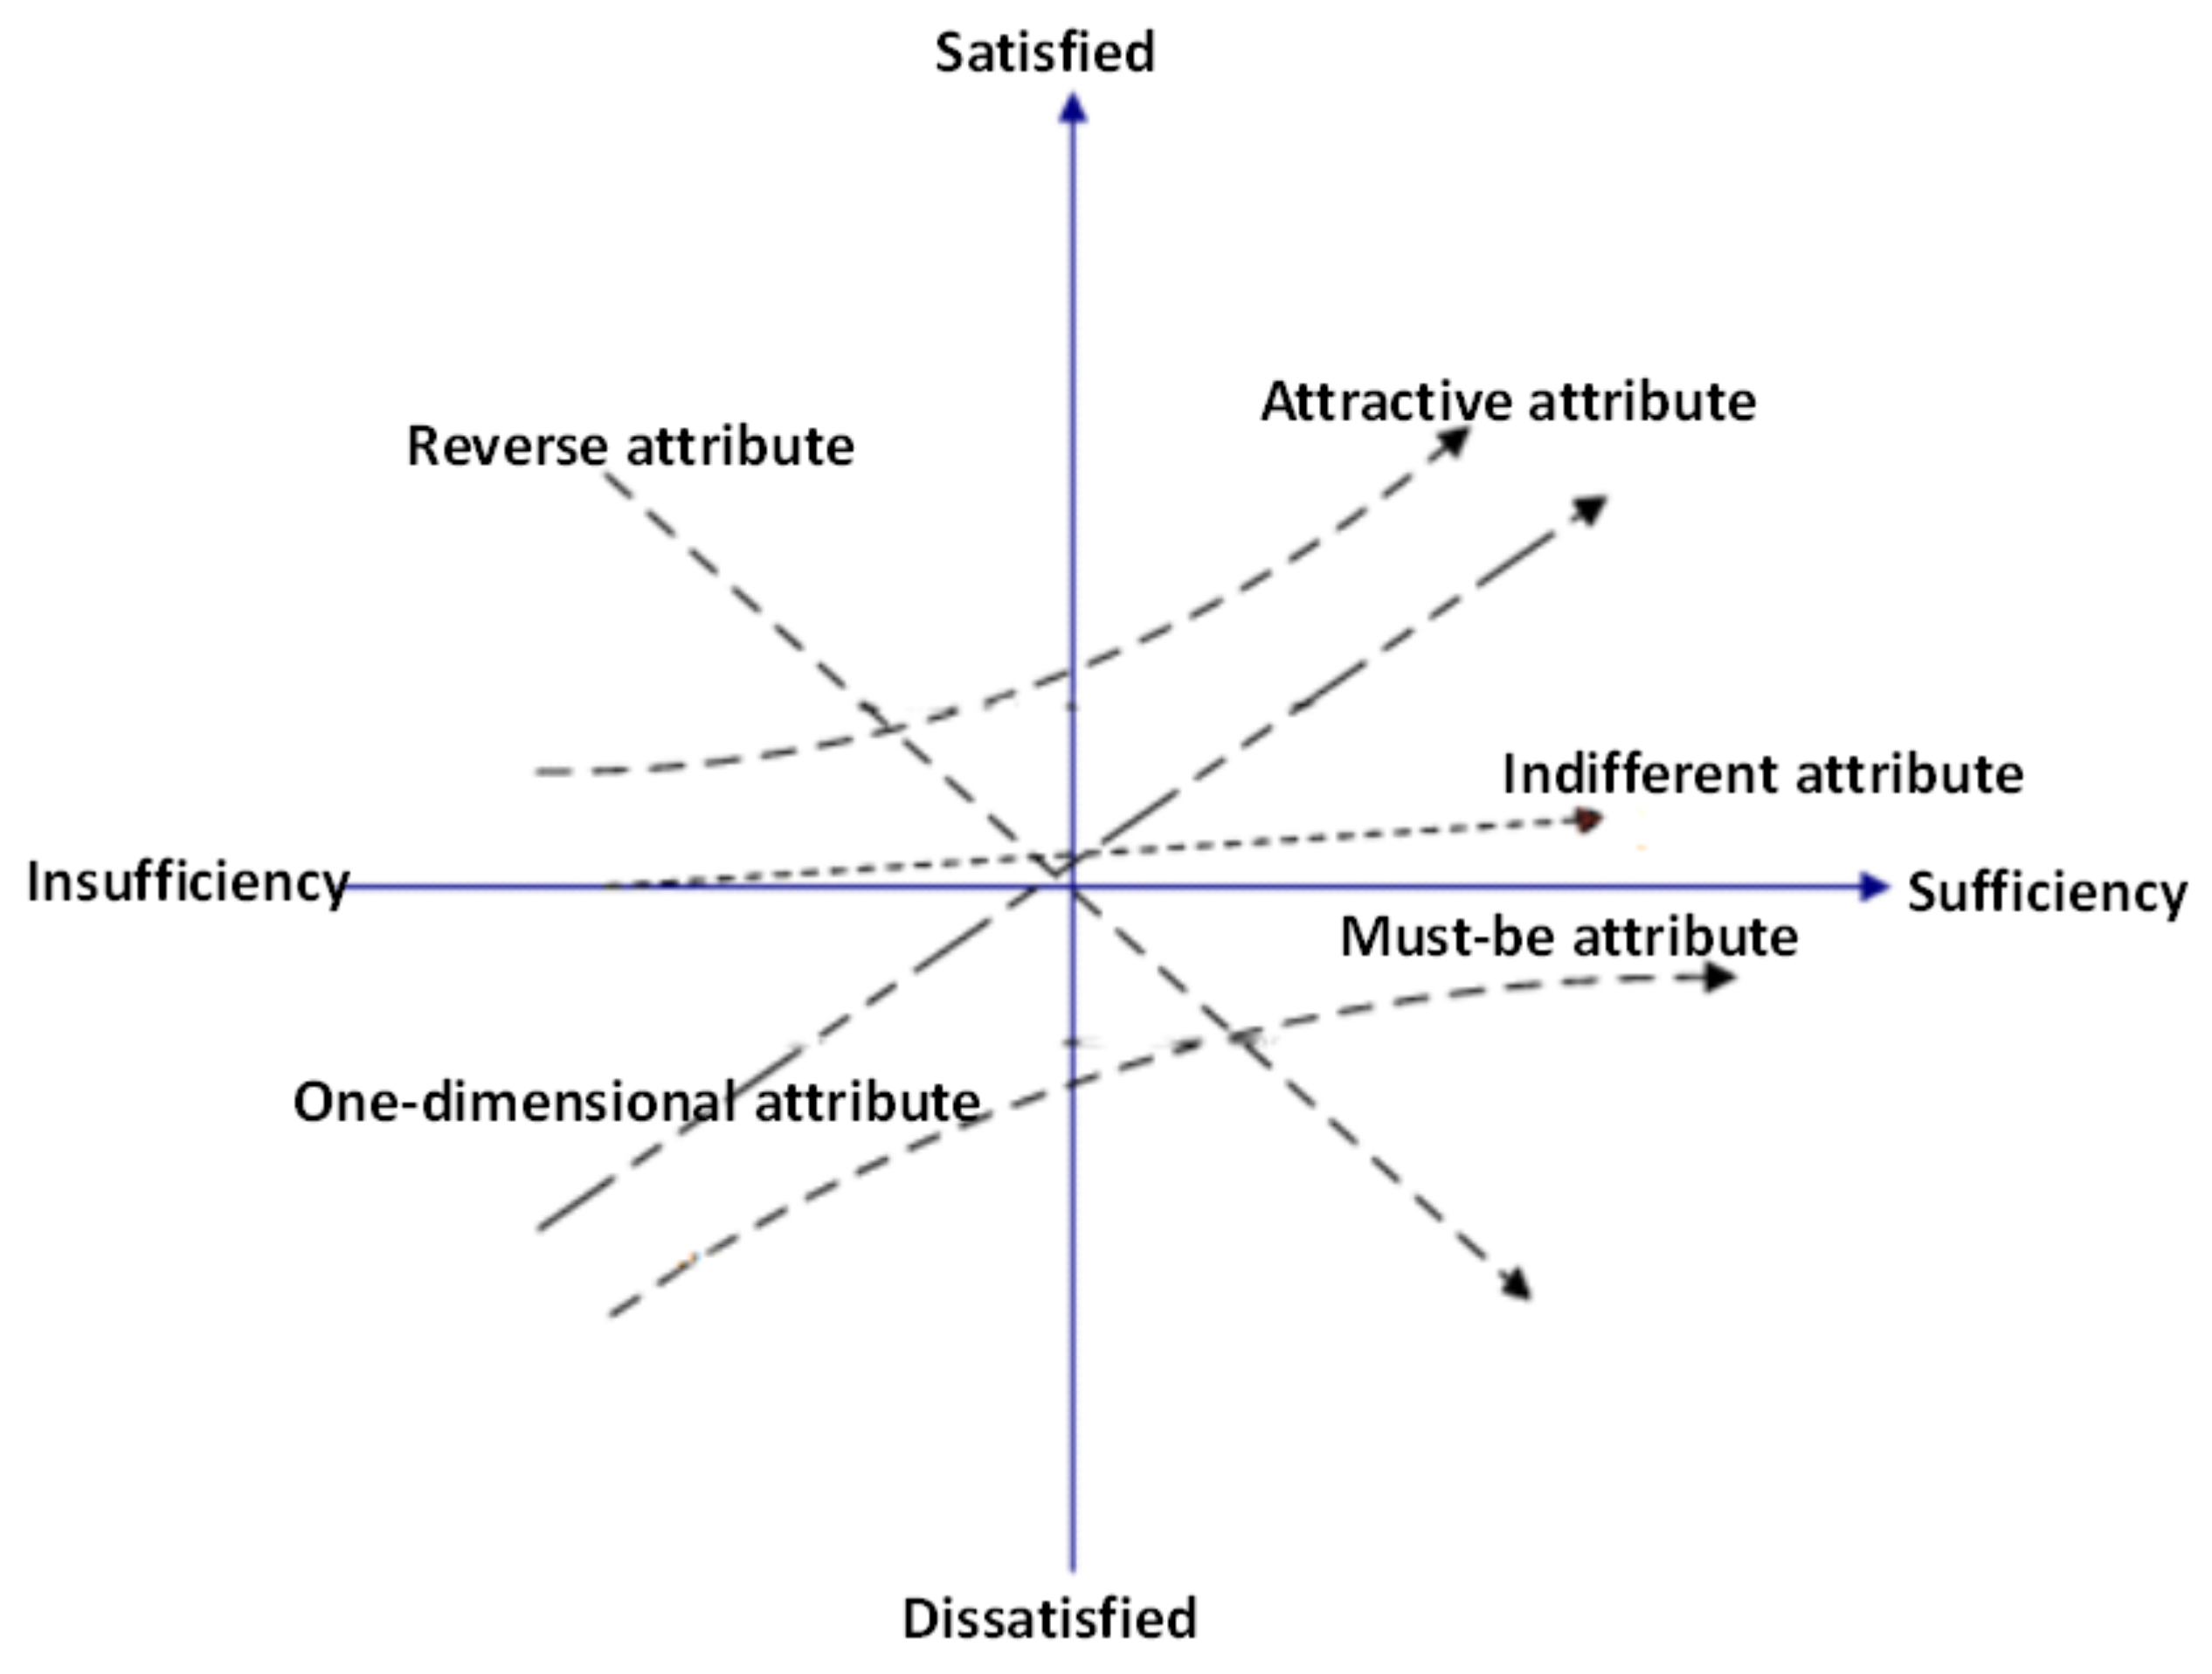
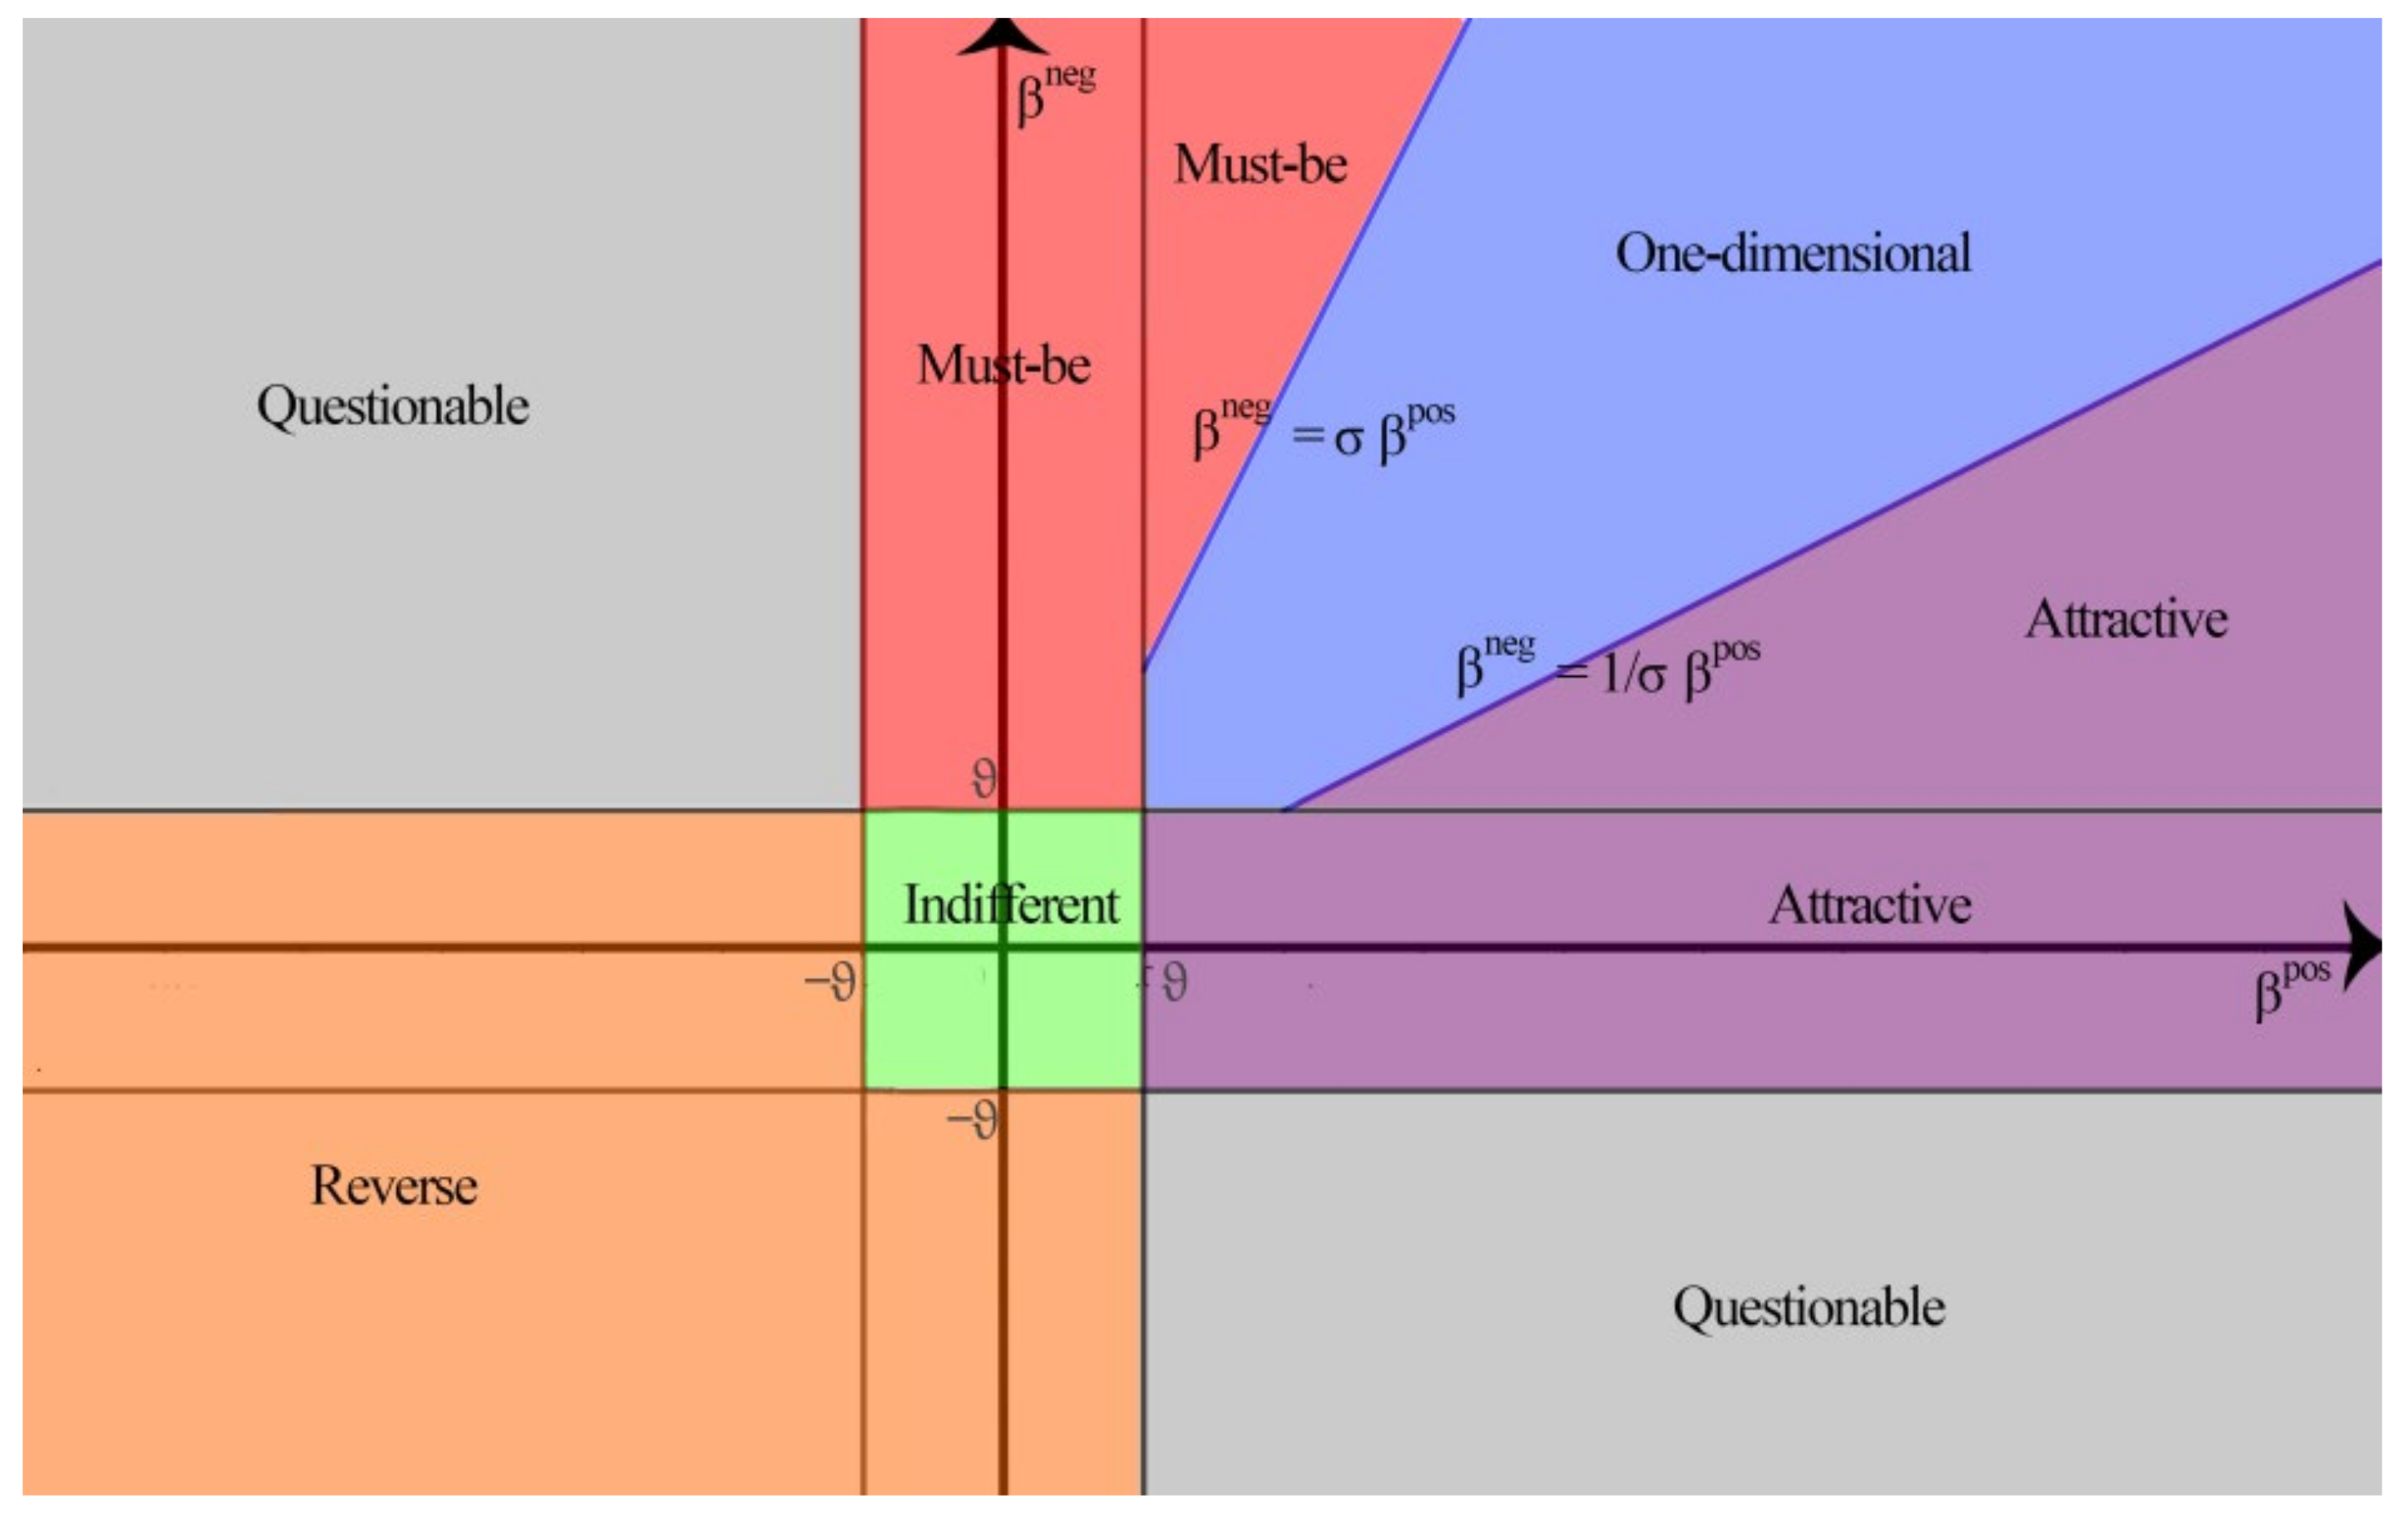
4.3.2. The KANO Mapping Rules
- (1)
- Must-be Attribute: This corresponds to the basic functions of products. When the attribute’s performance is inadequate, users will be unsatisfied. However, if the attribute is improved after it is qualified, the user will not be more satisfied.
- (2)
- Attractive Attribute: When the attribute’s performance is insufficient, user satisfaction will not decrease significantly. But, as the quality of this attribute improves, user satisfaction will increase significantly.
- (3)
- One-dimensional Attribute: User satisfaction is approximately proportional to attribute performance.
- (4)
- Indifferent Attribute: No matter how the attribute’s performance changes, user satisfaction will not be affected.
- (5)
- Reverse Attribute: User satisfaction decreases if the attribute’s performance is improved.
4.3.3. Experimental Results
5. A Two-Stage USDM
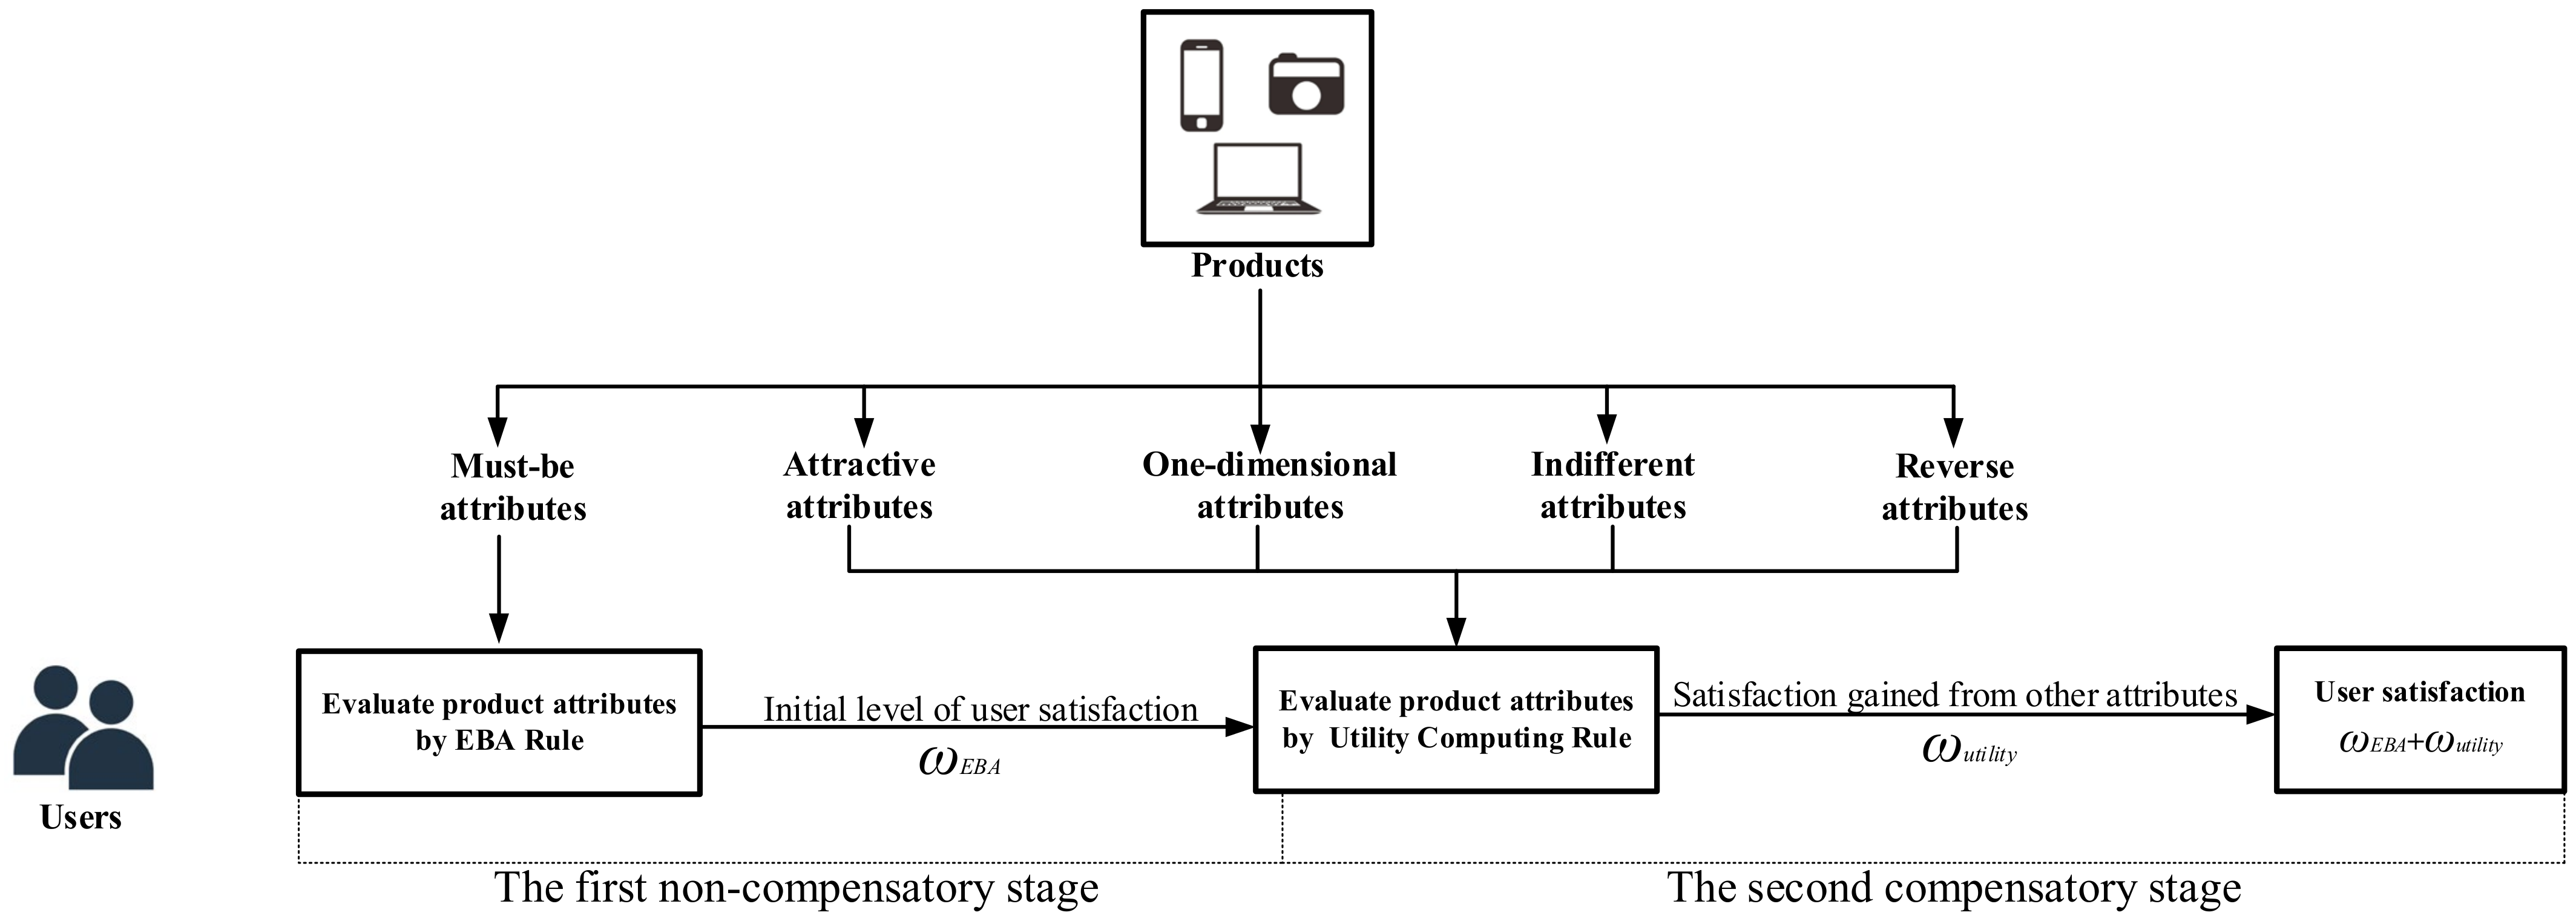
5.1. The Framework of the USDM
5.1.1. The Concept of the USDM
5.1.2. The Expressions of Five KANO Attributes
5.1.3. The Quantitative form of the USDM
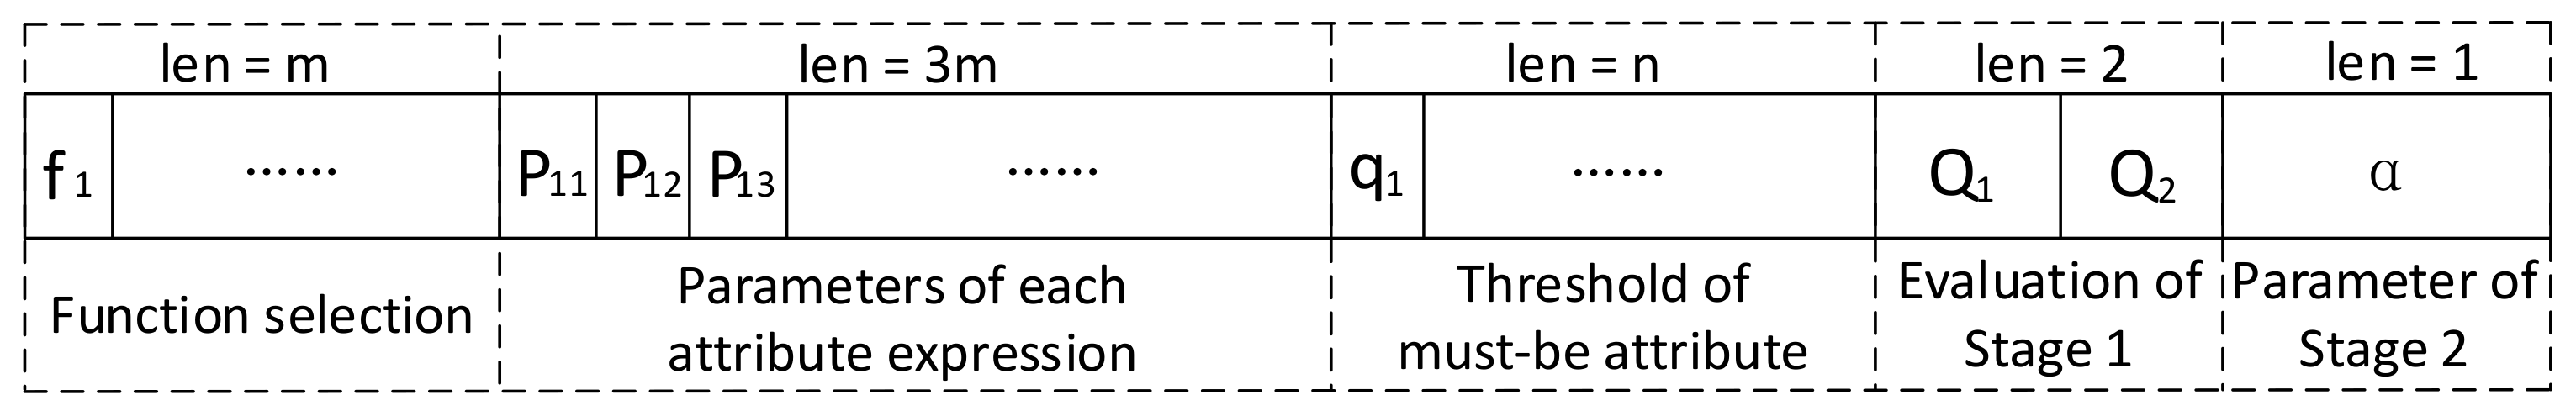
5.2. The GA of the USDM
5.3. Experimental Results
6. Model Tests
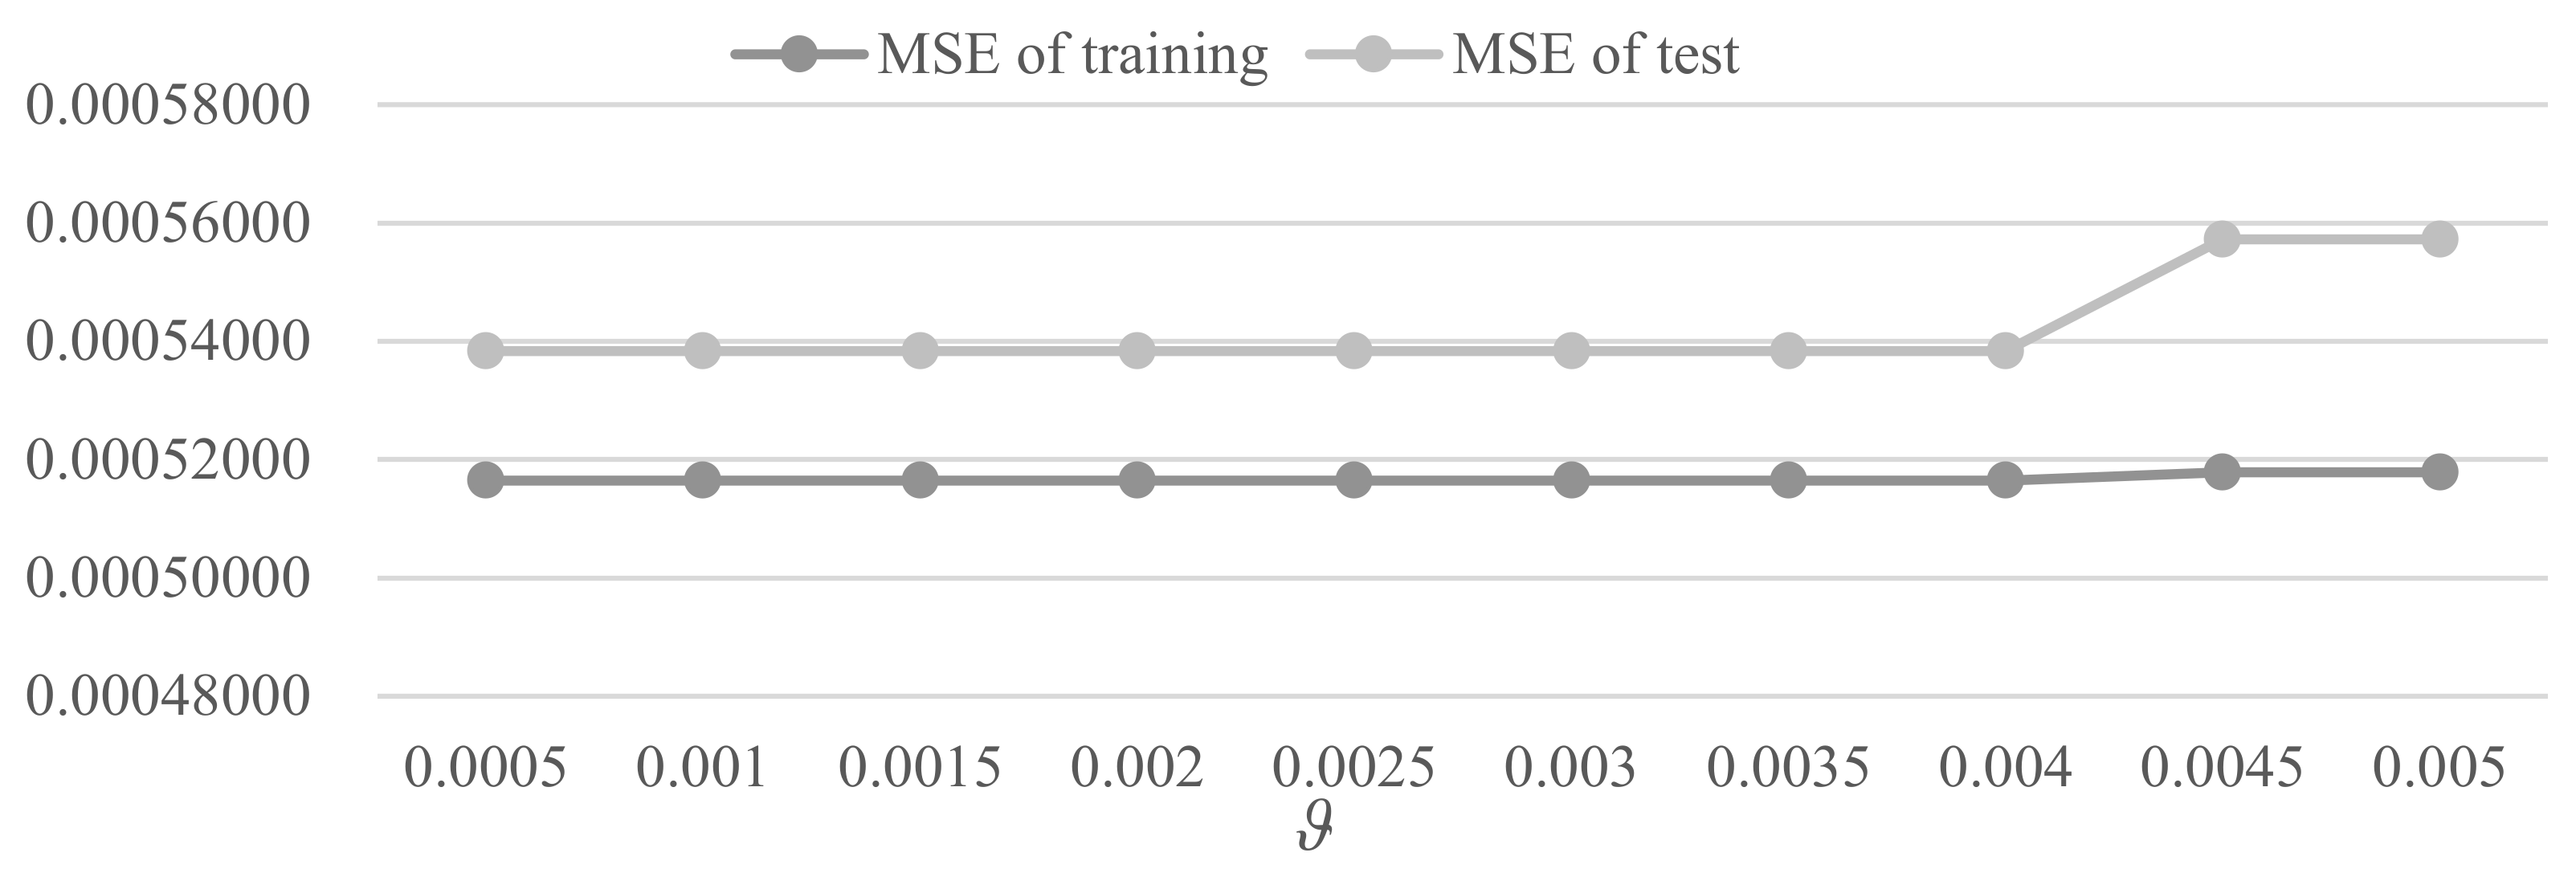
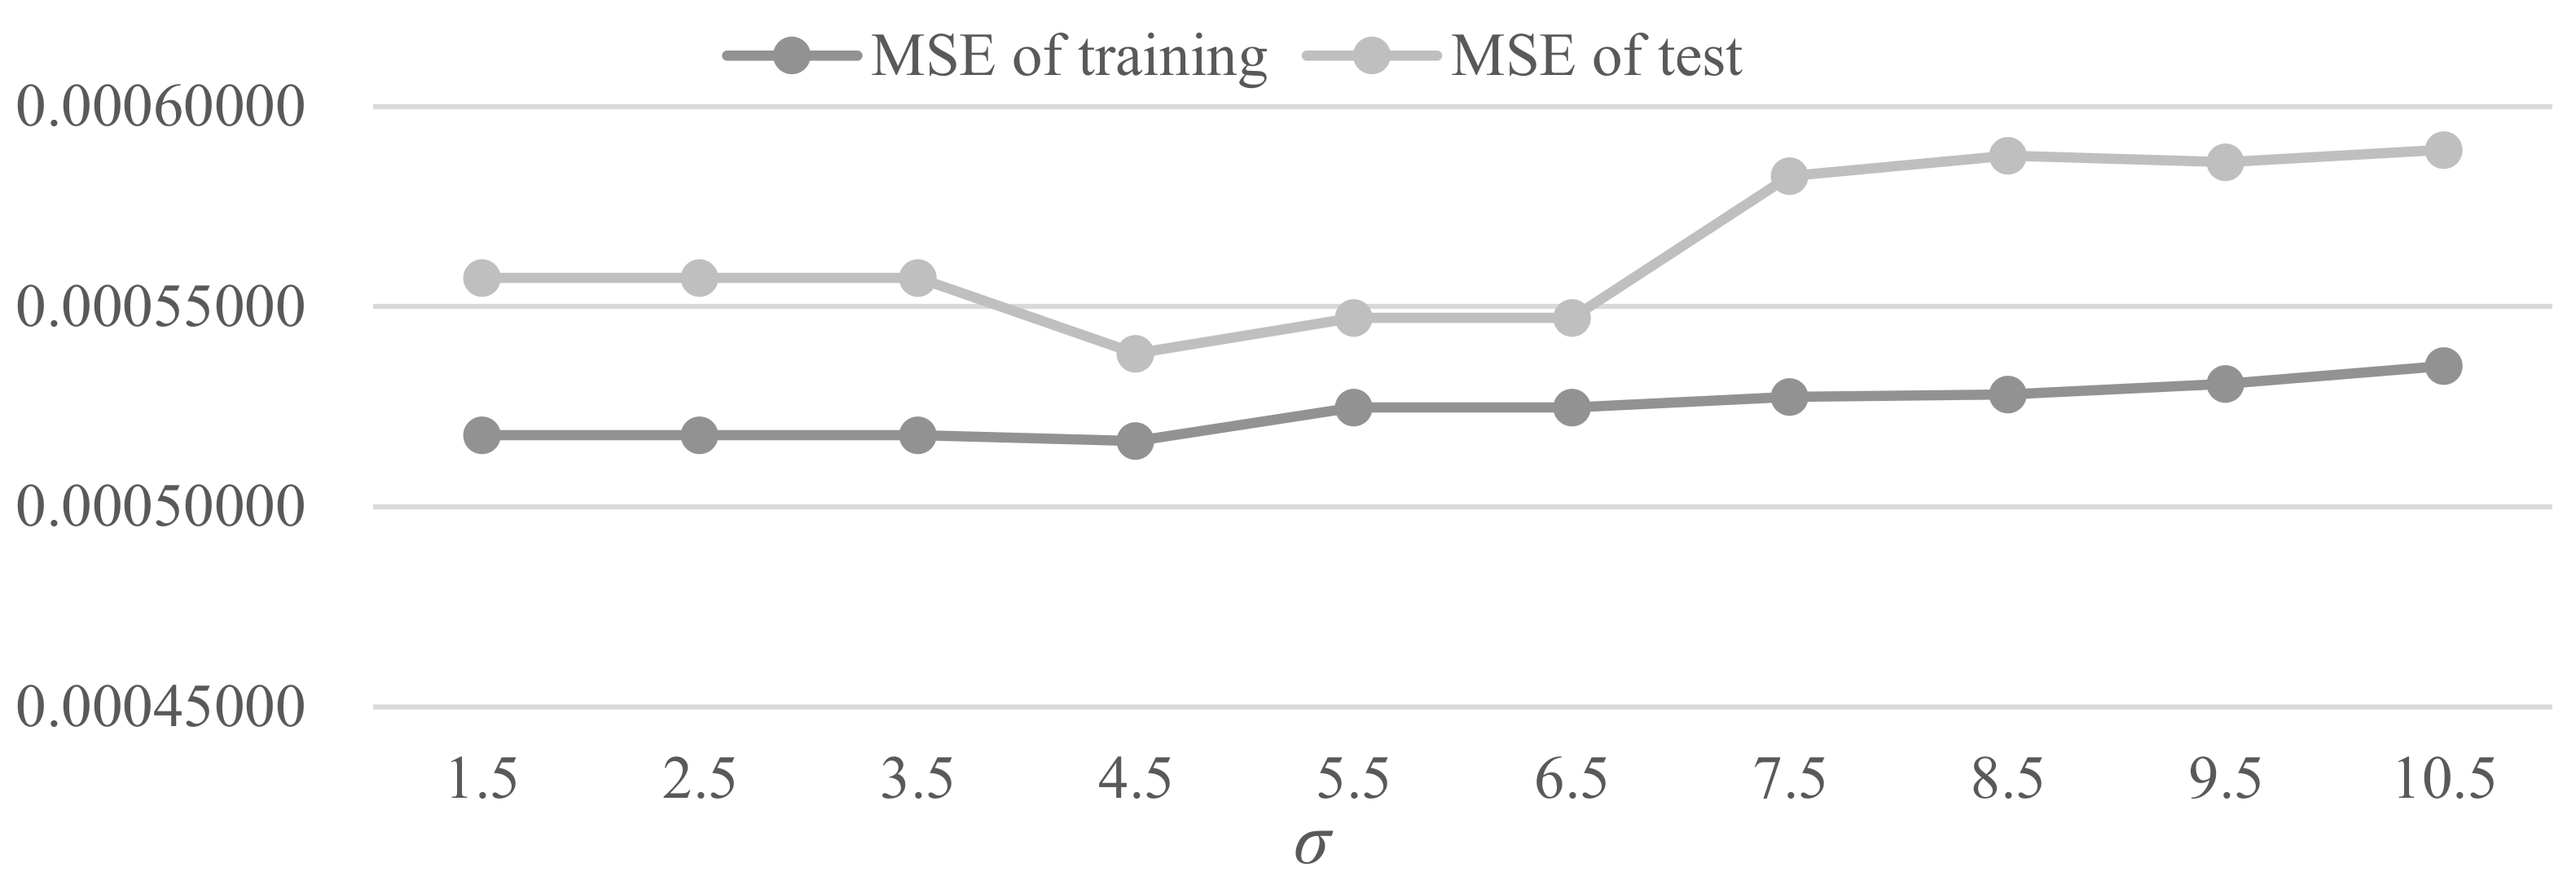
6.1. Parameter Analysis
6.2. Models Comparison
7. Discussion and Implications
7.1. Discussion
7.2. Implications
7.2.1. Theoretical Implications
7.2.2. Practical Implications
8. Conclusions, Limitation, and Future Research
8.1. Conclusions
8.2. Limitations and Future Research
Author Contributions
Funding
Institutional Review Board Statement
Informed Consent Statement
Data Availability Statement
Conflicts of Interest
References
- Prayag, G.; Hassibi, S.; Nunkoo, R. A systematic review of consumer satisfaction studies in hospitality journals: Conceptual development, research approaches and future prospects. J. Hosp. Mark. Manag. 2019, 28, 51–80. [Google Scholar] [CrossRef]
- Yoo, J.; Park, M. The effects of e-mass customization on consumer perceived value, satisfaction, and loyalty toward luxury brands. J. Bus. Res. 2016, 69, 5775–5784. [Google Scholar] [CrossRef]
- Wang, Y.L.; Tzeng, G.H. Brand marketing for creating brand value based on a MCDM model combining DEMATEL with ANP and VIKOR methods. Expert Syst. Appl. 2012, 39, 5600–5615. [Google Scholar] [CrossRef]
- Ji, C.L.; Prentice, C. Linking transaction-specific satisfaction and customer loyalty—The case of casino resorts. J. Retail. Consum. Serv. 2021, 58, 10. [Google Scholar] [CrossRef]
- Pomirleanu, N.; Chennamaneni, P.R.; Krishen, A.S. Easy to please or hard to impress: Elucidating consumers’ innate satisfaction. J. Bus. Res. 2016, 69, 1914–1918. [Google Scholar] [CrossRef]
- Jang, S.; Chung, J.; Rao, V.R. The importance of functional and emotional content in online consumer reviews for product sales: Evidence from the mobile gaming market. J. Bus. Res. 2021, 130, 583–593. [Google Scholar] [CrossRef]
- Gallego, M.D.; Bueno, S.; Lopez-Jimenez, D. Impact of B2C e-commerce codes of conduct on sales volume: Lessons from the Spanish perspective. J. Bus. Ind. Mark. 2016, 31, 381–392. [Google Scholar] [CrossRef]
- Lee, W.J.; Shin, S. Effects of Product Smartness on Satisfaction: Focused on the Perceived Characteristics of Smartphones. J. Theor. Appl. Electron. Commer. Res. 2018, 13, 1–14. [Google Scholar] [CrossRef]
- Chang, S.C.; Chou, P.Y.; Lo, W.C. Evaluation of satisfaction and repurchase intention in online food group-buying, using Taiwan as an example. Br. Food J. 2014, 116, 44–61. [Google Scholar] [CrossRef]
- Sann, R.; Lai, P.C.; Liaw, S.Y.; Chen, C.T. Predicting online complaining behavior in the hospitality industry: Application of big data analytics to online reviews. Sustainability 2022, 14, 1800. [Google Scholar] [CrossRef]
- Pizam, A.; Shapoval, V.; Ellis, T. Customer satisfaction and its measurement in hospitality enterprises: A revisit and update. Int. J. Contemp. Hosp. Manag. 2016, 28, 2–35. [Google Scholar] [CrossRef]
- Ding, C.; Guo, Q.; Rehman, A.; Zeeshan, M. Impact of Environment on Hotel Customer Satisfaction in Southeast Asia: A Study of Online Booking Site Reviews. Front. Environ. Sci. 2022, 10, 978070. [Google Scholar] [CrossRef]
- Xiao, S.S.; Wei, C.P.; Dong, M. Crowd intelligence: Analyzing online product reviews for preference measurement. Inf. Manag. 2016, 53, 169–182. [Google Scholar] [CrossRef]
- Changchit, C.; Klaus, T. Determinants and Impact of Online Reviews on Product Satisfaction. J. Internet Commer. 2020, 19, 82–102. [Google Scholar] [CrossRef]
- Phillips, P.; Barnes, S.; Zigan, K.; Schegg, R. Understanding the Impact of Online Reviews on Hotel Performance: An Empirical Analysis. J. Travel Res. 2017, 56, 235–249. [Google Scholar] [CrossRef]
- Tang, L.; Wang, X.; Kim, E. Predicting Conversion Rates in Online Hotel Bookings with Customer Reviews. J. Theor. Appl. Electron. Commer. Res. 2022, 17, 1264–1278. [Google Scholar] [CrossRef]
- Levy, S.E.; Duan, W.; Boo, S. An analysis of one-star online reviews and responses in the Washington, DC, lodging market. Cornell Hosp. Q. 2013, 54, 49–63. [Google Scholar] [CrossRef]
- Li, H.; Ye, Q.; Law, R. Determinants of Customer Satisfaction in the Hotel Industry: An Application of Online Review Analysis. Asia Pac. J. Tour. Res. 2013, 18, 784–802. [Google Scholar] [CrossRef]
- Singh, H.P.; Alshallaqi, M.; Altamimi, M. Predicting Critical Factors Impacting Hotel Online Ratings: A Comparison of Religious and Commercial Destinations in Saudi Arabia. Sustainability 2023, 15, 11998. [Google Scholar] [CrossRef]
- Alhamad, I.A.; Singh, H.P. Decoding Significant and Trivial Factors Influencing Online Hotel Ratings: The Case of Saudi Arabia’s Makkah City. Int. Trans. J. Eng. Manag. Appl. Sci. Technol. 2021, 12, 12A7H. [Google Scholar] [CrossRef]
- Alhamad, I.A.; Singh, H.P. Predicting Key Factors Impacting Online Hotel Ratings Using Data Mining Approach: A Case Study of the Makkah City of Saudi Arabia. Int. Trans. J. Eng. Manag. Appl. Sci. Technol. 2021, 12, 12A2N. [Google Scholar] [CrossRef]
- Guo, Y.; Barnes, S.J.; Jia, Q. Mining meaning from online ratings and reviews: Tourist satisfaction analysis using latent dirichlet allocation. Tour. Manag. 2017, 59, 467–483. [Google Scholar] [CrossRef]
- Zhang, W.T.; Choi, I.Y.; Hyun, Y.J.; Kim, J.K. Hotel Service Analysis by Penalty-Reward Contrast Technique for Online Review Data. Sustainability 2022, 14, 7340. [Google Scholar] [CrossRef]
- Albayrak, T.; Caber, M.I. Prioritisation of the hotel attributes according to their influence on satisfaction: A comparison of two techniques. Tour. Manag. 2015, 46, 43–50. [Google Scholar] [CrossRef]
- Singh, H.P.; Alhamad, I.A. Deciphering Key Factors Impacting Online Hotel Ratings through the Lens of Two-Factor Theory: A Case of Hotels in the Makkah City of Saudi Arabia. Int. Trans. J. Eng. Manag. Appl. Sci. Technol. 2021, 12, 12A8M. [Google Scholar] [CrossRef]
- Zhang, P.; von Dran, G.M. Satisfiers and dissatisfiers: A two-factor model for Website design and evaluation. J. Am. Soc. Inf. Sci. 2000, 51, 1253–1268. [Google Scholar] [CrossRef]
- Lee, J.-S.; Back, K.-J.; Chan, E.S. Quality of work life and job satisfaction among frontline hotel employees: A self-determination and need satisfaction theory approach. Int. J. Contemp. Hosp. Manag. 2015, 27, 768–789. [Google Scholar] [CrossRef]
- Johnson, M.D.; Fornell, C. A framework for comparing customer satisfaction across individuals and product categories. J. Econ. Psychol. 1991, 12, 267–286. [Google Scholar] [CrossRef]
- Li, S.G.; Liu, F.; Zhang, Y.Q.; Peng, K.X.; Yu, Z.X. Research on Personalized Product Integration Improvement Based on Consumer Maturity. IEEE Access 2022, 10, 39487–39501. [Google Scholar] [CrossRef]
- Corrada, M.S.; Flecha, J.A.; Lopez, E. The gratifications in the experience of the use of social media and its impact on the purchase and repurchase of products and services. Eur. Bus. Rev 2020, 32, 297–315. [Google Scholar] [CrossRef]
- Pappu, R.; Quester, P. Does customer satisfaction lead to improved brand equity? An empirical examination of two categories of retail brands. J. Prod. Brand Manag. 2006, 15, 4–14. [Google Scholar] [CrossRef]
- McNamara, N.; Kirakowski, J. Measuring user-satisfaction with electronic consumer products: The Consumer Products Questionnaire. Int. J. Hum. Comput. Stud 2011, 69, 375–386. [Google Scholar] [CrossRef]
- Cohen, S.A.; Prayag, G.; Moital, M. Consumer behaviour in tourism: Concepts, influences and opportunities. Curr. Issues Tour. 2014, 17, 872–909. [Google Scholar] [CrossRef]
- Karumur, R.P.; Nguyen, T.T.; Konstan, J.A. Personality, User Preferences and Behavior in Recommender systems. Inf. Syst. Front 2018, 20, 1241–1265. [Google Scholar] [CrossRef]
- Li, S.G.; Liu, F.; Lu, H.Y.; Zhang, Y.Q.; Li, Y.M.; Yu, Z.X. Product family lean improvement based on matching deep mining of customer group preference. Res. Eng. Des. 2021, 32, 469–488. [Google Scholar] [CrossRef]
- Allen, J.; Munoz, J.C.; Ortuzar, J.D. Understanding public transport satisfaction: Using Maslow’s hierarchy of (transit) needs. Transp. Policy 2019, 81, 75–94. [Google Scholar] [CrossRef]
- Cao, H.H.; Jiang, J.H.; Oh, L.B.; Li, H.; Liao, X.W.; Chen, Z.W. A Maslow’s hierarchy of needs analysis of social networking services continuance. J. Serv. Manag. 2013, 24, 170–190. [Google Scholar] [CrossRef]
- Barnes, S.J.; Pressey, A.D. Who needs cyberspace? Examining drivers of needs in Second Life. Internet Res. 2011, 21, 236–254. [Google Scholar] [CrossRef]
- Herzberg, F.B.; Mausner, B.B.; Snyderman, B.B. The Motivation to Work, 2nd ed.; John Wiley & Sons: New York, NY, USA, 1959. [Google Scholar]
- Soliman, H.M. Motivation-hygiene theory of job attitudes: An empirical investigation and an attempt to reconcile both the one-and the two-factor theories of job attitudes. J. Appl. Psychol. 1970, 54, 452–461. [Google Scholar] [CrossRef]
- Maddox, R.N. Two-factor Theory and Consumer Satisfaction: Replication and Extension. J. Consum. Res. 1981, 8, 97–102. [Google Scholar] [CrossRef]
- Koncar, P.; Santos, T.; Strohmaier, M.; Helic, D. On the application of the Two-Factor Theory to online employer reviews. J. Data Inf. Manag. 2022, 4, 1–23. [Google Scholar] [CrossRef]
- Singh, H.P.; Alhamad, I.A. A Novel Categorization of Key Predictive Factors Impacting Hotels’ Online Ratings: A Case of Makkah. Sustainability 2022, 14, 16588. [Google Scholar] [CrossRef]
- Mikulic, J.; Prebezac, D. A critical review of techniques for classifying quality attributes in the Kano model. Manag. Serv. Qual. 2011, 21, 46–66. [Google Scholar] [CrossRef]
- Chen, D.D.; Zhang, D.W.; Liu, A. Intelligent Kano classification of product features based on customer reviews. Cirp Ann. Manuf. Technol. 2019, 68, 149–152. [Google Scholar] [CrossRef]
- Kano, M.; Ohno-Shosaku, T.; Hashimotodani, Y.; Uchigashima, M.; Watanabe, M. Endocannabinoid-Mediated Control of Synaptic Transmission. Physiol. Rev. 2009, 89, 309–380. [Google Scholar] [CrossRef] [PubMed]
- Matzler, K.; Hinterhuber, H.H. How to make product development projects more successful by integrating Kano’s model of customer satisfaction into quality function deployment. Technovation 1998, 18, 25–38. [Google Scholar] [CrossRef]
- Tan, K.C.; Shen, X.X. Integrating Kano’s model in the planning matrix of quality function deployment. Total Qual. Manag. 2000, 11, 1141–1151. [Google Scholar] [CrossRef]
- Qi, J.Y.; Zhang, Z.P.; Jeon, S.M.; Zhou, Y.Q. Mining customer requirements from online reviews: A product improvement perspective. Inf. Manag. 2016, 53, 951–963. [Google Scholar] [CrossRef]
- Zhao, M.; Liu, M.; Xu, C.; Zhang, C. Classifying travellers’ requirements from online reviews: An improved Kano model. Int. J. Contemp. Hosp. Manag. 2023, 36, 91–112. [Google Scholar] [CrossRef]
- Jiang, K.; Li, Y. Mining customer requirement from online reviews based on multi-aspected sentiment analysis and Kano model. In Proceedings of the 2020 16th Dahe Fortune China Forum and Chinese High-Educational Management Annual Academic Conference (DFHMC), Zhengzhou, China, 4–6 December 2020; pp. 150–156. [Google Scholar] [CrossRef]
- Oh, M.; Kim, T.; Im, E. Modeling Customer Satisfaction based on Kano Model from Online Reviews: Focused on Deep Learning Natural Language Processing. In Proceedings of the 2022 IEEE/ACIS 7th International Conference on Big Data, Cloud Computing, and Data Science (BCD), Danang, Vietnam, 4–6 August 2022; pp. 22–26. [Google Scholar] [CrossRef]
- Lazaroiu, G.; Negurita, O.; Grecu, I.; Grecu, G.; Mitran, P.C. Consumers’ Decision-Making Process on Social Commerce Platforms: Online Trust, Perceived Risk, and Purchase Intentions. Front. Psychol. 2020, 11, 7. [Google Scholar] [CrossRef]
- Kenning, P.; Linzmajer, M. Consumer neuroscience: An overview of an emerging discipline with implications for consumer policy. J. Verbrauch. Leb. 2011, 6, 111–125. [Google Scholar] [CrossRef]
- Hult, G.T.M.; Sharma, P.N.; Morgeson, F.V.; Zhang, Y.F. Antecedents and Consequences of Customer Satisfaction: Do They Differ across Online and Offline Purchases? J. Retail. 2019, 95, 10–23. [Google Scholar] [CrossRef]
- Huang, N.; Burtch, G.; Hong, Y.; Polman, E. Effects of multiple psychological distances on construal and consumer evaluation: A field study of online reviews. J. Consum. Psychol. 2016, 26, 474–482. [Google Scholar] [CrossRef]
- Park, J.; Han, S.H.; Kim, H.K.; Oh, S.; Moon, H. Modeling user experience: A case study on a mobile device. Int. J. Ind. Erg. 2013, 43, 187–196. [Google Scholar] [CrossRef]
- Lago, N.C.; Marcon, A.; Ribeiro, J.L.D.; de Medeiros, J.F.; Briao, V.B.; Antoni, V.L. Determinant attributes and the compensatory judgement rules applied by young consumers to purchase environmentally sustainable food products. Sustain. Prod. Consum. 2020, 23, 256–273. [Google Scholar] [CrossRef]
- You, T.; Zhang, J.; Fan, Z. Method for Selecting Desirable Product(s) Based on Online Rating Information and Customers Aspirations. Chin. J. Manag. Sci. 2017, 25, 94–102. [Google Scholar]
- He, J.J.; Chen, L.H.; Li, J.X.; Liu, S.M. An Empirical Investigation of the Online Commentary Behavior Dynamics Based on the Marginal Utility Theory. Int. J. Enterp. Inf. Syst 2020, 16, 92–106. [Google Scholar] [CrossRef]
- Lima, F.R.; Osiro, L.; Carpinetti, L.C.R. A fuzzy inference and categorization approach for supplier selection using compensatory and non-compensatory decision rules. Appl. Soft. Comput. 2013, 13, 4133–4147. [Google Scholar] [CrossRef]
- Tversky, A.; Shafir, E. Choice under conflict: The dynamics of deferred decision. Psychol. Sci. 1992, 3, 358–361. [Google Scholar] [CrossRef]
- Wang, M.; Gu, B.; Ye, Q. Elimination by Aspects in Electronic Commerce—Evidence from Online Marketplace and Implications for Empirical Model Specification. In Proceedings of the 47th Annual Hawaii International Conference on System Sciences, Waikoloa, HI, USA, 6–9 January 2014; pp. 4142–4147. [Google Scholar] [CrossRef]
- Stankevich, A. Explaining the consumer decision-making process: Critical literature review. J. Int. Bus. Res. Mark. 2017, 2, 7–14. [Google Scholar] [CrossRef]
- Graffeo, M.; Polonio, L.; Bonini, N. Individual differences in competent consumer choice: The role of cognitive reflection and numeracy skills. Front. Psychol. 2015, 6, 15. [Google Scholar] [CrossRef]
- Gani-zade, D.S.; Zakharov, I.M.; Menshikova, G.Y. Brain mechanisms of face perception: Holistic and analytical processes. Vopr. Psikhologii 2021, 67, 121–134. [Google Scholar]
- Apanovich, V.V.; Tishchenko, A.G.; Znakov, V.V.; Alexandrov, Y.I. Construction of blocks of analytical and holistic problems and their empirical verification. Vopr. Psikhologii 2020, 13, 52–71. [Google Scholar]
- Ullah, R.; Amblee, N.; Kim, W.; Lee, H. From valence to emotions: Exploring the distribution of emotions in online product reviews. Decis. Support Syst. 2016, 81, 41–53. [Google Scholar] [CrossRef]
- Burnap, P.; Rana, O.F.; Avis, N.; Williams, M.; Housley, W.; Edwards, A.; Morgan, J.; Sloan, L. Detecting tension in online communities with computational Twitter analysis. Technol. Forecast. Soc. Change 2015, 95, 96–108. [Google Scholar] [CrossRef]
- Salawu, S.; He, Y.; Lumsden, J. Approaches to Automated Detection of Cyberbullying: A Survey. IEEE Trans. Affect. Comput. 2020, 11, 3–24. [Google Scholar] [CrossRef]
- Mikolov, T.; Chen, K.; Corrado, G.; Dean, J. Efficient estimation of word representations in vector space. arXiv 2013, arXiv:1301.3781. [Google Scholar] [CrossRef]
- Goldberg, Y.; Levy, O. word2vec Explained: Deriving Mikolov et al.’s negative-sampling word-embedding method. arXiv 2014, arXiv:1402.3722. [Google Scholar] [CrossRef]
- Fu, X.; Liu, G.; Guo, Y.; Wang, Z. Multi-aspect sentiment analysis for Chinese online social reviews based on topic modeling and HowNet lexicon. Knowl. Based Syst. 2013, 37, 186–195. [Google Scholar] [CrossRef]
- Du, X.H.; Jiao, J.X.; Tseng, M.M. Understanding customer satisfaction in product customization. Int. J. Adv. Manuf. Technol. 2006, 31, 396–406. [Google Scholar] [CrossRef]
- Arana, J.E.; Leon, C.J. Understanding the use of non-compensatory decision rules in discrete choice experiments: The role of emotions. Ecol. Econ. 2009, 68, 2316–2326. [Google Scholar] [CrossRef]
- Scheibehenne, B.; von Helversen, B. Selecting decision strategies: The differential role of affect. Cogn. Emot. 2015, 29, 158–167. [Google Scholar] [CrossRef]
- Goldberg, D.E.; Holland, J.H. Genetic algorithms and machine learning. Mach. Learn. 1988, 3, 95–99. [Google Scholar] [CrossRef]
- Wang, L.; Zeng, Y.; Chen, T. Back propagation neural network with adaptive differential evolution algorithm for time series forecasting. Expert Syst. Appl. 2015, 42, 855–863. [Google Scholar] [CrossRef]
- Li, H.-z.; Guo, S.; Li, C.-j.; Sun, J.-q. A hybrid annual power load forecasting model based on generalized regression neural network with fruit fly optimization algorithm. Knowl. Based Syst. 2013, 37, 378–387. [Google Scholar] [CrossRef]
- Chen, C.L.P.; Wen, G.-X.; Liu, Y.-J.; Wang, F.-Y. Adaptive Consensus Control for a Class of Nonlinear Multiagent Time-Delay Systems Using Neural Networks. IEEE Trans. Neural Netw. Learn. Syst. 2014, 25, 1217–1226. [Google Scholar] [CrossRef]
- Chang, C.-C.; Lin, C.-J. LIBSVM: A Library for Support Vector Machines. ACM Trans. Intell. Syst. Technol. 2011, 2, 1–27. [Google Scholar] [CrossRef]
- Alshari, E.M.; Azman, A.; Doraisamy, S.; Mustapha, N.; Alkeshr, M. Effective method for sentiment lexical dictionary enrichment based on Word2Vec for sentiment analysis. In Proceedings of the 2018 Fourth International Conference on Information Retrieval and Knowledge Management (CAMP), Kota Kinabalu, Malaysia, 26–28 March 2018; pp. 1–5. [Google Scholar] [CrossRef]
- Deepa, D.; Tamilarasi, A. Sentiment analysis using feature extraction and dictionary-based approaches. In Proceedings of the 2019 Third International Conference on I-SMAC (IoT in Social, Mobile, Analytics and Cloud) (I-SMAC), Palladam, India, 12–14 December 2019; pp. 786–790. [Google Scholar] [CrossRef]
- Liu, Y.; Teichert, T.; Rossi, M.; Li, H.; Hu, F. Big data for big insights: Investigating language-specific drivers of hotel satisfaction with 412,784 user-generated reviews. Tour. Manag. 2017, 59, 554–563. [Google Scholar] [CrossRef]


| Attribute | Seed Words | Attribute | Seed Words |
|---|---|---|---|
| Signal | signal; baseband; call, etc. | Screen | screen; resolution; display; clarity, etc. |
| Battery | battery; standby; power, etc. | Network | WI-FI; internet; wireless, etc. |
| Sound quality | sound effects; voice; horn, etc. | System | system; iOS, etc. |
| Storage | memory; 256 GB; storage capacity, etc. | Unlock method | unlock; fingerprint; facial recognition, etc. |
| Processor | chip; CPU; A12, etc. | Appearance | appearance; color; size, etc. |
| Camera | camera; photo; pixel, etc. | Brand | iPhone; Apple, etc. |
| Mapping Rule | Attribute Category |
|---|---|
| One-dimensional | |
| Reverse | |
| Attractive | |
| Must-be | |
| Indifferent | |
| Questionable |
| Attribute | Value | Value | Category | ||
|---|---|---|---|---|---|
| Signal | 0.0019 | 0.135 | 0.2446 | *** | Must-be |
| Battery | −0.0002 | ** | 0.1439 | *** | Must-be |
| Sound quality | 0.0040 | * | 0.0168 | *** | One-dimensional |
| Storage | 0.0143 | *** | 0.0000 | 0.326 | Attractive |
| Processor | 0.0101 | *** | 0.0653 | *** | Must-be |
| Camera | 0.0069 | ** | 0.0352 | ** | Must-be |
| Screen | 0.0102 | *** | 0.0667 | *** | Must-be |
| Network | 0.0187 | *** | 0.1437 | *** | Must-be |
| System | 0.0123 | *** | 0.1106 | *** | Must-be |
| Unlock method | 0.0124 | *** | 0.00272 | * | Attractive |
| Appearance | 0.0105 | *** | 0.1315 | *** | Must-be |
| Brand | 0.0122 | *** | 0.1234 | *** | Must-be |
| Attribute | Graph of Curve | Expressions |
|---|---|---|
| Must-be attribute | 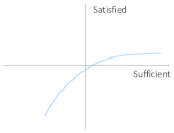 | Logarithmic function: Power function: Exponential function: |
| Attractive attribute | 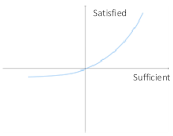 | Power function: Exponential function: |
| One-dimensional attribute | 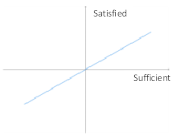 | Linear function: |
| Indifferent attribute |  | Constant function: |
| Reverse attribute | 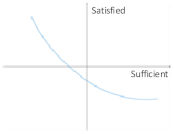 | Logarithmic function: Power function: Exponential function: or Linear function: |
| Models | USDM | BPNN | GRNN | Strict RBFNN | Approximate RBFNN |
|---|---|---|---|---|---|
| 0.052719 | 0.460879 | 0.180084 | 0.455696 | 0.455696 | |
| Training MSE | 0.000516 | 0.006996 | 0.000470 | 0.000311 | 0.000311 |
| Test MSE | 0.000538 | 0.006893 | 0.000556 | 0.001110 | 0.001110 |
| Models | SVM regression | MLR | RG1: | RG2: | RG3: |
| 0.234577 | 0.033737 | 0.035314 | 0.033747 | 0.005082 | |
| Training MSE | 0.001117 | 0.000553 | 0.000553 | 0.000553 | 0.000570 |
| Test MSE | 0.001126 | 0.000581 | 0.000580 | 0.000581 | 0.000592 |
| Models | RG4: | PR1: | PR2: | ||
| 0.031751 | 0.054268 | 0.080678 | |||
| Training MSE | 0.000554 | 0.000542 | 0.000527 | ||
| Test MSE | 0.000579 | 0.000579 | 0.000582 |
Disclaimer/Publisher’s Note: The statements, opinions and data contained in all publications are solely those of the individual author(s) and contributor(s) and not of MDPI and/or the editor(s). MDPI and/or the editor(s) disclaim responsibility for any injury to people or property resulting from any ideas, methods, instructions or products referred to in the content. |
© 2024 by the authors. Licensee MDPI, Basel, Switzerland. This article is an open access article distributed under the terms and conditions of the Creative Commons Attribution (CC BY) license (https://creativecommons.org/licenses/by/4.0/).
Share and Cite
Li, S.; Zhu, B.; Zhang, Y.; Liu, F.; Yu, Z. A Two-Stage Nonlinear User Satisfaction Decision Model Based on Online Review Mining: Considering Non-Compensatory and Compensatory Stages. J. Theor. Appl. Electron. Commer. Res. 2024, 19, 272-296. https://doi.org/10.3390/jtaer19010015
Li S, Zhu B, Zhang Y, Liu F, Yu Z. A Two-Stage Nonlinear User Satisfaction Decision Model Based on Online Review Mining: Considering Non-Compensatory and Compensatory Stages. Journal of Theoretical and Applied Electronic Commerce Research. 2024; 19(1):272-296. https://doi.org/10.3390/jtaer19010015
Chicago/Turabian StyleLi, Shugang, Boyi Zhu, Yuqi Zhang, Fang Liu, and Zhaoxu Yu. 2024. "A Two-Stage Nonlinear User Satisfaction Decision Model Based on Online Review Mining: Considering Non-Compensatory and Compensatory Stages" Journal of Theoretical and Applied Electronic Commerce Research 19, no. 1: 272-296. https://doi.org/10.3390/jtaer19010015
APA StyleLi, S., Zhu, B., Zhang, Y., Liu, F., & Yu, Z. (2024). A Two-Stage Nonlinear User Satisfaction Decision Model Based on Online Review Mining: Considering Non-Compensatory and Compensatory Stages. Journal of Theoretical and Applied Electronic Commerce Research, 19(1), 272-296. https://doi.org/10.3390/jtaer19010015