Article

Exploring Tourists’ Behavioral Patterns in Bali’s Top-Rated Destinations: Perception and Mobility

by
Dian Puteri Ramadhani
,
Andry Alamsyah
*,
Mochamad Yudha Febrianta
and
Lusiana Zulfa Amelia Damayanti
School of Economic and Business, Telkom University, Jawa Barat 40257, Indonesia
*
Author to whom correspondence should be addressed.
J. Theor. Appl. Electron. Commer. Res. 2024, 19(2), 743-773; https://doi.org/10.3390/jtaer19020040
Submission received: 16 February 2024 / Revised: 25 March 2024 / Accepted: 26 March 2024 / Published: 1 April 2024
(This article belongs to the Topic Online User Behavior in the Context of Big Data)

Abstract

:
The tourism sector plays a crucial role in the global economy, encompassing both physical infrastructure and cultural engagement. Indonesia has a wide range of attractions and has experienced remarkable growth, with Bali as a notable example of this. With the rapid advancements in technology, travelers now have the freedom to explore independently, while online travel agencies (OTAs) serve as important resources. Reviews from tourists significantly impact the service quality and perception of destinations, and text mining is a valuable tool for extracting insights from unstructured review data. This research integrates multiclass text classification and a network analysis to uncover tourists’ behavioral patterns through their perceptions and movement. This study innovates beyond conventional sentiment and cognitive image analysis to the tourists’ perceptions of cognitive dimensions and explores the sentiment correlation between different cognitive dimensions. We find that destinations generally receive positive feedback, with 80.36% positive reviews, with natural attractions being the most positive aspect while infrastructure is the least positive aspect. We highlight that qualitative experiences do not always align with quantitative cost-effectiveness evaluations. Through a network analysis, we identify patterns in tourist mobility, highlighting three clusters of attractions that cater to diverse preferences. This research underscores the need for tourism destinations to strategically adapt to tourists’ varied expectations, enhancing their appeal and aligning their services with preferences to elevate destination competitiveness and increase tourist satisfaction.

1. Introduction

The tourism sector has a significant role in the global economy. This sector integrates tangible infrastructural entities [1] with intangible aspects [2]. Considering the number of elements associated with the tourism sector, its substantial impact on the economy becomes undebatable. Tourism catalyzes employment opportunities across diverse skill sets, allies industries, and generates revenue from international tourists [3,4]. Tourism is an indispensable pillar for a nation’s economic health and prosperity [5].
Indonesia, an archipelago of over 17,000 islands, has a diverse combination of cultures, pristine natural wonders, and historical landmarks, positioning it as a distinguished nation within international tourism. During the initial quarter of 2023, Indonesia observed a remarkable upsurge in its inbound foreign tourists, with tourist arrivals surpassing 2.25 million [6]. This substantial growth of 508.87% compared to the prior year’s corresponding period highlights Indonesia’s consistent attractiveness as a notable travel destination [6].
Bali, often referred to as the “Island of the Gods”, has consistently been an epicenter of Indonesia’s thriving tourism industry [7]. The nation’s archipelago uniquely blends natural beauty, cultural richness, and historical significance. Famed for its temples, diverse landscapes, and vibrant arts, the island attracts millions annually, generating rapid tourism growth. Bali encompasses an extensive geographical area, with tourist locales distributed from its densely frequented southern zones to its less-traversed northern, western, and eastern regions. This wide-ranging experience establishes Bali as a destination of considerable appeal and captivating charm for travelers worldwide.
Modern tourist behavior has undergone significant changes due to advancements in technology and connectivity [8]. With the rise of digital platforms and increased information accessibility, contemporary travelers have the autonomy to independently explore destinations, obviating the requirement for guided tour services [9]. Travelers enjoy exploring destinations based on their personal preferences and inclinations. The advent of the internet and the expansion of diverse platforms have shifted how travelers explore and access information about tourist destinations. Tourists commonly rely on online travel agencies (OTAs) as valuable references when planning their travel experiences [10]. Frequently, tourists depend on the digital traces shared by other tourists who have previously visited a location to ascertain their potential interest [11]. This practice allows them to make a well-informed choice to guarantee alignment between the destination and their personal preferences and travel aims [12,13].
Typically, tourists give reviews of destinations that encapsulate their experiential perspectives [14]. These appraisals encompass a spectrum of responses that include the feelings of happiness to disappointment [15]. The data embedded within this digital footprint offer the potential, when harnessed, to produce valuable insights. These insights pertain to the comprehensive evaluation of tourists’ viewpoints across various aspects of tourism. The digital data allows stakeholders to improve their offerings, enhance visitor experiences, and customize their services to better align with the preferences and expectations of travelers in a precise manner [14].
Analyzing tourist behavior is an essential focus for tourism researchers. Identifying the various factors influencing travel choices remains a core area of investigation in tourism studies [16]. Significant research in tourism management consistently points out the critical influence of the tourist’s perception of a destination. As a service-oriented sector, tourism heavily relies on tourists’ experiences and perceptions [17]. Reviews reflecting happiness or disappointment are important to prove service quality and influence a destination’s image [18]. One of the crucial perceptions of a destination that tourism stakeholders need to consider is the tourist’s cognitive image [19,20,21]. The cognitive image of a tourism destination refers to people’s perceptions about the place, shaped by information, experiences, and media [22,23,24]. Favorable reviews conveying tourists’ sentiments of satisfaction might serve as natural promotional mechanisms to attract visitors. Critiques articulating dissatisfaction indicate the sectors warranting enhancement in service provisioning and destination management, and additionally assume the role of warning signals for tourist destinations to address specific aspects that might have been unintentionally overlooked.
Recent studies highlight the importance of analyzing tourists’ behavior through their spatial movements. The network concept is essential in tourism research for investigating tourist mobility and their visiting patterns across various destinations. In tourism, the network is commonly conceptualized with ‘nodes’ representing tourist destinations and ‘edges’ signifying the connections between these destinations, which often include tourist travel routes. These networks are vital in understanding the relationships within the tourism system [25].
Traditional studies face challenges in uncovering tourists’ perception of destination image and mobility. Some problems are the time-consuming surveys used, response bias, issues with observation accuracy, and the need for prolonged data collection. The rise of social media has transformed tourism research by providing a dynamic and rich source of data for tracking travel trends and behaviors. This “stay connected” behavior offers opportunities for research into tourists’ behaviors and preferences [14].
The widespread internet connectivity across most of Bali has supported tourists in sharing information about their travel experiences on various digital media and navigation services, such as Google Maps, as well as platforms specifically dedicated to tourism, like TripAdvisor. Hundreds of millions of reviews related to tourist destinations in Bali have been written, including satisfaction ratings, narrative experiences, and various other information. The review data serve as both an intriguing and meaningful resource. The data are fascinating due to their open nature, meaning that they are accessible to anyone, and meaningful because tourists generally write reviews based on their genuine feelings, with no intention of contributing to research. This results in information that tends to be more honest and reduces the potential informational biases that could disadvantage stakeholders. This digital footprint creates the opportunity for more comprehensive studies of tourist behavior.
This opportunity comes with its challenges. The narrative experience data found on digital media predominantly exist in unstructured textual forms. The complexity arising from the complexities in processing these data prohibits the use of conventional methods for data handling [26]. An advanced data analytics approach is needed to derive valuable insights from this textual dataset [14]. Data analytics possesses the capability to address these complexities.
Since textual representation constitutes the predominant format of review data, text mining emerges as a helpful approach that offers a precise means of managing and deriving insights from these data. Text mining, also known as text analytics, is a computational process that involves extracting valuable information, insights, and patterns from large volumes of unstructured textual data. Text mining encompasses a range of advanced algorithms and methodologies designed to transform unstructured text into structured and analyzable data [27]. Regarding mobility, network science provides a modern and efficient approach to understanding the intricate systems prevalent in tourism [28,29], based on large-scale unstructured data. The destinations are conceptualized as interconnected networks, wherein the network’s topology reveals travel patterns within the tourism ecosystem [30].
The advanced analysis of tourist behavior, especially for destinations’ image perception and tourist mobility, has been approached with varying focuses and methodologies. The first study conducted by Ramadhani et al. [14] laid the groundwork by mapping tourists’ mobility based on their digital traces on tourist platforms, without considering the dimension of cognitive image. The following study by Ramadhani et al. [31] expanded its scope to consider the classification of tourists’ problems and their mobility networks, although within two unrelated workflows. Alamsyah et al. [7] came closer to our research interest by considering cognitive image alongside tourist mobility but did not discuss the interrelations between the sentiments of different cognitive classes.
Our study advances the boundaries of previous studies that were limited to a stand-alone examination of the sentiments and cognitive images articulated by reviewers for each tourist destination. We introduce a pioneering approach that extends the analysis beyond evaluating tourists’ sentiments, cognitive image perceptions, and mobility. We use text classification, specifically sentiment analysis, to derive sentiment polarity scores for each review and employ multilabel classification to categorize the reviews that address specific dimensions of the destinations’ cognitive image. Our approach aims to extract the sentiment polarities, with cognitive image dimensions, highlighted by each tourist. A network approach is used to reveal more profound insights into the patterns of tourist mobility. We implement network analysis techniques to visually map the interlinkages between destinations based on sentiment polarization. This analytical paradigm helps us understand the key nodes of tourist mobility and the intricate interplay of sentiments spanning different dimensions. Finally, we focus on the co-occurrence of cognitive image dimensions within the same individual’s mind and examine the sentiment correlation between cognitive image dimensions. This research marks a significant advancement in the scientific comprehension of tourist behavior and fosters the creation of more competitive and sustainable tourism offerings that resonate with diverse tourist behaviors.

2. The Related Literature

This section examines scholarly works on tourist behavior, destination image, and tourist mobility, laying the groundwork for comprehending the tourism-related themes discussed in this paper.

2.1. Tourist Behavior

The pervasive availability of Internet access across numerous tourism destinations has significantly bolstered the use of social media for sharing personal narratives and travel experiences [32]. This development has altered tourist behaviors, with social media playing a crucial role in travel planning and influencing decision-making processes. Social media affects tourists’ behaviors, guiding their choices and experiences in various ways [33]. Understanding the evolution of tourist behavior is a crucial area of interest for tourism researchers.
The comprehension of the diverse determinants shaping travel behaviors remains a pivotal research theme within the tourism discipline [16]. A notable model frequently explored in this context is the Theory of Planned Behavior (TPB), which evolved from the Theory of Reasoned Action (TRA) [34] and was subsequently refined by Ajzen [35,36]. The TPB has been widely recognized for its robust predictive capacity across a spectrum of behavioral contexts, including, but not limited to, hotel selection [37], destination selection processes [38], etc.
March and Woodside [39] critique the theory’s predictive precision, noting that the presence of behavioral intention signifies a propensity towards attempting a specific behavior, rather than serving as a definitive precursor to an actual behavioral enactment. Among all antecedents of behavior, behavioral intention serves as the most immediate determinant and the most accurate predictor of behavior. The concept of behavioral intention is characterized by the degree to which an individual has formulated conscious plans or efforts to engage in or refrain from a particular behavior in the future, as indicated in previous research [40]. In contrast, actual behavior is defined as the actions resulting from behavioral intention [41]. Expanding on this framework, Javed et al. [42] assert that tourists’ behavioral intentions significantly influence their actual behaviors, particularly in the context of selecting a travel destination. Considering the critical role of behavioral intention in determining actual behavior, several factors have been identified as significantly influencing behavioral intention [43].
Research in the field of tourism management has consistently highlighted the significant role that the image of a destination plays in influencing tourist behavior. Collective findings from a range of studies [44,45,46,47,48,49,50] have provided robust evidence that destination image impacts behavioral intentions in both direct and indirect ways. These findings suggest that destination image contributes positively to tourists’ decision making and offers predictability in tourism behaviors.
Recent research underscores the significance of examining tourists’ spatial behaviors. The integration of new technologies into tourism studies has surged, enabling a more sophisticated analysis of tourist mobility patterns [51,52]. These technological advancements offer an innovative approach to examining tourist mobility patterns, allowing for studies across larger populations that enrich traditional and smaller-scale survey research. The advent of big data has further expanded the scope of tourist mobility analyses, allowing for deeper insights into various dimensions of tourists’ movement. Most of the findings from these studies predominantly focus on outlining the common behavioral trends observed within this population.

2.2. Destination Image

A tourism destination is a crucial area in which tourists engage in activities, ranging from particular sites to city areas [53,54]. Tourists’ behavior is influenced by the quality of the destination they visit. High-quality destinations improve both tourist experiences and attract visitors [55]. Tourists seek quality destinations for a positive experience [12]. As a result, the assessment of a tourism destination’s quality has become a central focus in numerous research studies [56,57]. The image holds a crucial position for destination marketers in distinguishing their destination within the context of the intense competition in the market [58]. Destination attributes summate to a brief description of a destination’s fundamental characteristics, including the destination’s image [59].
Destination image is crucial in effective tourism management and destination marketing [18]. The conceptualization of the destination image, introduced by Crompton [60], gained significant traction during the early phases of destination image research. Crompton [60] defined a destination image as a composite collection of an individual’s beliefs, ideas, and impressions concerning a particular destination. Destination images contain a subjective arrangement of details about a destination, made by individuals, influencing tourist behavior [61].
A conceptual framework of destination images comprising three core constituents, cognitive, affective, and conative, has been proposed [62]. Many scholars agree that the comprehensive evaluation of a tourist destination encompasses three critical aspects that shape a tourist’s inclination to consider visiting the destination [63,64,65,66,67]. The cognitive image pertains to tourists’ perceptual evaluations of destination attributes, encompassing attractions, environmental conditions, public amenities, and infrastructural facilities. The affective image involves their cognitive appraisal, influenced by personal attitudes and values. The conative image pertains to the intention or propensity of tourists to visit, reflecting their inclination towards travel [62]. The significance of formulating destination images, for managers, is underpinned by their essential role in shaping tourists’ decisions and behaviors [68]. The overstated and unrealistic representation of destination images potentially delivers long-term harm to a destination’s future [69].
In the current digital age, tourists can utilize online resources to research potential travel destinations, transportation options, lodging, and recreational activities [70]. Recent recognition from both scholars and industry experts has highlighted the indispensable role of the Internet in shaping our perceptions of travel destinations. Studies have demonstrated that online searches profoundly influence both the cognitive perceptions and emotional responses associated with a destination’s image. However, the focus of much of this research has traditionally been on the cognitive aspects of destination images [71,72,73]. User-generated content on the internet, including reviews about travel destinations, accommodations, and tourism services, has become an indispensable source of information for travelers [74]. A prior study discovered that, among the fundamental components of a destination image, only the cognitive image mediates the relationship between user-generated content (UGC) and behavioral intentions, which in turn affects the future behaviors of tourists [42]. Given that this study utilizes UGC as a data source, we focus on the most pertinent dimension, the cognitive image, which is a limitation of this study.
Based on this information, we analyze the cognitive image components, as detailed in Table 1 [75], in our analysis.

2.3. Advanced Learning on Destination Image Perception

With the ever-growing abundance of digital data, it is essential to evolve our understanding of the destination image concept by leveraging sophisticated approaches. These advanced methodologies have ranged from text-based sentiment analysis to deep learning applications, each contributing valuable insights into how destinations are perceived through various lenses. Many preceding studies examining destination images have laid a foundation for our investigation. Previous studies [76] have focused on the sentiments expressed on social media post-earthquake, employing sentiment analysis and Latent Dirichlet Allocation (LDA) topic modeling to interpret public emotions and themes. This approach was instrumental in identifying shifts in public perception over time, a crucial understanding for post-crisis destination management. Lalicic et al. [77] utilized compositional data analysis to scrutinize Airbnb reviews, thus offering a designative, appraising, and prescriptive perspective on destination images. Their findings underscored the critical role of peer-to-peer accommodation experiences in shaping destination images, highlighting the role of personal experience in image formation.
Similarly, Lingkun Meng et al. [78] adopted a big-data approach to explore the destination image gap in Sanya City, revealing discrepancies between tourists’ cognitive images and its official positioning. Arefieva et al. [79] utilized the power of deep learning to cluster Instagram images, providing insights into the visual representations of tourist destinations. Qian et al. [80] analyzed user-generated photos to explore the destination images of dark tourism.
Lee and Park [81] conducted a mixed-methods analysis to explore the cross-cultural dimensions of a destination image. They explored the multifaceted nature of destination images across different cultures through text mining, sentiment analysis, and cross-cultural surveys, emphasizing the need for culture-based destination marketing approaches. They provided an extensive understanding of how various nationalities perceive different dimensions of destination images, such as infrastructure and cultural heritage. Unlike image-based analyses, which predominantly interpret the visual representation of destinations, a text-based approach allows for the extraction of explicit sentiments and the intricate subtleties of tourist experiences, as expressed in their own words. Textual data offer direct articulations of tourist perceptions, encompassing various cognitive evaluations—from the tangible aspects like infrastructure to intangible dimensions such as atmosphere and social environment. This comprehensive textual analysis facilitates a more granular understanding of the tourist experience, as it captures the richness of the descriptive language that tourists use to convey their encounters and impressions. It also enables the discernment of specific patterns in tourist decision-making processes, often communicated through detailed narratives in reviews. A textual analysis allows for a direct engagement with the tourist’s voice, capturing their explicit sentiments and nuanced commentary.

2.4. Tourist Mobility

Mobility is a pivotal factor in driving the economic growth of the tourism sector [82]. Understanding tourist mobility patterns is crucial for effective tourism planning and management, as it offers insights into travelers’ preferences, aiding in the development of tourism routes, marketing strategies, and destination recommendations [83,84,85]. Traditional methods like surveys and interviews have been employed to study tourism mobility [52], but network science theory offers a modern approach to understanding the complex systems within tourism [28]. This theory suggests that destinations can be viewed as interconnected network systems, where the topology of these networks significantly influences travel patterns and flows, creating diverse networks within the tourism ecosystem [30].

2.5. Network Science in Tourism
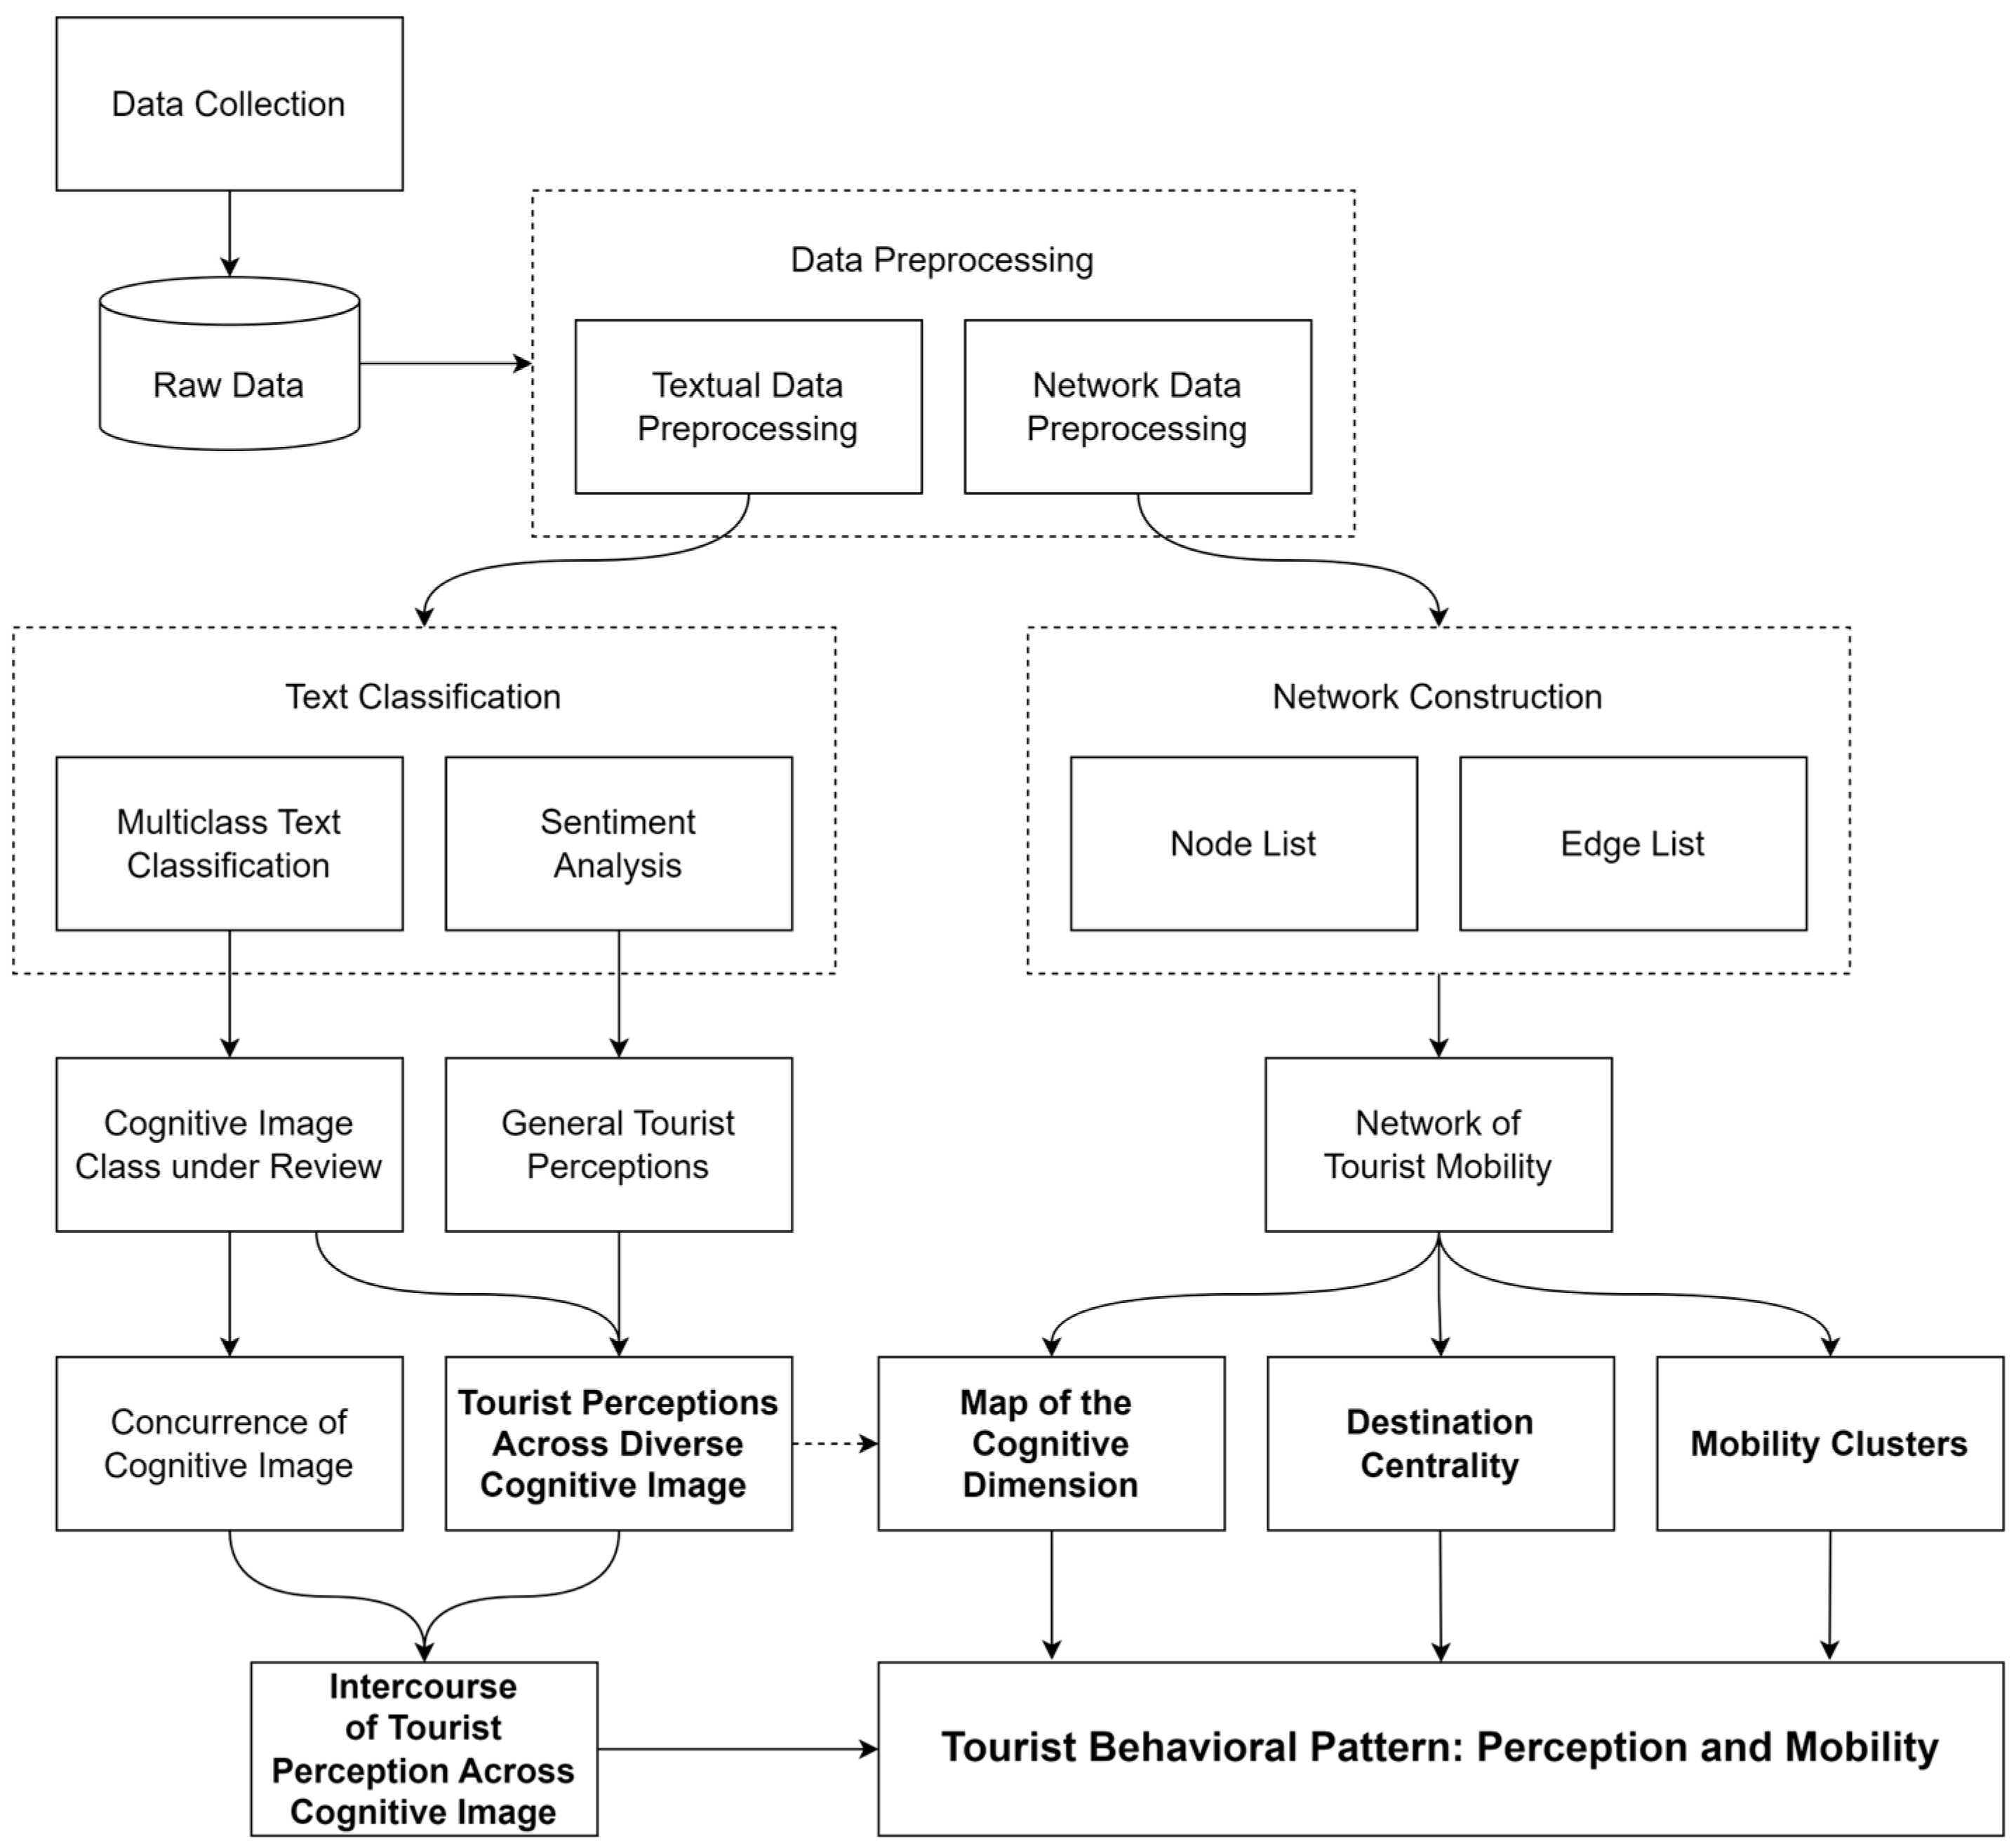
Originating from the mathematical foundations of graph theory, network science examines network models, intending to uncover universal principles that can explain both the structural characteristics and the dynamics of networks. This field aims to provide a comprehensive understanding of observed systems by modeling their behavior and identifying their underlying patterns [83]. Network analysis offers a robust methodology for exploring complex interrelationships between diverse entities [86]. This method involves creating networks by organizing data into matrices, subsequently producing essential network metrics through detailed computations [87]. In the context of tourism research, networks are often structured with nodes as visited destinations and edges representing the linkages between nodes, contingent on the visitor traffic to particular destinations [7,14,31].
Rooted in graph theory, network science has broadened its application beyond static models to explore dynamic systems, driven by both empirical and theoretical inquiry. This approach is particularly impactful in tourism, where network analysis illuminates the connections between destinations, enhancing tourism quality [28]. It effectively maps tourist mobility, uncovering the spatial patterns and relationships among destinations [80]. Studies [29,88,89] have demonstrated its application in analyzing tourist flows and networks globally.
The advent of social media has revolutionized tourism research, offering a rich, real-time data source for analyzing travel patterns and behaviors. About 65% of users turn to social media for travel ideas [90], indicating its significant influence on travel planning and sharing. This user-generated content enriches the dataset available for analysis but poses new challenges, particularly for researchers without a computer science background. The characteristics of big data, encapsulated by the four Vs (volume, velocity, variety, and veracity) [91], necessitate advanced data analytic capabilities. Despite these challenges, the utilization of social media in tourism studies is flourishing, leveraging digital footprints to conduct analyses at unprecedented scales and resolutions. Series of studies [51,92,93,94,95] have underscored the growing importance of social media data in understanding tourists’ behavior, preferences, and satisfaction in real time, enriching the field of tourism and hospitality research with deep, actionable insights.

3. Methodologies

This study adopts a data analytics methodology that includes data collection, analysis, and conclusion formulation. We leverage text classification to extract insights from large text datasets and employ network analysis to examine the relationships and structures within the data to provide a comprehensive analysis that informs our conclusions. The research workflow is illustrated in Figure 1 and further explained in detail in the following subsection.

3.1. Data Collection

Our analysis involves user-generated content (UGC) from a reputable online review platform, TripAdvisor, and 56,448 reviews about popular destinations in Bali. The dataset included reviewer usernames, evaluation content, visit context, and ratings, with no time restrictions on the reviews collected. These review data are open source and accessible to everyone. Our dataset is constrained to information that is openly available on the platform. Hence, we have abstained from incorporating demographics or any other form of private data. TripAdvisor was selected as the data source for this research based on data availability and accessibility.
The collected data require preliminary preprocessing before being subjected to analysis. A text preprocessing stage is employed to elevate our dataset’s quality and structural coherence. Following the research workflow, the data preprocessing phase is divided into textual and network data processing segments.

3.2. Textual Data Preprocessing

Textual data processing is conducted to ensure data compatibility with the intended text classification approach. There are several essential stages:
Transformation: converting text to a consistent format to reduce inconsistencies, including changing text to lowercase to ensure uniformity. For example, the original review “This place is REALLY nice to hike, however if you are NOT going to hike it is not worth it” is transformed to “this place is really nice to hike, however if you are not going to hike it is not worth it.
Tokenization: breaking down a block of text into smaller units called tokens to enable manageable components, allowing for further analysis at a granular level. For example: [“this”, “place”, “is”, “really”, “nice”, “to”, “hike”, “,”, “however”, “if”, “you”, “are”, “not”, “going”, “to”, “hike”, “it”, “is”, “not”, “worth”, “it”, “.]
Stemming: words are reduced to their base or root form by removing suffixes or prefixes to simplify words and consolidate related terms, reducing the complexity of the dataset. For example: [“thi”, “place”, “is”, “realli”, “nice”, “to”, “hike”, “,”, “howev”, “if”, “you”, “are”, “not”, “go”, “to”, “hike”, “it”, “is”, “not”, “worth”, “it”, “.”]
Lemmatization: linguistic simplification by reducing words to their fundamental forms while considering their grammatical context. For example: [“this”, “place”, “be”, “really”, “nice”, “to”, “hike”, “,”, “however”, “if”, “you”, “be”, “not”, “go”, “to”, “hike”, “it”, “be”, “not”, “worth”, “it”, “.”]
Stopword removal: noise is reduced by removing the common words in the text with less meaningful information, enabling a focus on words with greater semantic significance. For example: [“place”, “really”, “nice”, “hike”, “,”, “however”, “going”, “hike”, “,”, “worth”, “.”]
Rejoin Token: after applying the previous preprocessing steps, tokens may have been altered or separated. The “Rejoin Token” step involves reassembling the tokens back into coherent text while retaining the preprocessing changes. For example, “place really nice hike, however going hike, worth.
We preprocessed 56,448 textual data entries to refine the dataset for modeling. This removes mismatched and redundant text elements for a more efficient analysis phase.

3.3. Text Classification

Textual data present specific challenges due to their lack of a well-defined structure, natural ambiguity, and enhanced complexities. The nature of textual data is less favorable for pattern extraction. Text mining is a recent scientific development that aims to seek valuable insights from natural language textual data. The swift advancement of artificial intelligence and natural language processing [96,97] offers a solid technological foundation that expands the potential of robust text mining [98,99]. In the mid-1980s, text mining emerged from the combination of natural language processing (NLP) and data mining principles [100].
NLP involves a systematic computational approach to acquire insights into how humans employ, utilize, and comprehend language [101]. While data mining is primarily used to process structured database data, text mining, along with the NLP approach, is specifically designed to deal with unstructured or semi-structured textual data [102]. Prior studies defined text mining as a technique used to extract meaningful information from text data [26]. By employing machine learning algorithms and related methods, text mining analyzes unstructured text data to uncover patterns, trends, and insights [27]. This approach is widely acknowledged as nontrivial, highlighting its inherent complexity and associated challenges [102].
Text classification is a text mining technique that systematically categorizes textual content into predetermined classes or categories. This technique employs machine learning to assign text to predetermined specific classes or categories [103]. In the era of big data, text mining is important for managing and structuring extensive unstructured textual data. The notable applications of text mining include sentiment analysis to assess the emotional tone or sentiment expressed within a given text and other multiclass categorization tasks where texts are assigned to multiple classes based on their content or context.
Sentiment analysis is a technique that employs advanced natural language processing (NLP) methods to extract, transform, and evaluate the opinions expressed in text, classifying them as positive, negative, or neutral sentiments [104]. Previous research [105] explains that sentiment analysis is an automated tool capable of deriving subjective information from natural language texts, encompassing sentiments and opinions. This process generates structured and accessible knowledge that supports decision making. We use sentiment analysis to uncover tourists’ opinions about various aspects of tourist destinations and the services provided. The proposed sentiment analysis model aims to reveal the sentiments of tourists by examining their reviews of specific destinations on the online platform. The result is an understanding of general tourist perceptions, which are classified into two primary categories: positive and negative.
BERT, a neural network-based method developed by Google, revolutionizes natural language processing (NLP) with its pre-training capabilities. The method is remarkable for its in-depth understanding of language’s subtleties, mirroring human comprehension. BERT leverages transformer technology, adept at recognizing the contextual relationships between words or sub-words, which can vary based on their position in a sentence [106]. The embedded deep learning approaches in BERT facilitate a more nuanced handling of linguistic data, surpassing the intelligence of task-oriented architectures [107]. Compared to conventional machine learning methods such as Naïve Bayes and SVM, BERT provides a more advanced understanding of a word’s context within sentences. The Naïve Bayes technique is appreciated for its efficiency [108] but is less capable of understanding the contexts and assumes feature independence. Conversely, SVM is favorable in high-dimension data [109] but adjusting SVM’s parameters can be complicated and might not intuitively perceive textual contexts. Therefore, BERT emerges as the favored choice.
To come to this conclusion, we provided a labeled dataset for preparing a specialized sentiment analysis model and compared the performance of the Naïve Bayes, SVM, and BERT models, as shown in Table 2. Our findings show that BERT is superior to the other two models.
BERT-based sentiment analysis achieved the highest accuracy, at 87.20%, showcasing its superior capacity to precisely classify the sentiments related to various destinations. Its accuracy and f1 scores ensure that advanced techniques like BERT are suitable for systematically evaluating and categorizing tourists’ sentiments and opinions; this analytical approach provides a comprehensive understanding of the general perceived experiences and satisfaction levels of visitors.
In the next stage, we apply a multiclass text classification technique to categorize reviews into the destination’s cognitive image dimensions. This multiclass text classification involves systematically categorizing text within the dataset into diverse dimensions or categories. Our analysis aimed to classify the review data into six cognitive image dimensions. The construction of the classification model requires splitting the dataset into separate training and testing sets. For the training set, the reviews are annotated according to the cognitive attributes of the destination image displayed, as exemplified by the labels presented in Table 3.
Our analysis of cognitive image perception utilizes BERT as the underlying multiclass text classification method. The primary reason for choosing BERT is its proven effectiveness in comparable analytical tasks. To validate BERT’s efficacy in terms of our data, we compared the model performance of BERT to the Naïve Bayes and SVM, as shown in Table 4. The BERT model exhibited exceptional performance, achieving the highest accuracy score of 95.30% and a corresponding f1 score of 95.30%. These scores underscore the BERT model’s remarkable ability to accurately predict and classify the cognitive image perceptions associated with different destinations.
The multiclass classification methods allow us to categorize reviews according to their cognitive dimensions. The objective is to understand the cognitive image class under review. We integrate sentiment analysis with multiclass classification to categorize the cognitive image of each destination. This approach allows us to discern tourist perceptions across diverse cognitive images, thereby providing an understanding of the strengths and weaknesses inherent in the cognitive image of each destination. Through this methodology, we aim to offer a comprehensive perspective on how each destination is perceived, emphasizing areas of acclaim and potential areas for enhancement.
We extend our investigation to analyze the patterns of the cognitive classes mentioned by individual tourists, focusing on the concurrence of cognitive images. This exploration offers critical insights into the tendency of one cognitive class to be associated with others in the tourist’s mind. It is essential to recognize that these co-occurrences do not always signify the same viewpoints but also contrasting or divergent viewpoints. Advancing this line of inquiry, we examine the correlations between positive sentiments within each cognitive class. This comprehensive and systematic approach deepens our understanding of the magnitude and direction of the interactions of tourist perceptions across cognitive images, thereby enriching our knowledge of these complex tourist experiences.

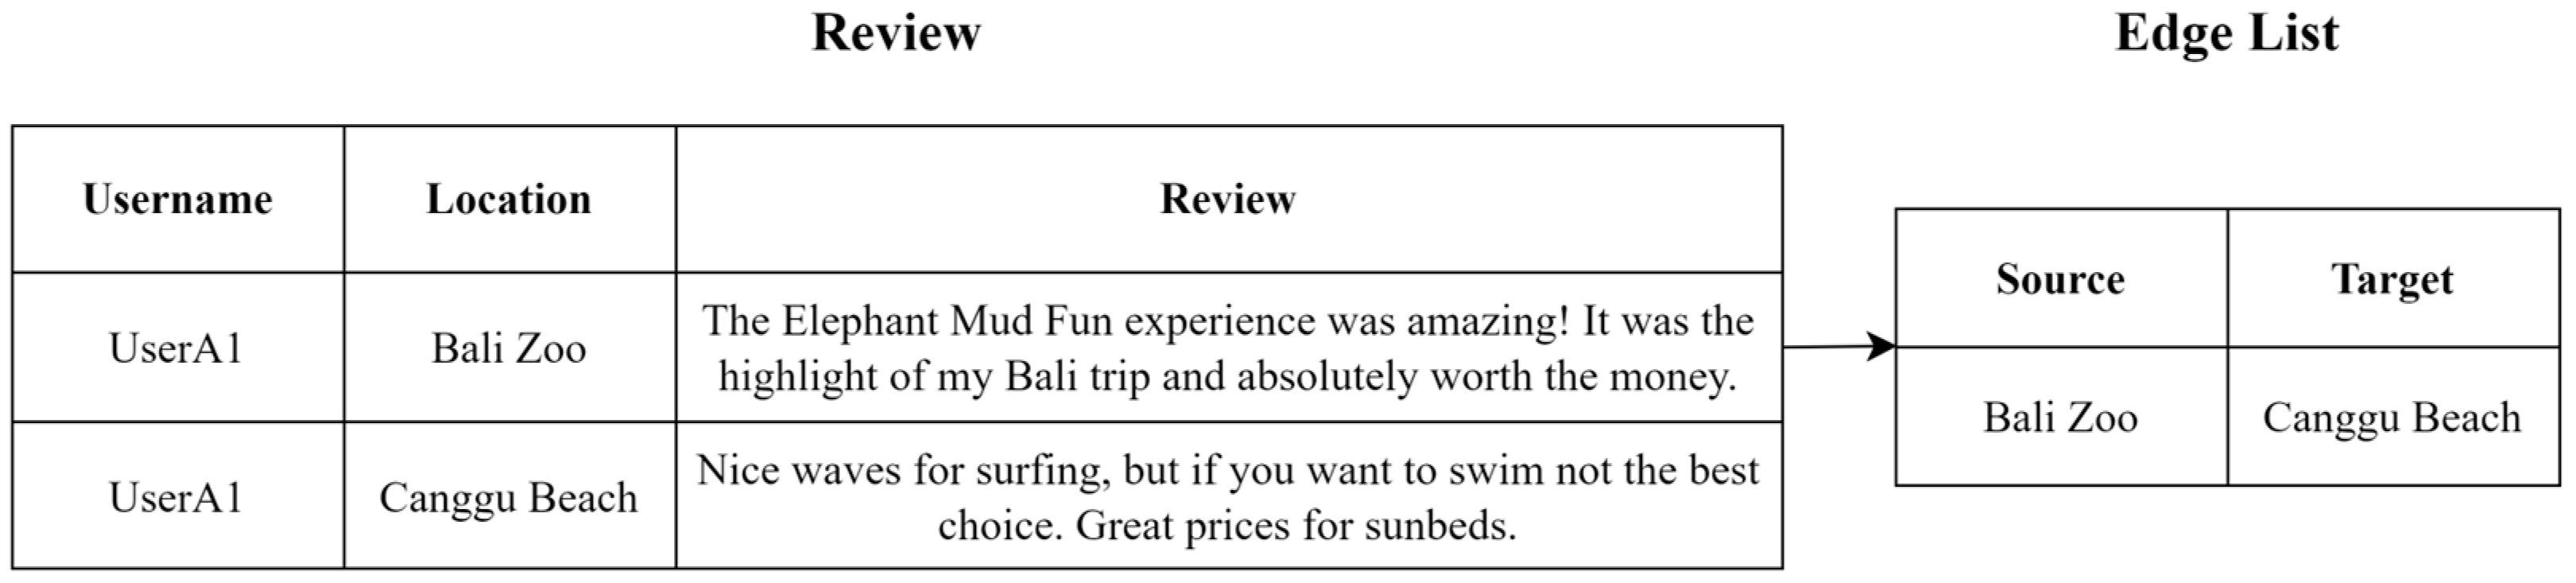
3.4. Network Data Preprocessing

The network data preprocessing stages involved the creation of two components: the node list and the edge list. The node list comprises a set of entities representing destinations and their associated characteristic information. The edge list represents the relationships or connections between the nodes, the destinations [7,14,31]. We include information on each location’s most favorable and least favorable cognitive image dimensions. Each respective node list also encompasses the location names and geographical coordinates (latitude and longitudes). The example of node list is shown in Table 5.
The construction of the edges dataset depends upon context: a user contributes reviews for different destinations (e.g., the Sacred Monkey Forest Sanctuary and Mount Batur), which indicates that they have visited both destinations. This interpretive framework serves as the foundation for generating sets of edges. The dataset of edges is constructed upon pairs of destinations. This scenario and an example of its edge list are visually shown in Figure 2.
This study involves 18 nodes from the node list and 27,412 node pairs from the edge list. The prepared node list and its corresponding edge list establish a holistic tourist visitation network with incorporated geographical mapping.

3.5. Mobility Network Construction

The network approach enhances our comprehension of complex behaviors based on their structural patterns [86]. This network ability provides insights into tourist mobility and popular destinations, giving significant information about these particular destinations. We combine tourist perceptions with diverse cognitive images to develop separate networks for the most favorable and the least favorable cognitive images. The map of these cognitive dimensions offers two main advantages. First, it visually displays visitor trends, helping us to have a better grasp of tourist activities. Second, it identifies the zones needing action for their improvement or sustainable growth. Using this combined approach deepens our comprehension of destination features and their importance in a complex tourism scenario.
Centrality is an important network parameter that plays a fundamental role in quantifying the importance of destinations by examining their positions and roles within the network structure. This study delves into various essential centrality metrics, providing a comprehensive elaboration of their meanings and implications in the context of tourism networks, as detailed in Table 6. By exploring destination centrality, this study offers insights into the structural importance of each destination in the network, revealing how certain locations serve as crucial hubs or critical connectors. This understanding is valuable for stakeholders in the tourism industry to identify the key destinations that significantly influence tourist flows and patterns.
According to Alamsyah and Ramadhani [86], in addition to network centrality, modularity is another important metric. Modularity measures the extent of community formation within a given network. The Louvain Modularity method is utilized to identify communities within the networks of interconnected companies.
The Louvain Modularity formula is a fundamental technique used in discerning different communities within a network. This formula is widely used in algorithms for community detection to calculate how a network can be divided into modules or communities that are internally more interconnected than with the larger network. The Louvain Modularity formula mathematically expresses the variance between the actual number of edges inside communities and the number of edges one would expect in a random network. The formula is as follows:
Q = 1 2 m i , j e i , j k i k j 2 m δ C i , C j ,
In the context of tourists’ mobility between destinations, the Louvain Modularity formula is applied to analyze the connectivity and grouping of these destinations. In this scenario, each node in the network represents a destination. e i , j represents the connection strength between any two nodes (destinations) i and j are determined by the frequency of tourists’ mobility between them. For nodes i and j , k i and k j represent the cumulative weights of the connecting edges associated with each of their respective connecting edges. C i and C j represent the distinct communities or groups to which destinations i and j are affiliated, based on similarities in their tourist mobility patterns. The Kronecker delta function, denoted as δ , is defined as 1 when x = y and 0 when x y . In the Louvain method, each node starts in its own community. The change in modularity ( Δ Q ) is calculated by provisionally relocating node i from its original community to other communities to which it is connected. If the relocation leads to an increase in modularity, node i is then moved to the community that offers the highest increase in Δ Q . If the move does not lead to higher modularity, node i remains in its original community. This methodical procedure is repeated for each node until no additional modularity enhancement can be achieved. Employing modularity to analyze tourist mobility behavior provides essential insights for scientific and strategic planning in the tourism industry. It allows for precisely categorizing destinations based on tourist traffic patterns, providing valuable insights into travel routes and destination clusters. This methodological approach is crucial for strategic planning and resource management in the tourism industry, enhancing our understanding of tourist behavior. The application of network analysis in tourism research, by elaborating various metrics such as centrality and modularity, provides a comprehensive framework for understanding and interpreting the complex patterns of tourist mobility.

4. Results

Our analysis centers on Bali’s most popular tourist destination and is based on a number of visitors’ feedback. Tourist destinations encompass natural wonders and religious and cultural sites, including:
(a)
Natural Wonders:
(1)
The Sacred Monkey Forest Sanctuary: a forest reserve where monkeys and natural beauty can be observed.
(2)
Sanur Beach: a serene beach known for its sunrise views.
(3)
Seminyak Beach: a popular beach known for its sunsets and beach clubs.
(4)
Mount Batur: an active volcano and trekking destination.
(5)
Pandawa Beach: a secluded beach with clear waters.
(6)
Jimbaran Bay: a beach area famous for its seafood and sunsets.
(7)
Double Six Beach: a lively beach with beach bars and sunset views.
(8)
Devil Tears: a dramatic rocky outcrop with powerful waves.
(9)
Kelingking Beach: a secluded beach with a unique cliff viewpoint.
(10)
Canggu Beach: a beach area known for its surfing.
(11)
Mount Agung: the highest peak in Bali and an active volcano.
(b)
Religious and Cultural Sites:
(1)
Uluwatu Temple: a sea temple on a clifftop with ocean views.
(2)
Tanah Lot Temple: a temple on a rock formation off the coast.
(3)
Ulun Danu Bratan Temple: a picturesque temple on Lake Bratan.
(4)
Tirta Gangga: a former royal palace with water gardens.
(5)
Lempuyang Temple: a temple complex known for its ‘Gates of Heaven’.
Our results present a comprehensive overview of the popularity of various tourist destinations in Bali based on their number of reviews, as shown in Figure 3. The Sacred Monkey Forest Sanctuary emerges as the most popular attraction, with 18,542 reviews. With 5902 reviews, Uluwatu Temple underscores tourists’ interest in historical and spiritual landmarks. The Sanur Beach and Tanah Lot Temple, both surpassing 4000 reviews, show the beauty of Bali’s coastal and religious sites. A closer look at the data shows that even though Seminyak Beach and Nusa Dua are famous beaches, they have received average review numbers, while places like Mount Batur, Ulun Danu Bratan Temple, Kelingking Beach, Lempuyang Temple, Canggu Beach, and Mount Agung have fewer reviews. This might mean that they are not being promoted enough for tourism or that they cater to a particular segment of travelers, or that visitors do not feel as compelled to leave a review as they do for top destinations.
While review counts serve as an instrumental metric in understanding tourist preferences, we also discovered deeper information about the touristic aspects of Bali, the diverse sentiments and interests of its visitors, and potential areas of focus for tourism development. We present these findings in several sections to provide a detailed view of them.

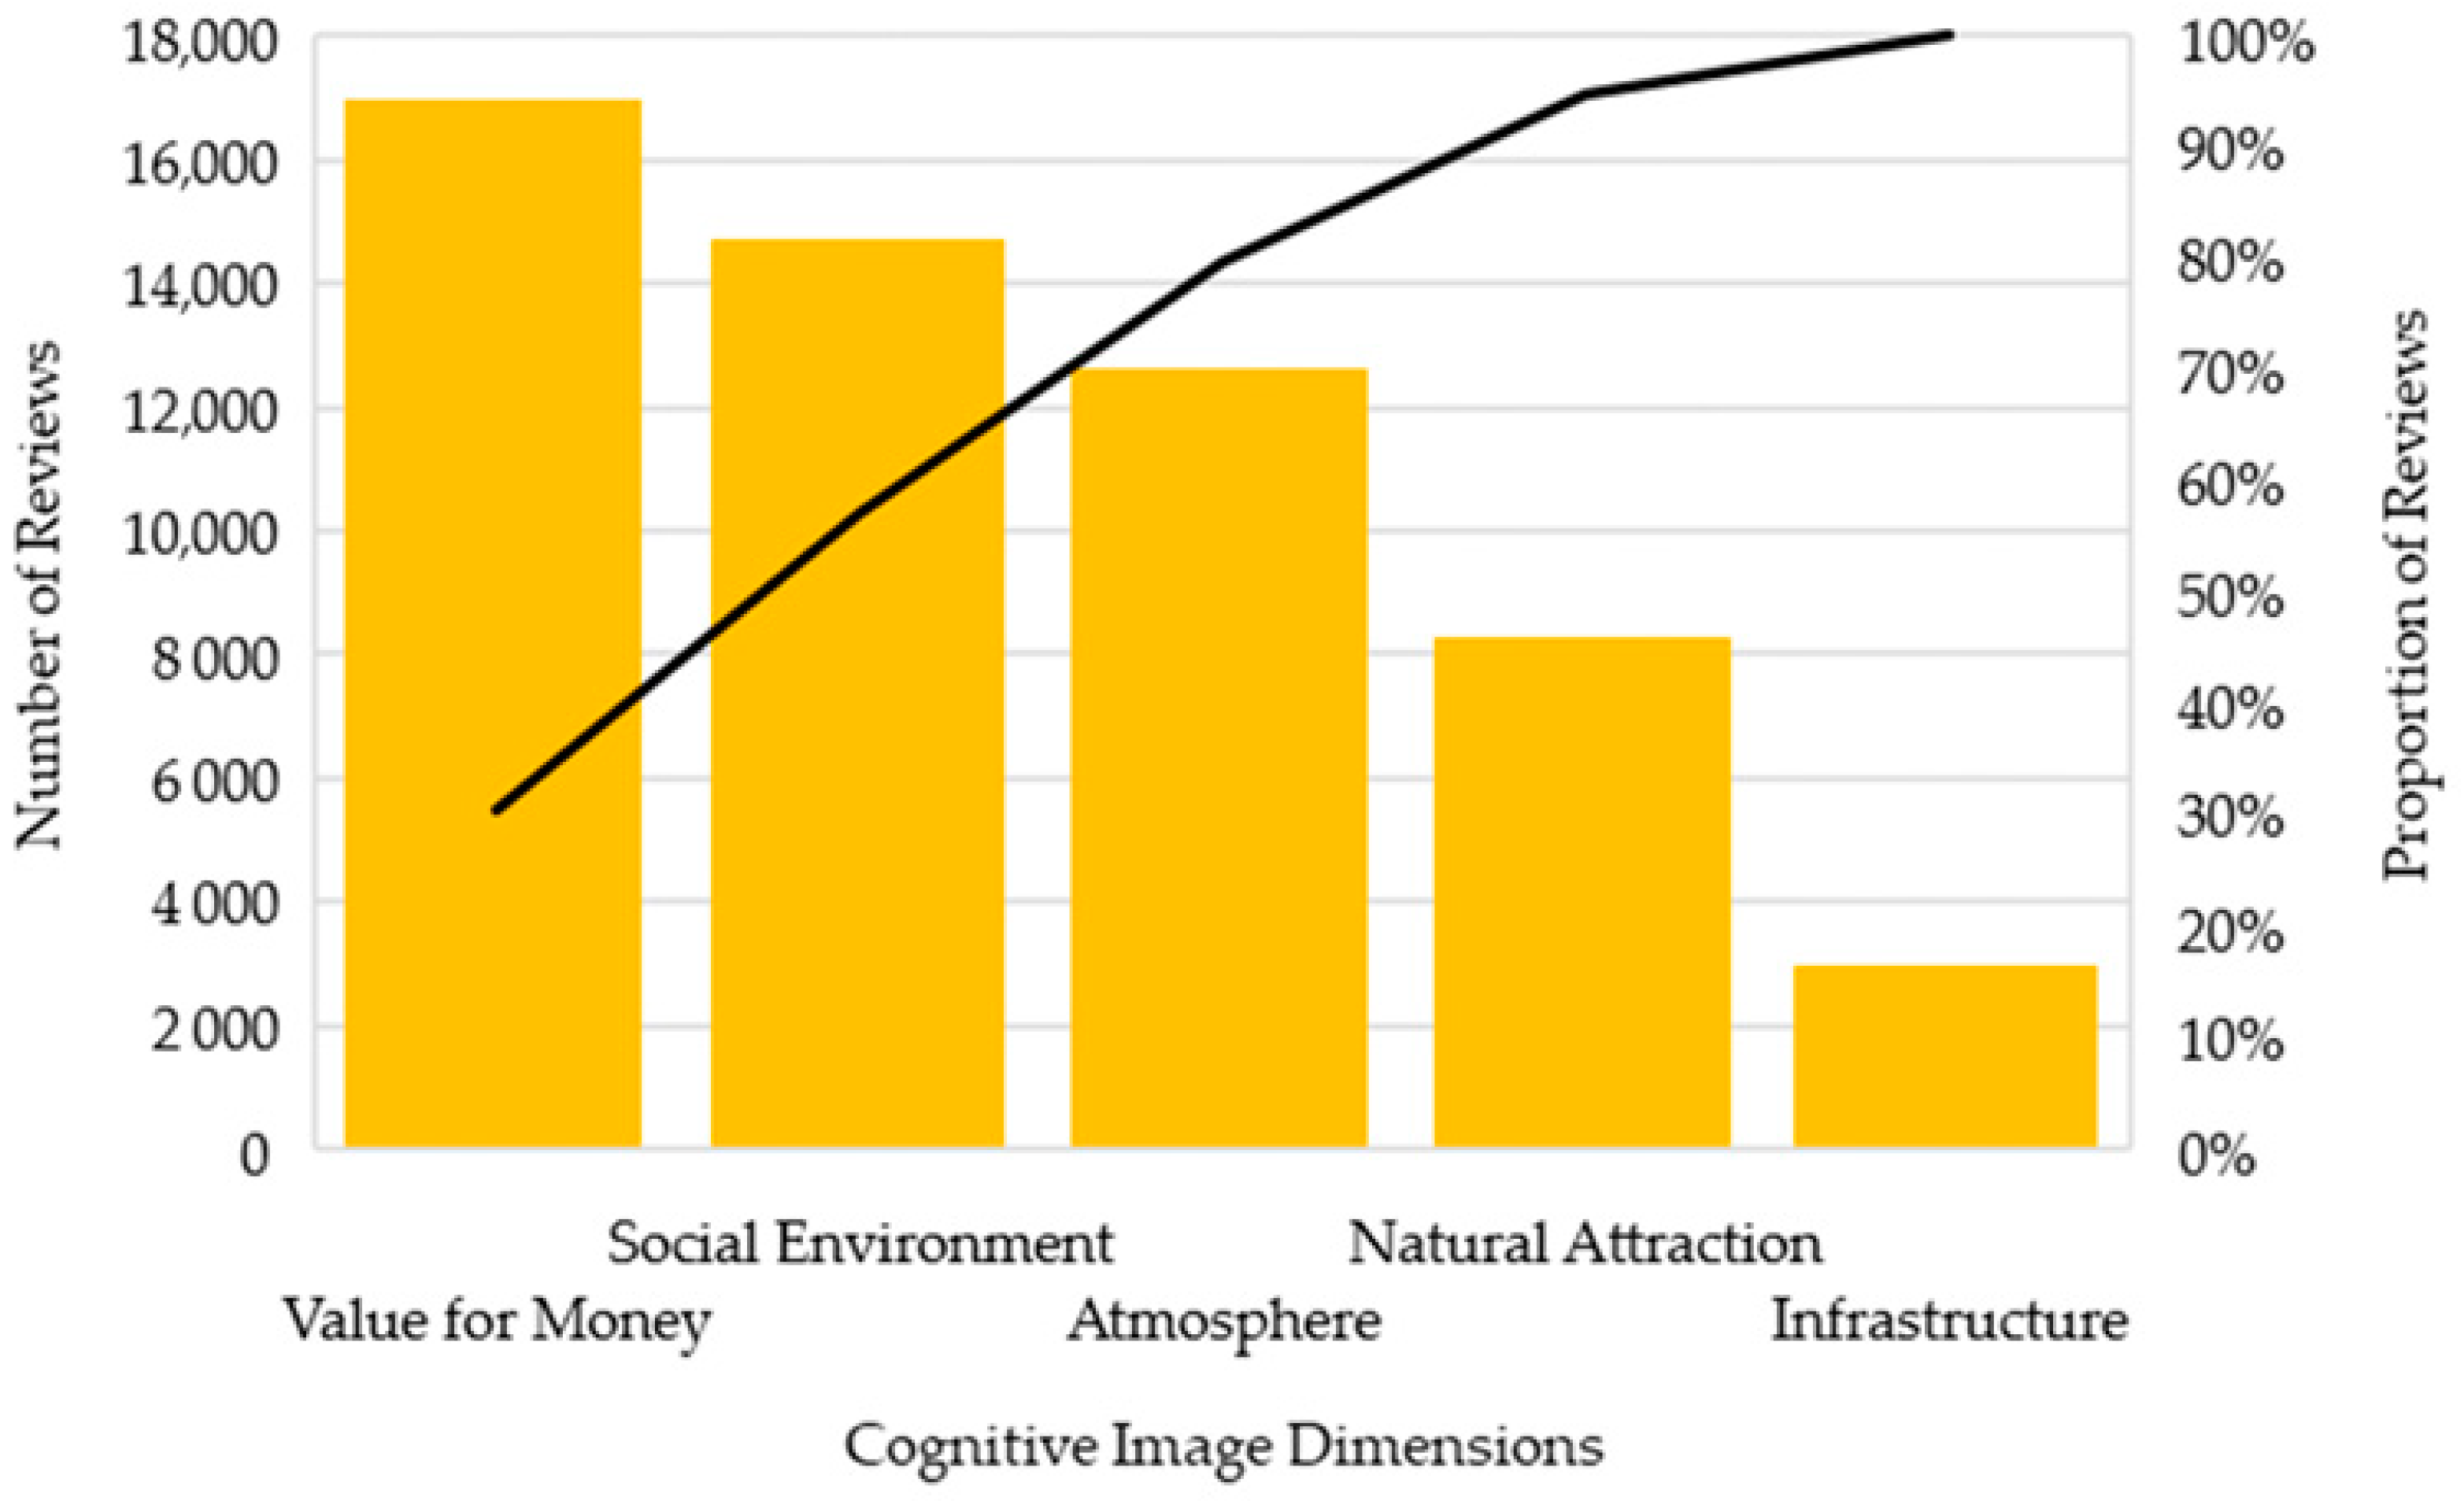
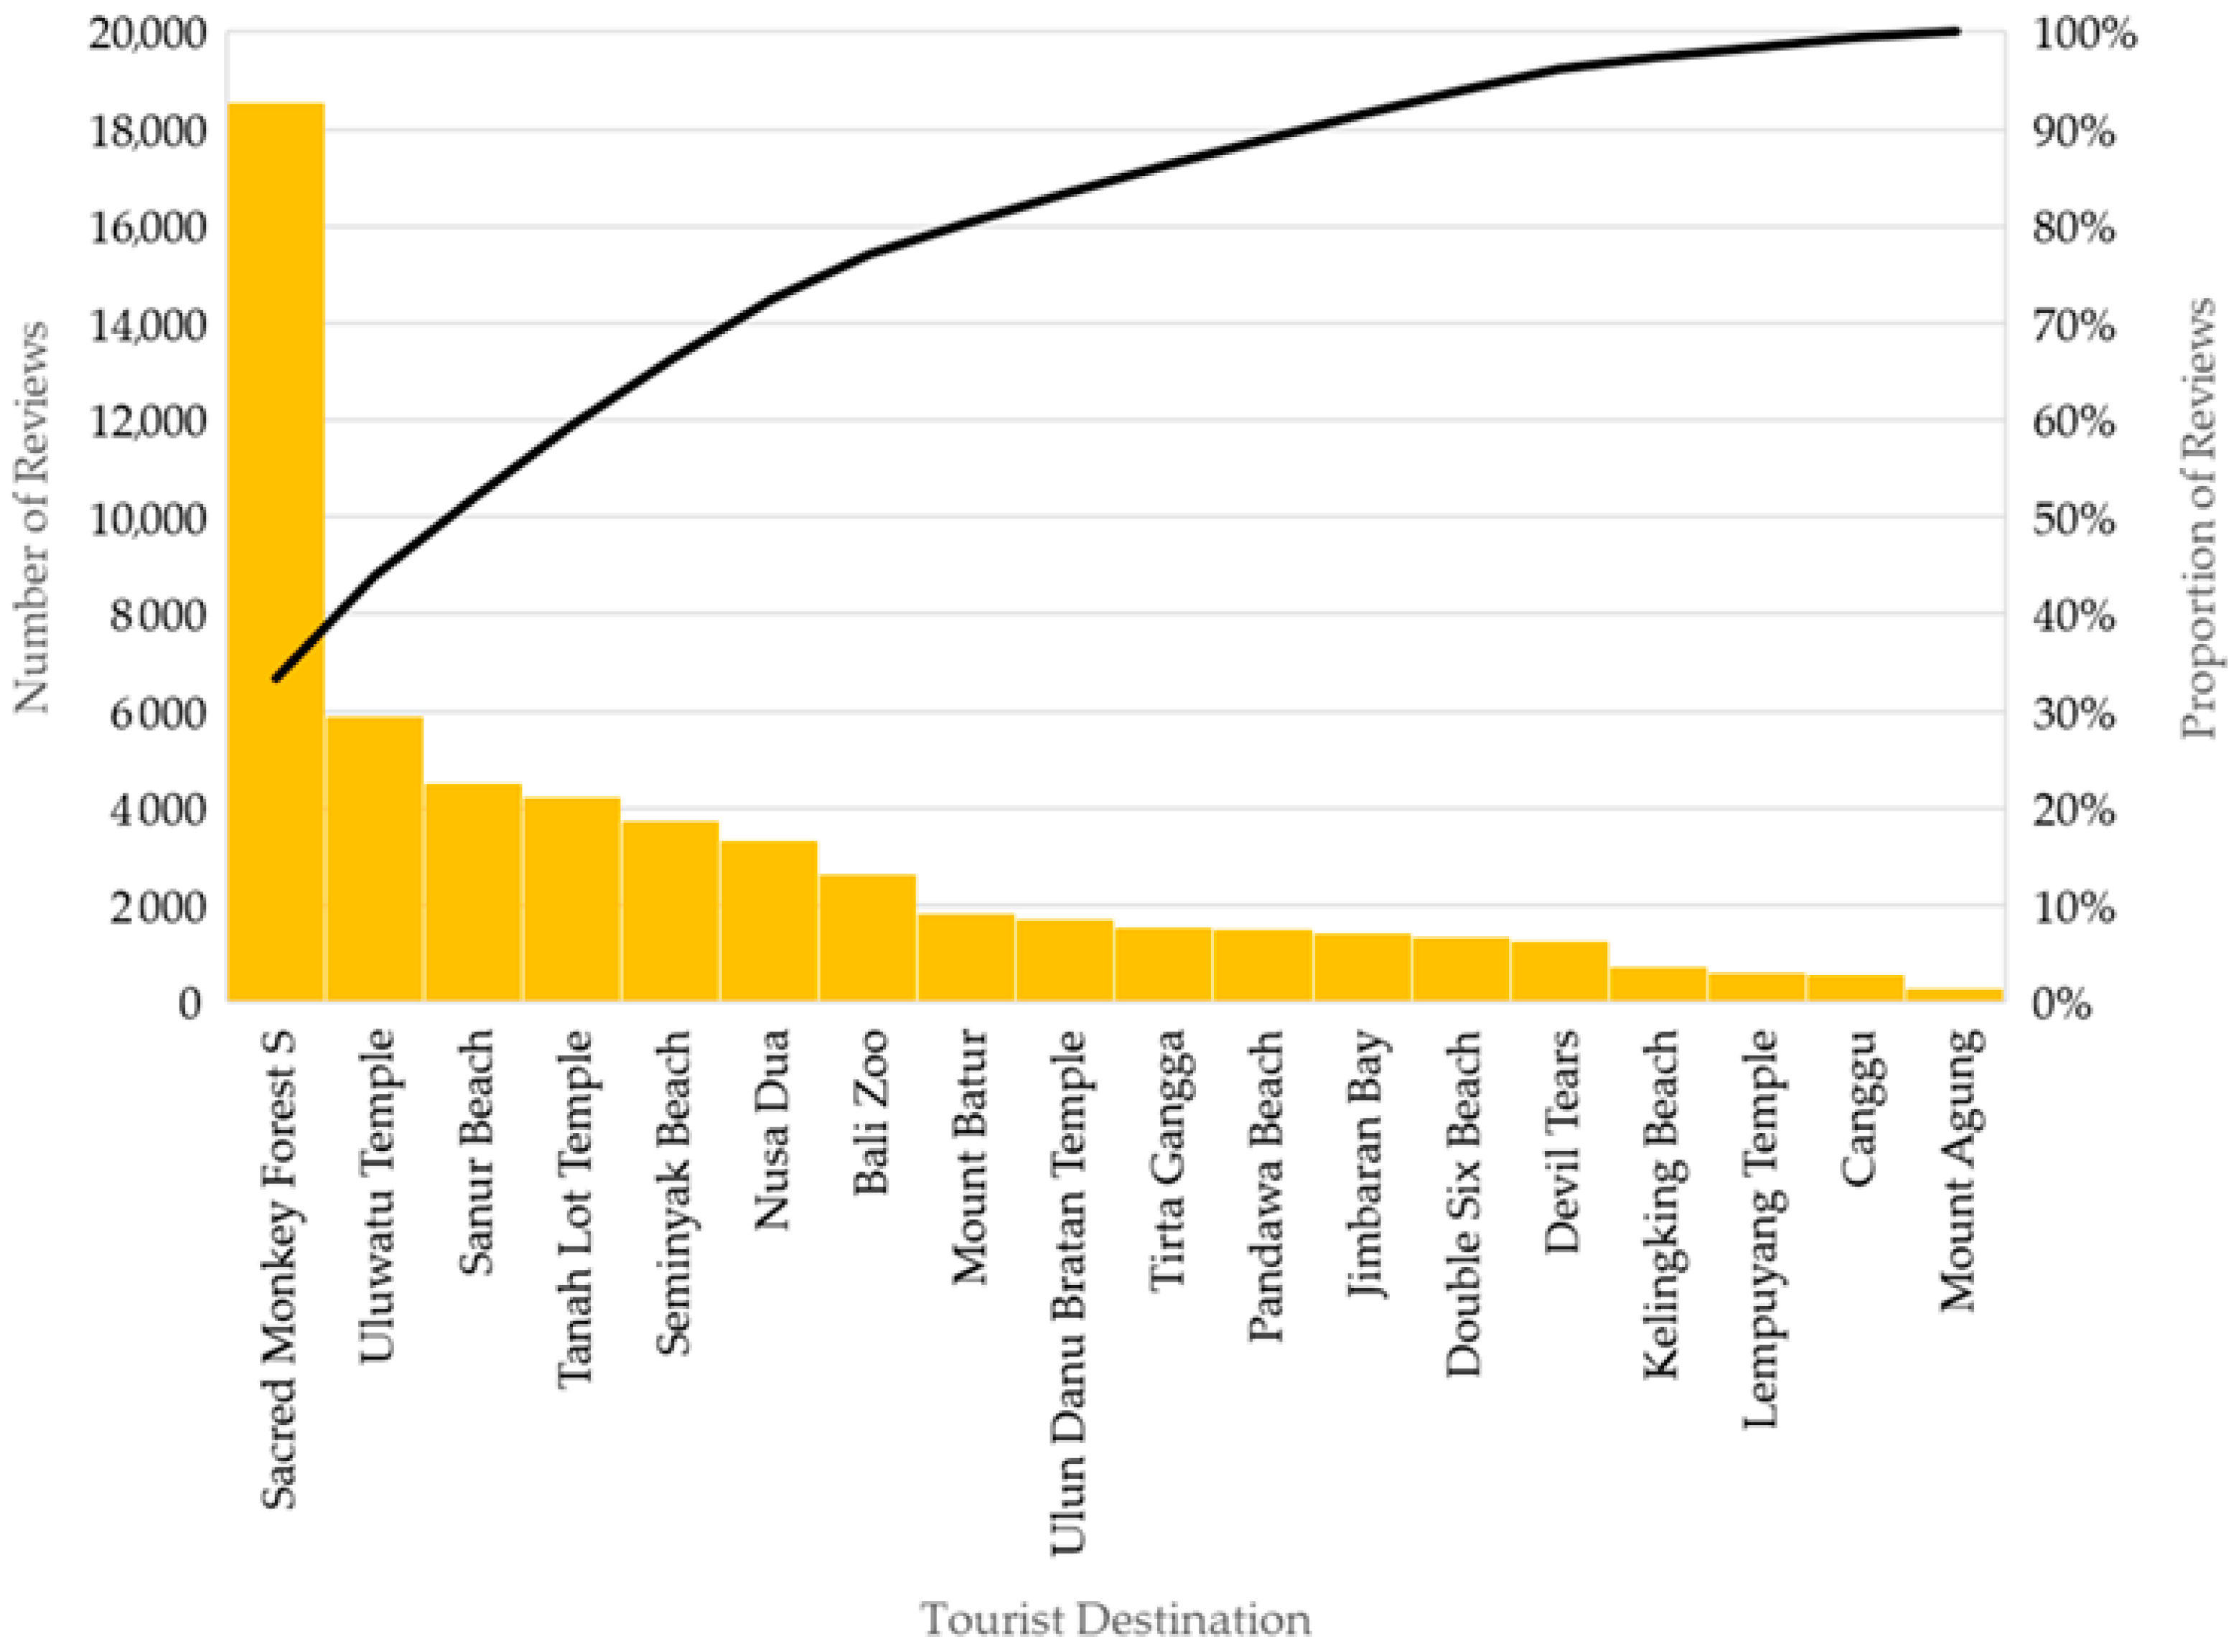
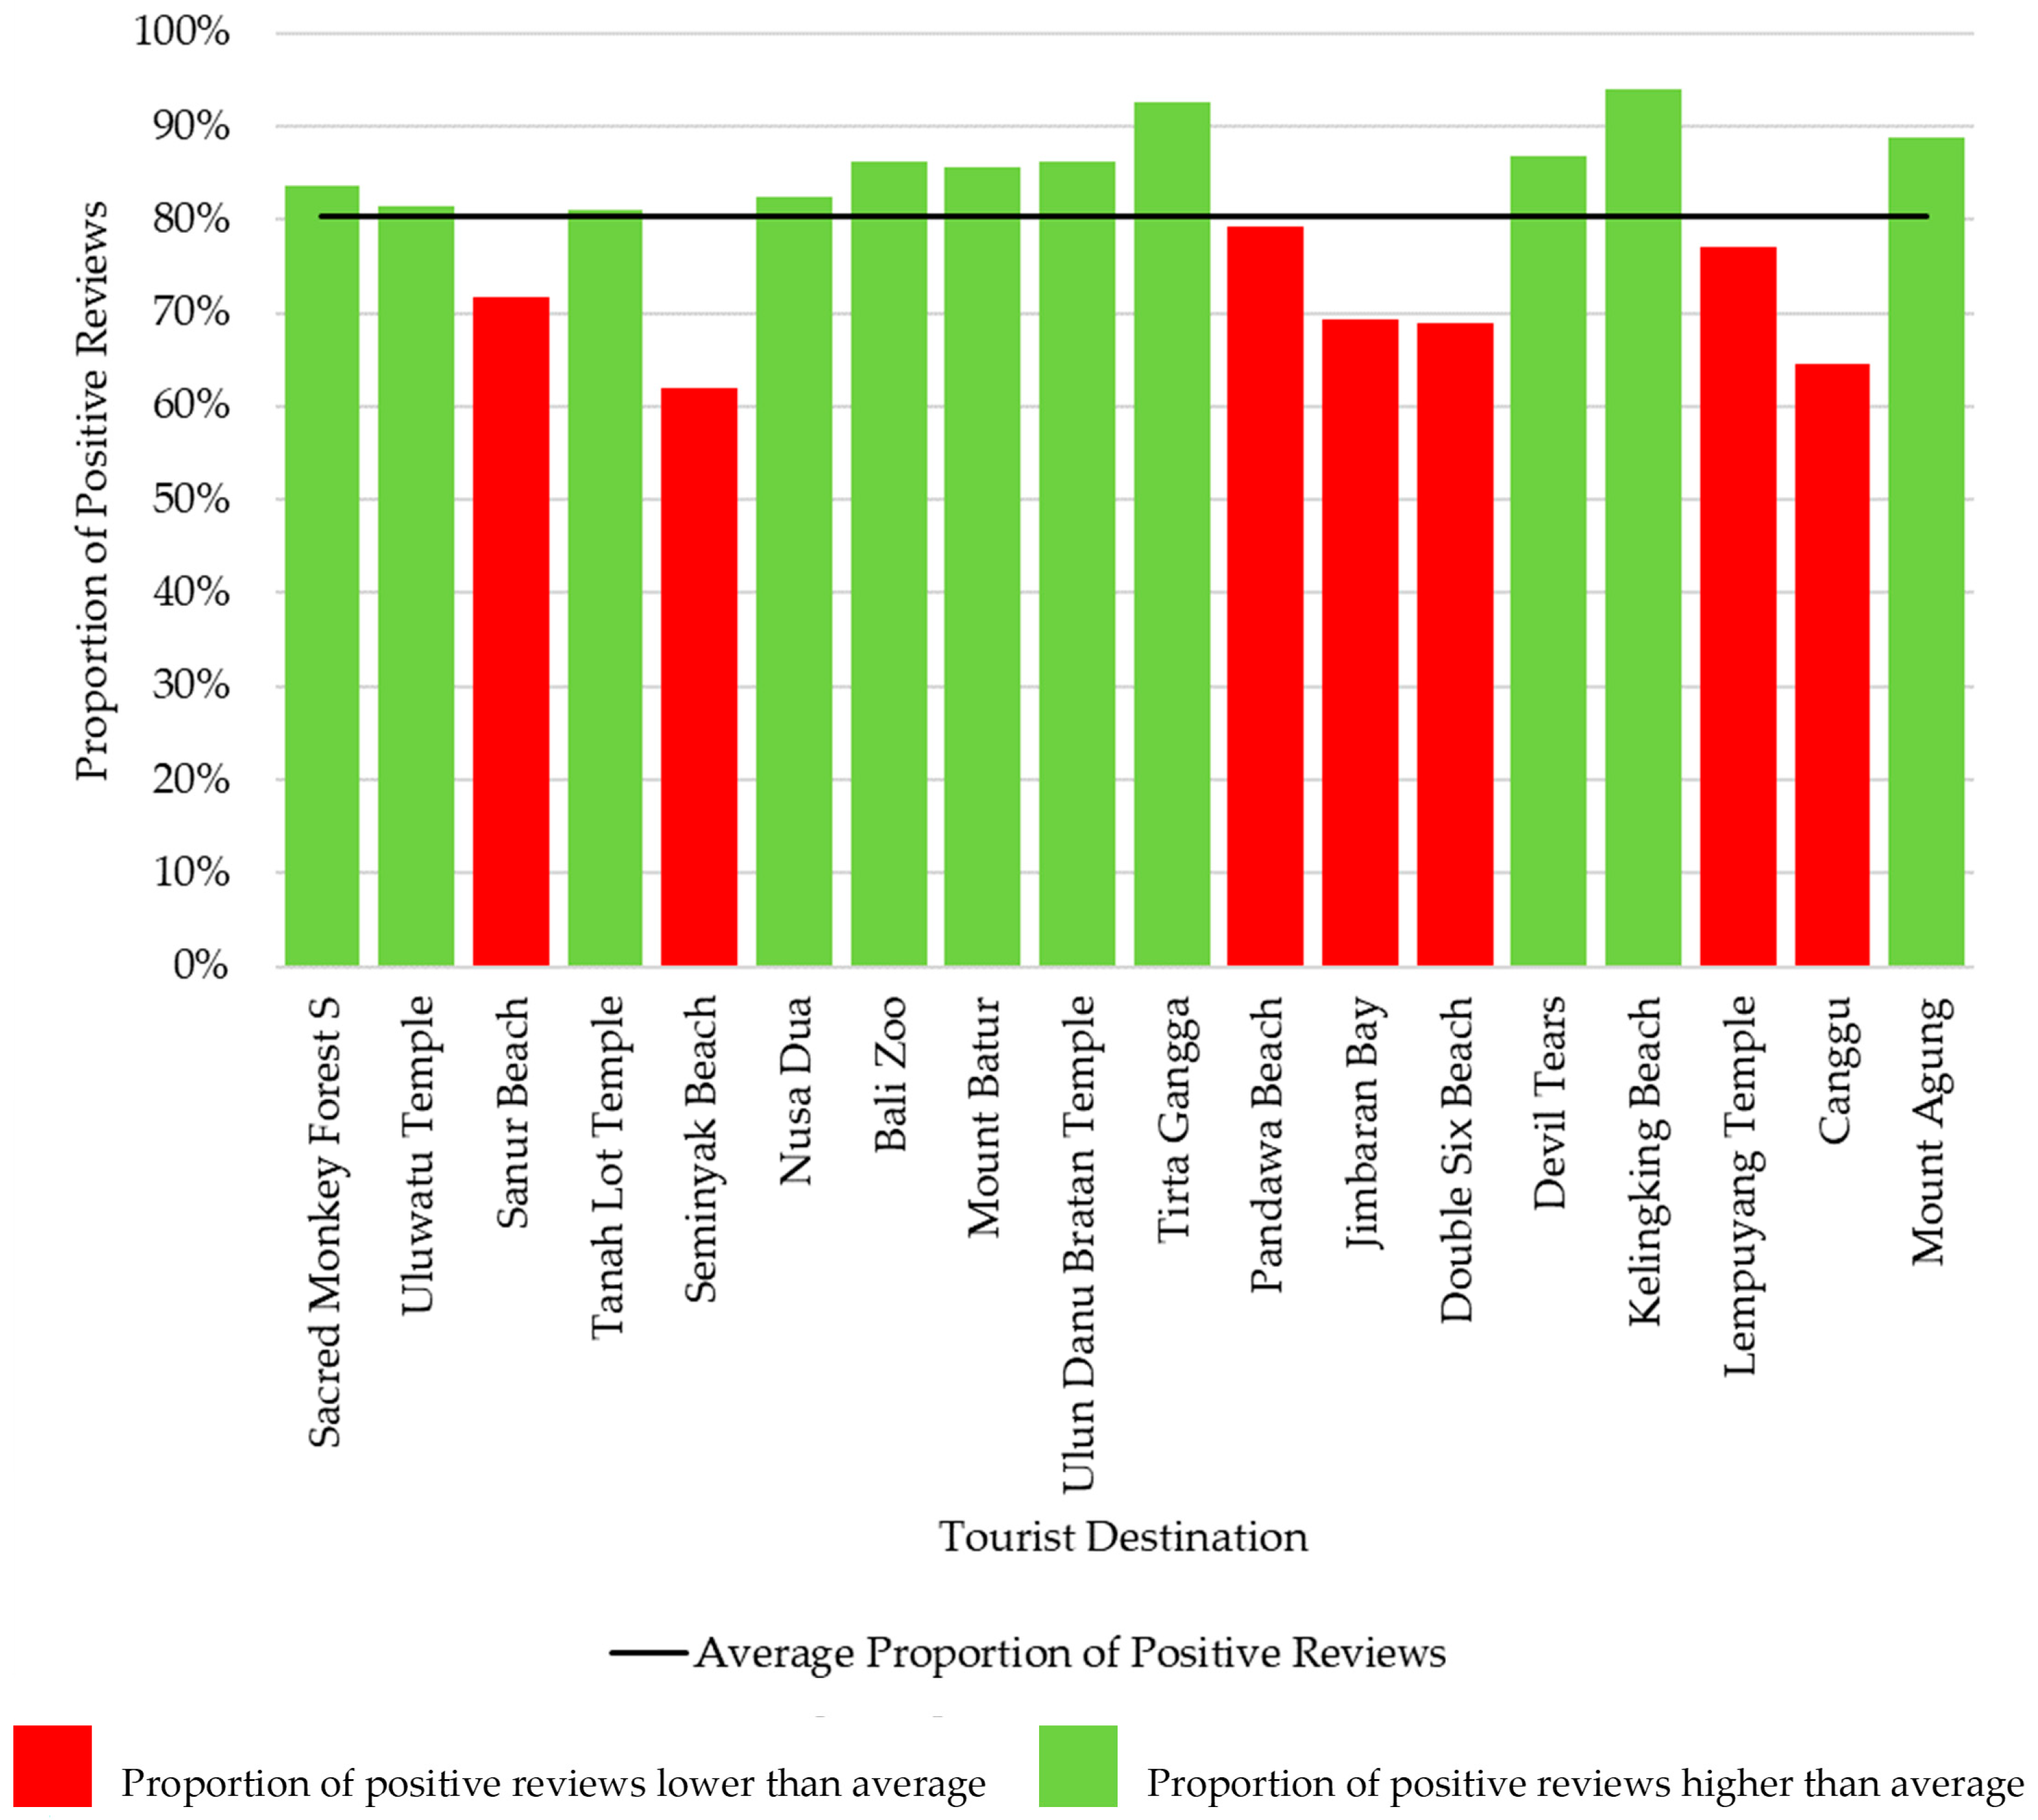
4.1. General Tourist Perceptions

Sentiment analysis has emerged as a sophisticated tool for assessing tourism destinations. Through tourist sentiment information, strengths and weaknesses allow destination stakeholders to proactively address issues, anticipate emerging trends, and maintain a competitive edge. This section presents an overview of the general sentiment perceived by tourist for destinations, offering insights into the broader sentiments and opinions expressed by tourists. Our study delves into the prevailing sentiments associated with various tourist destinations through BERT-based sentiment analysis techniques.
The sentiment analysis results of different tourist destinations in Bali are detailed in Table 7 and illustrated in Figure 4. The overall average sentiment across these destinations is notably positive, with an average of 80.36% positive reviews against an average of 19.64% negative reviews. We observed that 7 out of 18 tourist destinations received positive sentiments lower than the average, with most of these destinations categorized as beaches.
The observed tendencies emphasize stakeholders’ need to identify and address foundational concerns, thus ensuring augmented visitor satisfaction and the sustainable management of these pivotal tourism destinations. At the same time, the current selection of attractions offers a broad perspective on the sentiment distribution across different tourist destinations without including any specific destination aspects. The following section will provide a more intricate investigation, delving into the sentiments related to distinct cognitive image dimensions for each destination to support our deeper understanding of these places.

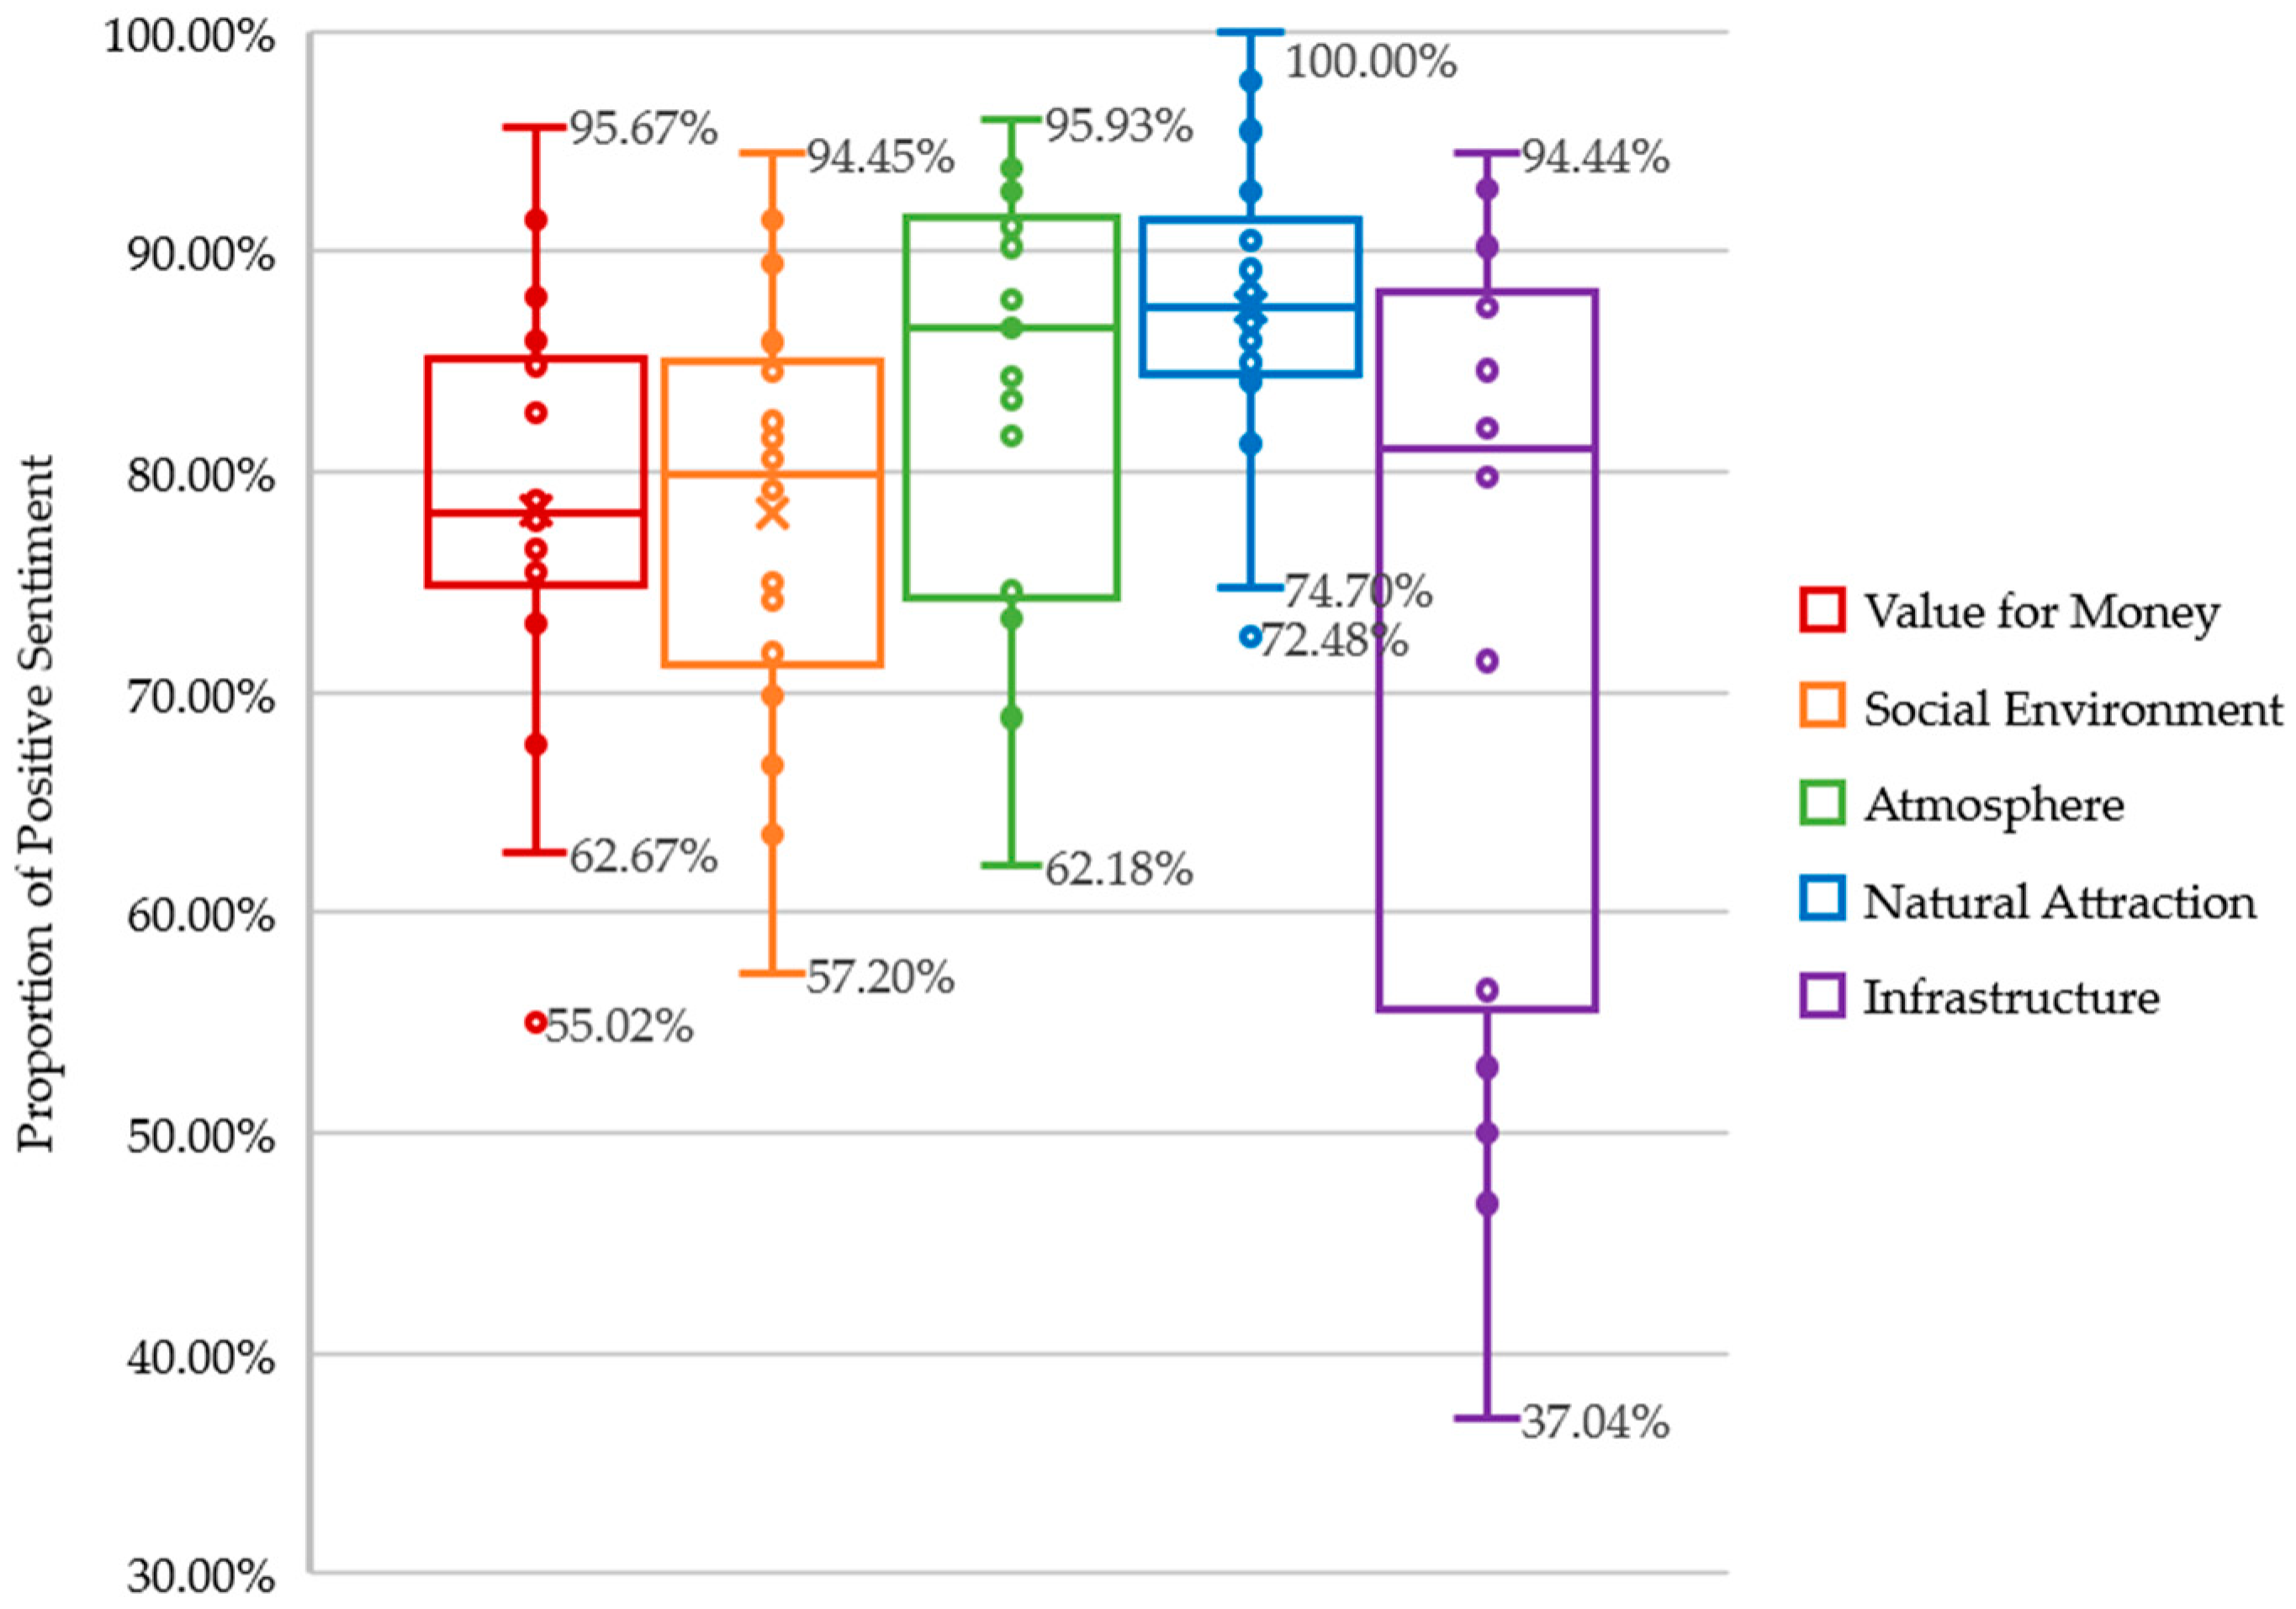
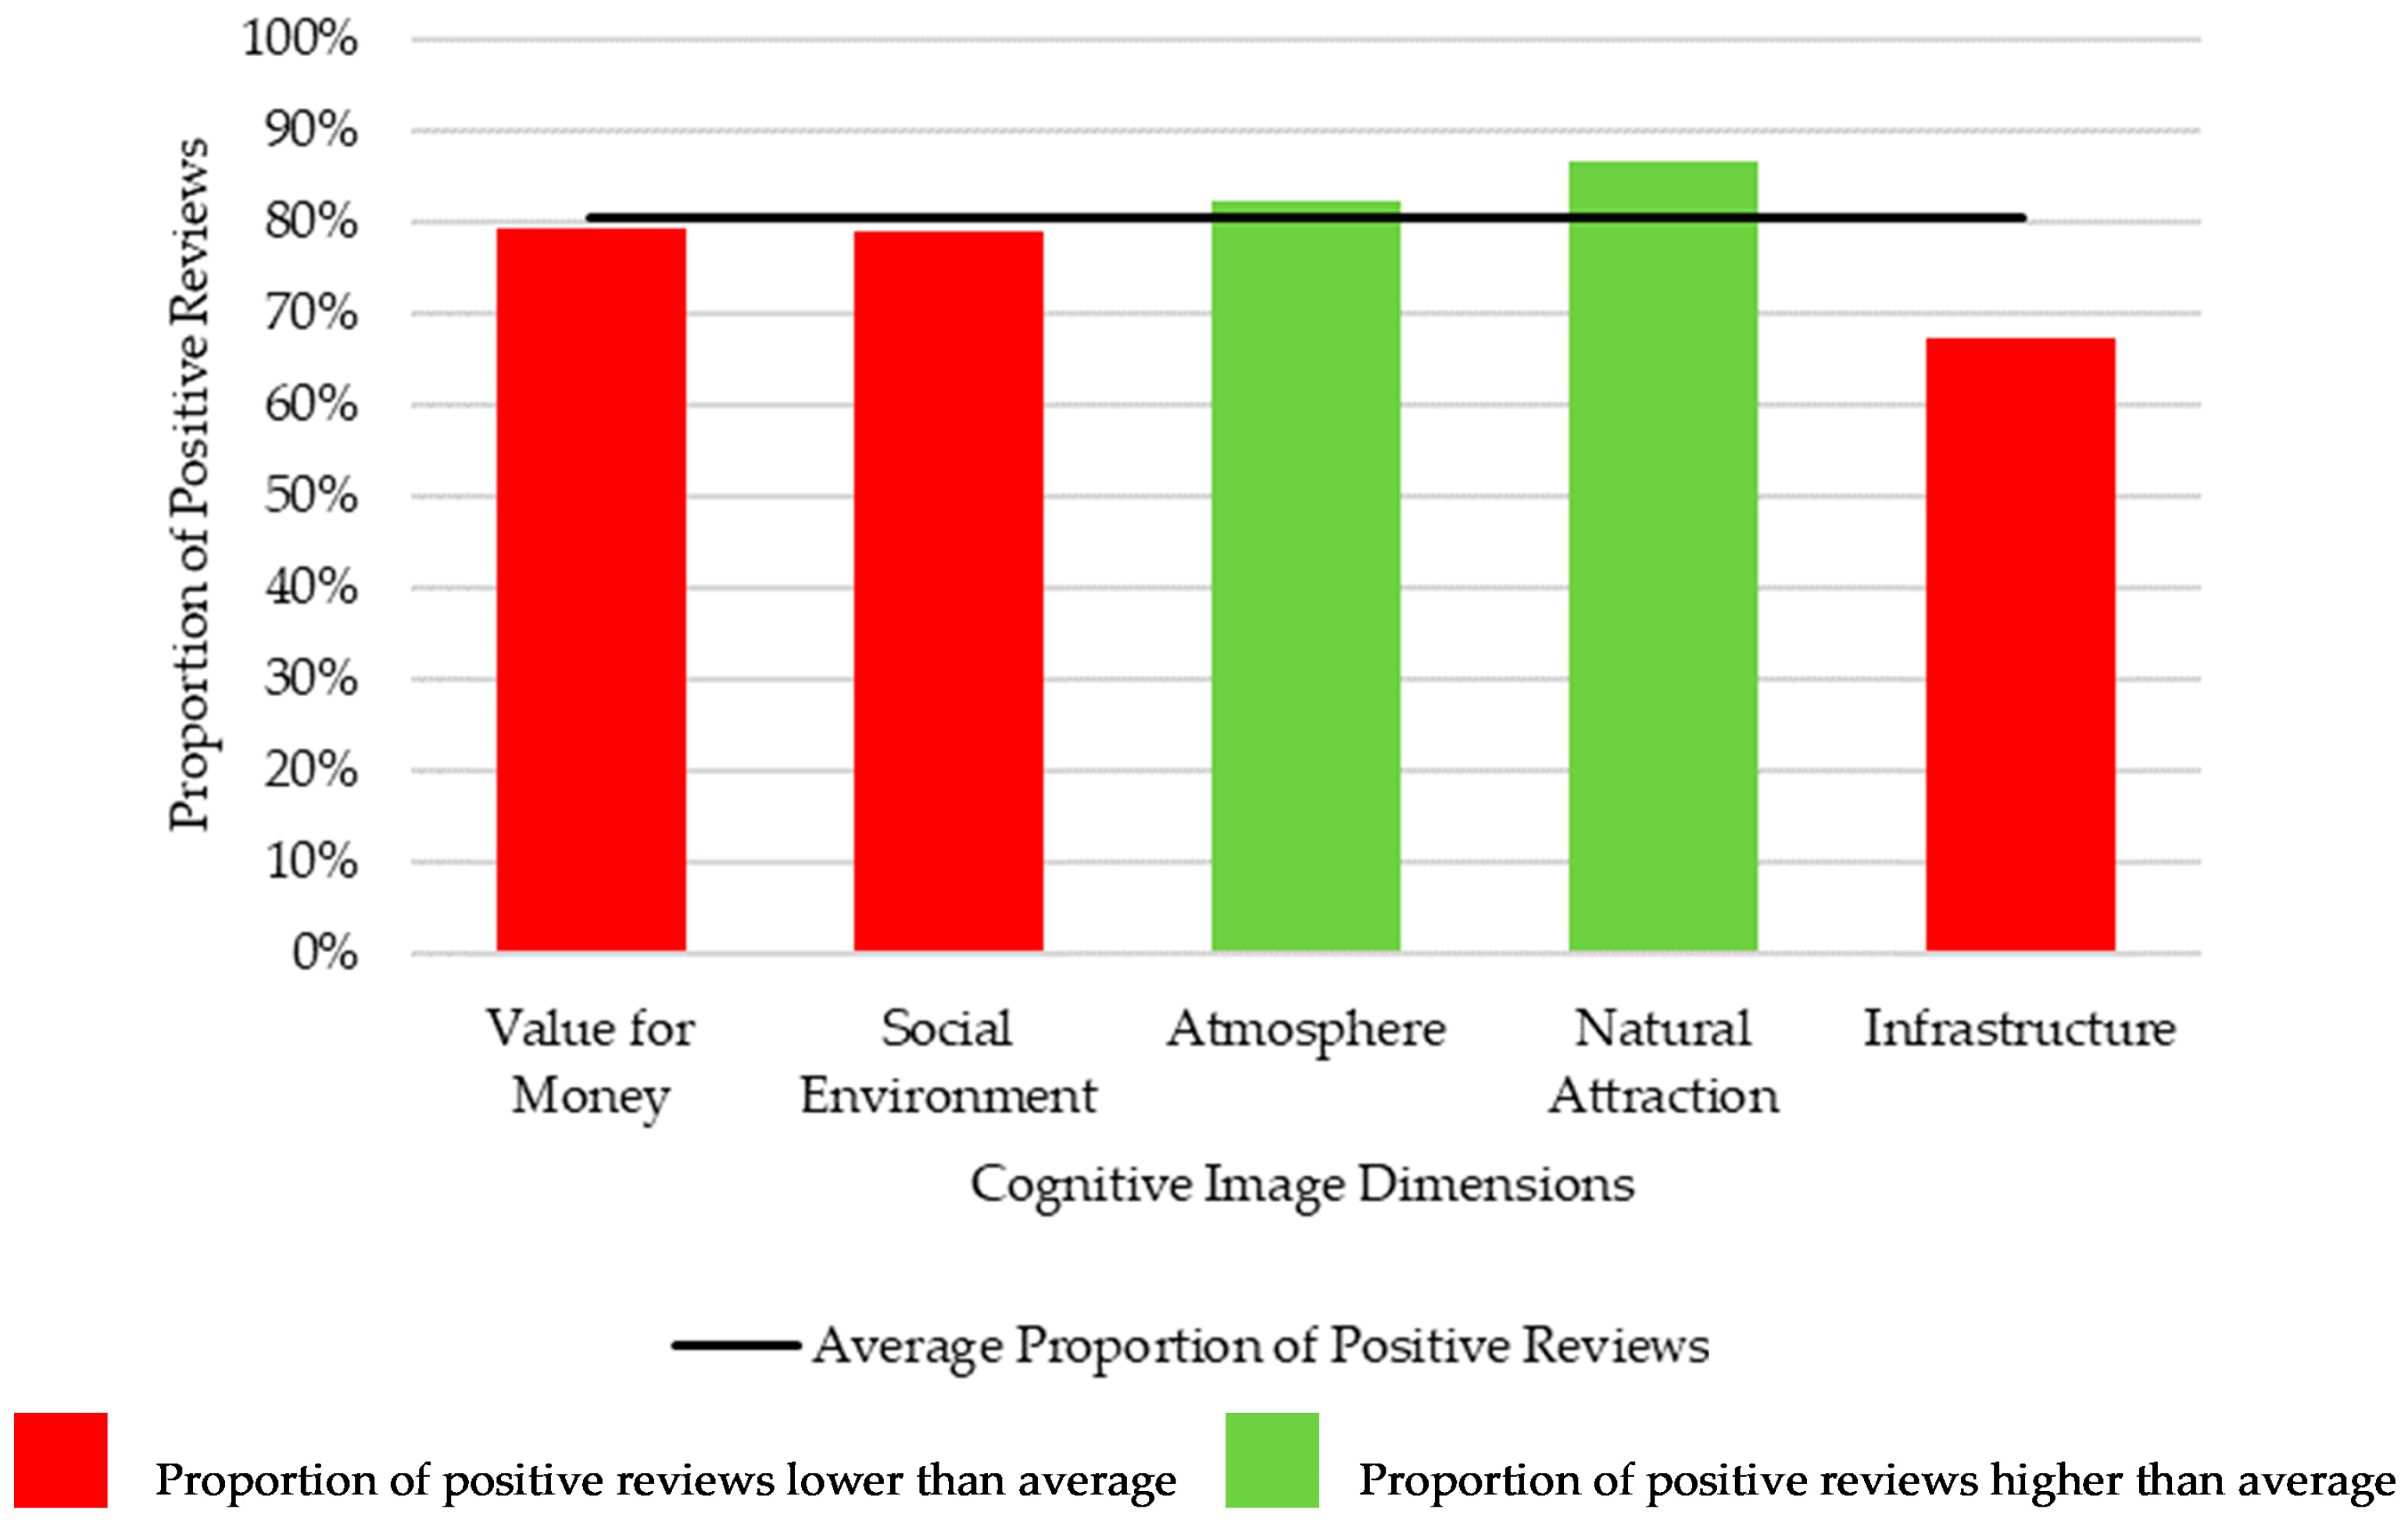
4.2. Tourist Perceptions across Diverse Cognitive Images

In tourism research, understanding the cognitive image of a destination is crucial as it offers a window into the expectations, perceptions, and subsequent evaluations of tourists. We analyze these cognitive constructs, categorizing them into five distinct dimensions: value for money, social environment, atmosphere, natural attractions, and infrastructure. This method provides an understanding of tourists’ priorities and uncovers the essence of what tourists consider vital when choosing a destination.
We present the distribution of tourists’ cognitive considerations of a destination, as shown in Figure 5. Foremost is the “Value for Money”, highlighting that tourists are particularly conscious of the cost–benefit dynamics of their travel experiences. Tourists evaluate destinations based on their intrinsic qualities in relation to monetary investments, indicating the importance of competitive pricing and perceived value in the tourism industry. Closely following is the importance of the “Social Environment” and “Atmosphere”, which underline tourists’ appreciation for cultural interactions and the general ambiance of a place. Surprisingly, traditionally prioritized aspects like “Natural Attraction” and “Infrastructure” trail behind, suggesting that while intrinsic beauty and basic amenities are essential, modern tourists seem more inclined to value experiential elements and the overall value of their visit.
Our analysis subsequently delves deeper into the specific sentiments related to each dimension. Advanced exploration is designed to provide a more intricate understanding of these dimensions, comparing the relative importance of each dimension with tourists’ emotional perceptions during their interactions with the destination. We observed that “Value for Money”, “Social Environment”, and “Infrastructure” received positive sentiments that were below the mean value. A comprehensive breakdown of these data is illustrated in Table 8 and further depicted in Figure 6.
Our evaluation of the sentiment scores across cognitive image dimensions shows interesting patterns. “Atmosphere” and “Natural Attraction” stand out with noteworthy positive ratings of 82.3% and 86.6%, respectively. A destination’s emotional resonance and natural offerings leave a lasting positive impression on visitors. In contrast, “Infrastructure” demonstrates a marked deviation, with a positive sentiment of 67.4%, indicating the infrastructural challenges that may impact the overall tourist experience. Infrastructure serves as the backbone of any tourist experience, influencing accessibility, mobility, and overall convenience. This suggests that there might be tangible infrastructural challenges—perhaps relating to transportation, amenities, or even digital connectivity. “Value for Money” and “Social Environment” hover just below the average, suggesting that tourist expectations might not be entirely met.
Following our examination of the overall sentiment scores across these cognitive image dimensions, we explored the distribution of sentiments across each dimension within individual tourist destinations. This exploration aimed to gain a more granular understanding of how each destination performs across different cognitive aspects. The distribution of positive sentiments for each cognitive image dimension is shown in Figure 7. The variation of visitors’ sentiments toward the cognitive image dimensions of each tourist destination is provided in Table 9. Visitors’ perceptions vary based on their experiences and the offerings at each destination. The interesting finding is that the infrastructure dimension displays a wider range of positive sentiments than the other categories, indicating a greater variety of opinions and experiences related to infrastructure. While some destinations might have exceptional infrastructure that meets or exceeds visitor expectations, others might have areas that require improvement, leading to this broader spectrum of feedback. “Ulun Danu Bratan Temple” received a sentiment of 93.10%, suggesting that well-developed infrastructure can significantly elevate the tourist experience. In contrast, a location like “Canggu Beach” significantly trails, with a sentiment of 37.04%, revealing potential infrastructure challenges.
From a destination point of view, each destination is distinctively characterized by its strengths and weaknesses. These dimensions enhance the interest of a destination and indicate the sectors that require scrutiny. Our analysis highlights some interesting observations:
(a)
Seminyak Beach presents a notable discrepancy. While its natural attractions are appreciated, its infrastructure presents a significant challenge, suggesting that its surrounding amenities or beach facilities do not meet tourist expectations.
(b)
Bali Zoo has remarkable social environment and atmosphere feedback, which suggest a highly favorable visitor experience.
(c)
Ulun Danu Bratan Temple receives high praise regarding its atmosphere and infrastructure. Its ambiance and well-maintained facilities might satisfy visitors.
(d)
Canggu Beach displays a distinct mix of reviews. While some aspects are appreciated, its natural beauty is not as highly praised as other destinations. Moreover, its infrastructure received considerable negative feedback, indicating potential challenges.
(e)
Mount Agung stands out for its impeccable feedback on its natural beauty, achieving a perfect score. Coupled with its highly praised infrastructure, it seems to be a tourist favorite for its scenic appeal and amenities.
We find that “Natural Attraction” emerges as the predominant positive factor across most destinations. Specifically, Uluwatu Temple, Sanur Beach, Nusa Dua, and Mount Agung received significant appreciation for their natural beauty, respectively, 85.98%, 74.70%, 84.95%, and 100%. The appreciation of “natural attraction” in tourism spans various destination types, from the spiritual essence of temples to the tranquility of beaches and mountains. These various destinations are united in their inherent natural beauty, underscoring the growing value tourists place on authentic and unspoiled beauty, highlighting the need to preserve the natural characteristics of each destination.
Conversely, “Infrastructure” and “Social Environment” are recurrently perceived as these destinations’ less favorable aspects. Eight of the eighteen tourist destinations have infrastructure as their most negatively perceived dimension. Notably, all these destinations with infrastructure concerns are beaches or water-related venues, suggesting that there might be potential shortcomings regarding their facilities, accessibility, or maintenance. Regarding the social environment, the majority of destinations facing social environment challenges are non-beach destinations, including temples, forests, and mountains. This indicates that places of cultural, spiritual, or natural significance might experience issues related to visitor interactions, crowd management, or local community engagement.

4.3. Relationships between Tourists’ Perceptions across Cognitive Images

Every tourist may prioritize specific aspects of their travel experience over others. We discovered concurrent mentions of the same aspects in locations reviewed by the same tourists to uncover potential linkages between these aspects or to discern the predominant preferences of the larger tourist community in terms of how they perceive these interrelations. Table 10 offers insights into how frequently certain dimensions of a tourist destination are reviewed jointly by the same tourist. This reflects how travelers perceive the interconnectedness of certain destination aspects.
At a prominent 4.19%, the connection between “Social Environment” and “Value for Money” emerges as the most significant intersection in tourist reviews. This strong association suggests that when tourists evaluate the social dynamics of a place, they concurrently assess the overall value they are receiving for their money. Perhaps tourists evaluate a locale’s hospitality, friendliness, or overall ambiance alongside its affordability. In essence, a welcoming environment might be seen as an integral part of the overall value proposition for many travelers. A welcoming and inclusive environment can make tourists feel that they are truly receiving their money’s worth beyond just tangible services or amenities.
Following closely is the pairing between “Atmosphere” and “Value for Money”, at 3.56%. Tourists likely perceive the ambiance or atmosphere of a destination as integral to their overall satisfaction and experience. A great memorable ambiance of a place ensures tourists’ perception of excellent value for money. It is not just about how much they spend but the quality of the experience they receive in return; tourists might be more willing to pay for or revisit destinations.
The association between “Natural Attractions” and “Infrastructure” was only 0.52%. The two elements are infrequently reviewed together. One possible explanation is that tourists prioritizing natural beauty and attractions might be less concerned with infrastructure. They might be more focused on the natural attractiveness of the destination rather than its developed or man-made amenities. Alternatively, destinations rich in natural attractions might inherently lack advanced infrastructure, leading tourists to set different expectations or evaluations.
To understand the connections between one dimension and another, we conducted a correlation of the proportion of positive sentiments seen across dimensions to understand the interrelated preferences of tourists, as shown in Table 11. The largest correlation was observed between “Atmosphere” and “Social Environment”. Although “Value for Money” is most frequently reviewed by the same tourists with both “Social Environment” and “Atmosphere”, it was found that “Social Environment” has the strongest positive correlation with “Atmosphere” in terms of their proportion of positive sentiments.
Correlation coefficients allow us to quantify the linear relationship between two variables. Values close to 1 or −1 indicate a strong relationship, while values close to 0 indicate a weak relationship. The highest positive correlation, between atmosphere and social environment (0.848), indicates that when tourists express positive sentiments about the atmosphere of a place, they are also likely to have positive sentiments about its social environment and vice versa. This could be attributed to the fact that the ambiance of a location often goes hand in hand with the people and interactions that occur there. A friendly, welcoming community can significantly enhance the atmosphere of a place.
The lowest correlation is between atmosphere and value for money (0.597). While 0.597 still suggests a moderate positive correlation, it is the lowest compared to other pairs. Tourists may not always directly associate their positive experience of a destination’s atmosphere with the value of the amount they have spent. This means that a destination could have a fantastic ambiance, making tourists feel welcome and relaxed, but those same tourists might still feel that what they spent did not offer equivalent value. Conversely, tourists might feel they received excellent value for their money due to other factors (like activities, accommodations, or food) even if they found the atmosphere lacking in some places.
Modern tourists prioritize holistic experiences, seeking a balance between ambiance, social dynamics, and economic value. While the allure of natural attractions persists, there is a noticeable shift towards valuing authenticity and raw beauty overelaborate infrastructure. Recognizing these correlations is important for tourism stakeholders in supporting more strategic planning and cultivating experiences that deeply resonate with tourists, thereby improving tourist satisfaction and fostering sustainable destination development.

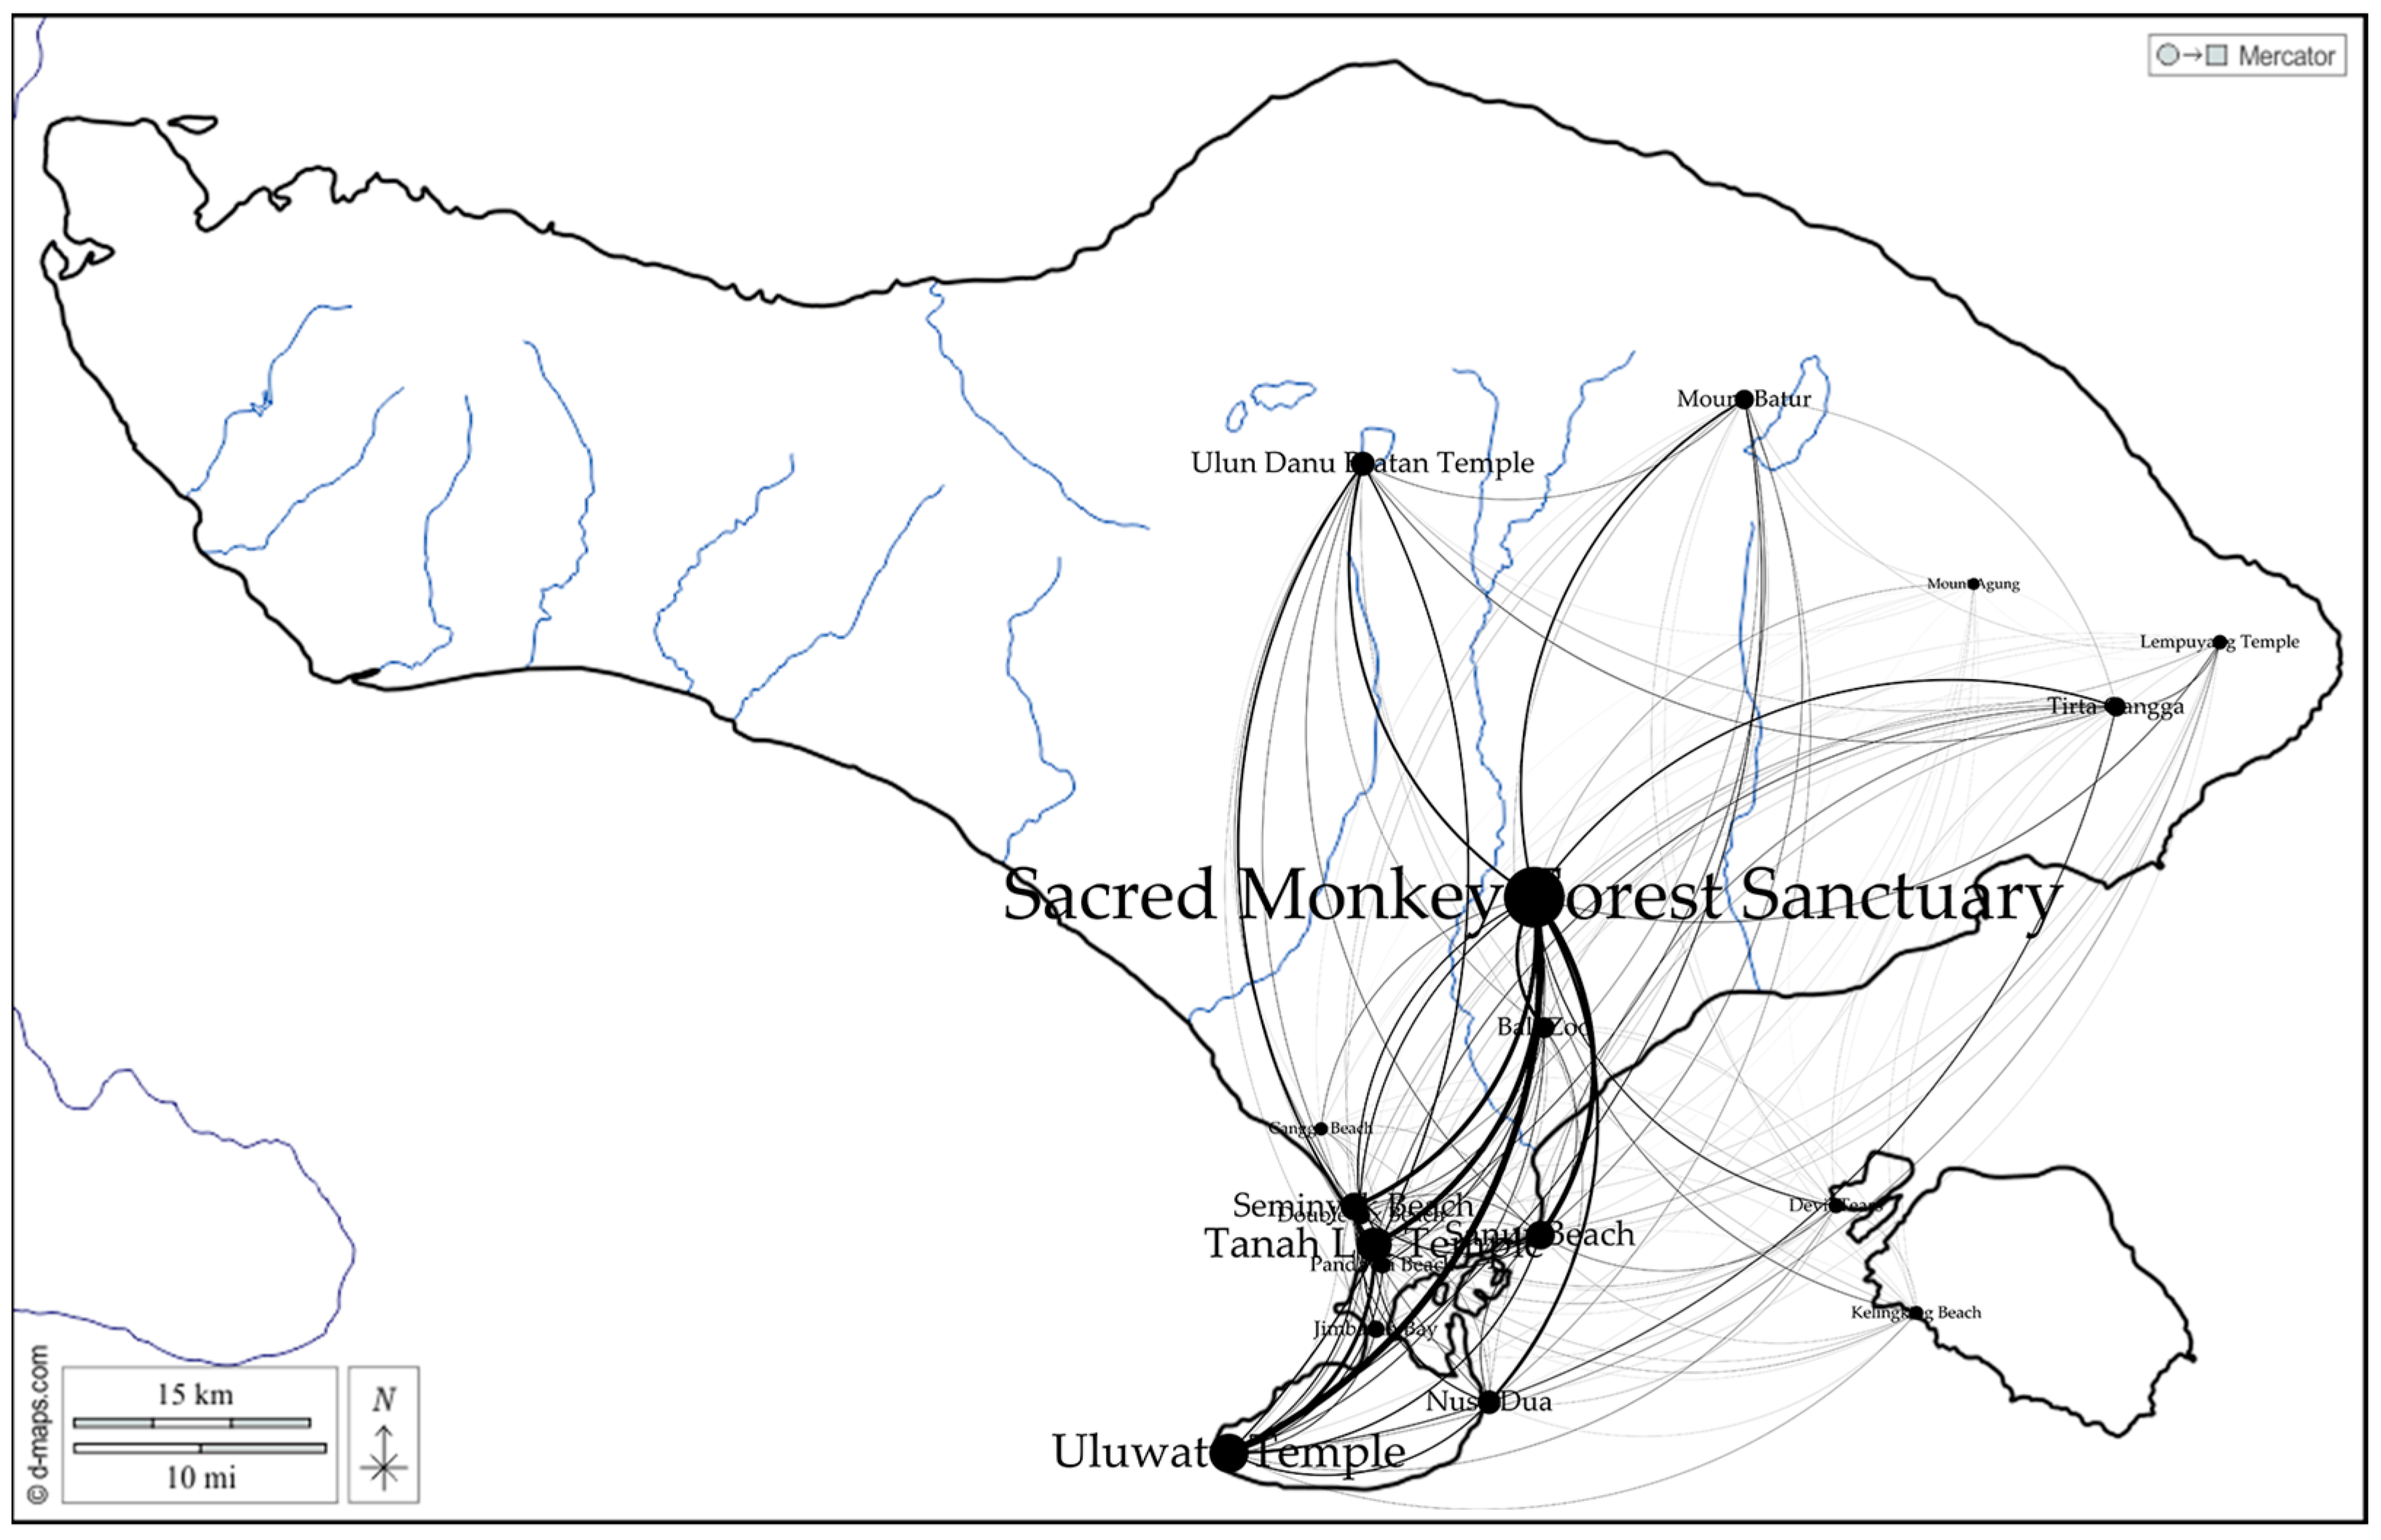
4.4. Tourist Mobility and the Destination Centrality

In the previous section, we delved into a comprehensive examination of the sentiments and cognitive perceptions associated with each tourist destination. Moving forward, we employ a network analysis methodology to trace and analyze the patterns of tourist mobility across various destinations. In this section, we map and elaborate on the destinations that serve as central hubs for tourist mobility, delineate the polarity of the sentiments associated with each destination, and highlight the cognitive aspects that require improvement.
Most of the tourist mobility is concentrated in the central region of Bali, extending to the southern coast. In contrast, the island’s northern part remains relatively less frequented by visitors. This pattern suggests that central and southern Bali may offer attractions, amenities, or experiences particularly appealing to tourists, while the northern region remains an untapped or less-explored gem.
Based on the Weighted Degree and betweenness centrality metrics in Table 12, the “Sacred Monkey Forest Sanctuary” shows the highest Weighted Degree of 12,094, serves as a primary hub within the network, and receives significant attention. Conversely, “Mount Agung” has the lowest Weighted Degree, at 299, implying it might be a less frequented or lesser-known node than other destinations. Regarding betweenness centrality, most destinations, including the leading “Sacred Monkey Forest Sanctuary”, have a consistent value of 0.0625. This uniformity indicates that these destinations play a similar role as bridges or connectors, facilitating flow or mobility within the network. Interestingly, “Kelingking Beach” and “Mount Agung” stand out with a betweenness centrality value of 0, suggesting that they might not be important regarding network connectivity.
We investigated pairs of destinations frequently visited by the same tourists. The weight values of these edge pairs reflect this shared visitation frequency. Table 13 shows the weight of each destination pair. The Sacred Monkey Forest has high visitation frequencies and is particularly paired with Uluwatu Temple (1947 visits) and Tanah Lot Temple (1567 visits). The Sacred Monkey Forest, along with Tanah Lot Temple, acts as a focal point for tourist routes, suggesting its embedded preference in tourist routes.
Conversely, destinations such as Mount Agung, Canggu Beach, and Lempuyang Temple exhibit low paired visitation rates, indicating their potential isolation or that they are not as popular as part of combined travel routes. The destination pairs are mapped using network analysis, considering their geographic location (Figure 8). The wider lines are indicative of the more frequent pairs.

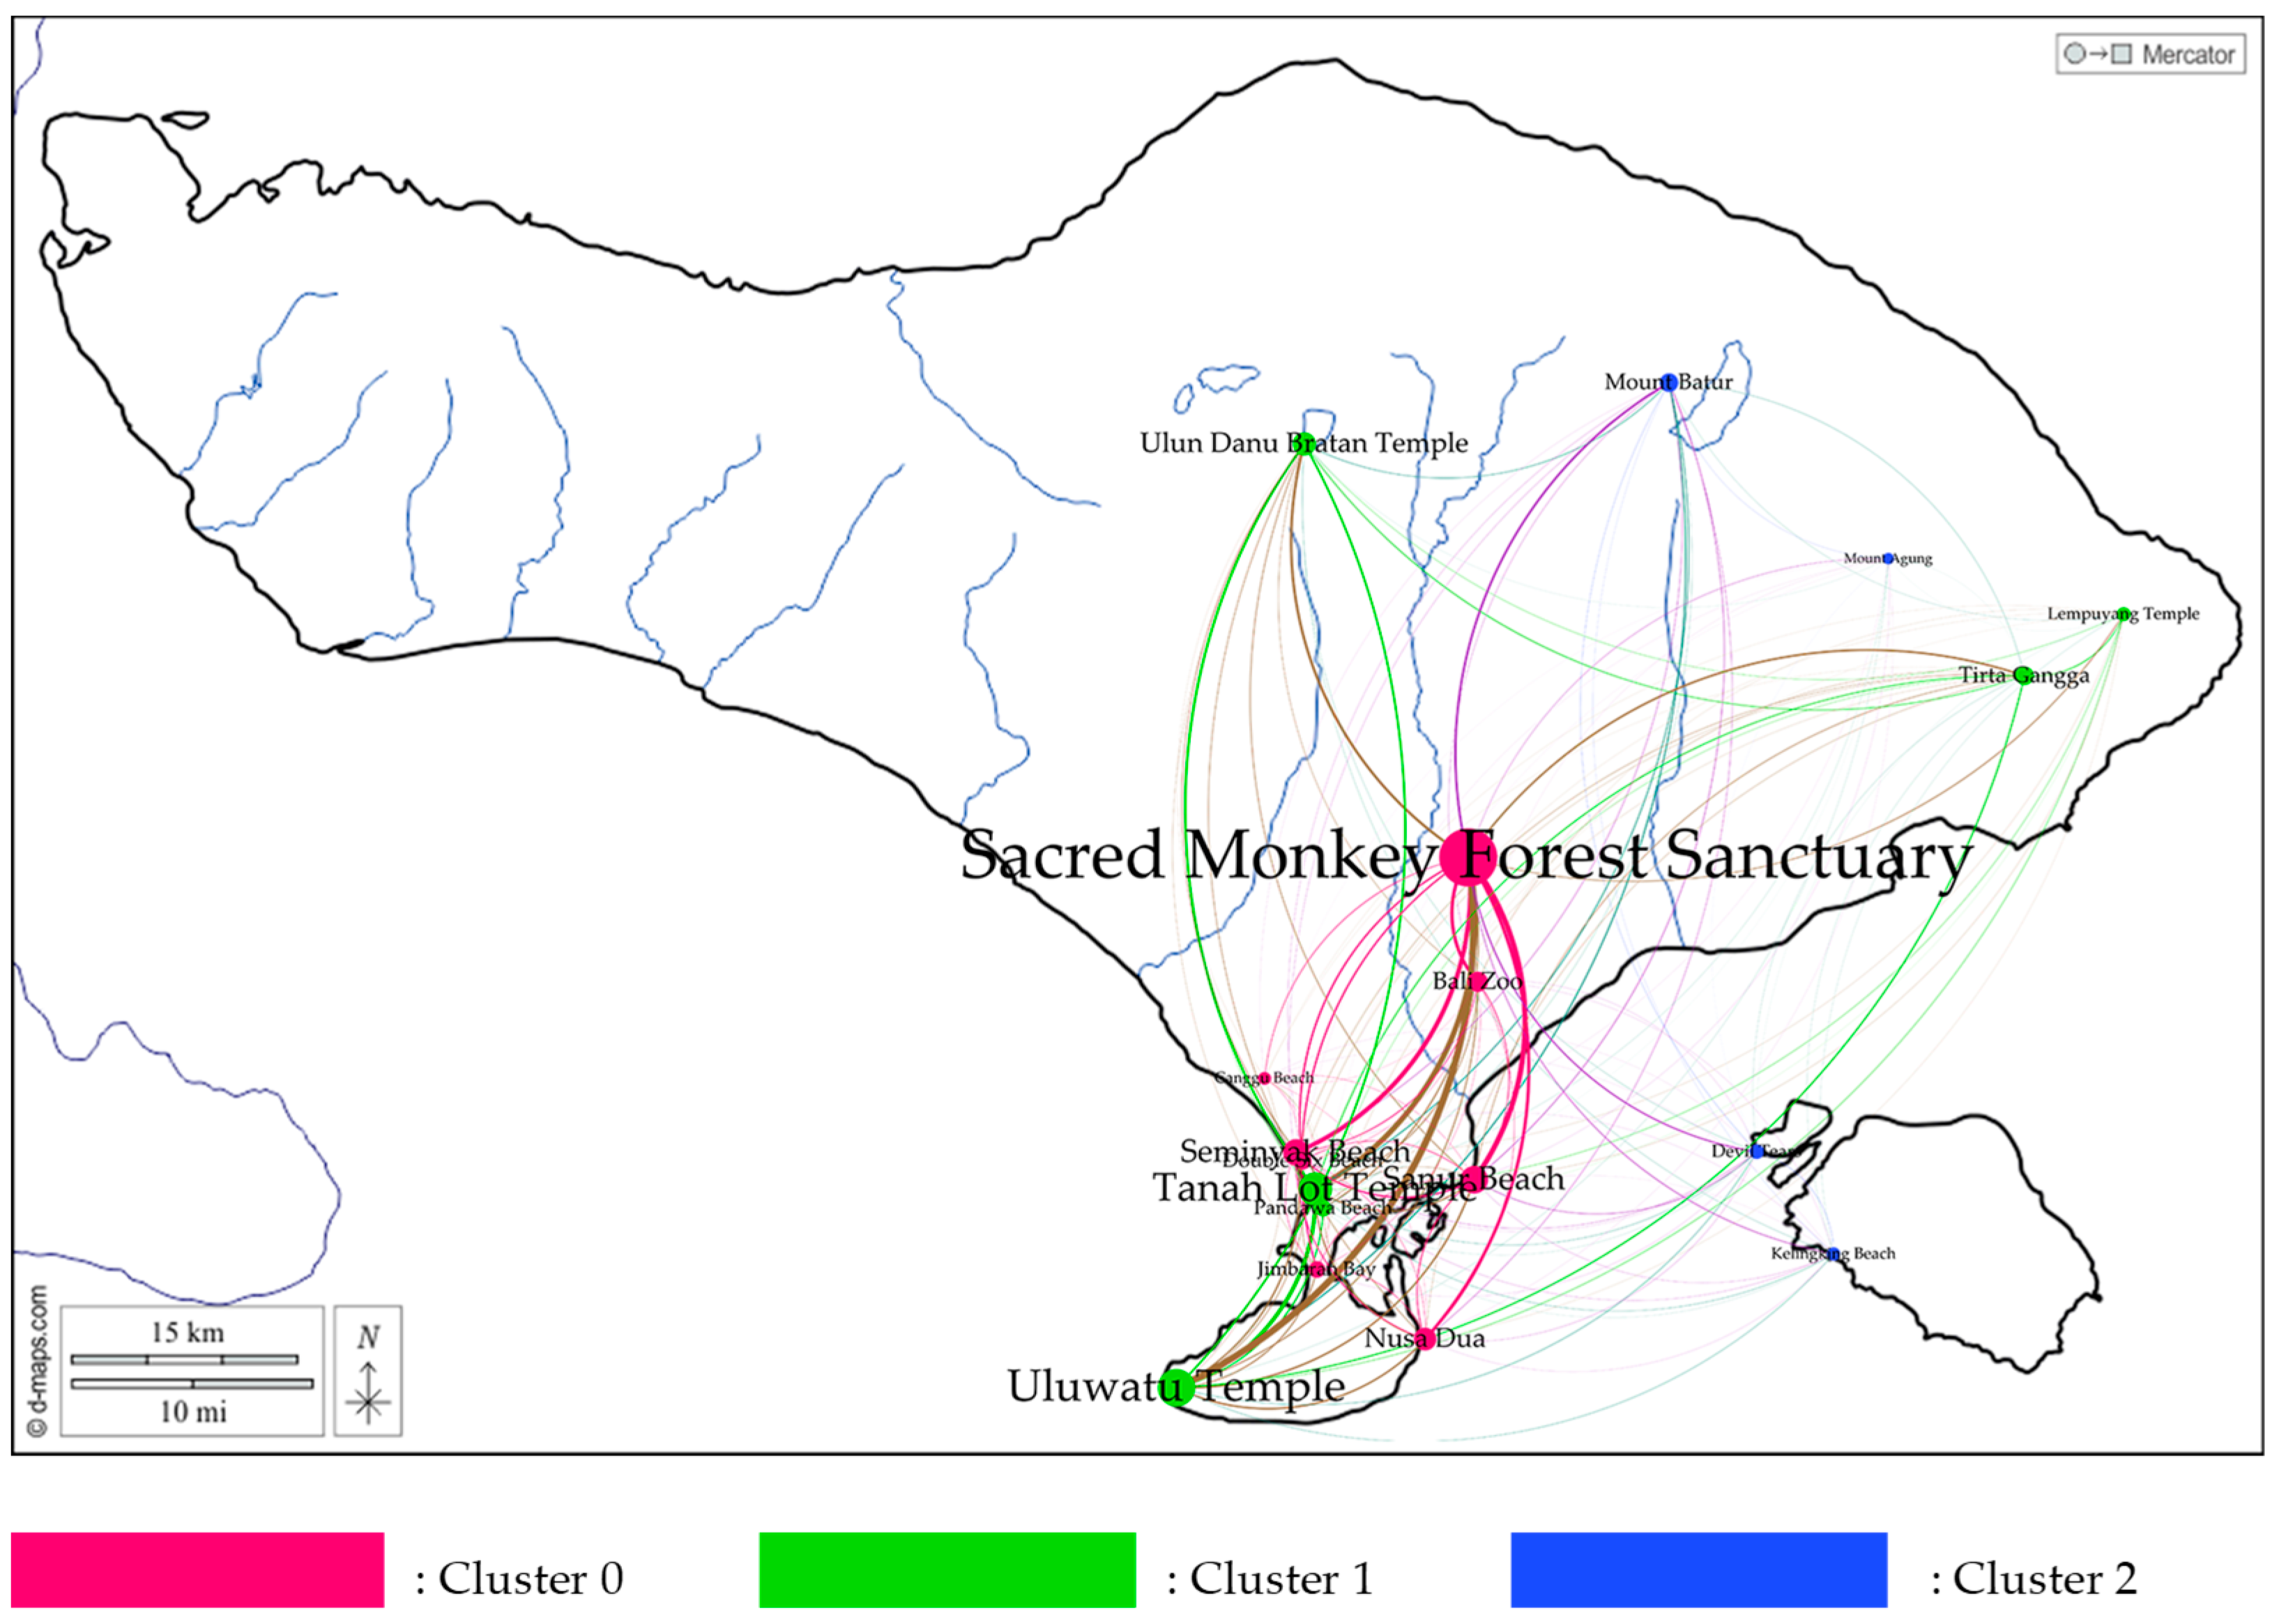
4.5. Mobility Clusters

We subsequently explored the clustering potential between the destinations studied. We employed the modularity approach for this purpose. Modularity metrics measure the strength of partitioning nodes into clusters. For Bali’s tourist destinations, modularity assesses how strongly each destination belongs to a particular group when considering their co-visitation frequencies, as shown in Figure 9. A high modularity value indicates that the tourist destinations within a cluster have higher co-visitation frequencies among themselves than with destinations outside their cluster. This modularity grouping categorizes destinations based on certain shared attributes or their geographic proximity:
(1)
Cluster 0 (Beaches and Forests): This cluster predominantly comprises beaches and forests, suggesting that these destinations might be frequently visited in tandem due to their natural beauty and serene environments. Tourists attracted to this cluster may seek relaxation, nature walks, sunbathing, or watersports.
(2)
Cluster 1 (Mainly Temples): Dominated by temples, this group hints at destinations that cater primarily to cultural or spiritual tourists. Visitors to this cluster may be interested in understanding the religious and historical aspects of the region, seeking spiritual experiences, or simply appreciating the architectural beauty of these ancient structures.
(3)
Cluster 2 (Mountains and Beaches around Nusa Penida): This cluster features a combination of mountainous regions and beaches near Nusa Penida, with a blend of high-altitude treks and coastal relaxation. Visitors drawn to this cluster are likely adventure-seekers looking to combine hiking experiences with the tranquil ambiance of secluded beaches.
The identified modularity clusters indicate specific travel preferences among tourists. Understanding these patterns has crucial implications for tourism stakeholders.

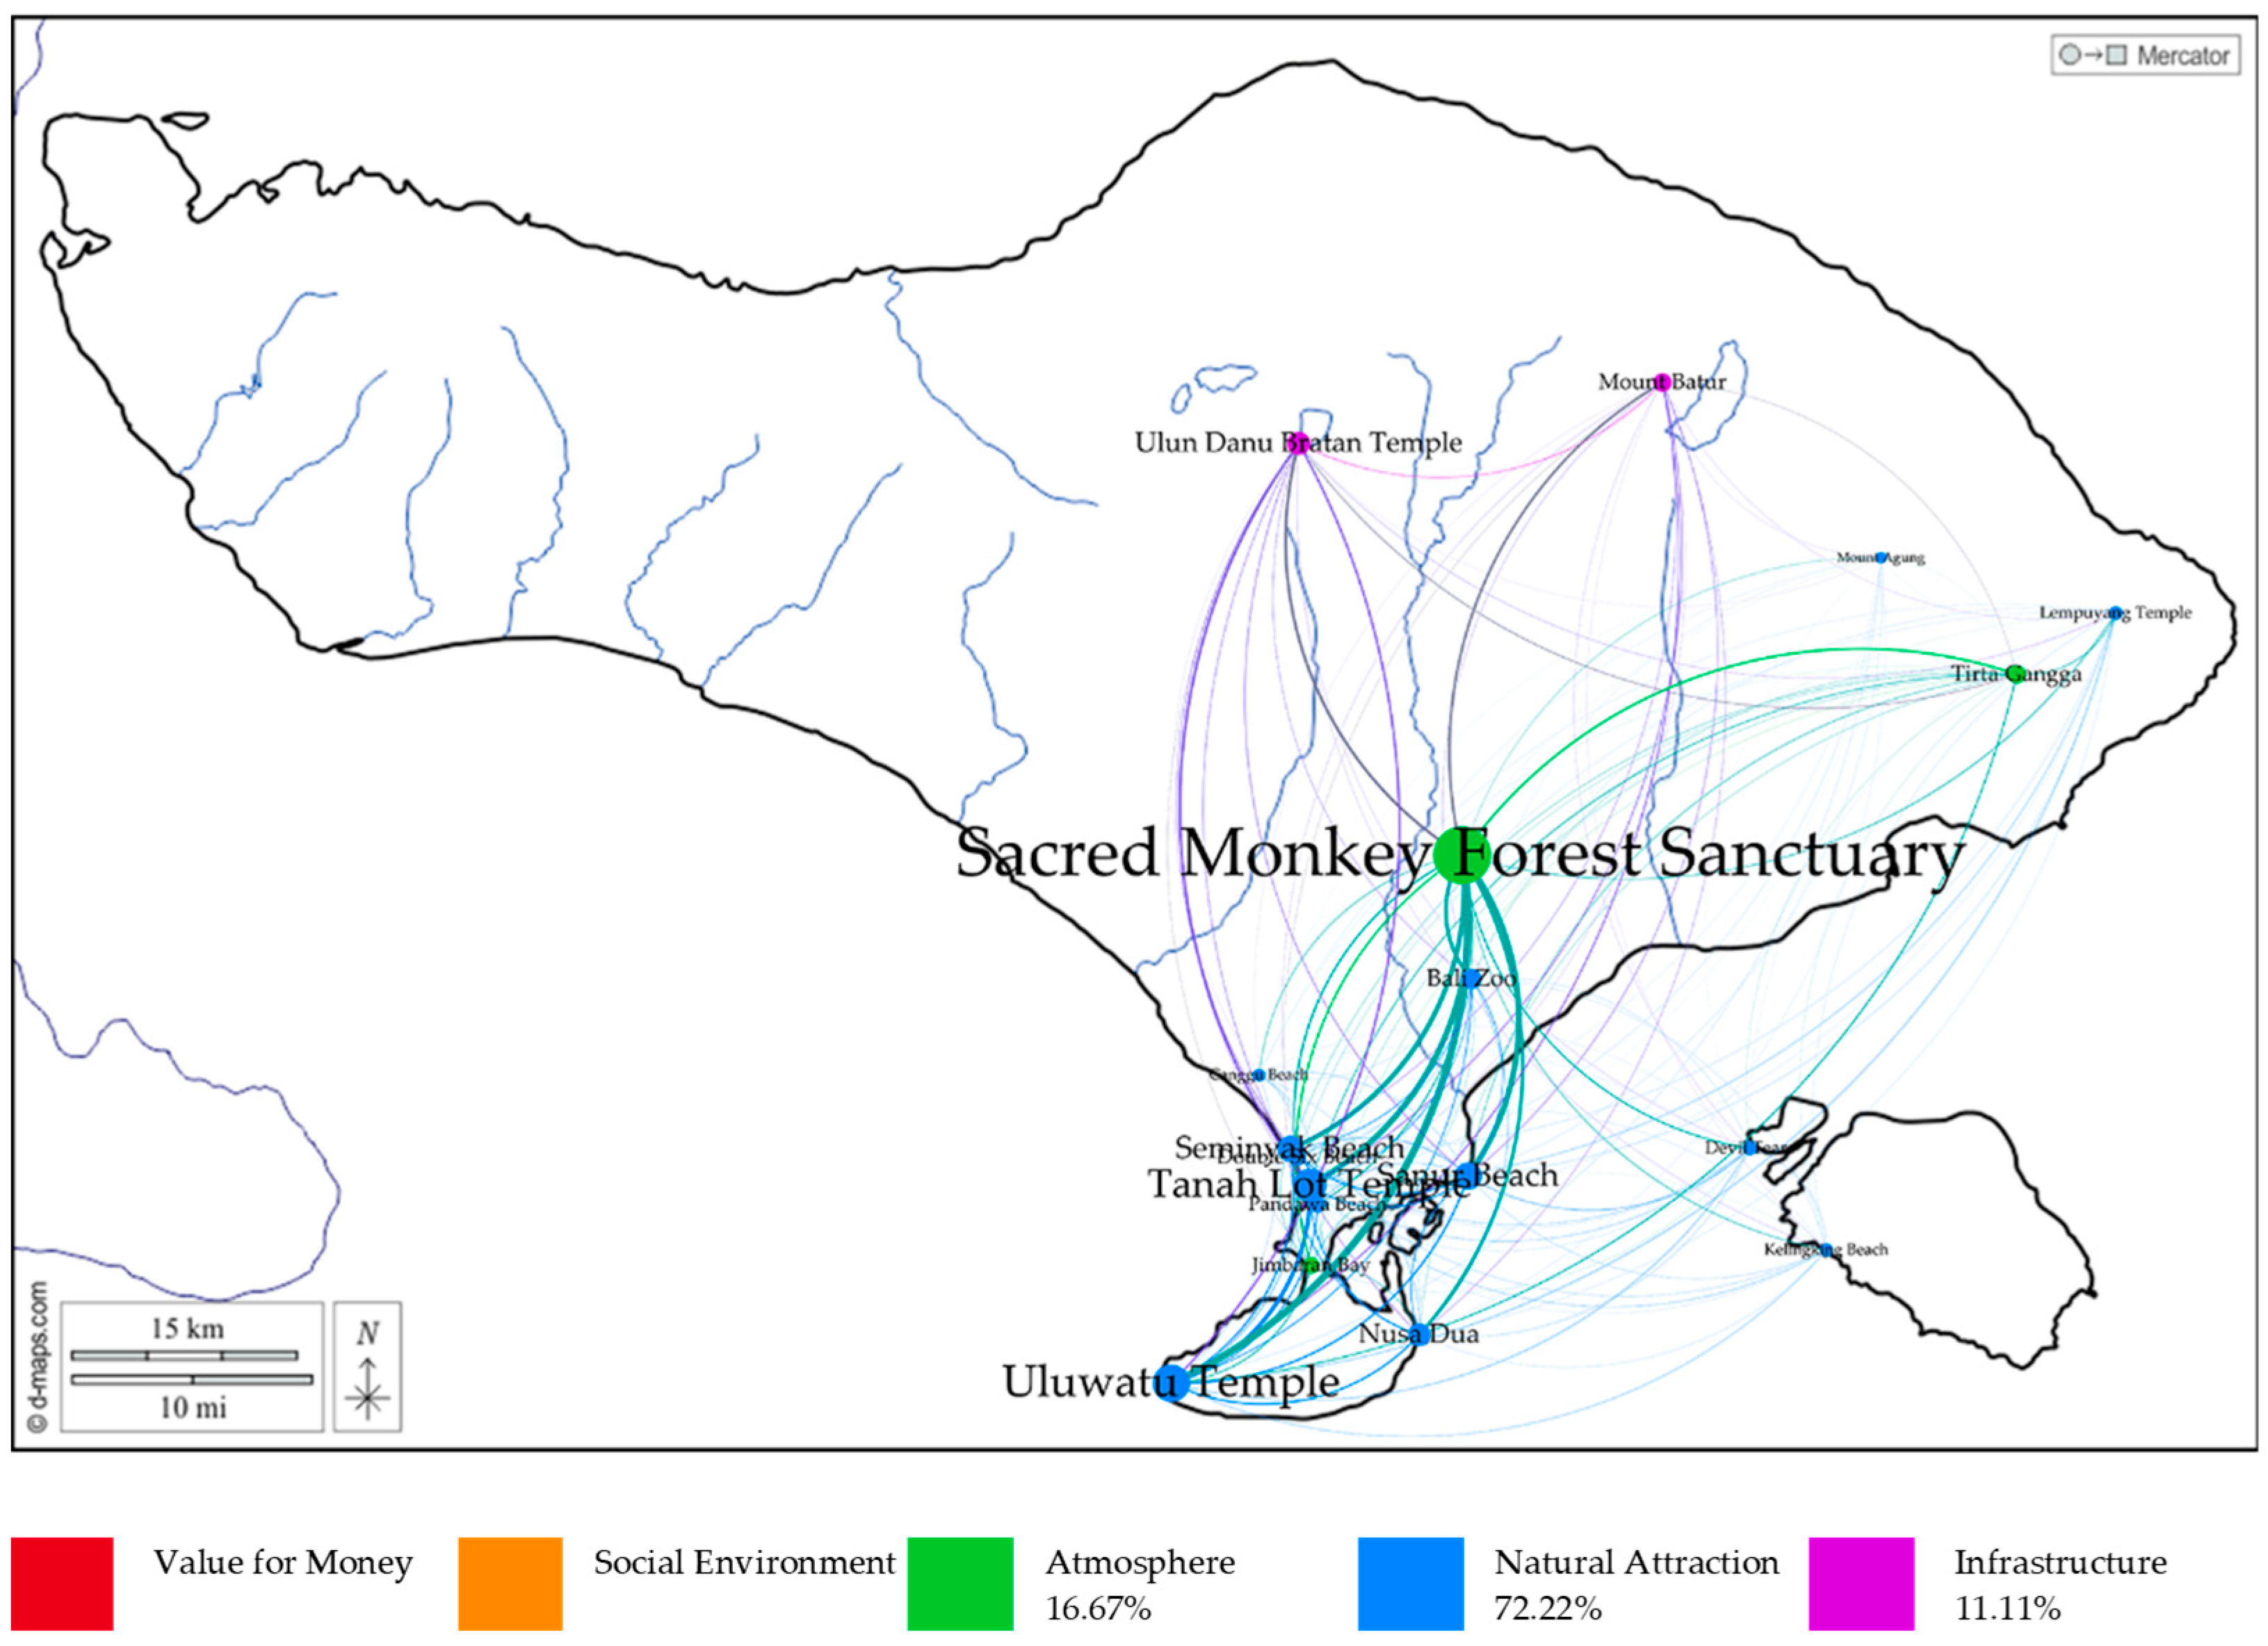
4.6. Map of the Cognitive Dimensions

We map each destination’s most favorable and least favorable cognitive image dimensions in Figure 10 and Figure 11. The “favorable cognitive dimension” chart offers insights into the primary factors contributing to a positive perception of these destinations. A significant majority, 72.22%, attribute their positive impressions to the “Natural Attraction” of these destinations. This proportion indicates that the region’s inherent beauty, natural landscapes, and ecological wonders are pivotal in drawing visitors and leaving them with a favorable impression. Following that, 16.67% of the favorable cognitive dimension is ascribed to the “Atmosphere”, which might encompass the destinations’ cultural vibe, local hospitality, spiritual essence, and overall ambiance. Lastly, 11.11% is attributed to “Infrastructure,” highlighting the importance of well-maintained amenities, accessibility, and other logistical aspects in ensuring a positive visitor experience. The less favorable cognitive dimension map suggests key areas for enhancement in Bali’s tourist experience. Infrastructure, representing 44.44%, is the primary concern, indicating potential issues with transportation and amenities. The social environment, accounting for 33.33% of the less favorable cognitive dimension, hints at possible challenges in cultural interactions and tourist safety. Perceptions of not receiving value for money stand at 16.67%, while atmosphere concerns, although minimal at 5.56%, could relate to ambiance and crowd management.
Throughout our study, we have explored the complexities of tourist dynamics in Bali, from the destinations they frequently select for visitation to the cognitive perceptions tourists have. This comprehensive insight underscores the importance of effective management and a continuous enhancement of the tourist experience. With the right strategies and attentiveness to feedback, Bali has the potential to gain a higher status, rather than maintain its status, as a top tourist destination but also to elevate the quality of each visitor’s experience.

5. Discussion

Tourism behavior is fundamentally a sequence of rational decision-making processes heavily influenced by models derived from consumer behavior and decision-making theories. This leads to various models of tourist decision-making behaviors. A destination image is the subjective perception of a place in a tourist’s mind, which influences their behavior across three stages: priori (before the visit), in loco (during the visit), and posteriori (after the visit). Gartner [62] proposed a simplified view that a destination image comprises cognitive, affective, and conative components. The cognitive dimension of destination images has been identified as having the closest association with user-generated content (UGC) and tourists’ behavioral tendencies. As this research employs UGC as its primary data source, our analysis specifically concentrates on cognitive images.
Our research digs into the tourists’ perception of the cognitive image of a destination using natural attraction, infrastructure, atmosphere, social environment, and value for money to gain deeper insights into tourist behavior. Studying the cognitive image of tourist destinations’ image using a computational approach has been an intriguing topic to academics and researchers for decades. However, the approach taken in this study offers a different perspective compared to previous works [7,31]. Most prior research has focused on evaluating each cognitive image dimension individually. We explore deeper and wider into how these dimensions are associated and correlated. Using this methodology, we can discern how a positive perspective of one dimension might influence the perceptions of another.
The “Atmosphere”, “Social Environment”, and “Value for Money” aspects play a crucial role in shaping a tourist’s overall experience. While these qualitative experiences are highly valued, they do not appear to directly correspond to the quantitative cost-effectiveness evaluation. Value for money predominantly relies on concrete elements such as the expense associated with lodging, the price of local sites, the economic feasibility of dining and transportation, or the caliber of services in proportion to their cost. A tourist may appreciate a resort’s ambiance and staff but perceive its price as excessive relative to its amenities. While “Atmosphere” and “Social Environment” are each frequently reviewed together by the same tourists with “Value for Money”, only “Atmosphere” and “Social Environment” show a high positive sentiment correlation. Still, their relationships with “Value for Money” are different. Neither “Atmosphere” nor “Social Environment” show a strong positive sentiment correlation with “Value for Money”.
While tourists often consider the atmosphere and social environment when reviewing a destination, their satisfaction in these areas does not necessarily translate to their perceived value of the money spent. The Sacred Monkey Forest Sanctuary, a prominent hub and frequently visited location, exemplifies the complex interrelation of tourist opinions. While praised for its ambiance, it simultaneously faces criticism regarding its cost. Essentially, despite the Sacred Monkey Forest Sanctuary offering a rich atmospheric experience, visitors do not perceive the monetary expenses related to their visit as valuable in terms of the quality of their experience.
This research analyzes tourist movements as a crucial component of tourist behavior to understand the dynamics of human mobility. This approach is important in providing comprehensive insights into tourist behavior, which will be beneficial in formulating marketing strategies and service enhancements. Previous research [110] highlights that tourists engage in varying consumption patterns across destinations, which manifest as unique movement patterns. Travel mobility patterns involve the sequential activities of travelers across different locations and timeframes [111]. Extensive research on tourism has been dedicated to identifying, structuring, and forecasting travel mobility [112].
Our investigation adopts a network analysis to map the topology of tourist mobility, a well-established method used in prior research. Notably, compared to former studies [7,14,31], an added strength of this study is that we delve into the potential formation of groups of destinations preferred by the same tourists, as opposed to assuming a random probability to their visits. This focus seeks to understand the patterns of tourist mobility preferences and behavior.
Our research suggests that tourists exhibit distinct preferences when selecting destinations. Certain destinations are more frequently co-visited than others, revealing underlying patterns in tourists’ visiting behavior. We discovered that there are three predominant clusters of visits often selected by tourists, including the cluster of beaches and forests, which attracts those who are drawn to natural beauty and peaceful settings; the cluster of temples resonates with individuals interested in exploring the cultural, historical, and spiritual aspects of the region; and the cluster combining the mountains in North Bali with beaches around Nusa Penida and gains traction due to their proximity, allowing tourists to experience diverse destinations within close range. This categorization underlines the diverse interests of tourists and the significance of both natural beauty and cultural depth in shaping their travel choices.
This research offers both theoretical insights and practical implications for the tourism sector. Theoretically, this research enriches the literature by demonstrating a cognitive image perception evaluation of tourist behavior, mainly through the lens of user-generated content (UGC). This highlights the importance of understanding the diversity of tourist’s cognitive perceptions, suggesting that destinations need to strategically manage their cognitive appeal to enhance their attractiveness in line with tourist preferences. Managerially, understanding distinct tourist perceptions of cognitive images aids in crafting targeted marketing and improving destinations’ service quality. Specifically, insights into how “Atmosphere,” “Social Environment,” and “Value for Money” influence satisfaction enables destinations to adjust their pricing and improve their experiences to meet tourist expectations. Effectively managing these elements can attract desired tourist groups and enhance destination competitiveness. For business owners, government agencies, and tourism stakeholders, these insights offer a roadmap for developing strategies that align closely with what tourists value most. Business owners, particularly those in the hospitality and service sectors, can use these data to refine their offerings, ensuring they provide experiences that resonate with tourists’ expectations of atmosphere and social engagement, while also considering the critical aspect of perceived value for money. Government and tourism agencies can leverage these findings to promote sustainable tourism practices, prioritize preserving natural and cultural assets, and implement policies that enhance the visitor experience without compromising affordability. For tourists, this research underscores the importance of voicing their preferences and experiences through user-generated content. By actively participating in online platforms and review sites, tourists contribute to a larger ecosystem of travel decision making, influencing not only their peers but also the strategic directions of destinations and businesses. This mutual feedback loop between tourists and service providers enriches the travel experience, promoting a tourism industry that is dynamic, responsive, and ever evolving to meet the needs of its diverse customers.
While many studies aim for universal insights, recognizing the variations based on tourists’ geographical and cultural backgrounds is vital. This study is limited to general perceptions and mobility, without considering any background information on the tourists. Turner’s study [113] revealed the intriguing differences tourists’ cultural backgrounds had on their satisfaction levels related to their tourism experiences. These differences might arise from their varying expectations, values, and interpretations of the service quality and experiences had during travel. While tourists from one culture might highly appreciate a particular aspect of a destination, it may not hold the same significance for tourists from another. The positive sentiments associated with the cognitive image dimensions of a tourist destination could also differ depending on the tourist’s cultural or geographic background. Eventually, tourists from different geographic or cultural backgrounds might exhibit distinct travel behaviors, patterns, and preferences [14]. These might cover their choice of destinations, travel routes, duration of stay, activities pursued, and even interactions with locals. Future studies may investigate how tourists’ perceptions of destination images differ based on their geographic origins, including their country of origin, regional affiliations, and other relevant cultural identifiers. This initial study is confined to reviewing data from a single platform, limiting its scope to publicly accessible information. Future research could enhance the robustness of these findings by employing a more exhaustive dataset and drawing from a broader spectrum of data sources.

6. Conclusions

Tourists’ reviews are becoming indispensable in shaping tourist behavior as technology’s role in modern tourism grows. Our research offers a novel insight that differentiates our work from previous research. Our investigation dives deep into the complexities of tourism, examining the correlations between various cognitive image perceptions of destinations. We have uncovered distinct patterns in tourists’ destination preferences, highlighting the dual appeal of natural beauty and cultural richness. Our findings reveal that tourists highly appreciate qualitative aspects like ambiance, though these aspects show a small correlation to their positive perceptions of monetary worth. We also underscore the specific patterns in tourist mobility that can be segregated into unique clusters that highlight the varied interests of tourists and emphasize the pivotal influence of both cultural sites and natural wonders on tourist behavior.

Author Contributions

Conceptualization, D.P.R. and A.A.; methodology, D.P.R. and L.Z.A.D.; software, L.Z.A.D.; validation, D.P.R. and L.Z.A.D.; formal analysis, D.P.R. and L.Z.A.D.; investigation, D.P.R. and L.Z.A.D.; resources, L.Z.A.D.; data curation, L.Z.A.D.; writing—original draft preparation, D.P.R. and L.Z.A.D.; writing—review and editing, D.P.R. and A.A.; visualization, D.P.R.; supervision, A.A.; project administration, M.Y.F.; funding acquisition, D.P.R., A.A. and M.Y.F. All authors have read and agreed to the published version of the manuscript.

Funding

The Directorate General of Higher Education, Research, and Technology, Ministry of Education, Culture, Research, and Technology, Republic of Indonesia: Contract Number: 003/SP2H/RT-MONO/LL4/2023; 323/PNLT2/PPM/2023.

Institutional Review Board Statement

Not applicable.

Informed Consent Statement

Not applicable.

Data Availability Statement

Alamsyah, Andry; Ramadhani, Dian Puteri, Dataset of Digital Reviews in Tourism; Telkom University Dataverse, V1, 2024. https://doi.org/10.34820/FK2/9OJQTK [114].

Conflicts of Interest

The authors declare no conflicts of interest.

References

  1. Albayrak, T.; Caber, M.; Aksoy, Ş. Relationships of the Tangible and Intangible Elements of Tourism Products with Overall Customer Satisfaction. Int. J. Trade Econ. Financ. 2010, 1, 140–143. [Google Scholar] [CrossRef]
  2. Murphy, P.; Pritchard, M.P.; Smith, B. The destination product and its impact on traveller perceptions. Tour. Manag. 2000, 21, 43–52. [Google Scholar] [CrossRef]
  3. Naseem, S. The role of tourism in economic growth. Economies 2021, 9, 117. [Google Scholar] [CrossRef]
  4. Taizeng, R.; Can, M.; Pramawati, S.R.; Fang, J.; Wu, W. The Impact of Tourism Quality on Economic Development and Environment: Evidence from Mediterranean Countries. Sustainability 2019, 11, 2296. [Google Scholar] [CrossRef]
  5. Turner, R.; Freiermuth, E. Travel & Tourism Economic Impact 2016; World Travel & Tourism Council: London, UK, 2016. [Google Scholar]
  6. Ambarwati, S.; Yumna, M. “Antara News”, Antara. 3 May 2023. Available online: https://en.antaranews.com/news/280359/foreign-tourist-visits-reached-225-mln-in-q1-2023-minister (accessed on 7 September 2023).
  7. Alamsyah, A.R.D.P.; Basuseno, H.S. Mining Digital Traces to Uncover Global Perception of Bali’s Topmost Destinations. In Proceedings of the International Workshop on Big Data and Information Security, Depok, Indonesia, 1–3 October 2022; IEEE: Bandung, Indonesia, 2022. [Google Scholar]
  8. Nuenen, v.T. Advancements in technology and digital media in tourism. Tour. Stud. 2021, 21, 119–132. [Google Scholar] [CrossRef]
  9. Chung, H.; Chung, N.; Nam, Y. A Social Network Analysis of Tourist Movement Patterns in Blogs: Korean Backpackers in Europe. Sustainability 2017, 9, 2251. [Google Scholar] [CrossRef]
  10. Tripadvisor, “6 Key Travel Trends for 2016,” Tripadvisor. 14 December 2015. Available online: https://www.tripadvisor.com/TripAdvisorInsights/w665 (accessed on 7 September 2023).
  11. Christou, E.; Sigala, M.; Gretzel, U. Social Media in Travel, Tourism and Hospitality; Theory, Practice and Cases; Ashgate Publishing: Farnham, UK, 2012. [Google Scholar]
  12. Yin, J.; Cheng, Y.; Bi, Y.; Ni, Y. Tourists perceived crowding and destination attractiveness: The moderating effects of perceived risk and experience quality. J. Destin. Mark. Manag. 2020, 18, 100489. [Google Scholar] [CrossRef]
  13. Wong, J.-Y.; Yeh, C. Tourist hesitation in destination decision making. Ann. Tour. Res. 2009, 36, 6–23. [Google Scholar] [CrossRef]
  14. Ramadhani, D.P.; Alamsyah, A.; Atmaja, M.N.; Panjaitan, J.N.C.G. Mapping Complex Tourist Destination Preferences: Network Perspectives. In Proceedings of the 9th International Conference on Information and Communication Technology (ICoICT), Yogyakarta, Indonesia, 3–5 August 2021. [Google Scholar]
  15. Zhou, K.; Yao, Z. Analysis of Customer Satisfaction in Tourism Services Based on the Kano Model. Systems 2023, 11, 345. [Google Scholar] [CrossRef]
  16. Moutinho, L. Consumer Behaviour in Tourism. Eur. J. Mark. 1987, 21, 5–44. [Google Scholar] [CrossRef]
  17. Hasan, M.K.; Ismail, A.R.; Islam, M.F. Tourist risk perceptions and revisit intention: A critical review of literature. Cogent Bus. Manag. 2017, 4, 1412874. [Google Scholar] [CrossRef]
  18. Molina, A.; Rico, M.; Navarro, D. Tourism Marketing Information and Destination. Afr. J. Bus. Manag. 2010, 4, 722–728. [Google Scholar]
  19. Čaušević, A.; Mirić, R.; Drešković, N.; Hrelja, E. Cognitive Image of a Tourism Destination: The Case of Sarajevo. Afr. J. Hosp. Tour. Leis. 2019, 8, 1–12. [Google Scholar]
  20. Chen, C.F.; Phou, S. A closer look at destination: Image, personality, relationship and loyalty. Tour. Manag. 2013, 36, 269–278. [Google Scholar] [CrossRef]
  21. Jebbouri, A.; Zhang, H.; Imran, Z.; Iqbal, J.; Bouchiba, N. Impact of destination image formation on tourist trust: Mediating role of tourist satisfaction. Front. Psychol. 2019, 13, 845538. [Google Scholar] [CrossRef] [PubMed]
  22. Guo, X.; Pesonen, J.A. The role of online travel reviews in evolving tourists’ perceived destination image. Scand. J. Hosp. Tour. 2022, 22, 372–392. [Google Scholar] [CrossRef]
  23. Marine-Roig, E.; Huertas, A. How safety affects destination image projected through online travel reviews. J. Destin. Mark. Manag. 2020, 18, 100469. [Google Scholar] [CrossRef]
  24. Tseng, C.; Wu, B.; Morrison, A.M.; Zhang, J.; Chen, Y.-C. Travel blogs on China as a destination image formation agent: A qualitative analysis using Leximancer. Tour. Manag. 2015, 46, 347–358. [Google Scholar] [CrossRef]
  25. Asero, V.; Gozzo, S.; Tomaselli, V. Building Tourism Networks through Tourist Mobility. J. Travel Res. 2015, 55, 751–763. [Google Scholar] [CrossRef]
  26. Aldilla, D.; Alamsyah, A. An Augmented Method of Selecting Fashion Talent by Adding Social Media Characteristics. In Proceedings of the International Conference on ICT for Smart Society (ICISS), Bandung, Indonesia, 19–20 November 2019. [Google Scholar]
  27. Aditya, I.A.; Haryadi, F.N.; Haryani, I.; Rachmawati, I.; Ramadhani, D.P.; Tantra, T.; Alamsyah, A. Understanding service quality concerns from public discourse in Indonesia state electric company. Heliyon 2023, 9, e18768. [Google Scholar] [CrossRef]
  28. Casanueva, C.; Gallego, Á.; García-Sánchez, M.-R. Social network analysis in tourism. Curr. Issues Tour. 2016, 19, 1190–1209. [Google Scholar] [CrossRef]
  29. Lozano, S.; Gutiérrez, E. A complex network analysis of global tourism flows. Int. J. Tour. Res. 2018, 20, 588–604. [Google Scholar] [CrossRef]
  30. Kim, Y.R.; Williams, A.M.; Park, S.; Chen, J.L. Spatial spillovers of agglomeration economies and productivity in the tourism industry: The case of the UK. Tour. Manag. 2021, 82, 104201. [Google Scholar] [CrossRef]
  31. Ramadhani, D.P.; Setiawan, I.P.S.; Alamsyah, A. The Mobility, Sentiment and Problems Identification Analysis in Tourism Industry using Social Media Data. In Proceedings of the International Conference on Information and Communication Technology, Bandung, Indonesia, 2–3 August 2022. [Google Scholar]
  32. Munar, A.; Jacobsen, J. Motivations for sharing tourism experiences through social media. Tour. Manag. 2019, 43, 46–54. [Google Scholar] [CrossRef]
  33. Zeng, B.; Gerritsen, R. What do we know about social media in tourism? A review. Tour. Manag. Perspect. 2014, 10, 27–36. [Google Scholar] [CrossRef]
  34. Fishbein, M.; Ajzen, I. Belief, Attitude, Intention, and Behavior: An Introduction to Theory and Research; Addison-Wesley: Reading, MA, USA, 1975. [Google Scholar]
  35. Ajzen, I. Attitudes, Personality And Behaviour; The Dorsey Press: Belmont, CA, USA, 1988. [Google Scholar]
  36. Ajzen, I. The theory of planned behavior. Organ. Behav. Hum. 1991, 50, 179–211. [Google Scholar] [CrossRef]
  37. Buttle, F.; Bok, B. Hotel marketing strategy and the theory of reasoned action. Int. J. Contemp. Hosp. Manag. 1996, 8, 5–10. [Google Scholar] [CrossRef]
  38. Lam, T.; Hsu, C. Redicting Behavioral Intention of Choosing a Travel Destination. Tour. Manag. 2006, 27, 589–599. [Google Scholar] [CrossRef]
  39. March, R.G.; Woodside, A.G. Tourism Behavior: Travelers’ Decisions and Actions; CABI Publishing: Cambridge, UK, 2005. [Google Scholar]
  40. Warshaw, P.; Davis, F. Disentangling behavioral intention and behavioral expectation. J. Exp. Soc. Psychol 1985, 21, 213–228. [Google Scholar] [CrossRef]
  41. Norman, P.; Smith, L. The theory of planned behaviour and exercise: An investigation into the role of prior behaviour, behavioural intentions and attitude variability. Eur. J. Soc. Psychol. 1995, 28, 403–415. [Google Scholar] [CrossRef]
  42. Javed, M.; Tučková, Z.; Jibril, A. The Role of Social Media on Tourists’ Behavior: An Empirical Analysis of Millennials from the Czech Republic. Sustainability 2020, 12, 7735. [Google Scholar] [CrossRef]
  43. Alcázar, M.; Pinero, M.; Maya, S. The effect of user-generated content on tourist behavior: The mediating role of destination image. Tour. Manag. Stud. 2014, 10, 158–164. [Google Scholar]
  44. Alcaniz, E.; Sanchez, I.; Blas, S. The functional-psychological continuum in the cognitive image of a destination: A confirmatory analysis. Tour. Manag. 2009, 30, 715–723. [Google Scholar] [CrossRef]
  45. Baloglu, S.; McCleary, K. A model of destination image formation. Ann. Tour. Res. 1999, 26, 868–897. [Google Scholar] [CrossRef]
  46. Bigne, J.; Sanchez, M.; Sanchez, J. Tourism image, evaluation variables and after purchase behaviour: Inter-relationship. Tour. Manag. 2001, 22, 607–616. [Google Scholar] [CrossRef]
  47. Castro, C.; Armario, E.; Ruiz, D. The influence of market heterogeneity on the relationship between a destination’s image and tourists’ future behaviour. Tour. Manag. 2007, 28, 175–187. [Google Scholar] [CrossRef]
  48. Chen, C.; Tsai, D. How destination image and evaluative factors affect behavioral intentions? Tour. Manag. 2007, 28, 1115–1122. [Google Scholar] [CrossRef]
  49. Chi, C.; Qu, H. Examining the structural relationships of destination image and destination loyalty: An integrated approach. Tour. Manag. 2008, 29, 624–636. [Google Scholar] [CrossRef]
  50. Lee, T. A structural model to examine how destination image, attitude, and motivation affect the future behavior of tourist. Leis. Sci. 2009, 31, 215–236. [Google Scholar] [CrossRef]
  51. Li, J.; Xu, L.; Tang, L.; Wang, S.; Li, L. Big data in tourism research: A literature review. Tour. Manag. 2018, 68, 301–323. [Google Scholar] [CrossRef]
  52. Shoval, N.; Ahas, R. The use of tracking technologies in tourism research: The first decade. Tour. Geogr. 2016, 18, 587–606. [Google Scholar] [CrossRef]
  53. Pearce, D.; Schänzel, H. Destination management: The tourists’ perspective. J. Destin. Mark. Manag. 2013, 2, 137–145. [Google Scholar] [CrossRef]
  54. Artigas, E.; Yrigoyen, C.; Moraga, E.; Villalón, C. Determinants of trust towards tourist destinations. J. Destin. Mark. Manag. 2017, 6, 327–334. [Google Scholar]
  55. Dedeoğlu, B. Shaping tourists’ destination quality perception and loyalty through destination country image: The importance of involvement and perceived value. Tour. Manag. Perspect. 2018, 29, 105–117. [Google Scholar] [CrossRef]
  56. Wang, T.-L.; Tran, P.T.K.; Vinh, T. Destination perceived quality, tourist satisfaction and word-of-mouth. Tour. Rev. 2017, 72, 392–410. [Google Scholar] [CrossRef]
  57. Maršanić, R.; Mrnjavac, E.; Pupavac, D.; Krpan, L. Stationary Traffic as a Factor of Tourist Destination Quality and Sustainability. Sustainabbility 2021, 13, 3965. [Google Scholar] [CrossRef]
  58. Yilmaz, Y.; Yilmaz, Y.; Icigen, E.T.; Ekin, Y.; Demirel, B. Destination Image: A Comparative Study on Pre and Post Trip Image Variations. J. Hosp. 2009, 18, 461–479. [Google Scholar] [CrossRef]
  59. Chen, B.; Zhu, Y.; He, X.; Zhou, C. Analysis of High-Quality Tourism Destinations Based on Spatiotemporal Big Data—A Case Study of Urumqi. Land 2023, 12, 1425. [Google Scholar] [CrossRef]
  60. Crompton, J.L. Motivations for pleasure vacation. Ann. Tour. Res. 1979, 6, 408–424. [Google Scholar] [CrossRef]
  61. Agapito, D.; Pinto, P.; Mendes, J.D.C. The Cognitive-Affective-Conative Model of Destination Image: A Confirmatory Analysis. J. Travel Tour. Mark. 2013, 30, 471–481. [Google Scholar] [CrossRef]
  62. Gartner, W.C. Image Formation Process. J. Travel Tour. Mark. 1994, 2, 191–216. [Google Scholar] [CrossRef]
  63. Stylos, N.; Andronikidis, A. Exploring the cognitive image of a tourism destination. TOURISMOS Int. Multidiscip. J. Tour. 2013, 8, 77–97. [Google Scholar]
  64. Balonglu, S.; Brinberg, D. Affective images of tourism destinations. J. Travel Res. 1997, 35, 11–15. [Google Scholar] [CrossRef]
  65. Chooper, C.; Hall, C. Contemporary Tourism: An International Approach; Elsevier: Oxford, UK, 2008. [Google Scholar]
  66. Crompton, J.L.; Ankomah, P.K. Choice set propositions in destination decisions. Ann. Tour. Res. 1993, 20, 461–476. [Google Scholar] [CrossRef]
  67. Gartner, W.; Shen, J. The impact of Tiananmen square on China’s tourism image. J. Travel Res. 1992, 30, 47–52. [Google Scholar] [CrossRef]
  68. Shafiee, M.M.; Tabaeeian, R.A.; Tavakoli, H. The effect of destination image on tourist satisfaction, intention to revisit and WOM: An empirical research in Foursquare social media. In Proceedings of the 10th International Conference on e-Commerce in Developing Countries: With Focus on e-Tourism (ECDC), Isfahan, Iran, 15–16 April 2016. [Google Scholar]
  69. Kesic, T.; Pavlic, I. Tourism Destination Image Formation–The Case of Dubrovnik, Croatia. Mark.-Tržište 2011, 23, 7–25. [Google Scholar]
  70. Akehurst, G. User Generated Content: The Use of Blogs for Tourism Organisations and Tourism Consumers. Serv. Bus. 2009, 3, 51–61. [Google Scholar] [CrossRef]
  71. Echtner, C.M.; Ritchie, J. The meaning and measurement of destination image. J. Tour. Stud. 1991, 2, 2–12. [Google Scholar]
  72. Chen, J.; Uysal, M. Market positioning analysis: A hybrid approach. Ann. Tour. Res. 2002, 29, 987–1003. [Google Scholar] [CrossRef]
  73. Walmsley, D.; Young, M. Evaluative images and tourism: The use of personal constructs to describe the structure of destination images. J. Travel Res. 1998, 36, 65–69. [Google Scholar] [CrossRef]
  74. Pan, B.M.T.; Crotts, J.C. Travel blogs and its implications for destination marketing. J. Travel Res. 2007, 46, 35–45. [Google Scholar] [CrossRef]
  75. Artuğer, S.; Çetinsöz, B.C.; Kılıç, İ. The Effect of Destination Image on Destination Loyalty: An Application in Alanya. Eur. J. Bus. Manag. 2013, 5, 124–136. [Google Scholar]
  76. Yan, Y.; Chen, J.; Wang, Z. Mining public sentiments and perspectives from geotagged social media data for appraising the post-earthquake recovery of tourism destinations. Appl. Geogr. 2020, 123, 102306. [Google Scholar] [CrossRef]
  77. Lalicic, L.; Marine-Roig, E.; Ferrer-Rosell, B.; Martin-Fuentes, E. Destination image analytics for tourism design: An approach through Airbnb reviews. Ann. Tour. Res. 2021, 86, 103100. [Google Scholar] [CrossRef]
  78. Meng, L.; Liu, Y.; Wang, Y.; Li, X. A big-data approach for investigating destination image gap in Sanya City: When will the online and the offline goes parted? Reg. Sustain. 2021, 2, 98–108. [Google Scholar] [CrossRef]
  79. Arefieva, V.; Egger, R.; Yu, J. A machine learning approach to cluster destination image on Instagram. Tour. Mananag. 2021, 85, 104318. [Google Scholar] [CrossRef]
  80. Qian, L.; Guo, J.; Qiu, H.; Zheng, C.; Ren, L. Exploring destination image of dark tourism via analyzing user generated photos: A deep learning approach. Tour. Manag. Perspect. 2023, 48, 101147. [Google Scholar] [CrossRef]
  81. Lee, J.-S.; Park, S. A cross-cultural anatomy of destination image: An application of mixed-methods of UGC and survey. Tour. Manag. 2023, 98, 104746. [Google Scholar] [CrossRef]
  82. Liu, J.; Yue, M.; Yu, F.; Tong, Y. The contribution of tourism mobility to tourism economic growth in China. PLoS ONE 2022, 17, e0275605. [Google Scholar] [CrossRef]
  83. Park, S.; Xu, Y.; Jiang, L.; Chen, Z.; Huang, S. Spatial structures of tourism destinations: A trajectory data mining approach leveraging mobile big data. Ann. Tour. Res. 2020, 84, 102973. [Google Scholar] [CrossRef]
  84. Xue, L.; Zhang, Y. The effect of distance on tourist behavior: A study based on social media data. Ann. Tour. Res. 2020, 82, 102916. [Google Scholar] [CrossRef]
  85. Tian, Z.; Wang, Q.; Liu, Y.; Wang, Z. Comparison of the tourist mobility patterns among demographic subgroups with mobile phone data: A case study of Chongqing, China. Appl. Geogr. 2023, 159, 103090. [Google Scholar] [CrossRef]
  86. Alamsyah, A.; Ramadhani, D. Pengenalan Social Network Analysis: Konsep dan Praktis; Sadari: Bandung, Indonesia, 2020. [Google Scholar]
  87. Scott, P.T.; Pregelj, L.; Chen, N.; Hadler, J.S.; Djordjevic, M.A.; Gresshoff, P.M. An untapped resource for the biofuels industry of the future. BioEnergy Res. 2008, 1, 1. [Google Scholar] [CrossRef]
  88. Wu, J.; Wang, X.; Pan, B. Agent-based simulations of China inbound tourism network. Sci. Rep. 2019, 9, 12325. [Google Scholar] [CrossRef] [PubMed]
  89. Jeon, C.-Y.; Yang, H.-W. The structural changes of a local tourism network: Comparison of before and after COVID-19. Curr. Issues Tour. 2021, 24, 3324–3338. [Google Scholar] [CrossRef]
  90. Iswandhani, N.; Muhajir, M.M. K-means cluster analysis of tourist destination in special region of Yogyakarta using spatial approach and social network analysis (a case study: Post of @explorejogja instagram account in 2016). J. Phys. Conf. Ser. 2018, 974, 012033. [Google Scholar] [CrossRef]
  91. Stantic, B.; Pokorny, J. Opportunities in big data management and processing. In Frontiers in Artificial Intelligence and Applications, Databases; IOS Press: Amsterdam, The Netherlands, 2024; pp. 15–26. [Google Scholar] [CrossRef]
  92. Buhalis, D. Technology in tourism-from information communication technologies to ETourism and smart tourism towards ambient intelligence tourism: A perspective article. Tour. Rev. 2019, 75, 267–272. [Google Scholar] [CrossRef]
  93. Buhalis, D.; Harwood, T.; Bogicevic, V.; Viglia, G.; Beldona, S.; Hofacker, C. Technological disruptions in services: Lessons from tourism and hospitality. J. Serv. Manag. 2019, 30, 484–506. [Google Scholar] [CrossRef]
  94. Fotis, J.; Buhalis, D.; Rossides, N. Social media use and impact during the holiday travel planning ‘process’. In Information and Communication Technologies in Tourism 2012; Springer: Vienna, Austria, 2012; pp. 13–24. [Google Scholar]
  95. Chen, J.; Becken, S.; Stantic, B. Harnessing social media to understand tourist mobility: The role of information technology and big data. Tour. Rev. 2022, 77, 1219–1233. [Google Scholar] [CrossRef]
  96. Hirschberg, J.; Manning, C. Advances in natural language processing. Science 2015, 349, 261–266. [Google Scholar] [CrossRef]
  97. Qiu, X.; Sun, T.; Xu, Y.; Shao, Y.; Dai, N.; Huang, X. Pre-trained models for natural language processing: A survey. Sci. China Technol. Sci. 2020, 63, 1872–1897. [Google Scholar] [CrossRef]
  98. Nadkarni, P.M.; Ohno-Machado, L.; Chapman, W. Natural language processing: An introduction. J. Am. Med. Inform. Assoc. 2011, 18, 544–551. [Google Scholar] [CrossRef] [PubMed]
  99. Wang, X.; Tian, J.; Li, F. Text data mining of power based on natural language processing technology. In Proceedings of the 2nd International Conference on Electronics, Circuits and Information Engineering, Online, 7–9 January 2022. [Google Scholar]
  100. Koleck, T.A.; Dreisbach, C.; Bourne, P.E.; Bakken, S. Natural language processing of symptoms documented in free-text narratives of electronic health records: A systematic review. J. Am. Med. Inform. Assoc. 2019, 26, 364–379. [Google Scholar] [CrossRef] [PubMed]
  101. Perazzoli, S.; Neto, J.P.D.S.; de Menezed, M.J.M.B. Systematic analysis of constellation-based techniques by using Natural Language Processing. Technol. Forecast. Soc. Chang. 2022, 179, 121674. [Google Scholar] [CrossRef]
  102. Kumar, L.; Bathia, P. Text Mining Concepts, Process and Applications. J. Glob. Res. Comput. Sci. 2013, 4, 36–39. [Google Scholar]
  103. Dalal, M.K.; Zaveri, M. Semisupervised Learning Based Opinion Summarization and Classification for Online Product Reviews. Appl. Comput. Intell. Soft Comput. 2013, 2013, 910706. [Google Scholar] [CrossRef]
  104. Agarwal, B.; Mittal, N.; Bansal, P.; Garg, S. Sentiment Analysis Using Common-Sense and Context Information. Comput. Intell. Neurosci. 2015, 2015, 715730. [Google Scholar] [CrossRef] [PubMed]
  105. Pozzi, F.A.; Fersini, E.; Messina, V.; Liu, B. Challenges of Sentiment Analysis in Social Networks. In Sentiment Analysis in Social Networks; Morgan Kaufmann: Burlington, MA, USA, 2017. [Google Scholar] [CrossRef]
  106. Topal, A.D.; Eren, C.D.; Geçer, A.K. Chatbot application in a 5th grade science course. Educ. Inf. Technol. 2021, 26, 6241–6265. [Google Scholar] [CrossRef] [PubMed]
  107. Devlin, J.; Chang, M.-W.; Lee, K.; Toutanova, K. BERT: Pre-training of Deep Bidirectional Transformers for Language Understanding. In Proceedings of the 2019 Conference of the North American Chapter of the Association for Computational Linguistics: Human Language Technologies, Volume 1 (Long and Short Papers), Minneapolis, MN, USA, 2–7 June 2019. [Google Scholar]
  108. Wongkar, M.; Angdresey, A. Sentiment Analysis Using Naive Bayes Algorithm of the Data Crawler: Twitter. In Proceedings of the International Conference on Informatics and Computing (ICIC), Semarang, Indonesia, 16–17 October 2019. [Google Scholar]
  109. Nurdiansyah, Y.; Bukhori, S.; Hidayat, R. Sentiment analysis system for movie review in Bahasa Indonesia using naive bayes classifier method. J. Phys. Conf. Ser. Inst. Phys. Publ. 2018, 1008, 012011. [Google Scholar] [CrossRef]
  110. McKercher, B.; Wong, C.; Lau, G. How tourists consume a destination. J. Bus. Res. 2006, 59, 647–652. [Google Scholar] [CrossRef]
  111. Lau, G.; McKercher, B. Understanding Tourist Movement Patterns in a Destination: A GIS Approach. Tour. Hosp. Res. 2006, 7, 39–49. [Google Scholar] [CrossRef]
  112. Park, S.; Zu, J.; Xu, Y.; Zhang, F.; Liu, Y.; Li, J. Analyzing travel mobility patterns in city destinations: Implications for destination design. Tour. Manag. 2023, 96, 104718. [Google Scholar] [CrossRef]
  113. Turner, L.W.; Reisinger, Y.V.; McQuilken, L. How Cultural Differences Cause Dimensions of Tourism Satisfaction. J. Travel Tour. Mark. 2008, 11, 79–101. [Google Scholar] [CrossRef]
  114. Damayanti, L.Z.A.; Ramadhani, D.P.; Alamsyah, A.; Febrianta, M.Y. Dataset of Digital Reviews in Tourism; Mendeley Data, V1; Telkom University Dataverse: Jawa Barat, Indonesia, 2023. [Google Scholar] [CrossRef]
Figure 1. Research workflow.
Jtaer 19 00040 g001
Figure 2. Edge list scenario; UserA1 visiting Bali Zoo and Canggu Beach. A destination pair is generated for Bali Zoo and Canggu Beach.
Jtaer 19 00040 g002
Figure 3. Distribution of tourist reviews across prominent Bali destinations.
Jtaer 19 00040 g003
Figure 4. Sentiment proportion for each destination.
Jtaer 19 00040 g004
Figure 5. Comparison of reviews based on cognitive image dimensions.
Jtaer 19 00040 g005
Figure 6. Distribution of positive reviews across cognitive image dimensions.
Jtaer 19 00040 g006
Figure 7. Variability of positive sentiments across different cognitive image dimensions.
Jtaer 19 00040 g007
Figure 8. Tourist visitation network: the wider lines indicate more frequent co-visitation.
Jtaer 19 00040 g008
Figure 9. Tourist co-visitation network.
Jtaer 19 00040 g009
Figure 10. Map of the favorable cognitive image dimensions.
Jtaer 19 00040 g010
Figure 11. Map of the less favorable cognitive image dimensions.
Jtaer 19 00040 g011
Table 1. Cognitive image dimensions.
ComponentCharacteristics
Natural attractionPresence of natural beauty areas, historical sites, and museums.
InfrastructureThe presence of high-quality accommodation, a comprehensive tourism information network, established hygiene standards, and the maintenance of satisfactory cleanliness conditions.
AtmosphereBeautiful beaches, appealing entertainment options, and sufficient facilities for sports and recreational activities.
Social environmentFriendliness of residents and safety of the environment.
Value for moneyReasonable pricing, affordability, and value for the cost.
Table 2. Comparison of sentiment models’ performances.
ModelAccuracyF1 Score
Naïve Bayes78.81%73.99%
SVM86.17%85.68%
BERT87.20%86.97%
Table 3. Examples of cognitive attribute labels.
ReviewLabel
We loved this trip to a beautiful place, spiritual and relaxing. Natural attractions
A few souvenir shops there as well and a cafe in the main building.Infrastructure
Would recommend. The place is nice and clean. Atmosphere
The entrance is well maintained with facilities for eating and resting. Social environment
Due to its central location, it is easily accessible from the city center. Value for money
Table 4. Comparison of multiclass classification models’ performances.
ModelAccuracyF1 Score
Naïve Bayes52.69% 46.17%
SVM86.52%86.56%
BERT95.30%95.30%
Table 5. Example node list.
LabelLongitudeLatitudeFavorable Cognitive
Dimension
Less Favorable
Cognitive
Dimension
Bali Zoo115.26581−8.59189Natural AttractionValue for Money
Canggu Beach115.13040−8.65983Natural AttractionInfrastructure
Devil Tears Beach115.42934−8.69076Natural AttractionInfrastructure
Double Six Beach115.16068−8.69635Natural AttractionInfrastructure
Jimbaran Bay115.16866−8.76947AtmosphereInfrastructure
Table 6. Centrality metrics.
Centrality MetricsExplanation
Degree
Centrality
Evaluating the significance of nodes in accordance with the number of their direct connections. In the context of tourism analysis, degree centrality quantifies the importance of specific destinations by considering the number of connections they have with other destinations. This metric is especially relevant for identifying popular tourist destinations that have a higher number of direct visitation connections, reflecting their prominence in the overall tourist mobility network.
Betweenness
Centrality
Evaluating the significance of nodes by considering their role as intermediaries in connecting pairs of nodes across the entirety of the network. In the context of tourism analysis, betweenness centrality indicates the extent to which specific destinations act as crucial connectors, facilitating the flow of tourist mobility between various attractions. Destinations with higher betweenness centrality values play a pivotal role in maintaining the overall connectivity of the tourism network by serving as key points for tourists to pass through.
Table 7. Sentiment distributions for each destination.
NoDestinationNumber of ReviewsSentiment
PositiveNegative
1Sacred Monkey Forest Sanctuary18,54283.57%16.43%
2Uluwatu Temple590281.46%18.54%
3Sanur Beach452671.79%28.21%
4Tanah Lot Temple421880.99%19.01%
5Seminyak Beach376162.06%37.94%
6Nusa Dua332482.55%17.45%
7Bali Zoo264086.33%13.67%
8Mount Batur181585.67%14.33%
9Ulun Danu Bratan Temple172286.30%13.70%
10Tirta Gangga155792.68%7.32%
11Pandawa Beach151179.35%20.65%
12Jimbaran Bay143069.37%30.63%
13Double Six Beach132368.86%31.14%
14Devil Tears126386.86%13.14%
15Kelingking Beach71393.97%6.03%
16Lempuyang Temple59677.01%22.99%
17Canggu Beach55564.50%35.50%
18Mount Agung26688.72%11.28%
Average 80.36%19.64%
Table 8. Sentiment score for each destination.
NoCognitive Image
Destination
Number of ReviewsSentiment
PositiveNegative
1Value for Money16,99779.3%20.7%
2Social Environment14,75178.9%21.1%
3Atmosphere12,63982.3%17.7%
4Natural Attraction828086.6%13.4%
5Infrastructure299767.4%32.6%
Average 80.36%19.64%
Table 9. Sentiment score for each cognitive dimension of each individual destination.
NoDestinationValue for MoneySocial EnvironmentAtmosphereNatural AttractionInfrastructure
PositiveNegativePositiveNegativePositiveNegativePositiveNegativePositiveNegative
1Sacred Monkey Forest Sanctuary82.77%17.23%81.55%18.45%86.98%13.02%86.74%13.26%82.18%17.82%
2Uluwatu Temple78.71%21.29%79.16%20.84%84.32%15.68%85.98%14.02%79.76%20.24%
3Sanur Beach73.07%26.93%71.77%28.23%74.57%25.43%74.70%25.30%56.48%43.52%
4Tanah Lot Temple76.45%23.55%75.00%25.00%86.63%13.38%88.18%11.82%82.00%18.00%
5Seminyak Beach62.67%37.33%57.20%42.80%68.84%31.16%72.48%27.52%46.80%53.20%
6Nusa Dua78.50%21.50%84.55%15.45%83.27%16.73%84.95%15.05%80.09%19.91%
7Bali Zoo75.98%24.02%94.45%5.55%94.01%5.99%95.45%4.55%92.86%7.14%
8Mount Batur84.85%15.15%84.66%15.34%86.52%13.48%89.15%10.85%90.20%9.80%
9Ulun Danu Bratan Temple82.70%17.30%80.58%19.42%91.13%8.87%90.97%9.03%93.10%6.90%
10Tirta Gangga91.42%8.58%89.40%10.60%95.93%4.07%92.69%7.31%87.50%12.50%
11Pandawa Beach77.83%22.17%69.85%30.15%81.61%18.39%89.76%10.24%84.68%15.32%
12Jimbaran Bay55.02%44.98%74.12%25.88%87.78%12.22%84.46%15.54%52.99%47.01%
13Double Six Beach75.46%24.54%63.57%36.43%73.36%26.64%81.31%18.69%50.00%50.00%
14Devil Tears87.89%12.11%82.28%17.72%90.21%9.79%90.52%9.48%71.43%28.57%
15Kelingking Beach95.67%4.33%91.46%8.54%92.70%7.30%97.70%2.30%84.62%15.38%
16Lempuyang Temple76.14%23.86%74.19%25.81%73.47%26.53%84.11%15.89%80.00%20.00%
17Canggu Beach67.59%32.41%66.67%33.33%62.18%37.82%85.48%14.52%37.04%62.96%
18Mount Agung85.96%14.04%85.90%14.10%93.75%6.25%100.00%0.00%94.44%5.56%
Table 10. Concurrent tourist mentions of a destination’s cognitive image dimensions.
Cognitive Image
Dimension
Social
Environment
Value for MoneyNatural
Attractions
Infrastructure
Atmosphere3.23%3.56%2.19%0.80%
Social Environment 4.19%2.22%0.83%
Value for Money 2.41%0.97%
Natural Attractions 0.52%
Jtaer 19 00040 i001
Table 11. Correlation matrix of positive sentiments across cognitive image dimensions in tourism.
Cognitive Image
Dimension
Value for MoneySocial
Environment
AtmosphereNatural
Attractions
Infrastructure
Value for Money1
Social Environment0.6871
Atmosphere0.5970.8481
Natural Attractions0.6690.7950.7651
Infrastructure0.7030.7830.7930.7301
Jtaer 19 00040 i002
Table 12. Weighted Degree centrality and betweenness centrality of destinations.
DestinationWeighted Degree
Centrality
Betweenness
Centrality
Sacred Monkey Forest Sanctuary12,0940.0625
Uluwatu Temple68650.0625
Sanur Beach43700.0625
Tanah Lot Temple58330.0625
Seminyak Beach40550.0625
Nusa Dua31040.0625
Bali Zoo24940.0625
Mount Batur21050.0625
Ulun Danu Bratan Temple32600.0625
Tirta Gangga20890.0625
Pandawa Beach15150.0625
Jimbaran Bay15740.0625
Double Six Beach17280.0625
Devil Tears11130.0625
Kelingking Beach7410
Lempuyang Temple9200.0625
Canggu Beach6650.0625
Mount Agung2990
Table 13. Weight of destination pairs.
DestinationSacred Monkey Forest SUluwatu TempleSanur BeachTanah Lot TempleSeminyak BeachNusa DuaBali ZooMount BaturUlun Danu Bratan TmpTirta GanggaPandawa BeachJimbaran BayDouble Six BeachDevil TearsKelingking BeachLempuyang TempleCanggu BeachMount Agung
Sacred Monkey Forest Sanctuary 194714861567128089096163274453027540543033216920116283
Uluwatu Temple 4561122419442249293527294325245152110841105832
Sanur Beach 36440025022015218315010012715914049446426
Tanah Lot Temple 3673192032236412202071491257475856329
Seminyak Beach 24920611415890871253317448345914
Nusa Dua 113102154721081331015329264617
Bali Zoo 76104673567663228243013
Mount Batur 140654656514824372026
Ulun Danu Bratan Temple 17910160614850692615
Tirta Gangga 6334493831182169
Pandawa Beach 4243252115175
Jimbaran Bay 49281412226
Double Six Beach 2824192812
Devil Tears 5211173
Kelingking Beach 28154
Lempuyang Temple 185
Canggu Beach 4
Mount Agung
Jtaer 19 00040 i003
Disclaimer/Publisher’s Note: The statements, opinions and data contained in all publications are solely those of the individual author(s) and contributor(s) and not of MDPI and/or the editor(s). MDPI and/or the editor(s) disclaim responsibility for any injury to people or property resulting from any ideas, methods, instructions or products referred to in the content.

