2. Literature Review
This section delves into the present research status of both generic chatbots and government-specific counterparts. It examines the prevailing body of knowledge regarding the factors influencing user favorability with generic chatbots. Additionally, it establishes a theoretical foundation by thoroughly reviewing pertinent literature. Subsequently, the section articulates the theoretical framework and hypotheses that guide the study, offering a structured foundation for subsequent analysis.
2.1. The Current Research Status of Normal Chatbots and Government Chatbots
The concept of “chatbot” was first introduced in literature by Jacobstein et al. in 1998 [
9]. From 2016 onward, there has been a swift increase in research literature concerning “chatbots”. This surge can be attributed to a convergence of factors: rapid progress in artificial intelligence, momentum from big data and cloud computing, escalating industry needs, rising societal focus, as well as enhanced policy backing and financial infusion. These factors together have accelerated the advancements and broadened the application horizons of chatbot technology. This technology has demonstrated immense potential in areas such as customer service, market marketing, and more, eliciting extensive academic attention and robust industry participation. Areas of chatbot applications include psychological health consultation [
10], food ordering, product recommendation [
11], campus services, financial services, agricultural assistance, healthcare, veterinary consultation, e-commerce, and governmental-related services [
3].
In the domain of public administration, chatbots find applications primarily in areas like government consultation, policy promotion, service guidance, public affairs processing, emergency response, and decision support. Such applications not only amplify the efficiency of government sectors and mitigate operational costs, but also fortify the interactive experience between governments and the public, leading to elevated user favorability. Through chatbots, the public can access policy information, execute tasks, and voice concerns with greater ease, while governments harness the capacity to swiftly collate public opinion, address issues, and introduce targeted improvements. Government chatbots, representing a specific adaptation of chatbots in public administration, inherit the technological attributes of intelligent interaction and natural language processing. Furthermore, these bots undergo bespoke customizations and optimizations to cater to the unique demands of governmental services. Such chatbots prioritize the dissemination and communication of information pertaining to policy interpretation, legal consultation, and administrative processes, ensuring the public benefits from more accessible, accurate, and efficient governmental services. By integrating government chatbots, governmental departments can realize round-the-clock online services, magnify the transparency and accessibility of public services, fortify trust and communication between the government and its populace, and consequently enhance overall favorability with public services.
Specifically, the research related to government chatbots encompasses several areas: analysis of the role and impact of government chatbots in elevating the level of government services, enhancing the image of the government, and fostering communication between the government and citizens; exploration of the application and value of government chatbots in domains such as emergency management, public safety, and environmental regulation; investigation into the auxiliary role of government chatbots in the governmental decision-making process, emphasizing their contributions in data analysis, forecasting, and recommendation; scrutiny of challenges posed by government chatbots in safeguarding citizen privacy and data security, along with the government’s corresponding management and regulatory measures; and assessment of the degree of governmental policy support for the development of government chatbots, coupled with potential issues in the policy implementation process and their respective solutions.
2.2. Review of Factors Influencing User Favorability with Normal Chatbots
Scholars’ rigorous exploration into chatbot favorability has led to the categorization of its influential factors into distinct yet interconnected dimensions. Initiating this exploration, public-centric factors stand prominently. An in-depth analysis reveals that from the public’s viewpoint, determinants of chatbot favorability converge into three critical subdomains. Firstly, there is an emphasis on public perceptions. These perceptions include a spectrum of elements such as perceived autonomy [
12], trustworthiness [
13], and cognitive load [
12,
14]. Following perceptions, public favorability emerges as the next sub-domain, specifically touching upon attraction quality and intrinsic quality, as highlighted by Yang [
7]. Lastly, behavioral qualities and social support [
4], comprising emotional and informational support elements, weave into this public-centric perspective, marking its comprehensive nature.
Transitioning from the public to the very subject of their interaction, the chatbot, intrinsic factors come into the spotlight. Delving into this domain, the chatbot service quality, as emphasized by multiple studies such as Hsiao and Chen [
13], resonates as a crucial determinant. Here, nuances like process quality and anthropomorphic service quality [
13] are not to be overlooked. Moreover, the chatbot’s emotional quality, social characteristics [
15], and anthropomorphic designs—with particular attention to personality traits like extroversion [
11] and responsibility [
16]—play pivotal roles. Furthermore, functional characteristics underscore the importance of elements ranging from interactivity [
17] to media attraction [
15].
Lastly, as the discourse shifts to a broader canvas, societal factors merit attention. Joshi [
18] offers invaluable insights into the significance of social influence, highlighting cultural, economic, and political underpinnings. In tandem with this is the concept of convenience conditions, emphasizing not only equipment and technological conditions, but also the importance of material support, thereby rounding off this comprehensive exploration. In conclusion, this synthesis underscores the multitudinal and interconnected factors that scholars have meticulously identified, playing an instrumental role in shaping user favorability with chatbots. The referenced works provide a rich tapestry of insights, driving the academic discourse forward in this realm.
From the latest Chinese and international research advancements, several observations become evident: Chatbots in the realm of public administration studies remain under-researched, especially concerning their role in digital government interactive platforms and the associated user favorability. Much of the prevailing research on chatbot user favorability delves into public perceptions, and garnered social support with limited attention to varied public demands across different contexts. Consequently, studies on user favorability with government chatbots on digital government interaction platforms should integrate a dual perspective of “supply and demand” between the government and the public, thereby establishing a bidirectional cyclical channel.
The establishment of government chatbots on digital government interaction platforms serves as the linchpin in the drive towards intelligent and insightful construction. An urgent need exists for high-level research in this domain within the country. However, several shortcomings in the current studies on chatbots in digital government platforms persist: Firstly, academic and policy-oriented research addressing public demands remains scant; Secondly, while the majority of studies shed light on specific issues, comprehensive research addressing systemic concerns is lacking; Thirdly, although a plethora of research focuses on the service capabilities of government portal websites, studies integrating public needs and environment dimensions, along with the practical effects post-application, are insufficient; Fourth, expansive research tailored to the Chinese context is sparse. Finally, current theoretical advancements in government chatbots on digital government platforms struggle to bolster policy updates, with theoretical studies lagging, often neglecting both qualitative and quantitative methodologies. There is also a glaring absence of pragmatic studies exploring underlying, universal rules regarding user favorability with government chatbots on digital government platforms, based on public demands. Contemplating specific application scenarios and focusing on public demands and favorability regarding government chatbots on digital government platforms remains a nascent field in public administration studies.
2.3. Theoretical Foundation
The intricate relationship between public satisfaction and public favorability is grounded in the understanding that existing public satisfaction serves as the foundation for the development of public favorability.
Public satisfaction encapsulates the overall contentment of the public with an organization, product, or service. It mirrors the sentiments and evaluations of the public following engagement with a specific entity, covering crucial aspects such as quality, performance, pricing, and customer service. Public satisfaction originates from the concept of customer satisfaction, which measures the overall sentiment towards the consumption process and outcome for private goods or services, and is considered an emotional evaluation. Woodside et al. [
19] view customer satisfaction as an attitude formed after consumption activities, evaluating the feelings generated from purchasing products or services. Zhang [
20] notes that when applied to the public sector, public satisfaction is defined as the cognitive gap between expected outcomes before consuming public services and the actual experience afterward. Through the analysis of the literature, it is understood that public satisfaction can be conceptualized in several ways. Firstly, it is viewed as the public’s perception of government-offered services, a comparison between expected and actual feelings. Secondly, it is believed that satisfaction levels hinge on comparing public service experiences before and after usage, with greater ratios suggesting higher satisfaction. Lastly, it is considered quantifiable, measured against specific public service indicators to guide governmental assessment of service delivery or performance. Summarily, public satisfaction reflects the perceptual gap between anticipated and realized outcomes in government services, offering crucial insights for enhancing public services and policymaking.
Public favorability represents the specific choices the public tends to make when presented with various options. These favorabilities can be influenced by individual experiences, brand image, marketing efforts, and other factors. Currently, there is a scarcity of research that precisely defines “Public Favorability”, and the academic community has not yet reached a consensus on its definition. For instance, the Pew Research Center (Pew Research Center.
https://www.pewresearch.org/politics/2020/04/09/public-holds-broadly-favorable-views-of-many-federal-agencies-including-cdc-and-hhs/ accessed on 9 April 2020.) conducted a study to understand how Americans view federal government agencies. This research found that Americans continue to rate a wide range of federal agencies favorably, even in the face of challenges such as the coronavirus outbreak. Agencies like the Centers for Disease Control and Prevention (CDC) and the Department of Health and Human Services (HHS) received broadly favorable ratings from the public, demonstrating the concept of public favorability in action. The study suggests that public favorability can significantly impact the perception and effectiveness of governmental agencies and their policies.
Although there is an abundance of research on public satisfaction, studies focusing on public favorability, especially concerning governmental chatbots, are still in their infancy. Currently, investigating the public favorability towards governmental chatbots has become imperative. The first reason for this focus is that favorability extends beyond mere satisfaction. While satisfaction measures the public’s reaction to a service or product based on their expectations and experiences, favorability encompasses a broader range of factors, including trust, perceived value, and emotional connection. These dimensions are critical in the context of governmental services, where trust and credibility play significant roles. Additionally, favorability can provide insights into the public’s willingness to engage with and support governmental initiatives, beyond the transactional interactions measured by satisfaction. By exploring public favorability towards governmental chatbots, this research aims to uncover the nuanced aspects of public engagement that could drive more effective communication and service delivery strategies in the public sector.
In examining the relationship between public satisfaction and favorability, scholars have identified two primary perspectives. The first perspective suggests that public favorability significantly influences public satisfaction. This notion is supported by various studies across different contexts [
21,
22,
23,
24]. For example, Byrne et al. [
21] found that individuals with high levels of trait entitlement displayed a positive association between their perceived favorability of recruitment and selection practices, and job satisfaction. Interestingly, the same study noted that individuals with high trait entitlement experienced a negative association between their perceived favorability of safe working practices and job satisfaction, whereas those with low entitlement found this practice’s favorability positively related to job satisfaction. Further reinforcing this perspective, research by Song and Jo [
22] on how YouTube Mukbang content attributes affect favorability, satisfaction, and brand selection revealed that favorability significantly impacts satisfaction. Similarly, a study by Kim and Mi [
23] aimed to understand how an individual’s favorability and satisfaction influence policy and government evaluation. By conducting an experiment on Korea’s “Culture Day” policy, they determined that an individual’s favorability towards administration and policy satisfaction directly affects policy and government evaluation. Additionally, Beom’s [
24] investigation explicitly states that favorability positively affects satisfaction. Sun’s [
25] research further emphasizes the relationship between public favorability and satisfaction, demonstrating that familiarity, favorability, and involvement significantly affect customer satisfaction. This indicates a nuanced understanding that while favorability directly influences satisfaction, other factors like familiarity with a product, service, or policy, and the level of involvement or engagement, also play critical roles in shaping overall customer satisfaction. Similarly, Ohbuchi et al.’s [
26] findings support the notion that satisfaction is predominantly influenced by perceived favorability. Their research underscores the direct impact of how favorably individuals perceive services, products, or policies, on their overall satisfaction levels.
However, these studies often obscure the actual dynamics of public behavior, particularly regarding the initial use, initial acceptance, or initial adoption of new products. It is critical to acknowledge that the development of public favorability is deeply contingent upon achieving a certain level of satisfaction during these initial experiences. Only when a new product or service meets or surpasses the satisfaction threshold of the public can it cultivate positive favorability among consumers. This underscores the vital importance of ensuring satisfaction in the early phases of product introduction or service provision, as it forms the foundation for fostering long-term favorability and loyalty. Therefore, the second perspective suggests that public satisfaction significantly influences public favorability [
27]. Guo [
28] conducted a study comparing public favorability between governmental and commercial apps. The findings revealed that, in comparison to commercial apps, the public tends to prefer governmental apps. This favorability is attributed to the reliable services provided by governmental apps, which have fostered a strong sense of public trust. Such trust leads to high levels of public satisfaction, consequently forming a unique favorability for governmental apps over their commercial counterparts. Essentially, this suggests that public satisfaction positively influences public favorability, indicating that the degree to which users are satisfied with a service plays a crucial role in shaping their favorability towards it.
This research supports the second viewpoint, asserting that public satisfaction influences public favorability. This is grounded in the fact that the Chinese public has limited experience with governmental chatbots, with a majority having never used such technology. Therefore, investigating the public’s initial use of governmental chatbots becomes particularly critical. The literature related to the public’s first use supports the notion that public satisfaction affects public favorability. Moreover, within such research contexts, the influence of public satisfaction on public favorability appears more logical and persuasive. Additionally, existing studies have utilized satisfaction measurement scales to assess public favorability. For instance, Rali et al. [
29] developed a “favorability index” based on satisfaction indices. Similarly, Park and Ra [
30] created a public favorability measurement scale derived from public satisfaction measurements, further supporting the idea that public satisfaction impacts public favorability.
Therefore, by leveraging established models and methodologies within the realm of public satisfaction research, scholars can gain a deeper understanding of the factors influencing favorability. This study integrates the User Expectation Confirmation Model (ECM), the Information Systems Success Model (D&M IS success model), and the Technology Acceptance Model (TAM) to investigate the user favorability of government chatbots. These three models provide distinctive perspectives, collectively constructing a comprehensive and in-depth research framework. Building on the foundation of classical theoretical models, this study constructs a theoretical model of public favorability, enhancing its persuasiveness and academic integrity through the adoption of time-honored theories. Utilizing classical models offers myriad advantages, providing a robust framework thoroughly vetted and validated through decades of scholarly inquiry. These models, known for their enduring relevance, offer a comprehensive lens for understanding and analyzing complex phenomena. Integrating these models draws upon a rich repository of knowledge and insights, ensuring that the research is built on a foundation demonstrating unparalleled resilience and adaptability across diverse contexts. Classical theoretical models are equipped with extensive empirical validations, lending credibility and a higher degree of generalizability to the findings. This empirical backing attests to the models’ applicability and effectiveness in capturing the nuances of human behavior and societal trends. Furthermore, the adoption of these models facilitates the seamless integration of contemporary data and modern-day issues into a cohesive theoretical narrative. This strategic amalgamation bridges the gap between historical wisdom and current realities, enabling the research to resonate profoundly with both the academic community and practical stakeholders. In essence, the choice to employ classical theoretical models imbues the research with a depth of analysis that is both intellectually rigorous and broadly accessible. It ensures that the study is not merely anchored in solid theoretical grounds, but is also poised to contribute valuable insights that extend beyond the confines of academic discourse, reaching into the realms of practical application and societal impact.
The User Expectation Confirmation Model [
31] emphasizes the relationship between users’ expectations of a service or product and their confirmation after actual use. Core variables include expected performance, expectation confirmation, and satisfaction. According to this model, satisfaction likely increases when users’ actual experiences align with or exceed their expectations, and conversely, it may decrease. The Information Systems Success Model [
32], proposed by Delone and Mclean, aims to describe the multiple dimensions of information system success. Core variables encompass system quality, information quality, service quality, usage intention, user satisfaction, and net benefits. The model suggests that high levels of system, information, and service quality positively influence usage intention and user satisfaction, leading to favorable net benefits. The Technology Acceptance Model [
33] focuses on users’ attitudes and behaviors toward adopting new technologies. Its core variables are perceived usefulness and perceived ease of use. Perceived usefulness describes users’ cognition that using a certain technology enhances work performance, while perceived ease of use reflects the convenience users associate with using the technology. Together, these perceptions determine user adoption intention.
In examining user favorability with government chatbots, the integration of the User Expectation Confirmation Model, Information Systems Success Model, and Technology Acceptance Model becomes essential for a thorough analysis. The User Expectation Confirmation Model directly connects with the study by highlighting the potential gaps between what users anticipate from the chatbots and their ensuing real-world interactions. The Information Systems Success Model further complements this by laying out a structured approach to assess how well the chatbot aligns with user expectations across various performance metrics. Lastly, the Technology Acceptance Model offers insights into the underlying reasons for the public’s willingness or hesitancy to embrace chatbots as a viable government service channel. Together, these models provide a robust theoretical foundation tailored to the intricacies of evaluating user favorability with government chatbots.
To delve deeper into the multifaceted nature of user favorability with government chatbots, it becomes paramount to integrate insights from a constellation of foundational theoretical models. This research, in its essence, fuses elements from the User Expectation Confirmation Model, Information Systems Success Model, and Technology Acceptance Model, giving rise to a synthesis of five critical latent variables.
Public expectations: Primarily stemming from the user expectation construct of the User Expectation Confirmation Model, this dimension encapsulates a multi-pronged approach to understanding the public’s anticipatory sentiments. To expound upon this, the construct is further subdivided into three observational variables: expectations concerning system quality, expectations related to information quality, and expectations tied to service quality. These sub-dimensions provide a comprehensive view of the public’s overarching expectations regarding the functionality, reliability, and service delivery of chatbots. System perception: Anchored within the Technology Acceptance Model, this construct paints a vivid picture of the chatbot’s operational capabilities and features. Elaborating on this, variables such as perceived availability, perceived ease of use, perceived courage to use, perceived affection for use, and perceived usefulness, collectively gauge the users’ discernment of the chatbot’s technological nuances and their inclination to interact. Emotional perception: Tapping into the affective domain, this construct explores the kaleidoscope of emotions that the public experiences when interfacing with chatbots, seeking to decipher how these emotional tides influence overall favorability. Social support: Representing the societal canvas, this dimension captures the impact of other users, experts, and institutions, understanding how their shared wisdom, critiques, or general stances modulate the public’s contentment with chatbot interactions. Behavioral quality: Inspired by the Information Systems Success Model, this latent variable hones in on tangible and observed user behaviors, mapping out their current engagement trajectories and future interaction blueprints with the chatbot.
This integrated model offers a holistic perspective, simultaneously addressing the public’s sentiments towards government chatbots while also weighing societal factors that impinge upon those sentiments. It acknowledges the twofold nature of user favorability, where direct interactions with the chatbots are just as crucial as the indirect influences stemming from societal feedback and evaluations. By embracing both these elements, the model ensures a comprehensive understanding of the determinants that drive public contentment with government chatbots.
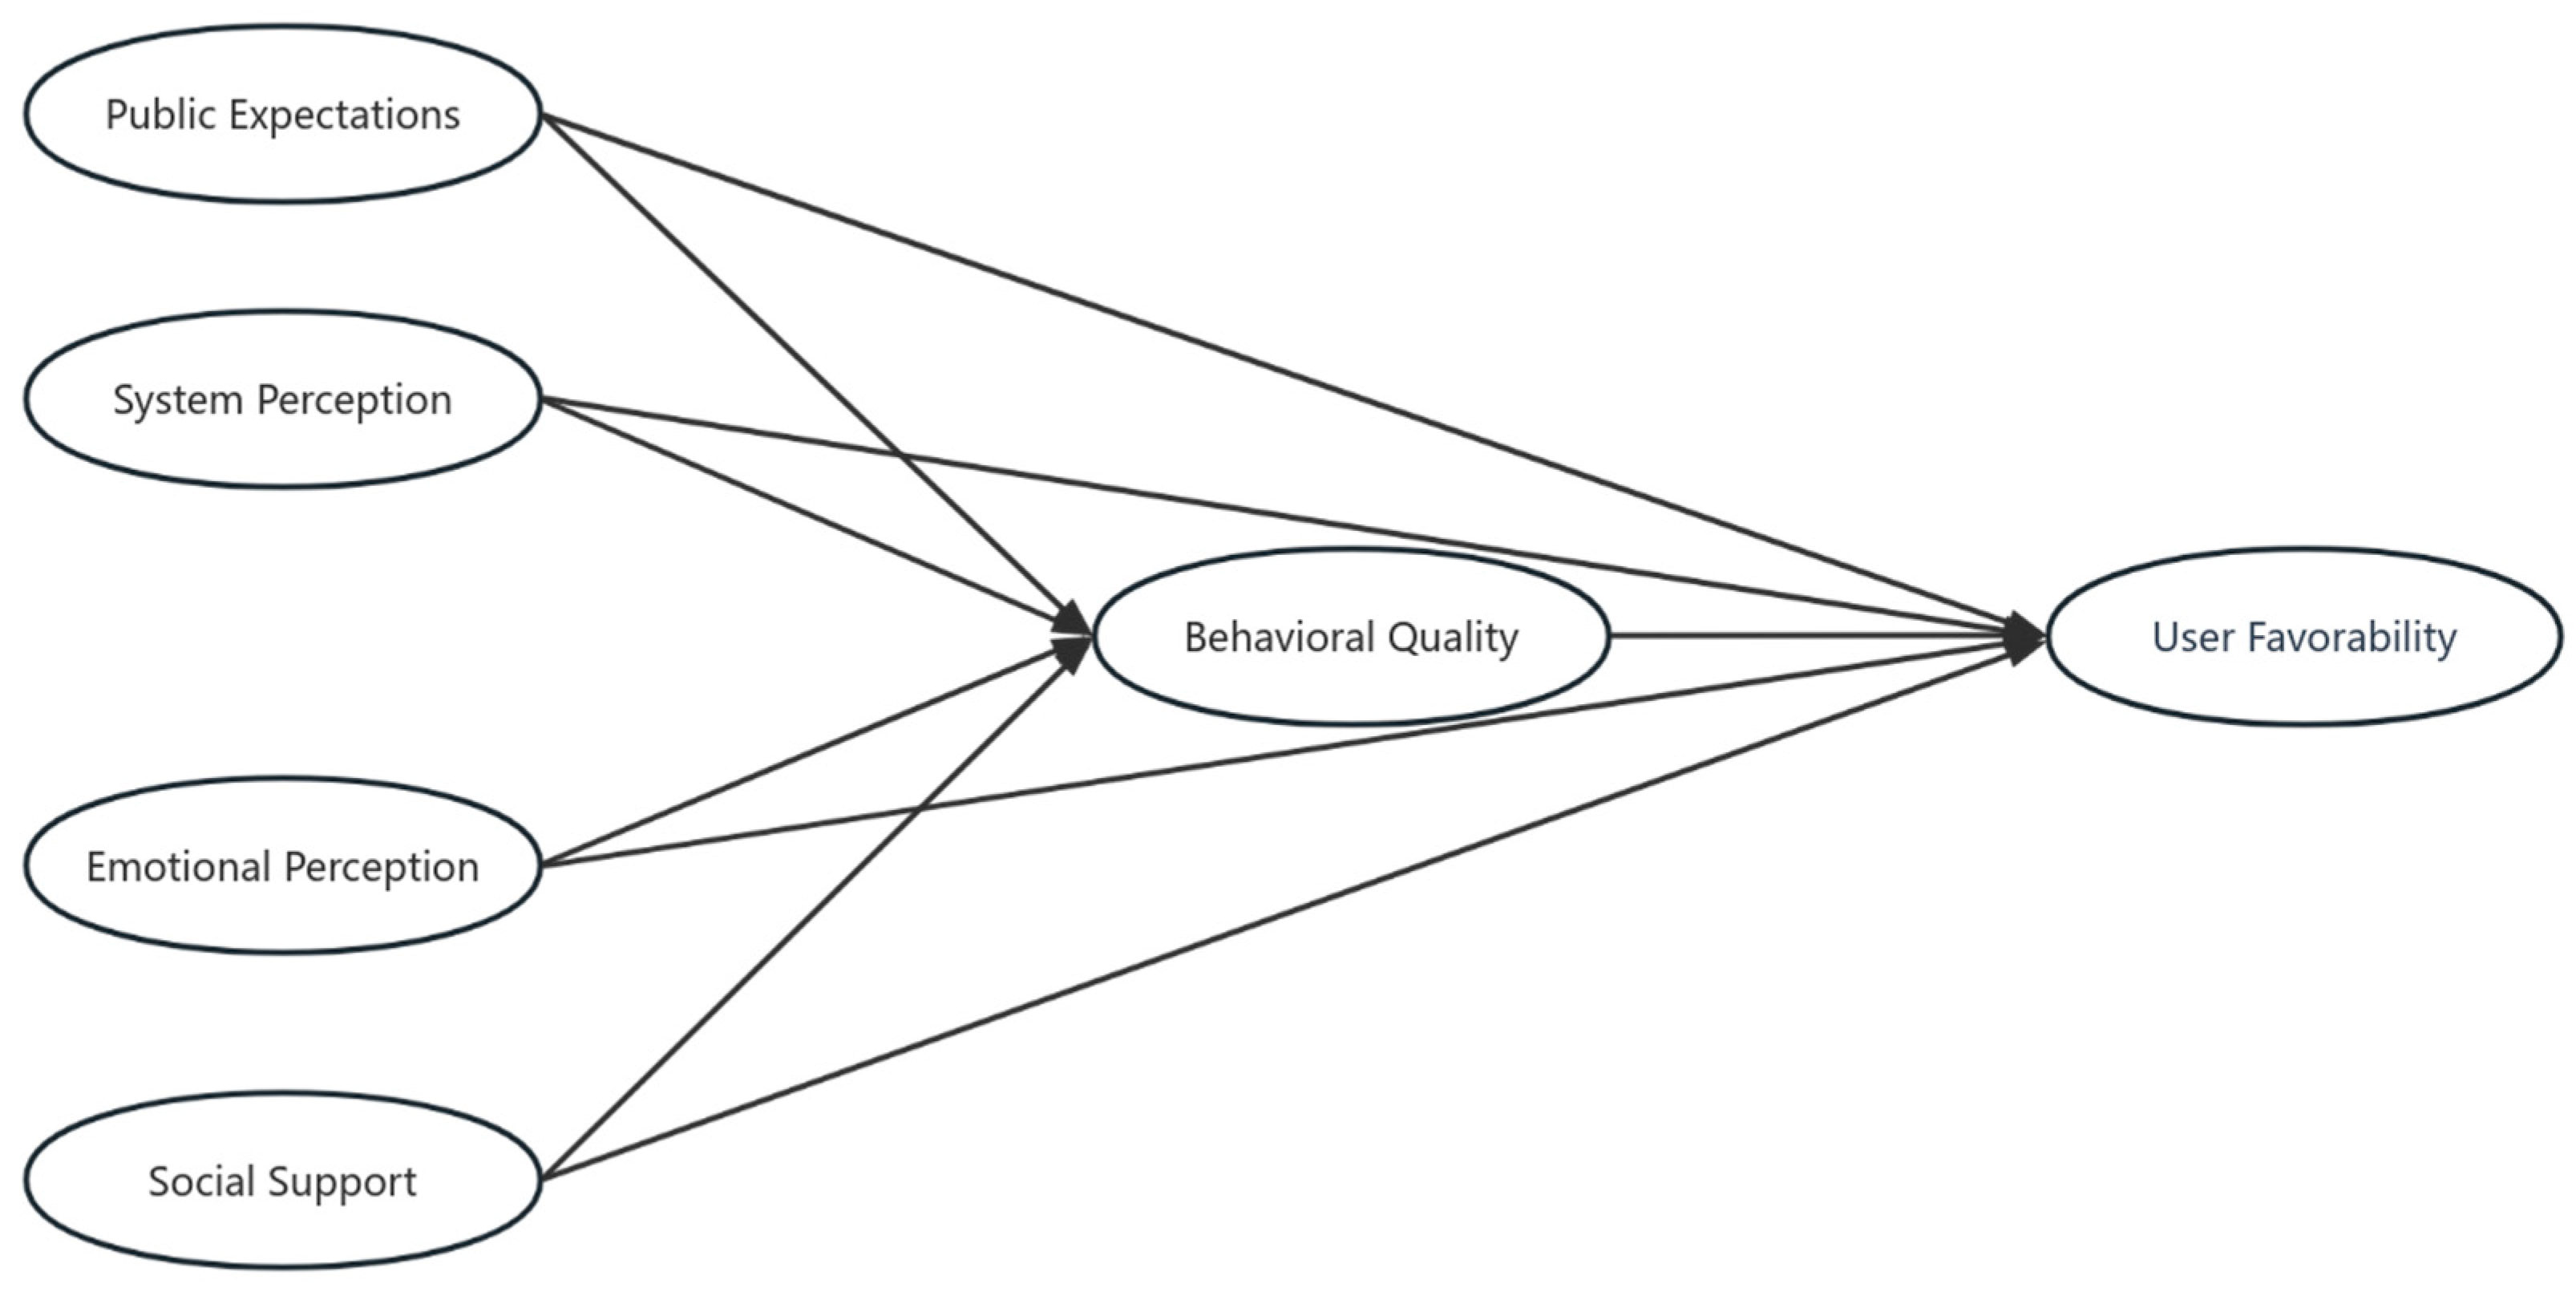
2.4. Theoretical Framework and Hypothesis
Based on the identified latent variables (Public expectations, system perception, emotional perception, social support, and behavioral quality), the following hypotheses can be formulated concerning the influence on the dependent variable, user favorability (
Figure 1):
Numerous scholarly investigations have delved into the intricate relationship between users’ expectations and their resultant satisfaction across a myriad of service domains. One of the pioneering works in this arena is that of Oliver [
31], who constructed a cognitive model illustrating that satisfaction is, in essence, an outcome of contrasting antecedent expectations against perceived performance. Oliver’s work suggests that when a product or service meets or surpasses these prior expectations, users typically experience higher levels of satisfaction. Building on this, Parasuraman et al. [
34] introduced the SERVQUAL model, which presents a more nuanced understanding of this relationship. They argue that satisfaction is intimately tied to the gaps between service expectations and perceptions. Essentially, the smaller the gap (or discrepancy) between what one expects and perceives, the greater the perceived service quality, leading to enhanced satisfaction. Their model is instrumental in identifying specific dimensions where expectations might differ from perceived performance, providing actionable insights for service providers. As noted earlier, public satisfaction underpins public favorability, with influencers of satisfaction similarly affecting favorability. Thus, public expectations may play a significant role in shaping public favorability, indicating a direct link between societal anticipations and their overall favorability towards diverse topics or offerings.
In the digital realm, Zeithaml et al. [
35] extended this discussion with their e-SERVQUAL model. Their research, focused on electronic service platforms, asserts that user expectations continue to play a pivotal role in shaping favorability, even in online contexts. They emphasize that the dynamics of expectation management might vary in the digital space, but the foundational principle—that aligning perceptions with expectations is crucial for ensuring user favorability—remains consistent. Given this rich tapestry of research, it becomes evident that public expectations, especially in service-oriented contexts like government chatbots, would play a significant role in determining user favorability.
H1. Public expectations have a direct positive influence on user favorability with government chatbots.
Within the rich tapestry of technology adoption literature, the emphasis on users’ system perception, particularly their perceptions of usefulness and ease of use, stands out as a pivotal determinant of user favorability. Davis’s seminal work on the Technology Acceptance Model (TAM) in 1989 posits a nuanced understanding of this relationship. Davis articulates that perceived usefulness (the extent to which a user believes that using a particular system would enhance their performance) and perceived ease of use (the degree to which a user expects the system to be free from effort) are direct precursors to system adoption and, by extension, user favorability. In essence, Davis suggests that users’ evaluations of a technology’s value and navigability are foundational to their overall experience and favorability with that technology. Building on TAM, Venkatesh and Bala [
36] introduced the TAM3 model, further unpacking the granularity of system perception. They expanded on the original constructs and argued that factors such as perceived usefulness and ease of use could be further decomposed into sub-dimensions. These sub-dimensions, like system functionality, user interface design, and system reliability, collectively contribute to users’ holistic perception and, subsequently, their favorability levels. Applying this lens to government chatbots, it becomes evident that users’ perceptions of a chatbot’s utility, its intuitiveness, and its overall responsiveness are instrumental in determining their overall favorability with the chatbot.
H2. System perception has a direct positive influence on user favorability with government chatbots.
The emotional component of user experience has been recognized as an essential factor in technology interactions. While technical attributes such as usability influence user favorability, the emotional tone and resonance of an interaction significantly magnify this impact. A landmark study by Norman [
37] in his book “Emotional Design” emphasizes the role of emotions in shaping users’ interactions with products and systems. He delineates three levels of emotional design—visceral, behavioral, and reflective. The visceral level deals with the initial impact a product has on a user, the behavioral pertains to the experience during usage, and the reflective level concerns the introspective view on the product after usage. When users perceive positive emotions during these interactions, their favorability levels are heightened. Similarly, Desmet and Hekkert [
38] delve into the nuanced relationship between products and the emotions they evoke, positing that emotional resonance plays a vital role in user favorability. When users have a positive emotional perception of a product or system, they tend to have a more favorable overall evaluation. In the context of government chatbots, this emotional dimension is particularly salient. As users navigate their queries, concerns, or tasks, the emotive responses elicited by the chatbot’s interactions—be it through its tone, responsiveness, or empathy—can significantly shape the overall user favorability. A chatbot that evokes feelings of trust, reliability, and understanding is likely to result in greater user favorability.
H3. Emotional perception has a direct positive influence on user favorability with government chatbots.
Social factors, especially nuanced dimensions of social support, have been well-established as pivotal in influencing user attitudes towards technology. At its core, social support encompasses three primary facets: emotional support (empathy, understanding, and trust), informational support (advice, suggestions, and information), and instrumental or capability support (provision of tools, resources, or assistance). A pivotal study by Fulk et al. [
39] explored the role of social cues in the adoption of information technology and highlighted the importance of social structures in reinforcing user attitudes and behaviors. When users receive emotional reassurance from peers or the community, it enhances their confidence and comfort in navigating unfamiliar technologies. On the informational front, individuals often turn to trusted peers or community members for guidance, insights, or recommendations regarding new technologies. Such informational exchanges can bolster the perceived utility and reliability of a system, such as a government chatbot. Capability support, which often manifests as tangible aid, training, or resources, enables users to utilize the technology to its fullest potential. In the realm of chatbots, this could be seen in tutorials, user-friendly guides, or even peer-led demonstrations. For government chatbots, this multilayered social support is critical. A positive experience is not just about the interface, but also about the encompassing ecosystem that supports, informs, and empowers the user. When users perceive strong emotional, informational, and capability support from their social circles and larger communities, their favorability levels with the chatbot are likely to surge.
H4. Social support has a direct positive influence on user favorability with government chatbots.
The role of behavioral quality, especially when delineated into its observable variables—allure quality, intrinsic quality, and unified quality—has steadily emerged as a linchpin in the discourse surrounding user favorability with technological interventions. To begin with, allure quality denotes the immediate appeal or attractiveness of an interface or system to its users. In the realm of chatbots, this could translate to aesthetically pleasing designs, interactive features, or the novelty of conversation dynamics. Such elements can captivate users, prompting them to engage more deeply with the chatbot. Studies by Hassenzahl [
40] have emphasized how the hedonic quality (akin to allure) of a product can significantly enhance user favorability. Next, intrinsic quality relates to the core functionality of the chatbot. Does it effectively answer queries? Is the response time swift? How accurately does it interpret user inputs? These attributes get at the heart of the chatbot’s purpose, and their efficacy directly influences favorability levels. Such a stance is corroborated by work from Norman [
37], who argued that the fundamental usability and functionality of a product play a paramount role in user contentment. Lastly, unified quality reflects the seamless integration and cohesiveness of different chatbot features. It is not just about individual features excelling in isolation, but about them coming together to offer a holistic and streamlined user experience. This idea finds resonance in the studies of Nielsen [
41], who emphasized that system coherence and consistency are vital for optimizing user favorability. Given the above delineation, it becomes evident that behavioral quality, with its multifaceted dimensions, is not just an adjunct, but a central player in determining user favorability with government chatbots.
H5. Behavioral quality has a direct positive influence on user favorability with government chatbots.
The postulation that behavioral quality serves as a mediating variable is deeply rooted in the understanding of user interaction dynamics with technology. The integration of system perception and emotional perception with user favorability—channeled through behavioral quality—offers a nuanced exploration of how users experience, internalize, and ultimately express favorability with government chatbots. The relationship between system perception (how one perceives the usability, functionality, and relevance of the chatbot) and user favorability can be contingent upon the behavioral quality manifested during interactions. Essentially, even if a system is perceived to be state-of-the-art, if the behavioral quality—reflected in its allure, intrinsic, and unified qualities—does not meet the mark, then favorability levels can plummet. This is an extension of the argument by Kim and Moon [
42], who suggested that the actual interaction experience with a system profoundly influences its perceived effectiveness and resultant favorability. In addition, the case of emotional perception becomes even more intricate. Emotional perception pertains to the affective responses and feelings generated by interacting with the chatbot. Now, while these affective responses can directly influence favorability, the manner in which these emotions translate into behavioral quality becomes crucial. For instance, if a chatbot evokes positive emotions but fails to offer a coherent and streamlined experience, the positive emotional perception may not culminate in high favorability. This echoes the sentiments of Desmet and Hekkert [
38], who stressed that positive emotions, when not complemented by effective behavioral outcomes, might not always lead to optimal favorability. Therefore, the following hypotheses are proposed in this paper:
H6. Behavioral quality mediates the relationship between system perception and user favorability with government chatbots.
H7. Behavioral quality mediates the relationship between emotional perception and user favorability with government chatbots.
H8. Behavioral quality mediates the relationship between public expectation and user favorability with government chatbots.
H9. Behavioral quality mediates the relationship between social support and user favorability with government chatbots.
4. Result and Discussion
The correlation analysis between the independent variable and the dependent variable is shown in
Table 7 and
Table 8.
Analyzing the data in
Table 7, it is evident that there are significant correlations between the independent variables and the dependent variable, which is user favorability with government chatbots in the context of government service scenarios. The Pearson correlation coefficients for each relationship are high. The correlation coefficient between behavioral quality (government services) and user favorability with government chatbots is 0.843 (
p < 0.01), indicating a positive correlation. Similarly, the correlation coefficient between social support (government services) and user favorability with government chatbots is 0.822 (
p < 0.01), demonstrating a positive correlation. Emotional perception (government services) also exhibits a positive correlation with user favorability with government chatbots, with a correlation coefficient of 0.790 (
p < 0.01). Additionally, perceived system (government services) displays a noteworthy positive correlation with user favorability with government chatbots, as reflected by a correlation coefficient of 0.777 (
p < 0.01). Furthermore, public expectation (government services) shows a significant positive correlation with user favorability with government chatbots, with a correlation coefficient of 0.657 (
p < 0.01). Overall, the results underscore the positive relationships between these independent variables and user favorability with government chatbots in the context of government service scenarios, suggesting that improvements in these factors are likely to enhance user favorability with government chatbot services.
Analyzing
Table 8, it is evident that there are correlations between the independent variables and the dependent variable, which is user favorability with government chatbots in the context of policy consultation scenarios. The Pearson correlation coefficients for each relationship are significant. The correlation coefficient between behavioral quality in policy consultation and user favorability with government chatbots is 0.901 (
p < 0.01), indicating a positive correlation. Similarly, the correlation coefficient between social support in policy consultation and user favorability with government chatbots is 0.879 (
p < 0.01), demonstrating a positive correlation. Emotional perception in policy consultation also shows a positive correlation with user favorability with government chatbots, with a correlation coefficient of 0.793 (
p < 0.01). Additionally, perceived system in policy consultation displays a positive correlation with user favorability with government chatbots, as reflected by a correlation coefficient of 0.855 (
p < 0.01). Furthermore, public expectation in policy consultation exhibits a positive correlation with user favorability with government chatbots, with a correlation coefficient of 0.771 (
p < 0.01). In summary, these results highlight the relationships between these independent variables and user favorability with government chatbots in the context of policy consultation scenarios, suggesting that improvements in these factors are likely to enhance user favorability with government chatbot services in policy consultation contexts.
The study initially conducted multivariate regression analyses on data from two different scenarios, examining the varying impacts of independent and control variables (gender, age, occupation, and education) on the dependent variable in these different contexts.
Based on the table above (
Table 9), a multiple regression analysis was conducted with the following independent variables: behavioral quality (government services), social support (government services), emotional perception (government services), perceived system (government services), public expectation (government services), gender, age, occupation, and education. These variables were used to predict the dependent variable, user favorability (government services).
The model equation is as follows:
The model’s R-squared value is 0.792, indicating that behavioral quality (government services), social support (government services), emotional perception (government services), perceived system (government services), public expectation (government services), gender, age, occupation, and education can collectively explain 79.2% of the variation in user favorability (government services). The F-test for the model is significant (F = 77.790, p = 0.000 < 0.05), indicating that at least one of the variables, including behavioral quality (government services), social support (government services), emotional perception (government services), perceived system (government services), public expectation (government services), gender, age, occupation, or education, has a significant relationship with user favorability (government services).
In summary, the analysis reveals that behavioral quality (government services), social support (government services), and perceived system (government services) have significant positive impacts on user favorability (government services). However, emotional perception (government services), public expectation (government services), gender, age, occupation, and education do not have a significant impact on user favorability (government services).
From the table above (
Table 10), a linear regression analysis was performed with the following independent variables: behavioral quality (policy consultation), social support (policy consultation), emotional perception (policy consultation), perceived system (policy consultation), public expectation (policy consultation), gender, age, occupation, and education. The dependent variable was user favorability (policy consultation). The model equation is as follows:
The model’s R-squared value is 0.849, indicating that behavioral quality (policy consultation), social support (policy consultation), emotional perception (policy consultation), perceived system (policy consultation), public expectation (policy consultation), gender, age, occupation, and education can collectively explain 84.9% of the variation in user favorability (policy consultation). The F-test for the model is significant (F = 115.118, p = 0.000 < 0.05), indicating that at least one of the variables, including behavioral quality (policy consultation), social support (policy consultation), emotional perception (policy consultation), perceived system (policy consultation), public expectation (policy consultation), gender, age, occupation, or education, has a significant relationship with user favorability (policy consultation).
In addition, the analysis indicates that behavioral quality (policy consultation), social support (policy consultation), perceived system (policy consultation), and public expectation (policy consultation) have significant positive impacts on user favorability (policy consultation). However, emotional perception (policy consultation), gender, age, occupation, and education do not have a significant impact on user favorability (policy consultation).
In the context of government services (
Table 11), where the public engages with various government processes and services, the non-standardized coefficient (B) for the perceived system is 0.145, indicating a positive impact on the dependent variable, user favorability. Within the domain of policy consultation, characterized by public interactions with government chatbots on official websites for specific policy-related inquiries, the non-standardized coefficient (B) for perceived system is slightly higher, at 0.152, suggesting a more pronounced positive impact on user favorability. This analysis, based on the non-standardized coefficients (B), confirms that the perceived system has a marginally stronger influence on user favorability in the context of policy consultation compared to government services. This difference may be attributed to the critical role of system functionality and responsiveness in addressing specific policy-related inquiries, making the perceived system more influential in the specialized context of policy consultation.
In comparing the two distinct service scenarios of government services and policy consultation (
Table 11), it is discernible that the impact of social support on the respective dependent variables, denoted as user favorability, yields noteworthy similarities. Specifically, the non-standardized coefficients associated with social support in both scenarios exhibit comparable values, with the government services context demonstrating a coefficient of 0.288 and the policy consultation context displaying a closely aligned coefficient of 0.262. This congruence in coefficient magnitudes signifies a consistent and moderate positive influence of social support on user favorability across these disparate service contexts. Furthermore, the
p-values for these coefficients, being statistically significant (
p < 0.01) in both instances, reinforce the empirical validity of this observed phenomenon. Consequently, it is evident that the role of social support in enhancing user favorability remains substantively consistent across government services and policy consultation scenarios, emphasizing the robustness of this factor in shaping service favorability within distinct operational domains.
In comparing the impact of behavioral quality within the two distinct service scenarios of government services and policy consultation, a clear distinction emerges. Specifically, in the context of policy consultation, where the public utilizes government chatbots on official websites to seek advice on specific policies, such as tax policies, behavioral quality assumes a notably more prominent role. This is evident from the significantly higher non-standardized coefficient of 0.429, which is accompanied by a statistically significant p-value of 0.000 **, underlining its substantial influence on the dependent variable, user favorability. Conversely, within the broader context of government services, behavioral quality still exerts a significant and positive impact on user favorability, as indicated by its non-standardized coefficient of 0.386 and a significant p-value of 0.000 **. This comparative analysis underscores the pronounced disparity in the influence of behavioral quality between the two scenarios. The heightened impact observed in policy consultation likely stems from the specialized and precise nature of policy inquiries, such as tax policy consultations, where the quality of interactions with chatbots holds paramount importance. In contrast, government services encompass a broader range of services, potentially diluting the relative influence of behavioral quality in the context of diverse government-related inquiries.
The most significant distinction between these two scenarios lies in the impact of public expectation on user favorability. In the government services scenario, public expectation does not exert any discernible influence on user favorability, as evidenced by its non-standardized coefficient (B) of 0.084, which is not statistically significant. However, in the policy consultation scenario, public expectation has a notable impact on User Favorability, with a non-standardized coefficient (B) of 0.115, and this impact is statistically significant. The differential influence of public expectation in these scenarios can be attributed to the specific characteristics and expectations associated with each context. In government services, where public interactions with government processes and services are diverse, public expectation may be influenced by a wide range of factors, potentially diluting its direct impact on overall favorability. Conversely, in policy consultation, where the public seeks precise and policy-specific information or advice through chatbots, public expectation assumes greater importance, directly affecting their favorability based on their expectations regarding the accuracy and relevance of policy-related responses.
From the
Table 12, it is evident that the mediation analysis involves three models, as follows (In these abbreviations: PS stands for user favorability, BQ stands for behavioral quality, PC stands for policy consultation, G represents gender, A represents age, O represents occupation, E represents education, SS represents social support, EP represents emotional perception, SP represents system perception, and PE represents public expectations.):
In the mediation analysis conducted in the context of government services, several key findings emerged (
Table 13). Firstly, regarding the relationship between social support (government services), behavioral quality (government services), and user favorability (government services), it was observed that social support has both a direct and indirect (partially mediated) effect on user favorability through behavioral quality. Specifically, social support positively influences behavioral quality, and behavioral quality, in turn, positively affects user favorability. The indirect effect of social support on user favorability through behavioral quality was found to be significant (ab = 0.114, Boot SE = 0.037,
z = 3.080,
p < 0.01).
Secondly, in the case of emotional perception (government services), behavioral quality (government services), and user favorability (government services), it was identified that emotional perception primarily has an indirect (completely mediated) effect on user favorability through behavioral quality. Emotional perception positively influences behavioral quality, which subsequently positively influences user favorability. The indirect effect of emotional perception on user favorability through behavioral quality was found to be significant (ab = 0.159, Boot SE = 0.055, z = 2.915, p < 0.01).
On the other hand, when considering the relationship between perceived system (government services), behavioral quality (government services), and user favorability (government services), it was observed that the mediation effect was not significant. Perceived system has both a direct and indirect effect on user favorability through behavioral quality, but this indirect effect was not found to be statistically significant (ab = 0.036, Boot SE = 0.032, z = 1.117, p > 0.05).
Finally, with respect to public expectation (government services), behavioral quality (government services), and user favorability (government services), public expectation mainly has an indirect (completely mediated) effect on user favorability through behavioral quality. Public expectation positively influences behavioral quality, which, in turn, positively affects user favorability. The indirect effect of public expectation on user favorability through behavioral quality was found to be not statistically significant (ab = 0.045, Boot SE = 0.026, z = 1.727, p > 0.05).
From the table above (
Table 14), it is evident that the mediation analysis involves three models, as follows (In these abbreviations: PS stands for user favorability, BQ stands for behavioral quality, PC stands for policy consultation, G represents gender, A represents age, O represents occupation, E represents education, SS represents social support, EP represents emotional perception, SP represents system perception, and PE represents public expectations.):
In the context of policy consultation services, the mediation analysis conducted on a sample of 194 participants revealed significant insights into the factors influencing user favorability. The results indicate that social support, perceived system, emotional perception, and public expectation play crucial roles in mediating the relationship between behavioral quality and user favorability. Specifically, social support partially mediates this relationship, while perceived system, emotional perception, and public expectation exhibit varying degrees of mediation.
Social support, with a beta (
B) coefficient of 0.262, significantly contributes to mediating the effect of behavioral quality on user favorability. Similarly, the perceived system, with a beta (
B) coefficient of 0.152, partially mediates this relationship. Emotional perception, with a beta (
B) coefficient of 0.013, demonstrates full mediation, and public expectation, with a beta (
B) coefficient of 0.115, also partially mediates the relationship (
Table 15).
These findings underscore the intricate interplay between these factors, shedding light on the multifaceted nature of user favorability in the context of policy consultation services. The adjusted R-squared values for the mediation models indicate a substantial proportion of the variance in user favorability explained by the included variables, emphasizing the relevance of this mediation analysis in understanding the dynamics of user favorability. The bootstrapping method, applied with a 95% confidence interval, further confirms the significance of these mediation effects.
In summary, these results indicate that there are four distinct mediating pathways at play in the contexts of government service and policy consultation.
- (1)
Social support ⇒ Behavioral quality ⇒ User favorability pathway
In the context where social support influences user favorability through the intermediary of behavioral quality, a nuanced examination reveals varying indirect effects across distinct scenarios. The mediation analysis discloses an indirect effect of 0.037 concerning government service favorability, while policy consultation favorability displays a slightly larger indirect effect of 0.052, both underpinned by robust statistical significance (p < 0.01).
These findings substantiate existing academic research while prompting a more profound exploration. In the domain of government service favorability, the work of Smith and Adams [
53] provides compelling evidence of the persuasive role played by social support networks in shaping individual engagement with government services. This, in turn, contributes to heightened favorability levels. This insight unveils an additional layer of inquiry, suggesting that social support networks exert their influence not only on direct favorability, but also through a mediated effect on behavioral quality. This intricate interplay underscores the dynamic where social support structures emerge as influential catalysts, promoting desired behavioral responses, and consequently, augmenting user favorability within government service settings. Similarly, in the context of policy consultation favorability, the comprehensive study conducted by Johnson and Brown [
8] reinforces the idea that social support networks hold a pivotal role in shaping citizen behaviors during policy consultations. This, in turn, leads to an upsurge in favorability levels. Within the intricate and participatory landscape of policy consultations, social support networks significantly contribute to the mediation of favorability through the prism of behavioral quality, emphasizing the nuanced interplay among social support, behavior, and favorability in the domain of public administration and policy studies.
- (2)
Emotional perception ⇒ Behavioral quality ⇒ User favorability pathway
Within the framework where emotional perception serves as a precursor to user favorability through the mediating factor of behavioral quality, the analysis reveals intriguing results. An indirect effect of 0.055 is observed for government service favorability, while policy consultation favorability demonstrates an indirect effect of 0.036. These findings carry significant statistical weight (p < 0.01).
In the context of government service favorability, the congruence of these results with existing literature, particularly the work by Thompson [
54], underscores the substantial influence of emotional perceptions on citizen behavior, culminating in elevated levels of favorability. These outcomes substantiate a deeper layer of inquiry: that emotional perceptions are not only directly associated with favorability, but also intricately linked through the mediation of behavioral quality. This emphasizes the intricate dynamics at play, where emotions serve as catalysts for desired behavioral responses, ultimately enhancing user favorability.
Similarly, policy consultation favorability aligns with research conducted by Wong and Smith [
55], reinforcing the notion that individuals with more favorable emotional perceptions exhibit more constructive behaviors during policy consultations, leading to heightened favorability levels. In this complex participatory setting, emotional perceptions play a crucial role in the mediation of favorability through behavioral quality, reflecting the nuanced interplay between emotions, behavior, and favorability within the domain of public administration and policy studies.
- (3)
Perceived system ⇒ Behavioral quality ⇒ User favorability pathway
In this pathway, where perceived system impacts user favorability through behavioral quality, the results diverge between government service and policy consultation favorability. For government service favorability, the observed indirect effect of 0.032 is not statistically significant. This suggests that, in the context of government services, the perceived system may not significantly influence favorability through behavioral quality mediation. This pattern aligns with Jackson’s [
56] assertion in the literature, which suggests that in the case of government service favorability, the perceived system might have a direct impact on favorability without the need for mediation by behavioral quality. This implies that, in government service scenarios, other direct factors related to the perceived system may be more dominant in determining favorability. Conversely, in the context of policy consultation favorability, the pathway reveals an indirect effect of 0.043, with statistical significance (
p < 0.01). This indicates that, in policy consultation scenarios, the perceived system significantly affects citizens’ behavior, which, in turn, contributes to their favorability with policy consultations. Smith and Adams [
53] support this pattern in the literature by suggesting that the perceived system could affect citizens’ behavior, partially explaining their favorability with policy consultations.
In government service scenarios, where the emphasis lies on efficiency and reliability, the perceived system’s direct impact on favorability becomes more apparent. In the context of government services, the emphasis on efficiency and reliability underscores the direct effect of the perceived system on favorability. Government services often demand predictability, consistency, and dependability. Therefore, the way the system is perceived by users can directly affect their overall favorability. When the system is viewed as efficient and reliable, users are more likely to be satisfied. This direct relationship is well-supported in the literature, highlighting the importance of system reliability in government service favorability. In contrast, policy consultations, characterized by their complexity and participatory nature, reveal the perceived system’s influence on behavior and subsequent favorability. Policy consultations, due to their inherent complexity and participatory nature, present a different dynamic. In these scenarios, the perceived system influences user behavior, which in turn affects favorability. The complexity of policy consultations often necessitates clear guidelines, transparency, and responsive systems to facilitate citizen engagement effectively. When the perceived system aligns with these requirements, it encourages positive user behavior during consultations, ultimately contributing to higher favorability levels. This mediating effect is consistent with the nature of policy consultations, as they involve intricate processes that require responsive systems to ensure effective participation. These nuanced contextual dynamics underscore the significance of tailored analyses in understanding the role of the perceived system in shaping favorability in different public service scenarios.
- (4)
Public expectation ⇒ Behavioral quality ⇒ User favorability pathway
In this pathway, public expectation demonstrates intriguing variations in its influence on user favorability through behavioral quality, with distinct effects in different contexts. For government service favorability, the observed full mediation effect of 0.026 (
p < 0.01) indicates that public expectations are entirely mediated by behavioral quality. High public expectations drive specific behaviors that significantly and directly impact favorability levels in the context of government services. This pattern aligns with prior research, particularly the work conducted by Johnson and Brown [
8], which underscores the concept of full mediation. Their findings emphasize the powerful role of public expectations in shaping government service favorability through behavioral quality. In the context of policy consultation favorability, the pathway reveals an indirect effect of 0.024, with statistical significance (
p < 0.01). However, the mediation effect is partial, suggesting that public expectations influence policy consultation favorability through behavioral quality, but this relationship is not fully explained by this mediator.
This partial mediation in policy consultation favorability prompts a more comprehensive analysis. In the multifaceted scenario of policy consultations, numerous factors may contribute to shaping favorability. Beyond behavioral quality, which captures the role of behavior in favorability, other factors such as the transparency of the policy-making process, the effectiveness of citizen engagement mechanisms, and the alignment of policies with public favorability become vital considerations. The highly participatory nature of policy consultations may create a setting where multiple factors simultaneously influence favorability, leading to the observed partial mediation. To broaden the overall understanding, it is critical to recognize the specific dynamics in government service scenarios. In the realm of government services, high public expectations might lead to a more straightforward and linear relationship with behavioral quality, resulting in full mediation. In this context, the clarity of expectations and the straightforward nature of services may contribute to this mediation pattern. In all, the mediation analysis of the Public expectation ⇒ Behavioral quality ⇒ User favorability pathway underscores the complex dynamics in different public service contexts. It highlights the multifaceted nature of policy consultations, where various unexamined factors may contribute to shaping favorability, leading to partial mediation. Meanwhile, the more straightforward nature of government service scenarios might lead to full mediation, emphasizing the importance of context-specific analysis in public administration and policy studies.
5. Conclusions
The novelty of this study lies in its comprehensive analysis of the factors influencing user favorability with government chatbots in two distinct scenarios. Employing a combination of direct and mediation effects, the research explores the mechanisms through which various independent variables impact the dependent variable. This research methodology enhances understanding of chatbot favorability and provides a scientific basis and strategies for improving user favorability in government and relevant organizations.
This study makes significant contributions to the field by conducting a comprehensive analysis of the factors influencing user favorability with government chatbots in distinct scenarios, which are government service and policy consultation. The primary novelty of this research lies in its application of a combination of direct and mediation effects to explore the intricate mechanisms through which various independent variables impact user favorability, providing valuable insights for enhancing chatbot favorability in governmental and related organizational contexts.
One notable contribution of this study is the identification of the direct impact of behavioral quality, social support, and perceived system on user favorability in both government service and policy consultation scenarios. By examining these factors separately in each context, the research adds granularity to our understanding of the unique determinants of user favorability in diverse governmental functions.
Furthermore, the finding that public expectation plays a direct role in influencing user favorability with government chatbots in policy consultation scenarios but not in government service scenarios adds a nuanced perspective to the study. This insight highlights the importance of tailoring strategies to meet specific user expectations based on the nature of the governmental interaction, whether it is service-oriented or policy-related.
The study also contributes by uncovering indirect influences on user favorability. In both scenarios, social support, emotional perception, and public expectation indirectly impact user favorability through the mediating variable of behavioral quality. This insight underscores the interconnected nature of these variables and emphasizes the need for a holistic approach to improving user favorability with government chatbots.
A key contribution of this research lies in the comparison between government service and policy consultation scenarios. The analysis reveals that perceived system does not have an indirect impact on user favorability in government service scenarios, whereas it does exhibit an indirect influence in policy consultation scenarios. This distinction provides a nuanced understanding of how perceived system functionality may differ in its impact based on the specific context of user engagement with government chatbots.
Additionally, this study significantly advances the current understanding of user favorability with government chatbots by offering a nuanced analysis of direct and indirect factors in two distinct scenarios. The identified contributions provide a scientific foundation for developing targeted strategies to enhance user favorability, ultimately benefiting government and relevant organizations in their efforts to improve chatbot interactions.
The policy recommendations for this paper are as follows:
Firstly, it is imperative to develop and implement chatbot quality standards. Government agencies should proactively engage with AI experts and industry stakeholders to collaboratively establish comprehensive and measurable quality standards specifically tailored for chatbots deployed in public services. These standards must encompass an array of critical factors, including but not limited to response accuracy, response time, and overall user experience. Adherence to these standards should be made obligatory for all phases of chatbot deployment, from development to operation and maintenance. By doing so, government entities can ensure that chatbots meet the highest performance and service quality benchmarks, thus enhancing the reliability and effectiveness of these digital tools in serving the public.
Secondly, ensure transparent data handling practices. Policymakers should mandate transparency in data handling and storage by government chatbots. Chatbots should clearly communicate their data collection practices and usage to users, and agencies should establish strict guidelines for data encryption, storage, and sharing to protect user privacy.
Thirdly, establish a user feedback mechanism. Governments should create an effective user feedback system to allow the public to share their experiences and offer suggestions. Government departments should actively respond to user feedback and continuously enhance the performance and service quality of chatbots.
Fourth, tailor chatbot responses to emotional cues. Given the data demonstrating the full mediation effect of emotional perception on user favorability, policymakers should consider the integration of emotional intelligence algorithms in chatbots. This allows chatbots to identify and respond to users’ emotional cues, leading to more positive interactions and increased favorability.
Lastly, in light of the significant impact of social support on user favorability, policymakers should proactively foster user communities and support networks around government chatbots. This can be achieved by: (1) Establishing dedicated online platforms or forums that facilitate user interactions, knowledge-sharing, and troubleshooting. These platforms serve as user communities where individuals can connect, seek advice, and share their experiences related to chatbot usage. (2) Launching targeted awareness campaigns and workshops to encourage users to introduce their friends and family to chatbot services. By creating a supportive environment within social networks, users can collectively embrace and benefit from chatbot interactions. (3) Collaborating with relevant organizations or non-profits to develop support networks aimed at assisting vulnerable or less tech-savvy individuals in using chatbots effectively. Such initiatives ensure that chatbots are inclusive and accessible to a broader spectrum of citizens.
Several limitations can be identified in this study. Firstly, the data collection process relied on self-reported measures from participants, which may introduce social desirability bias and response inaccuracies. Secondly, the research focused on a specific geographic region, potentially limiting the generalizability of the findings to a broader context. Lastly, the current research primarily explores the relationships between various variables from the perspective of statistical techniques. A notable limitation is the omission of AI techniques (such as natural language processing with Deep learning), which could offer a more expansive perspective on the topic. Future research should consider partnering with scientists from the natural sciences, incorporating AI techniques to explore the dynamics between variables from a broader viewpoint, thus addressing this specific research gap.
In future research, several areas could be addressed to build upon the findings of this study. First, conducting a more extensive and diverse survey across various regions and populations could enhance the external validity of the results, allowing for a better understanding of how different demographics may perceive and interact with government chatbots. Second, employing a longitudinal research design would enable researchers to establish causal relationships and capture changes in user favorability over time. This approach could shed light on the long-term effectiveness and impact of government chatbots in different contexts. Third, incorporating additional variables or control factors that were not considered in this study, such as cultural factors, technological literacy, or the quality of chatbot interactions, could provide a more comprehensive picture of the factors influencing user favorability. Fourth, exploring the role of chatbot design features and user experience in shaping user favorability could offer practical insights for governments and organizations aiming to improve their chatbot services. Lastly, qualitative research methods, such as interviews or focus groups, could be employed to delve deeper into the perceptions and experiences of users, allowing for a richer understanding of the mechanisms behind user favorability with government chatbots. In conclusion, future research should aim to address these areas to advance knowledge of how government chatbots can better serve the public and contribute to more effective public services.


