Abstract
Service-oriented third-party e-commerce platforms have emerged as a new trend in the manufacturing industry. This paper aims to investigate the platforms’ value-added service (VAS) and charging strategies with a dynamic evolution analysis. Considering the change in the user numbers and characteristics of the e-commerce industry, this paper proposes a system dynamics model composed of multi-value chains and a third-party e-commerce platform. The simulation results indicate that the platform should reduce VAS investment and appropriately increase the VAS fee in the early development period. After the number of users stabilizes, the platform should appropriately increase its VAS investment and reduce the VAS fee. When the VAS fee is low, the platform profit first increases and then decreases as the VAS level increases. Differently, the platform profit will first decrease, then increase, and finally decrease as the VAS level improves when the VAS fee is low. This paper further finds that the strong cross-network effect of manufacturers is not always beneficial to the platform.
1. Introduction
As information technology has developed rapidly in recent years, third-party e-commerce platforms in the manufacturing industry [1,2], such as MFG.com in the US [3], SAP Ariba in Germany [4], CASICloud [5], and DHgate.com [6] in China, have become an effective approach for enterprises’ cooperation [7]. These platforms reduce the time and geographical restrictions of traditional production cooperation, thus significantly reducing enterprises’ transaction costs and improving market transaction efficiency [5]. Hence, many manufacturers and suppliers are attracted to join the platform for business collaboration, thus forming a multi-value chain system, which is significant to the manufacturing industry. In order to help enterprises make deals, these platforms provide suppliers and manufacturers on the platform with basic services such as information interaction, supply and demand matching, and transaction management. Furthermore, some platforms offer a value-added service (VAS) to suppliers to increase the cohesiveness of user and platform revenue [8]. For example, CASICloud and DHgate.com provide website recommendations and search sorting optimization services for suppliers. Compared with the suppliers who do not purchase a VAS (called ordinary suppliers), the suppliers who purchase a VAS (called member suppliers) have more opportunities to present their products and can obtain more access to the product orders of manufacturers.
By investing in a VAS, the platform can attract more ordinary suppliers to purchase a VAS and gain more revenue. However, that simultaneously generates additional costs, such as the salaries of technical personnel, the purchase of servers, etc. If VAS investment has little effect on increasing the platform revenue but involves a high cost, it will reduce the platform profit. Since there are three types of users on the platform, i.e., manufacturers, member suppliers, and ordinary suppliers, the platform revenue from VASs is affected not only by the number of member suppliers but also by the number of ordinary suppliers and manufacturers on the platform. However, the development of the platform is a dynamic evolution process. By joining the platform, manufacturers and suppliers can attract and influence each other through cross-network effects [9,10]. After joining the platform, an ordinary supplier decides whether to purchase a VAS and become a member supplier. The numbers of the three types of users on the platform will change with time, which makes the VAS and charging strategies of platforms complicated. Thus, it is necessary to explore the impact of VAS and charging strategies on platform profit via a dynamic evolution analysis.
In view of the above discussion, the following research questions are raised.
(1) How does the third-party e-commerce platform dynamically invest in the VAS level and set VAS fees?
(2) How do the VAS level and charging strategies together affect the profit of the third-party e-commerce platform dynamically?
(3) How does the cross-network effect of manufacturers and suppliers dynamically affect the platform’s VAS level, charging strategies, and profit?
On the basis of the above, this study takes a multi-value chain system consisting of manufacturers, suppliers, and a third-party e-commerce platform as the research object. Considering that the system dynamics could characterize the overall view and dynamic phenomenon of a multi-value chain system [11,12,13], this paper analyzes the evolution features of the platform VAS and charging strategies via a system dynamics model and provides management implications about VAS investment and charging strategies for the third-party e-commerce platform in dynamic development in order to realize the platform’s healthy development.
The remainder of this paper is organized as follows. A literature review is conducted in Section 2. The problem description is presented in Section 3. In Section 4, a system dynamics model is established, and the platform VAS and charging strategies are simulated and analyzed in Section 5. Finally, in Section 6, we summarize the main conclusions of this study.
2. Literature Review
Two streams of the literature are closely related to this study. The first is the research related to third-party e-commerce platforms for manufacturing, and the other is about the VAS and charging strategies of platforms.
In terms of third-party e-commerce platforms for manufacturing development in recent years, some scholars have begun to focus on the platforms during their early development, such as their framework and architecture [14,15], enabling technology [16,17], and typical applications [18,19]. Other scholars concentrate on the operation strategies for these platforms during their development process, which is more related to this paper. For example, Bakos and Katsamakas [20] examined the impact of platform investment on the level of network effects and constructed a model to describe the platform’s pricing in two-sided networks. They found that under certain assumptions about the available technologies, investment on the level of network effects is highly asymmetrically independent of its ownership structure. Laili et al. [21] considered user interaction in manufacturing tasks, established a comprehensive model for the optimal allocation of manufacturing resources (OACR) on the platform, and designed a new improved niche immune algorithm (NIA). Their results revealed NIA’s high performance in addressing the OACR problem compared with other intelligent algorithms. Combining the characteristics of the resource allocation in the platform for manufacturing, Zhou and Yao [22] explored the resource optimal allocation strategy of a platform, proposed a multi-objective hybrid artificial bee colony (MOHABC) algorithm for service composition and optimal selection (SCOS) in cloud manufacturing, and found that the algorithm outperforms other algorithms. Pan et al. [23] considered the heterogeneity of suppliers’ willingness to receive orders on a platform, analyzed the pricing and capacity allocation strategies for the platform, and obtained the optimal pricing strategy and the optimal allocation results when the platform’s profit is maximized. The above literature mainly focuses on the pricing and optimal resource allocation for a manufacturing platform. Only a few academics have paid attention to the service investment strategy of these platforms [3,4]. Chen et al. [3] considered the influence of the matching service investment of manufacturing platforms on market demand. They characterized the manufacturing resource sharing between enterprises using a two-stage differential game model, and platforms’ optimum matching service investment was investigated, finding that the matching service investments of supplier, platform, and demander under a cost-sharing contract are higher than those under a decentralized supply chain but lower than those under a centralized supply chain. Basu et al. [4] considered users’ heterogeneity and analyzed the price of the search and authentication service of platforms for manufacturing, such as SAP Ariba. They found that the complementarity of platforms’ optimal pricing for search and authentication services could justify offering an authentication service as a loss leader, and higher-quality authentication services may not always justify higher authentication fees. Guo et al. [24] took sharing platforms as examples, considered the impact of manufacturers’ equipment sharing models on platforms’ value-added service investment strategies, and investigated whether platforms should invest in value-added services under different equipment sharing models. They found that the platforms’ VAS investment affected the manufacturers’ choice of equipment sharing mode and rental price, and the platforms’ investment in VASs increases the profits of both the manufacturer and platform. However, the literature mentioned above mainly discusses the service investment of platforms when the number of users is fixed rather than dynamically changing. In contrast, this paper considers the change in user numbers during the development process of platforms for manufacturing and analyzes the VAS and charging strategies of the platform via a dynamic evolution analysis.
Another related stream of the literature is the research on VAS and charging strategies for platforms. As information technology has developed rapidly in recent years, consumption and service platforms have developed rapidly and gradually become an essential form of resource sharing. The issue of the platforms that provide VASs has also spurred considerable discussion in academia [25,26,27,28,29,30]. Relevant studies mostly focus on platforms’ investment in VASs for demanders. For example, Anderson et al. [25] considered the positive impact of platform investment on the utility of demanders and explored the investment of platforms. They found that when the cross-network effect of bilateral users is strong, a large amount of platform investment might not result in a competitive advantage. Dukes and Liu [26] took the search value-added service of platforms as an example, considering that platforms’ VAS investment could reduce the evaluation cost of customers and investigate the VAS design of platforms. They found that the equilibrium VASs embed sufficiently high search costs to prevent consumers from evaluating too many sellers but not too high to cause them to evaluate sellers’ products at partial depth. Liu et al. [27] took Uber and Lyft as examples, considered platforms charging additional VAS fees from customers who purchased a VAS, and analyzed the impact of VASs and matching capabilities on platforms’ charging strategies. They found that VAS investment always benefits the platform, and the platform should set higher prices for basic and total services when investing in VASs. Gui et al. [28] considered three types of user expectations, such as responsive, passive, and wary. They investigated the impact of platforms’ bilateral user expectations and expectation preferences on platforms’ optimal VAS investment and pricing decisions. Their results showed that the proportion of wary users to all uninformed users increases the platform’s VAS investment, profits, and the price of informed users, and it increases (decreases) the price of uninformed users when the cross-network externalities of informed users are relatively small (larger). Only a few studies focus on platforms that provide VASs for suppliers. Considering the negative network effect between suppliers, Tan et al. [29] considered that VASs could lower suppliers’ service costs and explored the platform’s VAS and charging strategies in the case of a monopoly. They found that VAS investments must be well coordinated with pricing decisions made for both sides of the platform. Higher levels of investment become desirable when the platform has access to a large pool of content providers and consumers, as this effectively helps reduce third-party development costs through VASs, and operates in a market where content providers earn a high enough profit. Sui et al. [30] investigated differences in bilateral value-added services and pricing strategies between two competing platforms, considering the impact of value-added service investment costs and network effects. They found that platforms with low marginal investing costs offer a higher VAS level to their bilateral users but may charge them less. The platform always charges suppliers more after investing in VASs but may charge manufacturers less or subsidize them more. The above studies primarily aim at the platforms of the consuming or service industry, and they investigate the impact of VASs on enterprises or consumers in general buyer–seller relationships. However, e-commerce platforms for manufacturing mainly serve the manufacturing industry. Manufacturers cooperate with suppliers for product manufacturing, and suppliers purchase VASs to obtain more orders for parts. Therefore, unlike the above literature, this paper considers the supporting production relationships between manufacturers and suppliers on these platforms. Then, we analyze the influence of VASs on the matching between manufacturers and suppliers and investigate the VAS and charging strategies for the platform.
3. Problem Description
This paper considers a multi-value chain system consisting of product manufacturers (hereafter called “manufacturer”), parts suppliers (hereafter called “supplier”), and a third-party e-commerce platform for manufacturing (hereafter called “platform”). For buying or selling parts on the platform, manufacturers and suppliers attract each other to access the platform and pay access fees and to the platform, respectively. The platform provides manufacturers and suppliers with basic services to help them make deals. Moreover, to pursue higher revenue, the platform will provide suppliers who purchase VASs (hereafter called “member supplier”) with the value-added service (VAS) at level and charge a VAS fee . After joining the platform, suppliers decide whether to purchase VASs based on profit. Compared with the suppliers who do not purchase VASs (hereinafter referred to as “ordinary suppliers”), member suppliers can obtain additional product presentation opportunities and manufacturers’ part orders more efficiently. If the VAS level is higher, member suppliers will obtain more opportunities for presentation.
In the research problem of this paper, the demand for a manufacturer’s parts depends on its product order ; that is, a manufacturer needs to purchase essential parts to produce one product. The price of parts is exogenous, and we do not consider the capacity limitations and product differences of suppliers. Considering the heterogeneity of different enterprises’ production and operation efficiency, and referring to the studies of Li and Jhang-Li [31] and Li and Scheller-Wolf [32], we assume that the production cost of suppliers is uniformly distributed in . Similar to the study of Hagiu and Spulber [33], we assume that the cost paid by the platform when investing in VASs is a convex quadratic function , where is the platform’s VAS investment cost coefficient.
In view of the above description, the following model’s assumptions are raised.
(1) Considering that there are basic quality requirements for the same type of general parts in the market, the same type of general parts produced by different suppliers should meet basic quality requirements, so we assume that the products of the suppliers are homogeneous and the order requirements of the manufacturers are homogeneous on the platform.
(2) We consider that platforms typically do not treat manufacturers that purchase the same type of product and suppliers that produce the same type of product differently. At the same time, the access fee is a long-term decision for the platform and the platform does not dynamically adjust it, so we assume that the platform charges the same access fee to all suppliers, the same access fee to all manufacturers, and that the platform’s access fee is exogenous.
(3) Considering that the suppliers on the platform provide the same type of products, there is no price difference between the different suppliers’ parts, so we assume that the price of the suppliers’ parts on the platform is exogenous.
4. Model Establishment
For studying platforms’ VAS and charging strategies from an angle of dynamic evolution, we first identified and analyzed how the manufacturers, suppliers, and the platform in the multi-value chain system affect each other. Then, we selected the key variables and identified their causality. On this basis, a causal diagram of the system dynamic was plotted. Further, referring to the logical relationships among variables, quantitative formulas were established.
4.1. System Dynamics Diagram
The multi-value chains of the third-platform e-commerce platform for manufacturing are classified based on the platform’s network business model. The platform business network model includes multiple suppliers and demanders [34]. The model can be regarded as an elastic and complex adaptive system, which forms a feedback loop through business association and value creation, forming a multi-value chain system of the platform [35]. Therefore, we applied the system dynamics theory to distinguish the multi-value relationship chain among the platform, suppliers, and manufacturers from the key partners, customer segments, strategic resources, value proposition, key processes, cost structure, and revenue streams of the platform business model [36]. The key partners of a third-party e-commerce platform are the suppliers of different types of parts, such as engines, clutches, and running lights utilized in the automotive field. The customer segments of a third-party e-commerce platform are different types of manufacturers, such as Toyota, Volkswagen, BYD, Zotye, and other automobile manufacturers in the automotive field. The strategic resources of a third-party e-commerce platform are basic services such as supply and demand matching and transaction management, as well as value-added services such as search ranking and website recommendations. The value proposition of a third-party e-commerce platform is to match suppliers’ products with manufacturers’ demand efficiently and quickly. The key processes of a third-party e-commerce platform are value-added service investment and transaction processes for parts. The cost structure of a third-party e-commerce platform involves value-added service investment costs. The revenue streams of a third-party e-commerce platform are suppliers’ access fees, manufacturers’ access fees, and value-added service fees. Based on the business model of the third-party e-commerce platform, we created a multi-value chain system, as shown in Figure 1. Manufacturers release the demand information of parts on the platform, and suppliers compete with each other to obtain orders for these parts. For the advantages of resource integration, the platform provides all users with basic services. It also provides VASs only for the member suppliers to increase their opportunities to display parts.
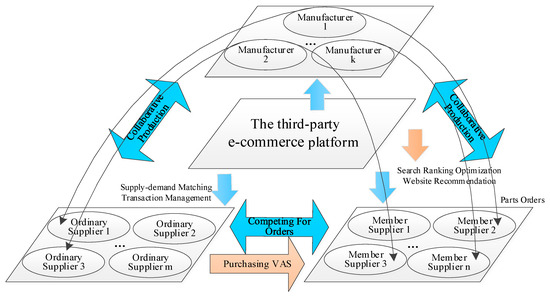
Figure 1.
Multi-value chain system based on the third-party e-commerce platform.
The platform is considered the system’s boundary; thus, we plot the system dynamics diagram when the platform offers the VASs, as Figure 2 presents. “” suggests the causality of two variables, and ““ (“”) reveals that the relationship is positive (negative). The critical evolution paths of variables in the system are presented as follows:
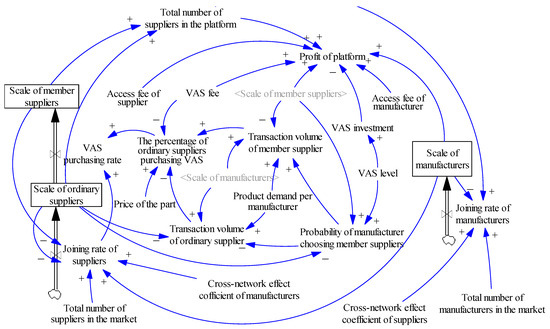
Figure 2.
SD diagram of the third-party e-commerce platform providing VAS.
- Total number of suppliers on the platform Joining rate of manufacturers Scale of manufacturers Joining rate of suppliers Scale of ordinary suppliers Scale of member suppliers Total number of suppliers on the platform
- Total number of suppliers on the platform Joining rate of suppliers Scale of ordinary suppliers Scale of member suppliers Total number of suppliers on the platform
- Scale of manufacturers Joining rate of suppliers Scale of ordinary suppliers Scale of member suppliers Total number of suppliers on the platform Joining rate of manufacturers Scale of manufacturers
- Scale of manufacturers Joining rate of manufacturers Scale of manufacturers
- VAS level Probability of manufacturer choosing member suppliers Transaction volume of member suppliers The percentage of ordinary suppliers purchasing VAS VAS purchasing rate Scale of member suppliers Profit of platform
- VAS level Probability of manufacturer choosing member suppliers Transaction volume of ordinary supplier The percentage of ordinary suppliers purchasing VAS VAS purchasing rate Scale of member suppliers Profit of platform
- VAS level VAS investment Profit of platform
4.2. Quantitative Formulations
The number of manufacturers joining the platform relates to the initial number and the joining rate of manufacturers . The state equation is the following:
The number of ordinary suppliers joining the platform relates to the initial number , the joining rate of suppliers , and the rate of ordinary suppliers purchasing VASs to become member suppliers . The scale of member suppliers depends on the initial number and . Accordingly, the state equation of ordinary suppliers and member suppliers can be obtained as follows:
The negative competition influence of manufacturers and the positive cross-network effect of suppliers would influence the joining rate of manufacturers (i.e., ), which can be expressed as Equation (4). represents the total number of manufacturers in the market, and is the cross-network effect coefficient of suppliers on manufacturers, which represents the influence of suppliers attracting manufacturers to join the platform.
The suppliers’ joining rate is affected by both the suppliers’ negative competition influence and the positive cross-network effect of manufacturers, which can be expressed as Equation (5). denotes the total number of suppliers in the market, and is the cross-network effect coefficient of manufacturers on suppliers, representing the influence of manufacturers attracting suppliers to join the platform.
The VAS provided by the platform enables the member suppliers to obtain additional opportunities to display their parts. It is more possible that manufacturers purchase parts from member suppliers when the level of VASs is higher. Therefore, we can express the probability that manufacturers trade with member suppliers as follows:
Note that is the coefficient that represents the impact of VASs on suppliers’ chance to display their products.
Then, given the time , the average product transaction volume of member suppliers and ordinary suppliers are expressed as follows, respectively:
After joining the platform, an ordinary supplier decides whether to purchase VASs to become a member supplier. The profit of a member supplier is , and the profit of an ordinary supplier is
. When , that is , then the ordinary suppliers will purchase VASs. Otherwise, when , that means , then the ordinary suppliers will not purchase VASs. Accordingly, we obtain , and the percentage of ordinary suppliers purchasing VASs at time can be obtained as follows.
The rate of ordinary suppliers purchasing VASs to become member suppliers is given as
The platform profit including the basic access fee and the VAS fee is expressed as
Symbols used in this paper are summarized in Table 1.

Table 1.
Summary of the symbols.
5. Simulation and Analysis
Vensim PLE is used to make monthly simulations based on the SD diagram and formulations in this section.
Referring to the data provided by the China Industrial Statistical Yearbook and the China Industry Information Network, we took the automobile manufacturing industry as an example and assumed that there are 500 automobile manufacturers and 15,000 auto parts suppliers. Analyzing China’s automobile production data from 2015 to 2019, we found that the average automobile production in China is about 27 million Autos/year. Thus, the average automobile production of each manufacturer is about 4500 Autos/month, and the automobile order for a manufacturer is 4500 Autos/(user × month). By querying automotive parts procurement platforms, such as the Tuhu and BeiMai platforms, we learned that an automobile requires about 50–100 major general parts, and the price range of major general parts is CNY 100–1000. Therefore, we set an automobile that requires 60 major general automotive parts, the price of an important general part is CNY 800, and the cost of an important general part is CNY 500–700. Referring to the actual situation of MFG.com and Global Sources, we set the initial number of manufacturers on the platform to be 10, the initial number of general suppliers to be 30, the initial number of member suppliers to be 50, the platform access fee for automobile manufacturers to be 1500 CNY/month, the platform access fee for parts suppliers to be 1500 CNY/month, and the range of VAS fees for the platform to be . We referred to Guo et al. [24] and Sui et al. [30] and assumed that the VAS investment level of the platform is . Therefore, the initial parameter settings are shown in Table 2.
Table 2.
Parameter settings.
5.1. Analysis of the VAS and Charging Strategies of the Platform
Referring to the fee structures of platforms such as MFG.com and Global Sources, we set the VAS fee at . To ensure the simulation results are in line with practice, we set the cross-network effect strength coefficients of manufacturers and suppliers at and , respectively, and the level of VASs to . Thus, we simulated the changes in the member supplier scale and the platform profit as time passes, presented in Figure 3. Then, Observation 1 is given to conclude the results of the simulation.
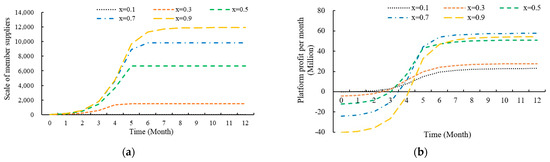
Figure 3.
(a) The scale of member suppliers at different VAS levels. (b) The platform profit per month at different VAS levels.
Observation 1(i). The improvement in the VAS level will increase member suppliers’ scale in the long run. When the VAS level is low, the improved service level can significantly increase the stable scale of member suppliers, whereas the marginal effect of the improved service level weakens as the VAS level improves.
(ii). During the early development period, the platform’s profit decreases with the VAS level improving, so it is better for the platform to implement a low level of VASs. After the scale of bilateral users stabilizes, it is better to improve the VAS level appropriately.
According to Observation 1(i), when the VAS level is low, an improvement in the VAS level can stimulate a larger number of ordinary suppliers to purchase VASs in the long run and significantly increase the platform’s profit. However, when the VAS level is high, since there are already a lot of member suppliers on the platform, the competitive advantage of member suppliers compared to ordinary suppliers is weakened. Therefore, the marginal effect of the VAS level improvement in attracting ordinary suppliers to purchase VASs decreases.
Observation 1(ii) shows that platform profit decreases with the improvement in the VAS level in the early development period. However, after the scale of bilateral users stabilizes, platform profit first increases and then decreases with the improvement in the VAS level. During the early development period, suppliers’ scale on the platform is small, leading to a low VAS revenue. Meanwhile, the higher level of VASs brings higher costs, resulting in a decrease in platform profit. After the number of manufacturers and suppliers stabilizes, there are a lot of suppliers on the platform. Then, the positive impact of the increasing number of member suppliers as a result of the improved VAS level is more significant than the adverse effect of the increasing costs, and the platform’s profit will improve accordingly. However, the platform profit decreases when the VAS level exceeds a certain threshold. This is because the marginal effect of the VAS level improvement on the scale of member suppliers gradually weakens, and the negative impact of increasing cost is more significant than the positive impact of the increasing member suppliers. Therefore, in the early period of platform development, choosing a low VAS level for cost-saving is more beneficial to the platform. After the scale of bilateral users stabilizes, the VAS level can be appropriately improved to attract more ordinary suppliers to purchase VASs.
For observing and analyzing the impact of platform VAS charging in different periods, to ensure the simulation results are in line with practice, we set , , and . We simulated the changes of the member suppliers’ scale and the platform profit over time, as shown in Figure 4. Accordingly, the VAS charging strategy of the platform in different periods is obtained in Observation 2.
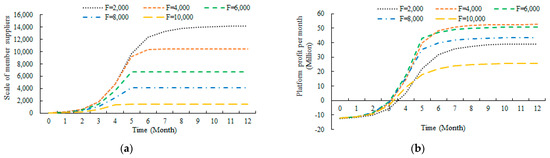
Figure 4.
(a) The scale of member suppliers at different VAS fees. (b) The platform profit per month at different VAS fees.
Observation 2. In the early period of platform development, charging a higher VAS fee is better. After the number of manufacturers and suppliers stabilizes, the platform should appropriately lower the VAS fee to encourage a larger number of ordinary suppliers to purchase it.
Observation 2 suggests that the reduced VAS fee can attract more ordinary suppliers to purchase it. Due to the small scale of users in the early stage, a reduction in the VAS fee has less impact on increasing the scale of member suppliers, so a higher VAS fee should be charged in the early period. After entering the mature stage, the platform has a large scale of users, so the platform should reduce the VAS fee.
Based on the above analysis, it is clear that the user scale and the platform’s profit per month increase in an S-shaped curve and tend to become steady gradually. To simultaneously analyze the influence of VAS and charging strategies in long-term returns, we valued the VAS level within the range of and the VAS fee within the range of . Under the conditions of and , we simulated the 12-month cumulative profit of the platform under different VAS and charging strategies, respectively. Figure 5 shows the relationship between the cumulative profit of the platform and different VAS levels and fees, and the corresponding analysis is summarized in the following observations.
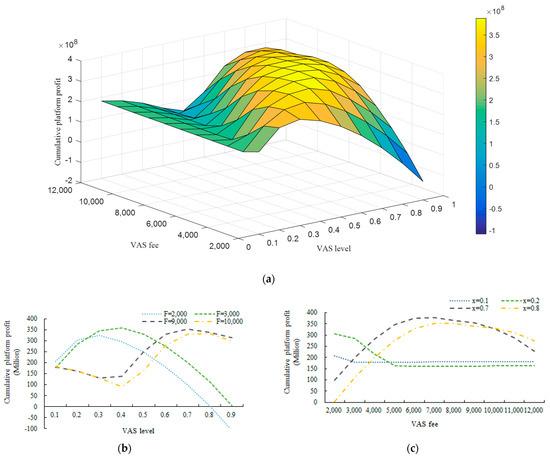
Figure 5.
(a) Cumulative platform profit under different VAS and charging strategies. (b) Cumulative platform profit under different VAS levels. (c) Cumulative platform profit under different VAS fees.
Observation 3. When the VAS fee is low, the cumulative platform profit improves first and then decreases with the VAS level improvement. However, when VASs are charged at a high level, the cumulative platform profit decreases at first and then increases, and finally, it decreases as the VAS level rises.
Observation 3 reveals that when the platform adopts different VAS charging strategies, improvement in the VAS level may influence the platform’s profit differently. When the VAS fee is low, the platform can increase the competitive advantage of member suppliers by appropriately improving the VAS level, and then it can stimulate more ordinary suppliers to purchase VASs and improve the income of the platform’s VASs. However, the marginal effect of the VAS level improvement on attracting ordinary suppliers to purchase VASs decreases. After the VAS level exceeds a certain threshold, the negative impact of high VAS cost exceeds the positive impact of increasing the member suppliers’ scale, and then the platform profit decreases. However, when VASs are charged at a high level, the cumulative platform profit decreases at first, then increases, and finally decreases with the VAS level improvement. This is because when the VAS level is low, the VASs bring less competitive advantage to member suppliers, while the platform charges a high VAS fee. At this time, the low-level VASs cannot attract ordinary suppliers. Therefore, improvement in the platform’s VAS level will lead to a decrease in platform profit. After the VAS level exceeds a certain threshold, the competitive advantage brought by VASs to member suppliers outweighs the negative impact of high VAS fees. Then, the VAS level improvement can attract more ordinary suppliers to purchase VASs and increase the platform’s profit. Since the marginal effect of the VAS investment increase on attracting ordinary suppliers to purchase VASs decreases, the negative impact of the high VAS cost will be more significant after the VAS level exceeds another threshold. As a result, the platform profit decreases again.
Therefore, when the VAS fee is low, it is better for the platform to appropriately improve the level of VASs to ensure that the positive impact of the member suppliers’ scale increase outweighs the adverse influence of increased cost. However, a slight increase in VAS investment will reduce profit when the platform charges a high VAS fee. The platform can attract more ordinary suppliers to purchase VASs if the VAS investment exceeds a specific range.
Observation 4. When the VAS level is low, the cumulative platform profit first decreases and then tends to become stable with the increase in the VAS fee. However, the cumulative platform profit increases at first and then decreases with the VAS fee increase when the VAS level is high.
From Observation 4, we can learn the impact of the VAS level on the platform charging strategy. When the VAS level is low, increasing the VAS fee will reduce the scale of member suppliers, and the positive impact of the increased VAS fee is less than the negative impact of the reduced member suppliers, which leads to a decrease in the platform profit. After the VAS fee exceeds a certain threshold, the platform can no longer attract ordinary suppliers to purchase VASs, and then the platform profit tends to remain stable. When the VAS level is high, the VASs bring a relatively strong competitive advantage to the member suppliers. An appropriate increase in the VAS fee has a small impact on the scale of member suppliers. Then, the positive impact of the VAS fee increase is greater than the negative impact of the reduced member suppliers, resulting in increased platform profit. However, after the VAS fee exceeds a certain threshold, the high VAS fee significantly reduces the scale of member suppliers and the negative impact of the reduced member suppliers’ scale is enhanced, so the platform profit decreases. Therefore, the platform should reduce the VAS fee to attract more ordinary suppliers to purchase it when VAS investment is low. When VAS investment is high, the platform should weigh the VAS fee and the member suppliers’ scale and appropriately increase the VAS fee.
5.2. The Impact of the Cross-Network Effect on the VAS and Charging Strategies
Because of the positive cross-network effect, bilateral users attract each other to join the platform. The strength of the cross-network effect will affect the joining rate, the scale of manufacturers and suppliers, and the VAS purchasing decision of ordinary suppliers. Hence, we analyzed the impact of the cross-network effect on the platform VAS and charging strategies in this section. To ensure that the simulation results are in line with practice, we set , , and values within , and we simulated the cumulative profit of the platform when the level of VASs is different and obtained the influence of the manufacturers’ cross-network effect on the platform VAS strategy, as shown in Figure 6a. Moreover, under the conditions of , , and values within , a simulation was undertaken to show the cumulative platform profit when the VAS level is different. Then, the influence of the suppliers’ cross-network effect on the platform VAS strategy was obtained, as shown in Figure 6b. Accordingly, we summarized the impact of the cross-network effect on the platform VAS strategy in Observation 5.
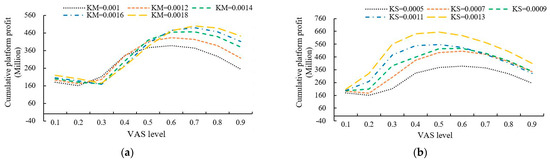
Figure 6.
(a) The impact of manufacturers’ cross-network effect on the platform VAS strategy. (b) The impact of suppliers’ cross-network effect on the platform VAS strategy.
Observation 5(i). When the cross-network effect of manufacturers is relatively strong, or that of suppliers is comparatively weak, the platform should improve the VAS investment. Conversely, when the cross-network effect of manufacturers is relatively weak, or that of suppliers is relatively strong, VASs become less attractive to ordinary suppliers, so reducing investment in VASs is more beneficial to the platform.
(ii). A strong cross-network effect of manufacturers will not always benefit the platform. If the VAS level is comparatively low, the cumulative platform profit decreases with the enhancement of the manufacturers’ cross-network effect.
Observation 5 illustrates that the threshold value of VAS investment increases with the enhancement of manufacturers’ cross-network effect. With the enhancement of the manufacturers’ cross-network effect, more ordinary suppliers are attracted to join the platform, which intensifies competition for orders on the platform, so the competitive advantage of member suppliers is weakened. Only by enhancing the level of VASs could the platform attract more ordinary suppliers to purchase VASs. Therefore, when the VAS level is low, the strong cross-network effect of manufacturers will reduce the competitive advantage of member suppliers, which causes a decrease in platform profit. The suppliers’ cross-network effect influences the platform’s VAS strategy differently. It can be seen from Figure 6b that the threshold of the platform investing in VASs decreases with the enhancement of the suppliers’ cross-network effect. As the cross-network effect of suppliers is low, the joining rate and the number of manufacturers joining the platform are low. With the increase in the suppliers’ cross-network effect, more manufacturers are stimulated to join the platform and alleviate the order competition between suppliers. As a result, the positive effect of the VAS level improvement on expanding the member suppliers’ scale decreases, and that is why the threshold of the VAS level decreases.
Consequently, when the cross-network effect of manufacturers is relatively strong, or that of suppliers is relatively weak, the order competition among suppliers on the platform is fierce. Increasing VAS investment can attract more ordinary suppliers to purchase VAS, increasing the platform’s profit. However, when the cross-network effect of manufacturers is relatively weak, or that of suppliers is relatively strong, the order competition among suppliers is relatively relaxed. The platform improving the VAS level is less attractive for ordinary suppliers, so the platform should reduce the investment in VASs.
To explore the impact of the cross-network effect on the VAS charging strategy of the platform, given the conditions of , , and values are within , we simulated the cumulative profit of the platform under different VAS fees, as presented in Figure 7a. Under the conditions of , , and values within , we simulated the cumulative profit of the platform when the VAS fee is different, and the influence of the suppliers’ cross-network effect on VAS fees of the platform was obtained, as presented in Figure 7b. The following observation is given to conclude the results of the simulations.
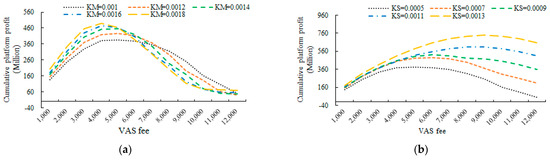
Figure 7.
(a) The impact of manufacturers’ cross-network effect on the platform’s VAS fees. (b) The impact of suppliers’ cross-network effect on the platform’s VAS fees.
Observation 6. When the cross-network effect of manufacturers is relatively strong, or that of suppliers is relatively weak, the platform should lower its VAS fee to encourage more ordinary suppliers to purchase it. When the cross-network effect of manufacturers is relatively weak, or that of suppliers is relatively strong, the platform should increase its VAS fee.
Observation 6 reveals the impact of the cross-network effect of manufacturers and suppliers on the platform’s VAS fees. With the increase in manufacturers’ cross-network effect, the threshold of the VAS fees decreases. When the manufacturers on the platform have a weak cross-network effect, the scale of ordinary suppliers is small, so a high VAS fee is more beneficial to the platform. With the enhancement of manufacturers’ cross-network effect, more ordinary suppliers are attracted to join the platform. The reduced VAS fee can significantly expand the scale of member suppliers, so the threshold of the VAS fee decreases. Conversely, the VAS fee threshold increases as the suppliers’ cross-network effect rises. When the cross-network effect strength of suppliers is low, there is a small number of manufacturers in the platform. With the enhancement of suppliers’ cross-network effect, more manufacturers are stimulated to join the platform, and the demand for parts increases, alleviating the competition among suppliers. It is less attractive for ordinary suppliers to purchase VASs when the platform reduces its VAS fee. Thus, the platform can obtain higher profits by increasing the VAS fee.
6. Conclusions
Considering the influence of a third-party e-commerce platform providing VASs on the matching between suppliers and manufacturers, this paper studies the VAS and charging strategies of the platform from the perspective of dynamic evolution.
The main conclusions of this paper are summarized as follows: (1) In the early stage of development, the number of suppliers on the platform is small, and the platform should reduce the VAS investment and appropriately increase the VAS fee. The marginal effect of the VAS level improvement on increasing the member suppliers’ scale decreases, so the platform should appropriately improve the VAS investment and reduce the VAS fee after the number of manufacturers and suppliers stabilizes. (2) In the long run, when a platform adopts different charging strategies, increasing investment in VASs will have different effects. When the VAS fee is low, the cumulative platform profit first increases and then decreases with the improvement in the VAS level. Differently, the cumulative profit of the platform first decreases, then increases, and finally decreases with the VAS level improvement when the VAS fee is high. Moreover, increasing the VAS fee will have different effects under different VAS strategies. (3) When the cross-network effect of suppliers to manufacturers is relatively weak, or that of manufacturers to suppliers is relatively strong, the platform should increase VAS investment and reduce the VAS fee. Conversely, the platform should lower VAS investment and increase the VAS fee when the cross-network effect of manufacturers is relatively weak, or when the cross-network effect of suppliers is relatively strong. We also find that a strong manufacturers’ cross-network effect does not always benefit the platform. When VAS investment is relatively low, the cumulative platform profit decreases as the manufacturers’ cross-network effect is enhanced.
This paper provides the following practical implications for platform operators: (1) In the early stage of platform development, platform operators should not try to invest in VASs, or appropriately invest in a small amount of VASs and charge higher service fees to avoid the profit loss brought by VAS investment. After a platform’s development has stabilized, platform operators should increase VAS investment and lower the service fee. (2) From the perspective of the long-term development of the platform, no matter whether platform operators charge a high service fee or a low service fee, they should maintain the level of VAS investment at a moderate level to obtain the highest benefit. (3) When the platform gathers a large number of common suppliers (such as automobile running light, automobile cushion, dashcam, and other common parts suppliers), or gathers a large number of manufacturers with high demand scales (such as BYD, Ford, Toyota, and other large automobile manufacturers), platform operators should increase VAS investment and reduce the service fee. When the platform gathers a large number of important suppliers (such as engine, clutch, gearbox, and other key part suppliers) or a large number of manufacturers with low demand (such as Jiangling, Southeast, Zotye, and other small- and medium-sized automobile manufacturers), platform operators should reduce the VAS investment and increase the service fee.
This paper has some limitations that can be extended in future research. On the one hand, this paper considers the scenario in which suppliers have the same types of products and that manufacturers have the same types of demands on the third-party platform. However, there may be suppliers with different product quality and manufacturers with different demand quantities and delivery times on the platform. Therefore, future research could consider the scenario in which the platform aggregates suppliers with heterogeneous products and manufacturers with heterogeneous demand and study how the third-party platform dynamically invests in VASs and charges VAS fees to heterogeneous suppliers. On the other hand, this paper considers the scenario in which the platform provides VASs to suppliers, but in practice, the third-party platform also provides VASs to manufacturers. Therefore, future research could consider the scenario in which the platform provides VASs for suppliers and manufacturers and study how the platform dynamically invests in VASs for suppliers and manufacturers and charges VAS fees.
Author Contributions
Conceptualization, W.L. and Y.Z.; methodology, W.L. and Y.Z.; validation, W.L., Y.Z., B.D. and R.S.; formal analysis, W.L. and Y.Z.; writing—original draft preparation, W.L.; writing—review and editing, W.L., B.D. and X.Z. All authors have read and agreed to the published version of the manuscript.
Funding
This work was supported by National Natural Science Foundation of China (Grant number 72072016), Major Program of the National Social Science Foundation of China (Grant number 20&ZD084), and the Fundamental Research Funds for the Central Universities (Grant number 2023CDJKYJH004).
Institutional Review Board Statement
Not applicable.
Informed Consent Statement
Not applicable.
Data Availability Statement
Data are contained within the article.
Conflicts of Interest
The authors declare no conflicts of interest.
References
- Boillat, T.; Legner, C. From on-premise software to cloud services: The impact of cloud computing on enterprise software vendors’ business models. J. Theor. Appl. Electron. Commer. Res. 2013, 8, 39–58. [Google Scholar] [CrossRef]
- Lee, I. Pricing and profit management models for SaaS providers and IaaS providers. J. Theor. Appl. Electron. Commer. Res. 2021, 16, 859–873. [Google Scholar] [CrossRef]
- Chen, Q.; Xu, Q.; Wu, C. Dynamic matching in cloud manufacturing considering matching costs. Complexity 2019, 2019, 8398356. [Google Scholar] [CrossRef]
- Basu, A.; Bhaskaran, S.; Mukherjee, R. An analysis of search and authentication strategies for online matching platforms. Manag. Sci. 2019, 65, 2412–2431. [Google Scholar] [CrossRef]
- He, J.; Zhang, J.; Gu, X. Research on sharing manufacturing in Chinese manufacturing industry. Int. J. Adv. Manuf. Technol. 2019, 104, 463–476. [Google Scholar] [CrossRef]
- Guo, Y.; Bao, Y.; Stuart, B.J.; Le-Nguyen, K. To sell or not to sell: Exploring sellers’ trust and risk of chargeback fraud in cross-border electronic commerce. Inf. Syst. J. 2018, 28, 359–383. [Google Scholar] [CrossRef]
- Ghomi, E.J.; Rahmani, A.M.; Qader, N.N. Cloud manufacturing: Challenges, recent advances, open research issues, and future trends. Int. J. Adv. Manuf. Technol. 2019, 102, 3613–3639. [Google Scholar] [CrossRef]
- Dou, G.; He, P.; Xu, X. One-side value-added service investment and pricing strategies for a two-sided platform. Int. J. Prod. Res. 2016, 54, 3808–3821. [Google Scholar] [CrossRef]
- Rochet, J.C.; Tirole, J. Platform competition in two-sided markets. J. Eur. Econ. Assoc. 2003, 1, 990–1029. [Google Scholar] [CrossRef]
- Evans, D.S. Some empirical aspects of multi-sided platform industries. Rev. Netw. Econ. 2003, 2, 191–209. [Google Scholar] [CrossRef]
- Winkler, T.J.; Ziekow, H.; Weinberg, M. Municipal benefits of participatory urban sensing: A simulation approach and case validation. J. Theor. Appl. Electron. Commer. Res. 2012, 7, 101–120. [Google Scholar] [CrossRef]
- Zhang, X.; Yuan, J.; Dan, B.; Sui, R.; Li, W. The evolution mechanism of the multi-value chain network ecosystem supported by the third-party platform. J. Ind. Manag. Optim. 2022, 18, 4071–4091. [Google Scholar] [CrossRef]
- Zhang, X.; Sui, R.; Dan, B.; Guan, Z. Bilateral value-added services and pricing strategies of the third-party platform considering the cross-network externality. Comput. Ind. Eng. 2021, 155, 107196. [Google Scholar] [CrossRef]
- Chen, D.; Zhou, Z.; Ma, Y.; Pham, D.T. Design of agent-based supply chain-oriented virtual enterprise platform. Kybernetes 2011, 40, 800–806. [Google Scholar] [CrossRef]
- Song, T.; Liu, H.; Wei, C.; Zhang, C. Common engines of cloud manufacturing service platform for SMEs. Int. J. Adv. Manuf. Technol. 2014, 73, 557–569. [Google Scholar] [CrossRef]
- Rau, H.; Chen, T.F.; Chen, C.W. Develop a negotiation framework for automating B2B processes in the RosettaNet environment using fuzzy technology. Comput. Ind. Eng. 2009, 56, 736–753. [Google Scholar] [CrossRef]
- Yin, Y.; Zhou, J.; Zhang, C.; Chen, D. Adaptive SLA mechanism for service sharing in virtual environments. Kybernetes 2016, 45, 1036–1051. [Google Scholar] [CrossRef]
- Renna, P.; Argoneto, P. Production planning and automated negotiation for SMEs: An agent based e-procurement application. Int. J. Prod. Econ. 2010, 127, 73–84. [Google Scholar] [CrossRef]
- Valilai, O.F.; Houshmand, M. A collaborative and integrated platform to support distributed manufacturing system using a service-oriented approach based on cloud computing paradigm. Robot. Comput.-Integr. Manuf. 2013, 29, 110–127. [Google Scholar] [CrossRef]
- Bakos, Y.; Katsamakas, E. Design and ownership of two-sided networks: Implications for Internet platforms. J. Manag. Inf. Syst. 2008, 25, 171–202. [Google Scholar] [CrossRef]
- Laili, Y.; Tao, F.; Zhang, L.; Sarker, B.R. A study of optimal allocation of computing resources in cloud manufacturing systems. Int. J. Adv. Manuf. Technol. 2012, 63, 671–690. [Google Scholar] [CrossRef]
- Zhou, J.; Yao, X. A hybrid approach combining modified artificial bee colony and cuckoo search algorithms for multi-objective cloud manufacturing service composition. Int. J. Prod. Res. 2017, 55, 4765–4784. [Google Scholar] [CrossRef]
- Pan, X.Y.; Ma, J.Z.; Zhao, D.Z. Study on pricing behaviour and capacity allocation of cloud manufacturing service platform. Cluster. Comput. 2019, 22, 14701–14707. [Google Scholar] [CrossRef]
- Guo, D.; Fan, Z.P.; Sun, M. B2C car-sharing services: Sharing mode selection and value-added service investment. Transp. Res. Part E Logist. Transp. Rev. 2022, 165, 102836. [Google Scholar] [CrossRef]
- Anderson, E.G., Jr.; Parker, G.G.; Tan, B. Platform performance investment in the presence of network externalities. Inf. Syst. Res. 2014, 25, 152–172. [Google Scholar] [CrossRef]
- Dukes, A.; Liu, L. Online shopping intermediaries: The strategic design of search environments. Manag. Sci. 2016, 62, 1064–1077. [Google Scholar] [CrossRef]
- Liu, W.; Yan, X.; Wei, W.; Xie, D. Pricing decisions for service platform with provider’s threshold participating quantity, value-added service and matching ability. Transp. Res. Part E Logist. Transp. Rev. 2019, 122, 410–432. [Google Scholar] [CrossRef]
- Gui, Y.; Zhai, H.; Dong, F.; Liu, Z. Value-added service investment and pricing decisions in two-sided platform: The role of user expectations. Kybernetes 2023, 53, 557–579. [Google Scholar] [CrossRef]
- Tan, B.; Anderson, E.G., Jr.; Parker, G.G. Platform pricing and investment to drive third-party value creation in two-sided networks. Inf. Syst. Res. 2020, 31, 217–239. [Google Scholar] [CrossRef]
- Sui, R.; Zhang, X.; Dan, B.; Zhang, H.; Liu, Y. Bilateral value-added service investment in platform competition with cross-side network effects under multihoming. Eur. J. Oper. Res. 2023, 304, 952–963. [Google Scholar] [CrossRef]
- Li, Y.M.; Jhang-Li, J.H. Analyzing online B2B exchange markets: Asymmetric cost and incomplete information. Eur. J. Oper. Res. 2011, 214, 722–731. [Google Scholar] [CrossRef]
- Li, C.; Scheller-Wolf, A. Push or pull? Auctioning supply contracts. Prod. Oper. Manag. 2011, 20, 198–213. [Google Scholar] [CrossRef]
- Hagiu, A.; Spulber, D. First-party content and coordination in two-sided markets. Manag. Sci. 2013, 59, 933–949. [Google Scholar] [CrossRef]
- Gordijn, J.; Wieringa, R. The business model of digital ecosystems: Why and how you should do it. In Proceedings of the Enterprise Engineering Working Conference, Leusden, The Netherlands, 2–3 November 2022; Springer Nature: Cham, Switzerland, 2022; pp. 3–16. [Google Scholar]
- Liu, J.; Tong, T.W.; Sinfield, J.V. Toward a resilient complex adaptive system view of business models. Long Range Plan. 2021, 54, 102030. [Google Scholar] [CrossRef]
- Cosenz, F.; Noto, G. A dynamic business modelling approach to design and experiment new business venture strategies. Long Range Plan. 2018, 51, 127–140. [Google Scholar] [CrossRef]


Disclaimer/Publisher’s Note: The statements, opinions and data contained in all publications are solely those of the individual author(s) and contributor(s) and not of MDPI and/or the editor(s). MDPI and/or the editor(s) disclaim responsibility for any injury to people or property resulting from any ideas, methods, instructions or products referred to in the content. |
© 2024 by the authors. Licensee MDPI, Basel, Switzerland. This article is an open access article distributed under the terms and conditions of the Creative Commons Attribution (CC BY) license (https://creativecommons.org/licenses/by/4.0/).