Article

Effects of Perceived Price Dispersion on Travel Agency Platforms: Mental Stimulation to Consumer Cognition

1
Business School, Macau University of Science and Technology, Macau SAR, China
2
Institute of International Education, Guizhou Normal University, Guiyang 550003, China
*
Author to whom correspondence should be addressed.
J. Theor. Appl. Electron. Commer. Res. 2025, 20(1), 47; https://doi.org/10.3390/jtaer20010047
Submission received: 4 January 2025 / Revised: 24 February 2025 / Accepted: 25 February 2025 / Published: 10 March 2025
(This article belongs to the Section Digital Marketing and the Connected Consumer)

Abstract

:
Despite free access to complete information regarding hotel quality and reference prices, consumers perceive significant price differences across different online platforms. We explore how perceived price dispersion on online travel agency platforms influences consumer purchase intention through mental account theory and propose a psychological mechanism explaining why consumers may tolerate and even embrace price discrepancies. Study 1 employs a scenario-based experiment that manipulates differing levels of price dispersion for the same hotel booking, demonstrating that higher PPD significantly amplifies perceived transaction utility and, in turn, acquisition utility. Study 2 corroborates these findings through an online survey with judgment sampling, highlighting that consumers—despite access to comprehensive OTA information—are often motivated, rather than deterred, by price discrepancies; multiple variable combinations were tested to ensure robust findings. This study challenges traditional marketing theories suggesting that price dispersion signals market unfairness and reduces consumers’ purchasing intention; instead, it mentally stimulates consumers. This perception enhances transaction and acquisition utility, positively impacting purchase intention. We also offer a robust model for mechanism study and provide insights for leveraging price dispersion as a cost-less promotional strategy, potentially increasing consumer engagement without additional marketing expenditure. We contribute to the literature by integrating the mental account theory into the context of online marketplaces and developing a price dispersion model with psychological utility in the consumer decision-making process.

1. Introduction

Researchers are focusing on the widespread phenomenon of price dispersion in emerging online travel agency (OTA) platforms, including flight tickets [1], hotel reservations [2], and car rental markets [3]. Considering the increasingly diverse channels, this dispersion occurs between direct and indirect channels and within indirect channels [4,5]. Prior research reveals consumers’ perceived price dispersion (PPD) as being rooted in price and past purchasing experience comparison. They compare prices using tools like websites and apps [6]. Moreover, consumers’ perception of price dispersion is not based on memorized prices but on the “intuitive statistics” of the degree of dispersion, encoding the degree of PPD [7]. Consumers process price information based on personal cognition and demands [8]. Consumer psychology can abstract the dispersion while endogenously shaping consumer preferences [9].
PPD is the psychological encoding of the degree of price dispersion. The price dispersion model is a theoretical foundation. It is traditionally believed to originate from information asymmetry, whereby sellers set a spectrum of prices for an ostensibly homogeneous product to earn excess profits because consumers are unable to identify the seller offering the lowest price [10,11,12]. Price dispersion may also negatively affect consumer demand. First, consumers should invest time and energy in comparison with prices in cases of price dispersion because they cannot be certain of having found the lowest price. This process can lead to decision fatigue, ultimately reducing consumers’ inclination to make a purchase. Second, price dispersion may cause consumers to worry about overpaying or missing out on better deals, thereby reducing their trust in merchants and their satisfaction with their purchasing decisions [10]. Online travel platforms have substantially altered existing information asymmetry by providing convenient access to pricing information [13]. However, price dispersion has not significantly decreased with the narrowing of the information gap. The core question is how consumers on online travel platforms perceive and respond to this phenomenon and why they may tolerate it in online markets despite having more information and choices.
The spontaneous formation of the lowest equilibrium price in the market is a rational assumption. However, scholars’ expectation of a simple equilibrium price for hotel prices on OTA platforms is counterfactual. When facing price dispersion, rational consumers may favor a vendor that offers the minimum price for an identical product, eschewing costlier counterparts [14]. The prerequisite for displaying this behavior is that consumers can access sufficient price information, and their marginal information search costs are significantly lower [15]. OTAs locate hotel reservation information through web pages or applications. Consumers can download applications from various platforms or switch web pages to view the prices for the same hotel across multiple OTAs and book rooms accordingly. Online platforms such as Ctrip and Booking publicize their prices. Simultaneously, aggregators such as Trivago empower consumers to thoroughly compare prices across a spectrum of providers. Little monetary payment or transportation costs are required for information searches on OTAs; thus, time may be the only cost of obtaining sufficient price information. However, considering the convenience of browsing OTAs using mobile phones or PCs, the time cost of searching online is significantly lower than that in traditional offline scenarios [16]. PPD is commonly considered to decrease as the information gap gradually shrinks. However, empirical studies challenge this notion; evidence from studies, such as [17,18], indicates that even in markets characterized by symmetry among firms, homogeneity in product offerings, and negligible marginal costs for acquiring price information, the anticipated equalization effect remains unreachable. Previous studies have not considered price dispersion given consumers’ spontaneous behavior, revealing the following research gaps. First, is price dispersion a dynamic equilibrium state achieved through spontaneous consumer selection? Second, if price dispersion can reveal consumers’ preferences, which psychological mechanisms are used to achieve it? Reassessing the psychological path of PPD on consumers of OTA platforms may help us analyze its mechanism and provide an alternative explanation for existing deviation phenomena.
An alternative explanation is the failure of the price equality strategy, which is different from the lowest equilibrium price spontaneously formed by the market [19]. The price equality strategy refers to hotels setting the same price for consumers across all distribution channels. Although this conforms to the rules of the no-cost arbitrage model in economics, consumers often perceive it as a tool for OTA platforms to avoid competition through price manipulation [20]. Research indicates consumers’ concerns about the price equality strategy, demonstrating a third significant gap in existing literature: If an equal pricing strategy motivated by fairness is perceived as unfair by consumers, is there an effective pricing strategy mechanism that describes consumer psychology and purchase preferences?
The deviation between facts and past theories reveals the limitations of analyzing the impact of price dispersion on the market from a completely rational perspective. The existing research gaps suggest that we cannot reject the hypothesis of PPD positively affecting consumers. Therefore, this study evaluates the impact of PPD on the psychological mechanisms of consumers, considering the conditions of limited rationality and inductive inference. This may significantly help develop price dispersion theories. Our study examines the following two questions: (1) Can price dispersion positively influence consumers’ intentions to book hotel rooms using OTAs? (2) Under the psychological mechanism that consumer PPD affects purchase intention (PI), can managers manipulate PPD to increase consumer willingness to purchase and increase consumer utility?

2. Research Framework

2.1. Perceived Price Dispersion

Previous researchers have analyzed the reasons for price dispersion in offline commodity markets from an information economics perspective. Stigler [11] has suggested that incomplete information can lead to price dispersion. Salop and Stiglitz [10] have argued that firms employ strategic market segmentation by manipulating dispersion in pricing. Moreover, sellers’ price discrimination tactics contribute to price dispersion, which may include manipulating information asymmetry, increasing consumer search costs, and artificially creating pricing volatility [14,21,22]. These studies have viewed price dispersion as a phenomenon that may lead consumers to experience unfairness. However, our research scenario involves OTA platforms in online markets, and we assume that traditional theories may not apply to this emerging scenario.
Researchers are exploring alternative explanations for this phenomenon beyond seller manipulation or the cost of information-searching. We focus on existing literature and problematize relevant theories, including consumer risk, fairness, and hesitation. These theories do not view price dispersion as unilateral price information manipulation by sellers but rather as the interaction between pricing strategy and consumer psychology.
The consumer risk theory suggests that consumers pay attention to consumer risk issues during shopping, especially concerning seller contract term fraud, adulterated sales, and privacy leaks [23]. Accordingly, factors that cause price dispersion can be divided into stimulating and non-stimulating factors [24]. If buyers attribute high prices (or lower prices) to the seller’s better service quality (worse service quality) and not opportunism (non-stimulus factors), then buyers will form a positive attitude; otherwise, they will form a negative attitude [25]. This pricing attitude is a belief formed through buyers’ internal decision-making process, that is, whether the seller’s pricing behavior is trustworthy.
Referring to the fairness theory, Zhang [26] suggests that PPD may result in consumer dissatisfaction and untrust in sellers, as consumers perceive unfair pricing strategies. PPD does not directly affect the transaction utility of consumers but instead acts as an intermediary through the perceived price fairness of consumers.
According to the consumer confusion theory, significant PPD may lead to consumer hesitation in purchasing [27]. Manolică et al. [28] propose that this price fluctuation for the same product may lead to selection paralysis and decision fatigue, leading consumers to delay or prevent purchases. Consumer hesitation in purchasing includes utility maximization [29], information-overloading [30], regret expectations, and delayed decision-making [28,30,31].
The price dispersion phenomenon on OTA platforms is unlikely to be a cause of sales service differences, potential shopping risks, or incomplete, manipulated information. OTA platforms are responsible for distributing hotel orders only because service products (rooms and hotels’ hospitality) and service subjects (hotels) are inseparable. Price dispersion may be related to the business methods of OTA platforms because there exist differences in the cooperative relationships between hotels and various OTAs, leading to differences in the marketing support of hotels for OTAs [32]. These differences may be reflected in the enhanced marketing resources and increased visibility provided by OTAs to partner hotels, increasing their prominence in search engine results, frequency in recommendations, and visibility through advertising and promotional efforts [33,34]. This marketing advantage often depends on whether hotels are willing to offer more competitive rates on OTA platforms, supporting the strategic goal of OTAs of attracting customers using attractive prices and increasing their market share [35]. Agreements characterized by lower platform pricing may bring implicit marketing benefits, thereby attracting a broader customer base. Therefore, hotels must strategically manage the balance among platforms to maintain price gradients and profits. A single pricing strategy across multiple OTAs may narrow the hotel’s profit margin and weaken the platform’s promised cost advantage [36]; hotels adopting a unified low-price promotion may make consumers accustomed to low prices and fail to stimulate the promotion. Concurrently, excessive low-price sales can affect hotel revenue. Additionally, the platform may charge commissions for its services and marketing, thereby affecting the hotel’s profits. In this situation, hotels must balance room distribution across different platforms, diversify sales channels, reduce reliance on a single platform, reduce sales expenses, and improve profitability [37]. Intuitively, if the seller believes this strategy is profitable, an alternative explanation may exist for the impact of this strategy on consumer PIs.
Contrarily, some studies suggest that price dispersion positively affects the purchasing behavior of consumers prioritizing cost-effectiveness. PPD may increase consumers’ intrinsic search motivation, prompting them to actively seek discounts and promotions [38,39]. The reference theory suggests that when consumers have a potential psychological reference point for the value of a product, the referenced price signals the product quality. When there is price dispersion in the market and product quality is informed, consumers may consider the higher-priced part of the price range as a quality signal for the product; vice versa, the lower-priced part of the purchase price range may signal value-for-money. This is associated with consumers’ perception of price elasticity, also known as consumers experiencing price perception bias [40]. Given the correlation between quality price and price dispersion, experiments have shown that higher product quality often leads to higher prices and products with higher prices tend to have higher price dispersion. Accordingly, high price dispersion is considered by consumers as a signal of high-quality products [41,42].
Although previous studies have revealed different psychological driving factors of price dispersion on consumers and analyzed price dispersion on OTA platforms, they may apply to contexts other than this segmented market. A research gap remains regarding how price dispersion affects the psychological mechanisms of OTA platform consumers. This study first tests the impact of PPD on PI as an underlying mechanism [43,44].
H1. 
Higher perceived price dispersion leads to higher purchase intention.

2.2. Mental Account Theory

Based on the mental account theory, Thaler [45,46] has developed a psychological utility model encompassing two distinct components, namely, acquisition and transaction utility. Acquisition utility is based on comparing the intrinsic value of purchasing goods or services and the price paid; it reflects the satisfaction value (or quality) consumers receive from purchasing goods or services minus the cost they pay. However, transaction utility is solely based on the buyer’s perceived value of a transaction [47]. It is the psychological reference price minus the actual transaction price instead of the intrinsic value of the purchased goods or services, and it is primarily related to the perceived benefits of consumers in transactions. The mental account theory accentuates a non-linear psychological appraisal of the two utilities and reveals that they are not mutually substitutable [48]. In an environment with uncertain information, consumers’ reference points are not fixed and are determined by the rational expectations of decision-makers through the “personal equilibrium” [49], which is a psychological process instead of a linear process [50]. PAU is the subjective projection of acquisition utility, which is the consumer’s subjective perception of the gains or losses resulting from consumption; similarly, PTU is the consumer’s subjective feeling of inner pleasure derived from the quality of the transaction [51].
A psychological sequence may exist between knowing about a hotel on an OTA platform and the PPD for the hotel. When consumers search for hotels, they generate expected reference prices and quality based on the descriptions provided on the hotel page, including information related to facilities, brand, star rating, services, and hotel locations [52]. We suppose this psychological step may occur before perceiving price dispersion. Consumers can search for a hotel using multiple OTA platforms, and price dispersion may be perceived. At the next stage, consumer psychology can be explained using the signal theory [53]. This theory can support the mental account theory that consumers rely on external cues (such as price) to strengthen their expectations. Price dispersion provides a signal-generated scenario [54]. Following the previous literature, we focus on whether the dynamic path of PPD affecting trading utility generates signals that are sufficient to affect acquisition utility. Thaler [45] highlights that transaction utility is based on the principle of equivalence, which refers to an equivalence point whereby consumer psychology realizes an achievement but does not psychologically achieve a transaction equivalent. Muehlbacher et al. [55] explain that only beyond this equivalence point do consumers perceive a transaction as beneficial. Transaction utility is a measure of the satisfaction of bargaining. This process involves the expectation that transactional perceptions are shaped by an amalgamation of consumers’ heterogeneous psychological evaluative preferences before they assess the objective value of an acquired product [56,57]. Therefore, PTU can obtain psychological satisfaction from discounted price transactions, and this positive perception may be carried into the next transaction stage, strengthening consumers’ perception of “value-for-money” or even “value beyond money” [55,58]. In using products or services and obtaining the PAU, this perception amplifies the positive perception of acquisition utility [51]. Therefore, we propose the following hypothesis:
H2. 
Higher perceived price dispersion leads to higher PTU.
Previous studies show that the impacts of acquisition and transaction utility are asymmetric. Consumers have different psychological preference coefficients for gains and losses [48]; the pain caused by potential losses often outweighs the happiness brought by equivalent gains [50]. PTU is more likely to be considered a loss avoidance utility for high-priced transactions, whereas acquisition utility may be seen as a benefit utility for value-for-money; therefore, transaction utility can reflect the pleasure value that consumers perceive based on the value of a transaction [50,51,55]. Previous studies have explored the relationship between perceived transactions and acquisition utility using experimental markets and mathematical models [57].
The mental account theory divides the consumer’s selection process into the initial “editing” stage and subsequent “evaluation” stage [45]. In the first stage, consumers edit their “prospects” for future access to services or usage of products through transactional behavior. When consumers perceive significant fluctuations in the prices of the same hotels and room types across OTA platforms during the transaction process, they compare their internal “reference prices” based on the market’s high- and low-price information and expected transaction prices. The additional discounts obtained through this “bargaining” can be seen as a “signal” [6]. Consumers analyze the discount signals received and combine them with a more straightforward expression based on their perception, which is the psychological pleasure achieved by attaining the discount. In the second stage, consumers evaluate the encoded prospects and select the most valuable prospect based on decision weights in the psychological account. Transaction utility is perceived as a “stimulus” relative to acquisition utility. In mental accounts, people do not aim to maximize economic utility in rational cognition but instead maximize psychological utility in perception. The PTU obtained by avoiding unfavorable transactions in price dispersion and PAU obtained through high-price–performance bookings sequentially form consumers’ final perceived utility. The two cannot be replaced but can have a sequential impact; good transactions between consumers and providers can arouse consumers’ pleasure and provide customers with unforgettable memories. According to the consumer memory theory, the pleasure experienced and stored in consumers’ memories through transaction experiences stimulates future behavioral expectations, making consumers feel that obtaining utility is subjectively more valuable [46,59]. Subsequently, consumers may evaluate the price performance of this transaction based on potential transaction prices compared to the reference quality, and the price–quality ratio may represent the PAU. The psychological satisfaction that PTU brings to consumers will benefit this process, making them feel that transactions are more price-effective and ultimately increase their PI. Accordingly, we propose the following hypothesis:
H3. 
PAU mediates the impact of PTU on purchase intention.
In addition, external factors such as promotional activities [6], seasonality [60,61], and consumer reviews [52,54] are found to significantly influence consumer price perceptions. A gap between these external cues and mental accounting theory is bridged by the proposed framework. Promotional activities are described as factors that alter the price–utility relationship by imbuing discounted prices with additional perceived value [51]. Seasonality is observed to trigger fluctuations in market supply and demand, which are used to affect consumer expectations and the formation of reference prices. Similarly, consumer reviews are regarded as a crucial source of social information that reduces information asymmetry and acts as social proof. External cues are used to explain the cognitive processing of transaction utility and acquisition utility within consumers. As external signals, their influence on internal utility calculation is not explained. External factors have been empirically shown to affect consumer price perceptions. However, the process by which these external signals are effectively transformed into internal decision inputs is not clarified in the framework. For example, how psychological reference points are adjusted, how the weight assigned to benefit comparisons is changed, or how risk perception is regulated is not addressed. This gap is significant in studies of internal mechanisms and in explaining the failure of the rational consumer assumption in online platform contexts, as well as the divergence between theory and reality.

2.3. Consumer-Perceived Usefulness

Consumer-perceived usefulness is the belief that using a product or service increases its value or efficiency [62]. When exploring the impact of price dispersion on consumer PI on OTA platforms, consumer-perceived usefulness should be controlled to eliminate potential endogeneity. This issue can be understood from two perspectives. First, consumer-perceived usefulness may endogenously affect the explanatory effect of PPD on PI. Perceived usefulness significantly influences user attitudes toward accepting and using information systems [63,64]. Therefore, the perceived usefulness of OTA platforms, instead of price dispersion, may incline consumers to use them for booking. Second, consumer-perceived usefulness may have an endogenous impact on the mediating variables. For instance, the usefulness of OTA platforms may improve consumers’ ordering experiences [35], making the ordering process simpler and more convenient [65]. Therefore, it may affect consumer utility in achieving the transaction, affecting PI. Additionally, a “user-friendly” OTA platform will increase the possibility of consumers achieving better transactions and endogenously affect consumer utility acquisition and subsequent paths [60,66].

2.4. Consumer Internet Information-Searching

The cost of an online information search is the time and effort spent by consumers in processing and comparing information [27,67]. Consumers face an environment of varied prices and choices on OTA platforms. Low search costs may encourage consumers to conduct extensive searches, thereby increasing their chances of encountering price dispersion [68]. However, consumers may need to clarify their PPD because of the quantity and complexity of price information [69]. At this point, the amount of information consumers find to process and parse exceeds their cognitive capabilities, leading to confusion [70,71]. Due to information overload, consumers may be unable to effectively process all available information, resulting in strategic consumer issues [71]. This issue may manifest as evaluation errors, decision fatigue, or delayed purchases [72], endogenously affecting consumers’ purchasing intentions. Accordingly, we control the information-searching cost and overload confusion (OC) as control variables.

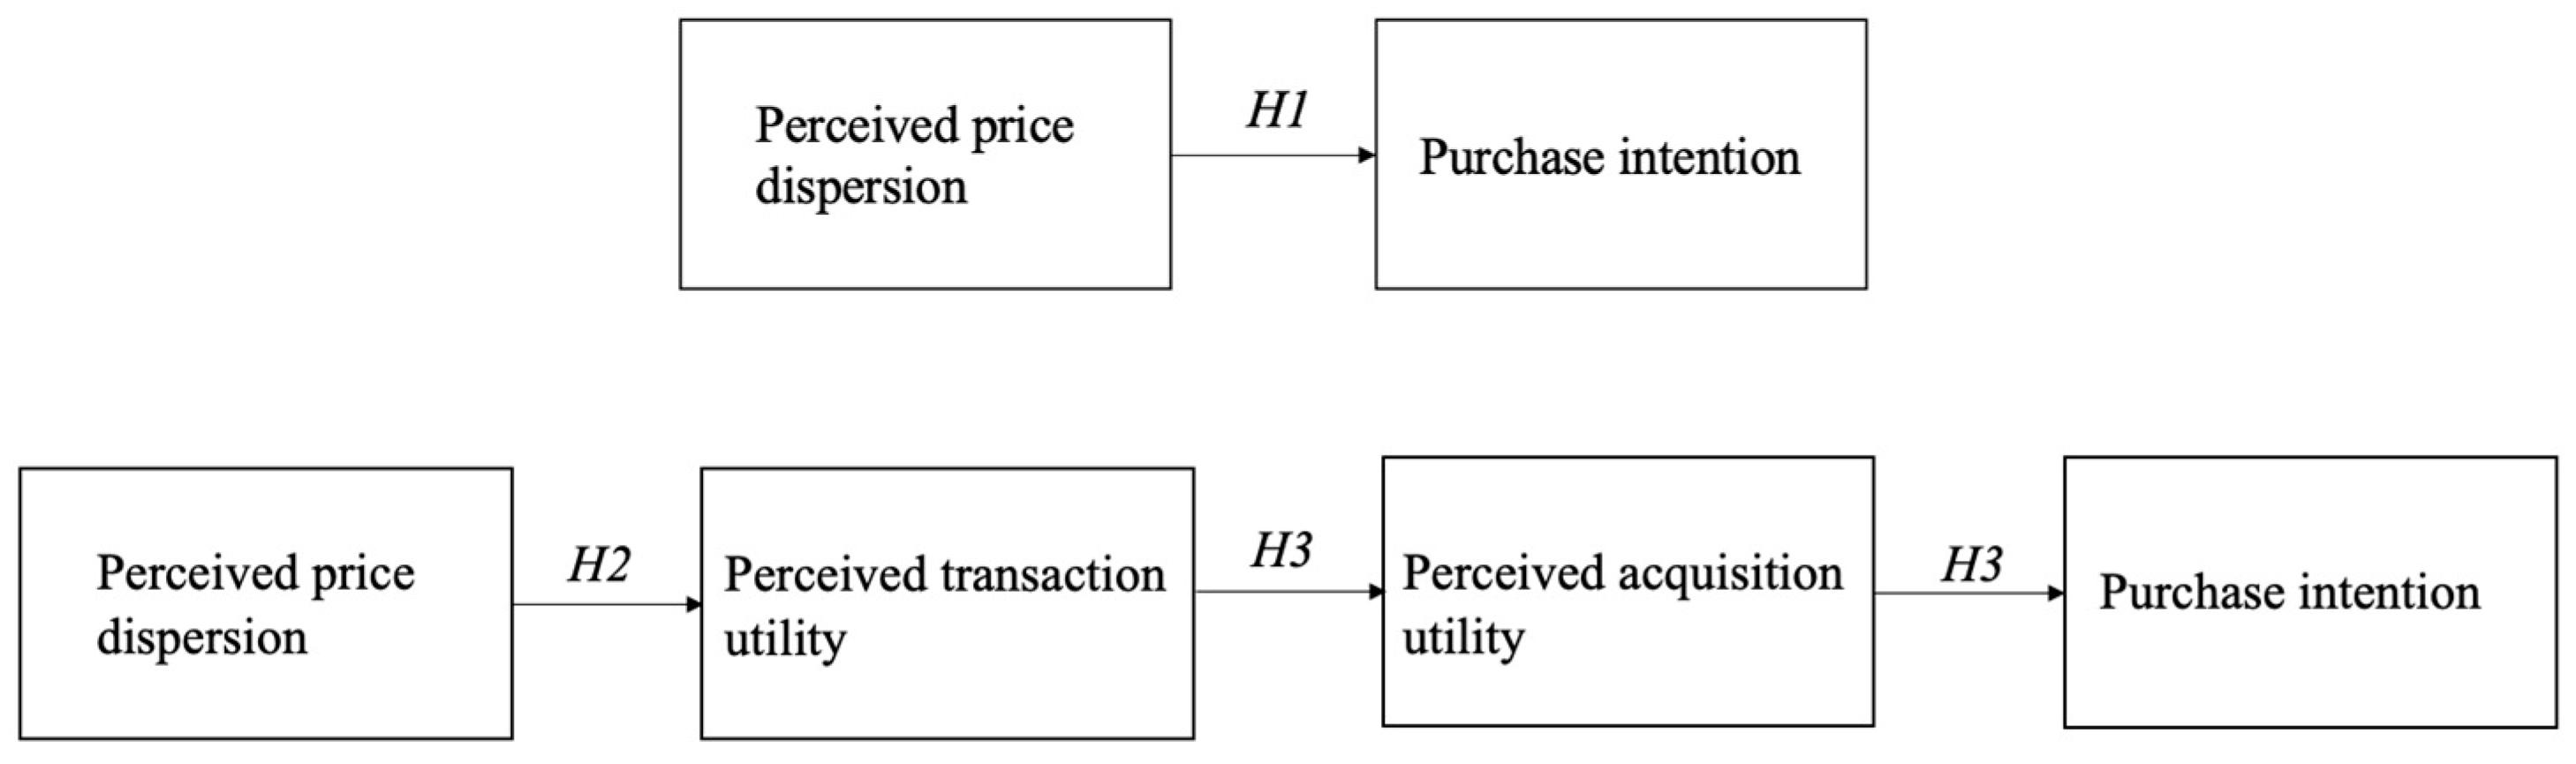
2.5. Conceptual Model

We propose a conceptual model based on the mental account theory for mechanistic study. We use the standard error of the mean (SEM) method to analyze the data and verify our hypotheses [73]. Considering our hypotheses, we assume a chain model with PPD as the independent variable, which affects the first intermediate variable’s PTU, followed by the second intermediate variable’s PAU, and finally, transmits to the dependent variable’s PI. Our model is designed based on the assumption of limited rationality. Therefore, the model must have a significant psychological impact on consumer purchasing behavior to be valid. The conceptual model can be viewed in Figure 1.

3. Study 1

3.1. Research Method in Study 1

We designed a scenario-based simulation experiment for a planned trip to Macau to test our hypothesis (materials are shown in Appendix A.5; the original language is Chinese but has been translated into English). According to Cheng et al. [74], replicating the interface of a real OTA platform is a simple, accurate, and effective method for examining consumers’ confusion caused by information overload and perceived price dispersion in the OTA shopping environment. The experiment targeted Chinese residents aged 18 and above with prior experience booking trips through online travel agencies. While travelers typically consider price ranges when making reservations, a wide price dispersion may lead to jealousy attributed to insufficient budgets, whereas a narrow price dispersion may fail to achieve the intended manipulation. To address this, we conducted a pretest on the stimuli.
We considered the price dispersion setting. Kim et al. [75] defined high price dispersion as a 44% range (with the highest price being 144% of the benchmark price) and low price dispersion as a 10% range (with the highest price being 110% of the benchmark price). They also tested a 56–18% dispersion range, which was found to be significant for consumer perception. This 40–10% stimulation method originates from Huber and Puto [76]. Zhang [26], in research on the online group-buying market, set high- and low-price dispersion boundaries at 30% and 5%, respectively. Mohammed [77] found in a survey that the average price dispersion for five-star hotels in the U.S. is 29%, with a maximum of 291%. Similarly, Kim et al. [78] tested a price dispersion range of 50%, while Kim et al. [75] examined three dispersion amplitudes of 0%, 10%, and 100%. Drawing on this prior research and considering the typical price dispersion range for hotels in Macau, we set weekday price dispersion at 20% and 85%. Since filtering and sorting mechanisms can influence information overload reduction [79], we opted to randomize the price order.
For the interface design, Liang et al. [80] identified six key hotel attributes—location, customer ratings and reviews, hotel images, amenities, and prices—that represent the core features of OTAs and are critical factors in travelers’ decision-making. Based on this framework, we included location, price, room type, and convenient services in our stimuli while excluding scarcity information and customer reviews to focus respondents’ attention on price and minimizing potential endogeneity issues. The introduction provided basic information about the target hotel, including room types, star rating, location, and amenities. To ensure consistency, we used a standardized configuration for the target room type (twin room, excluding breakfast and additional services) and controlled hotel brand preferences to eliminate the influence of perceived service quality. These measures ensured participants concentrated on price rather than configuration. Since font color is closely linked to emotional responses [81,82], multi-color text is often used to highlight general hotel features or numerical data such as customer ratings and prices. To avoid color-based biases affecting participants’ focus on content and price, we used a uniform black font.
Participants were presented with online booking information for the same room type in the same hotel, including prices and facility descriptions. We selected quotes from five different OTA platforms, with sources indicated to reflect real-life scenarios. Five sets of quotations were created, as prior research has demonstrated that this number sufficiently captures the characteristics of price dispersion [75]. After analyzing quotes from 19 hotels across various platforms in Macau, we selected the Sofia Hotel (anonymized as “Hotel A”) as the benchmark price. Accommodation choices are typically influenced by decisions regarding destination and travel time [83,84]. To simulate realistic scenarios, participants were informed of their travel destination and period. Macau, repeatedly ranked as one of the most popular tourist destinations in China [85], was selected as the study’s destination, aligning with the research setting. To eliminate potential biases caused by brand loyalty or prior experience with specific hotel brands, all hotels, platforms, and channels were anonymized.
We obtained verbal consent from all respondents, as approved by the ethics committee, allowing us to replace written consent with an oral procedure. An introductory letter attached to the survey instrument clearly stated the study’s objectives—gathering consumer opinions on OTA platforms—and emphasized that participation was voluntary, with respondents free to withdraw at any time and without any inducements offered. Before accessing the questionnaire through the third-party platform Credamo, which ensured that no personal or private information was collected, participants reviewed a “Consent Instructions” page that explained the information collection process and privacy safeguards, agreeing to participate implied acceptance of these terms. To maintain anonymity, respondents were instructed not to provide their names, and they were assured that only aggregated group data would be reported. Participation was strictly limited to individuals aged 18 and above, in compliance with legal requirements in mainland China.

3.2. Measurement in Study 1

We conducted this experimental questionnaire offline on 20 February 2024, collecting a total of 204 questionnaires for Study 1 in the Credamo online questionnaire platform. We recruited 204 participants, excluding four for failing to answer basic screening questions (e.g., “is 1 + 1 = 3, correct?”), resulting in an effective sample size of 200, comprising 70 males and 130 females. A t-test revealed a significant gender imbalance, prompting us to control for gender in the regression analysis. Most respondents were under 40 years old (190, 95%), and 188 (92%) had received higher education. However, this does not indicate sample bias; a plausible explanation is that OTAs often target tech-savvy consumers accustomed to searching for information or making online reservations [86]. Most participants reported a monthly income exceeding CNY 5000 (162, 81%), consistent with the Chinese context, where this income level suggests discretionary spending capacity for tourism after covering essential living costs. Additionally, a substantial proportion of respondents had used at least two OTA platforms for booking within the past six months (175, 87.5%), with nearly all respondents having used two or more platforms overall (196, 98%).
To measure the research variables, we used scales with three seven-point items for each conceptual construct (1 = strongly disagree; 7 = strongly agree); the research variables included PPD, PTU, PAU, and PI. PPD was measured using a three-item scale [6]; PTU and PAU were measured using three-item scales developed by Grewal et al. [51], providing a total of nine items; and PI was measured using the scale developed by Spears and Singh [87], with a total of three items. Third, we measured a range of potential control variables, including perceived usefulness (PU). Appendix A Table A4 and Table A5 present the research questionnaires. Appendix A Table A6 presents the samples.
Appendix A Table A7 presents the factor loading statistics. The factor loading coefficient uses standardized data to calculate the unit eigenvector corresponding to the eigenvalues of the correlation matrix. Factor loadings reflect the importance of an item to a common factor. We tested the item’s significance in the corresponding variable by examining the factor loadings. The standard factor loadings for all items exceeded 0.5. The items explained the high variance among common factors and were considered reliable for constructing the factor structures [88]. For the control variables, most item factor loadings exceeded 0.5. Considering that we use only widely validated scales, a factor loading above 0.4 is acceptable [89,90].
We tested the internal reliability, convergent validity, and discriminant validity of the scales’ measurement results. Cronbach’s alpha was used as a priori test. Note that model validation can only be considered if the requirements for Cronbach’s alpha coefficients are met [91,92]. The test results in Appendix A Table A8 show that all variables satisfied an alpha greater than 0.7, indicating strong internal reliability of our measurement results.
The values for composite reliability (CR) and average variance extracted (AVE) indicated convergent validity, as presented in Appendix A Table A8. Previous studies have suggested that AVE values should be higher than 0.5, and CR should be higher than 0.6 [93]. The AVE scores of the PAU, PU, and perceived cost of search (PCS) were less than 0.5; the scores of other variables were above 0.5. However, we accept values up to 0.4 because Fornell and Larcker [93] proposed that if AVE is less than 0.5 and more than 0.4, but CR is higher than 0.6, the convergent validity of the construct is adequate for widely accepted scales [94]. Considering that CR was above 0.7 across all tests, the various items in our questionnaire sample were statistically convergent and consistently measured as potential psychological constructs [92].
We tested the discriminant validity of the variables with the results listed in Appendix A Table A9. We applied all items to the cross-factor loadings of the study variables. We employed Xu’s [95] testing method. The factor loadings of the component items for the corresponding variables were higher than those of the other variables. Thus, discriminant validity was confirmed.

3.3. Pretest in Study 1

The objective of this study was to assess whether the stimuli could effectively manipulate significant differences in perceived price dispersion. A total of 200 volunteers were recruited via Credamo and randomly assigned to either a high price dispersion group or a low price dispersion group, with 100 participants in each. Participants were shown a basic introduction to the hotel and asked to provide its reference price based on their previous travel experiences. Next, we presented stimulus images and descriptions, asking participants to imagine themselves as travelers planning a booking. Finally, participants completed a scale to measure their perceived price dispersion based on the presented stimuli. To enhance the generalizability of the findings, participants were not restricted to specific professions. However, they were required to have booked rooms through OTA platforms within the past 12 months and to provide basic demographic information, including age, gender, income, and education level.
The reference price represents a psychological benchmark or expectation of a commodity’s price, shaped by consumers’ past experiences or market information [96]. If subjects in different experimental groups enter with varying reference prices, their perception of price dispersion may be influenced by these initial benchmarks rather than by the experimental manipulation. We highlight the importance of eliminating differences in reference point effects to minimize the confounding impact of individual cognitive biases on experimental outcomes. The pretest results showed that there was no significant statistical difference in the initial reference prices between the two groups (M_high: 951.36 vs. M_low: 1029.17; diff = 77.81; SE = 67.86; t = 1.146; p > 0.1). The result can be viewed in Figure 2. Randomized grouping is effective in mitigating the influence of different individuals’ experiences or habits on experimental outcomes.
After randomly assigning consumers to the stimulus scenarios, we presented both groups with images and instructions illustrating price dispersion. Respondents were instructed to carefully review the materials, imagine themselves in the given scenario, and complete a scale measuring their perceived price dispersion based on their impressions. They concluded the test by providing basic demographic information. The results indicate that among homogeneous respondents, the high price dispersion scenario elicited significantly higher perceived price dispersion scores compared to the low price dispersion scenario (M_high: 6.13 vs. M_low: 4.91; diff = 1.22; SE = 0.1; t = 12.19; p < 0.01). These findings confirm that our stimulus scenarios effectively and significantly manipulated respondents’ perceived price dispersion. The result can be viewed in Figure 3.
Although the traditional theory assumes the existence of the law of one price, it is based on strict and often unrealistic conditions. Our findings demonstrate that consumers do not always opt for the lowest price in scenarios with price dispersion. Among the 200 respondents, 61 chose prices higher than the lowest price (CNY 589), favoring other, more expensive options. We compared the PI and final payment prices between two groups exposed to different levels of perceived price dispersion: a high-dispersion group and a low-dispersion group. The results show that the high perceived price dispersion group exhibited significantly higher average PIs than the low perceived price dispersion group (M_high: 6.27 vs. M_low: 6.07; diff = 0.2; SE = 0.09; t = 2.1; p < 0.05). This pattern is also reflected in their final willingness to pay, with the high group displaying a significantly greater willingness to pay than the low group (M_high: 643.41 vs. M_low: 617.22; diff = 26.22; SE = 11.53; t = 2.27; p < 0.05). These findings further support the idea that perceived price dispersion positively influences PI. Previous research suggests that higher perceived price dispersion may lead to consumer OC, subsequently reducing purchase willingness. To address the potential endogeneity of this effect in our results, we compared the high PPD group with the low PPD group and found no significant difference in OC scores (M_high: 3.76 vs. M_low: 3.85; diff = 0.09; SE = 0.22; t = 0.39; p > 0.1). These findings indicate that higher perceived price dispersion does not necessarily result in consumer OC.

3.4. Hypotheses Test in Study 1

Before conducting the SEM regression, we merged the items to construct latent variables for the regression. The congeneric approach was used to estimate factor loadings and overall reliability to ensure effective and reliable analysis. Adopting a congeneric approach, instead of parallel approaches, can provide a more accurate representation of the relationship between the project and the underlying structure because it considers the unique load of each project. This reflects that the relationship between each item and the latent variables is not purely linear but may be weighted and non-linear [97]. Our method draws on CLC estimation. First, we assumed that each latent variable corresponds to a unique factor loading and error variance for each item. We regressed the latent variables to obtain the factor loading and error variance, using them as weights to estimate the latent variables. We then used the maximum likelihood estimation method to predict and assess the latent variables [98].
To test this hypothesis, we analyzed the regression results while controlling for respondents’ income and PU. H1 posits that higher perceived price dispersion leads to increased PI. The findings reveal that perceived price dispersion significantly enhances consumers’ PI (β = 0.330, SE = 0.061, t = 5.42, p < 0.01). Consistent with our experimental design, a wider price range leads to greater perceived price dispersion, which, in turn, increases PI. Thus, setting a broader price range appears to effectively boost consumers’ PI. H2 posits a positive mediating effect of perceived transaction utility, which is strongly supported by our findings: higher perceived price dispersion significantly increases perceived transaction utility (β = 0.184, SE = 0.057, t = 3.24, p < 0.01). H3 suggests that perceived acquisition utility acts as a positive mediator between perceived transaction utility and PI. Our results confirm this hypothesis: perceived transaction utility enhances perceived acquisition utility (β = 0.609, SE = 0.062, t = 9.87, p < 0.01), and higher perceived acquisition utility leads to greater PI (β = 0.364, SE = 0.066, t = 5.49, p < 0.01). We also adjusted the control variables to test the influence of personal characteristics and found that these effects were not affected by age, gender, education level, or income (all p-values were greater than 0.05). The regression result can be viewed in Table 1.

3.5. Discussion in Study 1

In summary, Study 1 provides preliminary empirical evidence supporting our hypotheses and conceptual model. However, several limitations must be addressed. First, as the study was conducted in a simulated experimental environment, it remains unclear whether the conclusions drawn from scenario-based experiments resonate with consumers in real-world contexts. Validation of the experimental findings against real-world data is therefore necessary. Second, the controlled experimental setting allowed us to isolate price information and manage the amount of information consumers perceived, effectively minimizing the confusion caused by information overload. However, in practice, consumers’ bounded rationality often limits their motivation and ability to process all relevant information, leading to decisions that are not fully evidence-based [99]. Price dispersion frequently coincides with information complexity, which sellers exploit via OTA platforms to influence consumers toward irrational decisions [100,101,102]. Thus, it remains important to test whether our conclusions hold when accounting for the confusion caused by information overload. Third, while we have proposed a chain-like conceptual model, it does not capture all possible relationships between variables. Further research is needed to assess the robustness of the model structure.

4. Study 2

4.1. Research Method in Study 2

We conducted a survey involving hotel room bookings on OTA platforms to match the experiment. Hotel bookings present stability in product quality and service policies in practical ways. Moreover, consumers can be clearly described and accurately compared across platforms offering quality products. We assumed that consumers’ real-life experiences match our experimental results.
We considered the presence or absence of price dispersion in tourism products with similar quality attributes, controlling for endogenous variables that may arise in this study. Numerous previous studies on price dispersion in the OTA market have focused on products such as airline tickets and car rentals. However, the product lines of these products are complex, and there is service differentiation through different platforms. The uncontrolled value utility (service or specific product quality) may lead to potential endogeneity issues. For example, tickets for the same flight differ in terms of convenience fees, check-in policies, and refund and delay policies across different platforms. Therefore, by considering the same product, we may avoid the role of service and quality differentiation in price dispersion, thereby establishing a more robust mechanism inference, that is, whether PPD affects PI through a significant and robust psychological mechanism.
We used an online survey questionnaire; the method is based on judgment sampling because the research subjects are OTA platforms, and the respondents may resemble the OTA user group in terms of key characteristics. We reduced the potential interference caused by respondents’ lack of online experience. To conduct the questionnaire, the prestigious survey platform named Credamo in China was chosen. This is because OTAs more frequently target customer groups accustomed to technology and finding information or making reservations online [86]. The judgment sampling technique was used to obtain a representative sample of Chinese adult customers (i.e., individuals aged 18 or above) who had booked a hotel room through an OTA platform in the past six months. Respondents who failed the screening questions were eliminated from the sample. We obtained informed consent from the respondents and participating organizations; consent from organizations was obtained during access negotiations. A cover letter accompanying the survey clarified the study’s purpose, the voluntary nature of participation, and respondents’ right to withdraw. No inducements were used to encourage participation; confidentiality was maintained by instructing the respondents not to include their names and assuring them that only aggregated data would be reported. The respondents were asked to answer multiple-choice questions about the interval options, including the number of times they had used OTA platforms to book hotel rooms in the previous six months and number of commonly used OTA platforms or applications. Most respondents had used an OTA platform to book rooms once in the past six months (205, 98%), and at least two or more platforms were used for this purpose (207, 99%). We drew a gender-balanced sample and distributed the survey questionnaire using Credamo’s services. Our questionnaire also included four attention-check questions to identify careless responders. All survey questions included mandatory response options to avoid missing data. We measured consumer perceptions regarding price dispersion, transaction utility, acquisition utility, PI, and several control variables. Respondents were asked to log into Credamo using their mobile phones or computers and follow a set of instructions to complete the questionnaire. We invited 10 management experts to pre-check our questionnaire. Based on their suggestions, we set a reasonable time threshold (15–40 min) for the questionaries to determine abnormal answers. We eliminated respondents with extremely short response times (respondents needed to read the questions carefully and not answer hastily) and extremely long response times (to account for respondents that encountered difficulties or were distracted). Simultaneously, we checked whether there was extreme discreteness in the scores of the same variable. We identified and deleted responses with extremely inconsistent scores for a given question. Finally, we checked whether there were logically inconsistent answers in the questionnaire, such as claiming that they had used the OTA platform for booking at least once in six months but selecting zero in the type of platform used. We recruited a total of 230 questionnaires on 9 December for Study 2 using the Credamo online questionnaire platform. A total of 230 observations were collected, and 22 invalid observations were removed because of quality issues. Finally, 208 valid questionnaires remained.
The respondents were then placed in a real scenario and asked to complete the questionnaire based on their own experience. First, they were asked to play the role of tourists traveling to Macau. Next, they were required to read a basic introduction (including information on facilities, brand, star rating, and service level, presented using pictures and text) about a real vacation hotel. To ensure that the introduction did not endogenously guide consumers, all consumers read the same introduction for the same hotel. Next, we showed consumers the real prices for this hotel across different OTA platforms, preparing them to focus their attention on price factors. Subsequently, consumers were asked to rate using scales the degrees of PPD, PTU, PAU, control variables, PI, control variables, and personal characteristics.
We subsequently used STATA/MP 16.0 as a quantitative tool. As mentioned earlier, we used a CLC-SEM model to regress our conceptual model, which is a chain model. We adopted the classical method proposed by Baron and Kenny [73] and conducted multiple tests to change the combination of control variables. We chose the optimal combination of control variables to fit the estimate. Subsequently, we established a model that included the dependent variable’s direct effects to test the model’s unbiased and consistent nature. Finally, we proposed a multi-path alternative model to eliminate further endogenous explanations affecting the path.

4.2. Measurement in Study 2

The research variables included PPD, PTU, PAU, PU, and PI and were measured similarly to Study 1. We added up a range of potential control variables, including PCS and OC. The PU used Davis’ six-item scale [62,63], PCS used Jepsen’s [103] six-item scale, and OC adopted the three-item scale from Walsh et al. [71].
Similarly to Study 1, the sample characteristics are given in Appendix A Table A10, we tested our scale for internal reliability and validity. Details can be found in Table A11 and Table A12 in Appendix A, which indicate a significant fit between our scale and the sample.

4.3. Sample Description in Study 2

The observations include a total of 208 participants, 112 among them being women and 96 men. The t-test showed that the gender ratio was not significantly biased. The age of the respondents was primarily under 40 years (198, 95%). Note that, limited by the sample characteristics, the model and conclusions of this study may apply only to young generations’ consumer behavior and psychology. This issue also arises regarding education level, with 194 respondents (93%) having college-level education. The respondents were asked to answer multiple-choice questions about the interval options, including the number of times they had used an OTA platform to book a hotel room in the previous six months and the number of OTA platforms or applications used. Most respondents had used an OTA platform to book hotel rooms at least once in the past six months (205, 98%), using at least two or more platforms (207, 99%).

4.4. Descriptive Analysis in Study 2

We drew a kernel density graph of the PI for different PPD groups (Figure 4) and observed no significant differences in PI scores between the low- and mid-PPD groups. However, for the high-PPD group, the distribution of PI scores was significantly skewed to the right, indicating that consumers who perceive more significant price dispersion may have significantly higher PIs.

4.5. Hypotheses Testing in Study 2

Table 2 and Figure 5 present the regression results. As previously mentioned, we controlled PU, PCS, and OC in the regression, and income and gender were considered demographic characteristics. The results indicated that PPD positively impacts PI (β = 0.155, std = 0.058, t = 4.31, p < 0.01), which is consistent with the results of the descriptive analysis and confirms Hypothesis 1. However, we were more concerned with the dynamic path from PPD to PI. The regression results indicated that PPD significantly and positively impacts PTU (β = 0.532, std = 0.092, t = 5.78, p < 0.01). The research results suggested that Hypothesis 2 is acceptable; however, a potential endogeneity issue was whether PPD directly impacts PAU and whether we have overlooked this path. We explored this issue by further examining the path from PTU to PAU. We found that PAU can significantly mediate the impact of PTU on PI (β = 0.144, std = 0.059, t = 2.45, p < 0.05), verifying Hypothesis 3. Based on the mental account theory, the regression results inspired the following valuable chain model from our initial hypothesis: PPD directly affects PTU; and PAU mediates the effect of PAU on PI. However, the robustness of the results remained a concern. A potential alternative model needed to be considered to determine whether PPD can directly affect PAU and whether PTU directly affects PI. Next, we conducted robust tests for our conclusions.

4.6. Model Selection and Further Discussion in Study 2

We tested the model’s goodness-of-fit (GFI), including the chi-squared value, chi test probability, comparative fit index (CFI), Tucker–Lewis’s index (TLI), root mean square error of approximation (RMSEA), and GFI. We examined the model’s fitting effect to verify whether it could be better to explain the research sample and variable selection to improve our model.
First, we tested the previous model (Model 1), as shown in Table 3. In this model, the control variables PU, PCS, OC, income, and gender were controlled for. We found that the fitting effect of the model is poor. First, the hypothesis that the selected model covariance matrix matches the observed data covariance matrix was tested. The null hypothesis was that the model covariance matrix equals the sample covariance matrix. The chi-squared value divided by the degrees of freedom should be lower than 5 if the model fits well [104,105,106]. In Model 1, the chi-squared test showed a good fit (chi-square/DF = 3.013). The GFI (0.977) was above 0.9, appropriate for Model 1 [107]. However, although the CFI (0.983) of Model 1 was significantly higher than 0.95, the TFI (0.884) was lower than 0.9, indicating a poor GFI of Model 1 [104,108]. Finally, a model has good coordination if the RMSEA is below 0.08 [109]. If the indicator exceeds 0.1, the model is unsatisfactory [110]; the RMSEA of Model 1 was 0.099, significantly close to unacceptable.
To address the GFI issue, we tested five additional model forms (Models 2–6), as indicated in Table 3. Adjustment of the control variable combination did not result in a significant change in the coefficient of the mechanism path, proving the robustness of our model. This result is also a fundamental requirement for adjusting variable combinations. Our comparative results indicated that, while retaining the control variable PU, using fewer other control variables improves the model’s GFI. The most suitable model was Model 5, which controlled only for PU without adding any other control variables. The chi-square/DF test result for Model 5 was the lowest among all models (chi-square/DF = 2.548), and the model covariance matrix fitted better with the sample covariance matrix. Simultaneously, the CFI and TFI of Model 5 were significantly higher than 0.95 (CFI = 0.986, TFI = 0.958) and higher than those of other models. The GFI (0.978) of Model 5 was greater than 0.9. Moreover, Model 5’s RMSEA (0.086) was the lowest among all models; an RMSEA of below 0.1 suggests that the model is more acceptable, as highlighted by Browne and Cudeck [110].
Thus, the conclusions drawn from our model are robust, even though the form of the model is not optimal. Without considering the applicability of the theories, controlling only the PU can achieve the best model-fitting effect.

5. Discussion

5.1. Theoretical Implications

Our findings offer several meaningful implications for researchers. First, while prior marketing studies suggest that price promotion dispersion (PPD) can induce perceptions of unfairness and decision-making confusion—thereby reducing purchase willingness—little empirical work has examined its positive promotional effects. Our study demonstrates that PPD can enhance purchase intention (PI) on online travel agency (OTA) platforms, thereby providing a valuable foundation for expanding OTA pricing strategies and enriching the related literature. Further, although previous research indicates that acquisition utility dominates purchasing decisions and that transaction utility plays only a moderating role [109], our concept chain model—grounded in psychological account theory—reveals that PPD influences consumer behavior indirectly. On OTA platforms, where consumers easily access hotel quality and reference price information [86], the comparison of low prices triggers transaction utility (PTU), which in turn mediates acquisition utility (PAU). Thus, PPD primarily shapes transaction psychology without directly affecting consumers’ value judgments.
OTA platforms offer diverse services such as airline tickets [4], cruises [16], and travel packages [36]. Despite this market heterogeneity, their core marketing strategies remain consistent. Common features such as multi-channel information display [81] and the strategic manipulation of information complexity and dynamism [17] underscore this consistency. These shared characteristics suggest that our conclusions possess broad generalizability across OTA service types while offering fresh insights into pricing strategy development and consumer behavior.

5.2. Managerial Implications

China’s economy is in a significant recession cycle [61]. China’s OTA platforms are considered to have entered an era of stock competition, with a decrease in average order value and increase in marginal costs for attracting customers [111]. This indirectly decreases the profit margin of enterprises. The development of both industries, tourism and OTAs, is facing challenges. However, when the economy declines, consumers will be more cautious, and it is expected that a large portion of people will change their consumption concepts and habits in some way during the upcoming economic recession cycle [112]. Therefore, consumers are more concerned about price issues than ever before despite economic prosperity. Accordingly, more research is required to better understand consumers’ reactions to pricing strategies and whether these reactions will affect their impression and experience of hotels. Although this study was conducted using a virtual scenario, the results remain valid and relevant, as consumer psychological processes remain consistent across different purchase and consumption situations [113].
This study shows the importance of the acquisition–transaction utility pathway in generating consumers’ PI. This can help OTAs in the hotel industry understand how dispersed pricing strategies can promote and attract consumers, enhancing market competitiveness. Our model and results demonstrate the relationship between PPD and PTU, demonstrating the dominant pricing logic in the hotel industry. First, it is necessary to “retain customers with prices” [114], such as by attracting customers to see suitable prices and click on web pages, increasing browsing time, and increasing the exposure time of hotel information to customers [115]. Considering the interactions between PTU and PAU, the pleasure derived from beneficial transactions makes consumers feel that a product is more valuable. Combined with the failure of price equality strategies [19], this proves why OTA platforms and hotel suppliers should set significant price dispersion to create a stimulating consumer experience. According to the consumer confusion theory, price dispersion strategies may attract consumers only when there is no significant difference in service value. This price dispersion should be noticeable to consumers but easy to follow [69]. For example, hotels may set different prices across different platforms while enjoying different service values, which can hamper consumers’ decision-making and affect the effectiveness of pricing and promotion strategies. The consumer risk theory also supports this viewpoint. Overly complex pricing service strategies can cause consumers to worry about consumption risks or raise doubts regarding the reputation of businesses, which is not conducive to maintaining the relative competitive advantage of hotels or platforms [24].

5.3. Limitations and Future Research

One limitation of this study is its single-hotel design, in which the product quality and hotel image were fixed. Although this controlled approach helped isolate the effects of pricing strategies on consumer decision-making, it limited our ability to capture how pricing and promotional tactics might influence brand perception [27,116,117]. Future research should employ a multi-hotel framework to examine the causal impact of price dispersion on hotel brand images, thereby enhancing external validity.
A related limitation is that focusing on a single hotel prevented us from assessing differential effects of price dispersion and its mediators on purchase intentions across various hotel types. To address this, future studies should incorporate a sample of hotels with diverse characteristics, which will allow for an analysis of how property-specific factors moderate these relationships.
Although the theoretical model and its pathways were supported under controlled conditions, sufficient field evidence was not provided. The underlying mechanisms, especially the dynamics of price dispersion in actual markets, were not fully captured. Detailed simulation studies were conducted, but the full complexity of real market environments was not reflected. It is recommended that future research address this gap by integrating representative longitudinal data, such as panel data with historical prices, as external reference points. Collaborations with market stakeholders should be established to enable access to primary market data. This combined approach is expected to refine and validate the simulation results and to strengthen both theoretical and practical applications in digital marketing and consumer behavior.
The current study does not delineate the marginal boundaries between the depth and frequency effects of price dispersion, leaving unanswered whether these effects vary across traveler segments (e.g., frequent, vacation, or multinational travelers). Future research should leverage extensive secondary data to identify and analyze consumer segments based on market criteria, thereby clarifying potential differential impacts.
Whether our research findings are applicable across different types of online commerce is a considerable issue. The fact that the conclusions have not yet been extended to other online commercial platforms constitutes a limitation of our study. However, by examining similar findings across multiple studies on various platform types, such as online retail platforms and subscription-based service platforms, it is possible to infer whether this phenomenon possesses external validity. Such an approach would ultimately enhance the robustness of our conclusions.
The controlled experiments were used to examine the effects of pricing strategies on consumer decision-making. However, this experimental setup fails to capture the complexity and dynamic factors found in the real world. Simulated conditions provide control over variables; moreover, they may neglect important behavioral nuances such as emotional fluctuations (for example, changes in emotional state and customer satisfaction) and social pressures (for example, social influence and peer effects). Previous studies have shown that including variables such as consumer trust [54], perceived risk [24], and perceived price fairness [26] improves model external validity. It is recommended that future research extends the current experimental design by integrating these behavioral and social factors and by examining their interactive effects under more dynamic conditions, for example, by incorporating consumers’ sense of control and opportunism perception. The investigation of these additional variables is expected to provide a broader perspective on the development of pricing strategies and to advance consumer behavior theory.
Based on prior literature, it is argued that experienced users are more sensitive to pricing information and better at evaluating prices [117,118,119,120]. In the present study, experienced OTA users were recruited to reduce the effect of endogenous variables, for example, consumers’ subjective knowledge level [86], or consumers’ familiarity [13]. Additionally, this design is to avoid endogeneity due to consumers’ unfamiliarity with OTA booking or consumption inertia [74]. Although this approach improved internal validity, it may have limited external validity because only experienced users were selected. Previous studies suggest that customers without sufficient OTA experience may not fully perceive price dispersion [42]. Future research should include OTA users with different levels of experience (e.g., novices, intermediate users, and experts) so that the moderating role of consumer experience in pricing perception and decision-making can be better investigated.
Promotional activities, seasonal fluctuations, and consumer reviews are inherently complex and context-dependent, exhibiting considerable variability across different time periods and platforms. Although the current model integrates these theoretical linkages, it does not fully capture the intricate interactions among these external variables or their interdependence with consumers’ mental accounting processes. Consequently, future research should employ longitudinal and field-based empirical methods to more precisely delineate how temporal variations in these factors impact consumers’ reference pricing, information processing, and the reconstruction of mental accounts.

Author Contributions

Conceptualization, Z.C.; methodology, Z.C.; software, Z.C.; validation, G.S.; formal analysis, G.S.; investigation, J.Y.; resources, J.Y.; data curation, G.S.; writing—original draft preparation, Z.C.; writing—review and editing, M.G.; visualization, J.Y.; supervision, M.G. All authors have read and agreed to the published version of the manuscript.

Funding

This research received no external funding.

Institutional Review Board Statement

All participants were fully assured of their anonymity in participating in this research, why the research was being conducted, how their data were to be used, and all risks involved in participating. Ethical approval from an appropriate ethics committee was obtained in conducting the study.

Informed Consent Statement

Written informed consent was obtained from the participants to publish this paper.

Data Availability Statement

The datasets analyzed for this study can be found in Mendeley: Cao, Zihuang (2024), “Perceived_Price_Dispersion_in_OTA_PlatformsMental_Stimulation_to_Purchase_Intention_” Mendeley Data, V1, doi: 10.17632/xk6r5sjzsh.1.

Conflicts of Interest

The authors declare no conflicts of interest.

Appendix A

Appendix A.1. Direct and Indirect Effects for Study 2

We tested the direct and indirect effects of the independent variable PPD. In the previous stage of the SEM regression, we did not consider the direct effect because we aimed to investigate the psychological mechanism, that is, to explore the impact of PPD, an objective phenomenon, on PI. Therefore, defining PPD as directly affecting PI did not reveal any relevant information. These direct effects may be attributed to other factors related to PPD. However, our study of the mechanism path did not measure these factors. Given our requirements for model robustness and control over endogeneity, we assumed that the sum of the indirect and direct effects was consistent with the total effect.
After regressing PPD and PI, the total effect of the independent variables on the dependent variable was estimated as 0.155. Considering the direct effect of PPD on PI in the SEM model, as shown in Table A1 and Figure A1, the direct effect was estimated as 0.138. We also calculated the indirect effect using a three-stage coefficient value of 0.0153 (indirect effect = 0.250 × 0.532 × 0.115). The total effect was calculated as 0.153, which is consistent with the total effect obtained in the single regression. However, adopting this model with direct effects may not have been appropriate for our study.
Table A1. Path coefficients with direct effects.
PathCoefficient (Std)T-Statistic
PPD→PTU0.250 (0.056) ***4.49
PTU→PAU0.532(0.059) ***8.96
PAU→PI0.115(0.054) **2.13
Direct effect0.138(0.046) ***3.01
Note: * p < 0.1, ** p < 0.05, *** p < 0.01.
Figure A1. Path coefficient framework with direct effects.
Jtaer 20 00047 g0a1
Table A2 presents the model’s GFI. The model with direct effects is a highly saturated model, indicating that all the parameters to be estimated using this model are precisely equal to the elements in the covariance matrix [120]; therefore, the model is justly identified. The degree of fit between the data and model could not be determined [120]. This result contradicts the mechanism study. We explored the mechanism by which these phenomena could affect consumer psychology. It may be confusing if the results are further attributed to the phenomenon and unexplainable parts. Considering that we aimed to explain why PPD can affect PI, attributing it to direct effects has no explanatory power.
Table A2. Goodness-of-fit.
Chi-Square/DFCFITLIRMSEAGFI
0.07811.03200.999

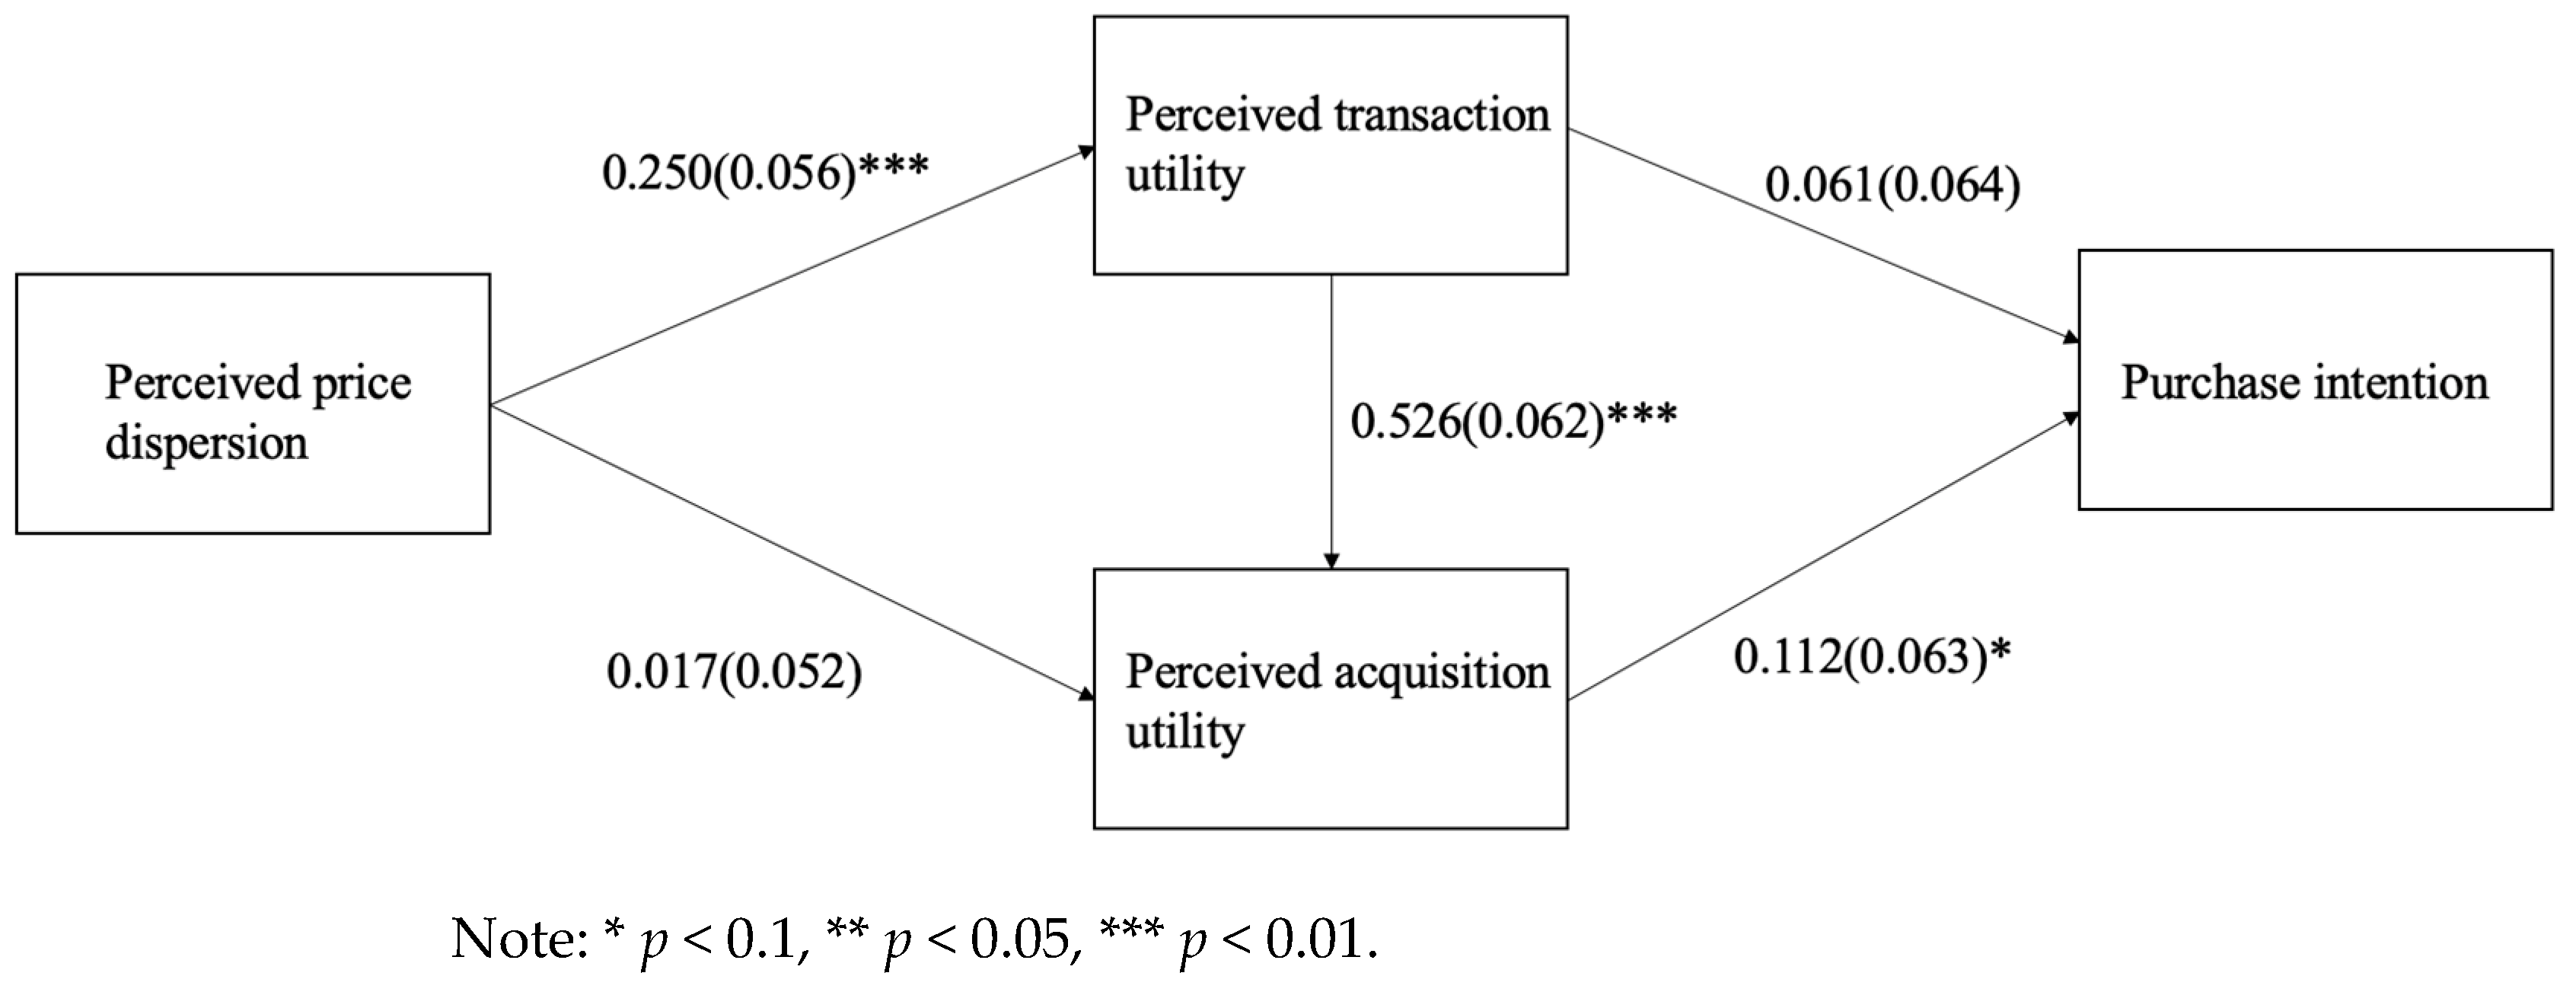
Appendix A.2. Alternative Model and Robustness Check for Study 2

In the previous section, we tested conceptual models and hypotheses. However, a potential issue is whether the chain model is a robust explanation of dynamic transmission paths or whether there exists model selection bias. Therefore, we expanded our model using the same variables as in the previous section. However, we assumed that PPD directly affects PAU and that PTU directly affects PI. Accordingly, we extended the original chain model to a dual-path mediation model. Note that this section only verifies the robustness of our original model instead of proposing a new theory.
Table A3 and Figure A2 present the regression results. We find from these that the impact of PPD on PTU remains significant (β = 0.250, std = 0.056, t = 3.96, p < 0.01). The direct effect of PPD on PAU also remains insignificant (β = 0.017, std = 0.052, t = 0.32, p > 0.1). For the mediating effect, the direct impact of PTU on PI is insignificant (β = 0.061, std = 0.064, t = 0.94, p > 0.1). Conversely, PTU significantly impacts PAU (β = 0.526, std = 0.062, t = 8.46, p < 0.01), and PAU directly affects PI (β = 0.112, std = 0.063, t = 1.76, p < 0.1). Therefore, as our hypotheses suggest, PTU is a mediating variable between PPD and PAU and PAU is a mediating variable between PTU and PI. The results demonstrate that the mechanism path of our chain model is robust.
Table A3. Path coefficients.
PathCoefficient (Std)T-Statistic
PPD→PTU0.250 (0.056) ***3.96
PPD→PAU0.017(0.052)0.32
PTU→PAU0.526(0.062) ***8.46
PTU→PI0.061(0.064)0.94
PAU→PI0.112(0.063) *1.76
Note: * p < 0.1, ** p < 0.05, *** p < 0.01.
Figure A2. Path coefficient framework of the alternative model.
Jtaer 20 00047 g0a2

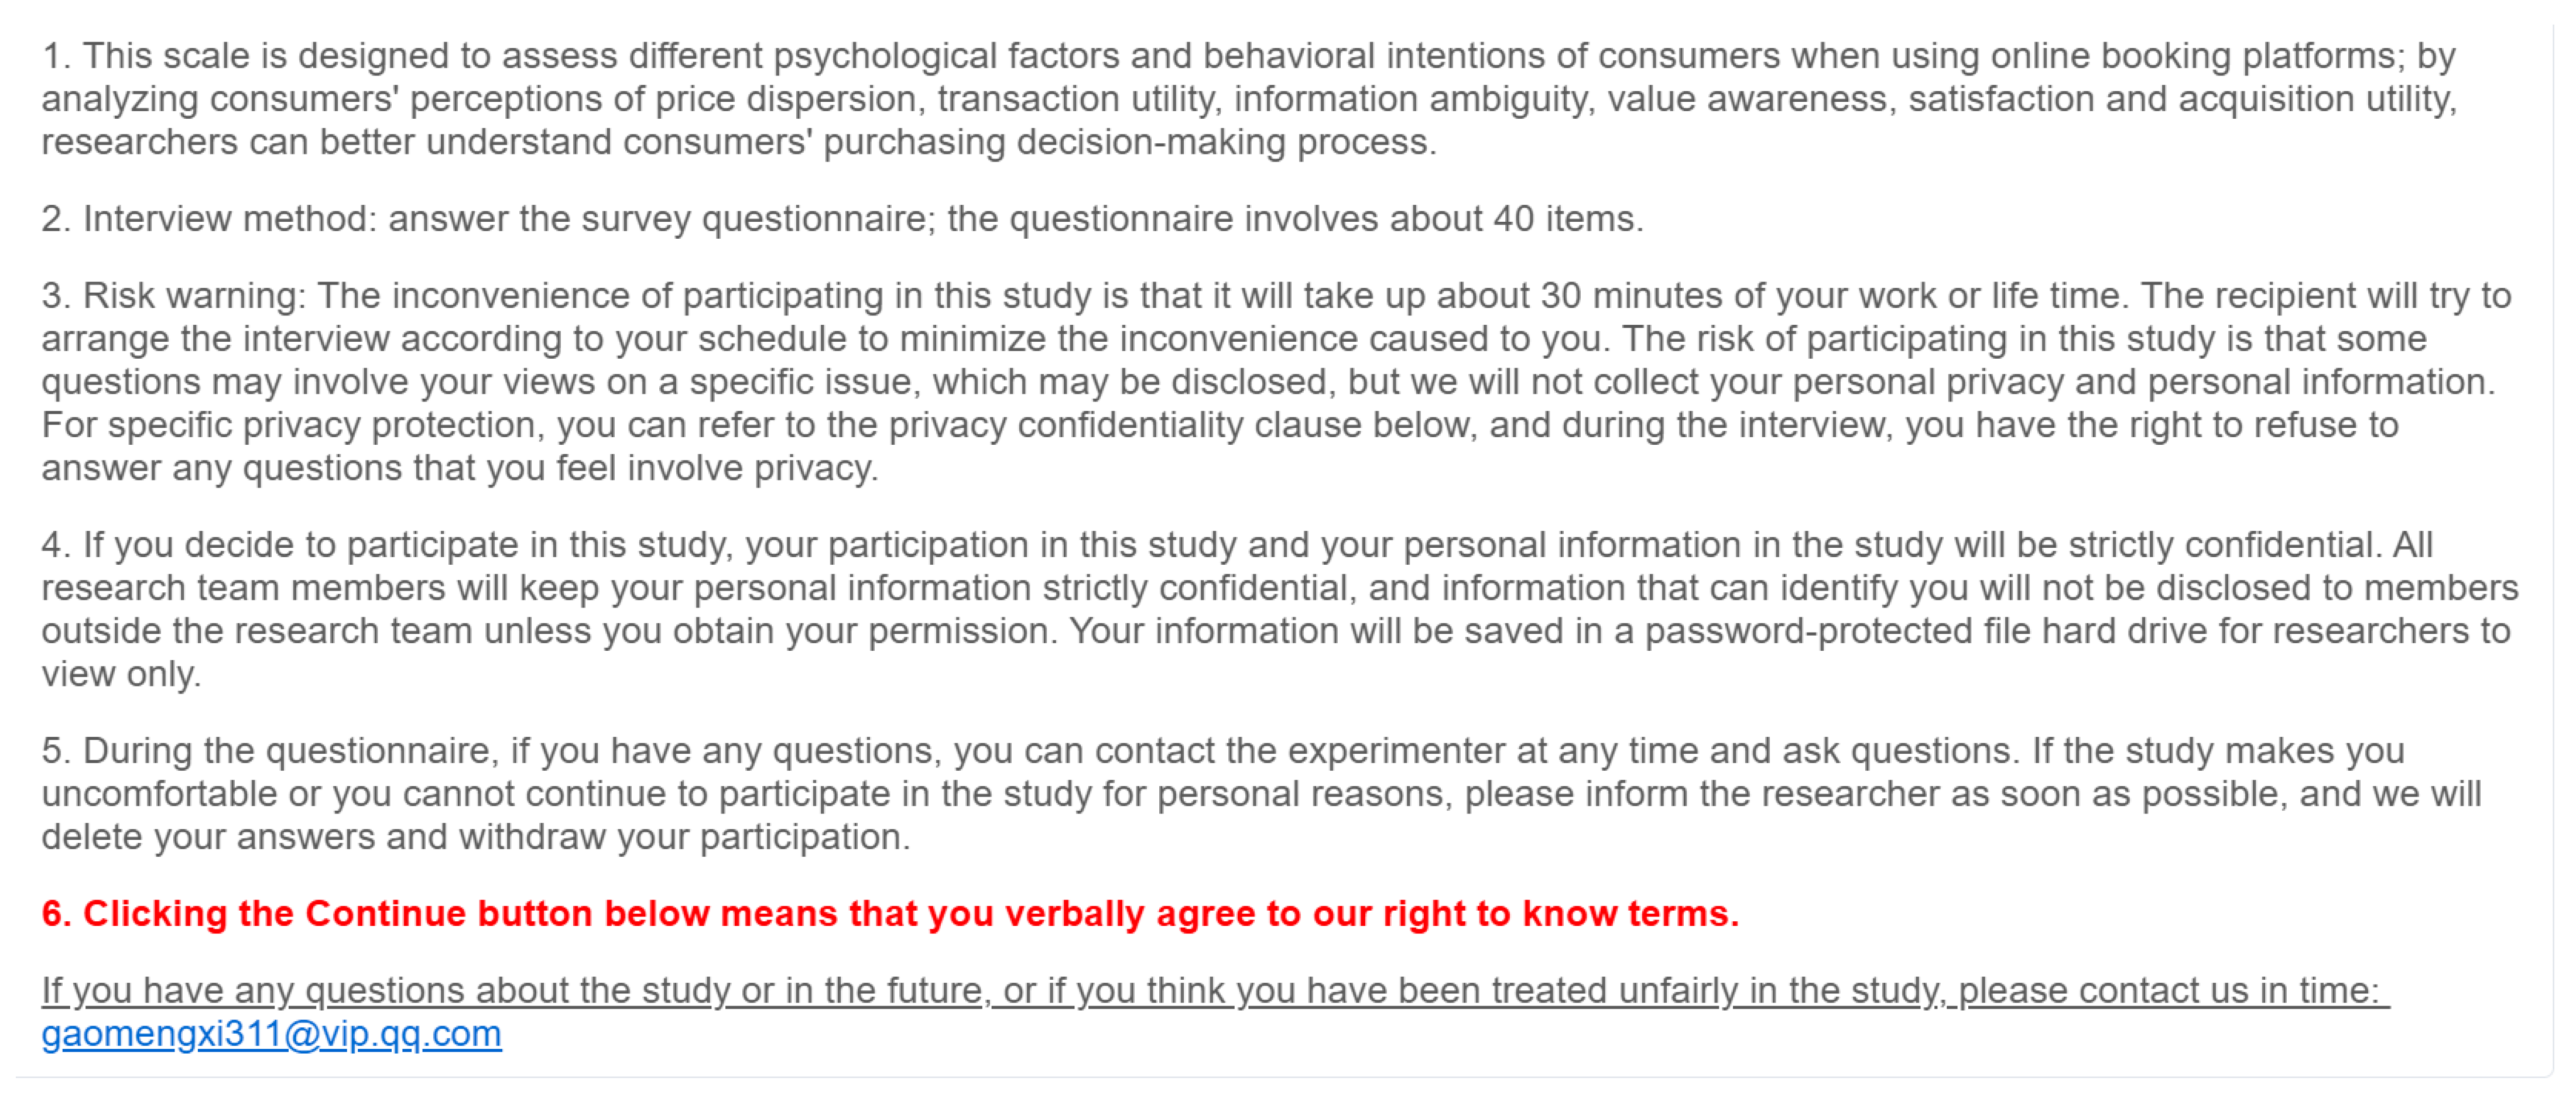
Appendix A.3. Ethics Statement

We conducted a total of three recruitment rounds, with the first one starting on 30 January 2024. We first published our questionnaire on the Credamo platform, withdrawing it on 4 February 2024. We recruited a total of 32 respondents to pretest our scale. Subsequently, we improved our scales and released our final questionnaire on the Credamo platform for the second time on 4 February 2024. We also conducted the experimental questionnaire offline on 20 February 2024, collecting a total of 204 respondents for Study 1. Then, we recruited a total of 230 respondents for Study 1 on 9 December for Study 2.
We obtained verbal consent from respondents, as approved by the ethics committee. A letter attached to the survey instrument outlined the study’s objectives and emphasized respondents’ right to withdraw at any time. No inducements were used to encourage participation, and respondents were assured that participation was entirely voluntary. To maintain anonymity, respondents were instructed not to provide their names on the survey. Respondents were informed that only group data would be reported to ensure that individual responses could not be identified. The survey was conducted online via the third-party platform Credamo and did not involve collecting any personal or private information. Only respondents’ answers to the questionnaire were collected, with no offline contact or interventions imposed during the process. Given these measures, we applied for and received the ethics committee approval to replace written consent with oral consent. Respondents were asked to review an introductory statement about information collection and privacy disclosure before proceeding. The introduction clarified that the survey aimed to gather consumer opinions on OTA platforms, outlined the survey method, assured respondents that personal identity information would not be collected, and emphasized their right to withdraw at any time. Before accessing the questionnaire, respondents were shown a “Consent Instructions” page, which informed them that agreeing to participate implied acceptance of the terms. Respondents could then decide whether to click “Continue” to proceed. Participation was restricted to individuals aged 18 and above, ensuring all respondents met the legal definition of adulthood in mainland China.

Appendix A.4. Scales Used in Studies 1 and 2

Table A4. Research variables and item codes.
Conceptual VariableItem
PPD1If I were to search this hotel around the advertised player, I would expect to come across a wide range of prices in the marketplace.
PPD2This hotel is available in the marketplace for a wide variety of prices.
PPD3If I were to book for this hotel, I would expect to come across a wide range of pieces in the market.
PTU1Taking advantage of a price deal like this makes me feel good.
PTU2I would get a lot of pleasure knowing that I would save money at this reduced sale price.
PTU3Beyond the money I save, taking advantage of this price deal will give me a sense of joy.
PAU1If l booked this hotel at this selling price, l feel l would be getting my money’s worth.
PAU2I feel that l am booking a good-quality room in this hotel for a reasonable price.
PAU3After evaluating this advertised hotel, I am confident that I am getting a quality booking for this selling price.
PAU4If I acquired this hotel booking, I think I would be getting good value for the money I spend.
PAU5I think that given this hotel’s booking, it is good value for the money.
PAU6I feel that acquiring this hotel booking meets both my high-quality and low-price requirements.
PAU7Compared to the maximum price I would be willing to pay for this hotel booking, the sale price conveys good value.
PAU8I would value this hotel booking because it would meet my needs for a reasonable price.
PAU9This hotel booking would be a worthwhile acquisition because it would help me acquire a reasonable price.
PI1I am willing to book this hotel on OTA platforms.
PI2I will probably be booking this hotel on OTA platforms.
PI3I am interested in booking this hotel on OTA platforms.
Table A5. Control variables and item codes.
Conceptual VariableItem
PU1Using OTA platforms for this booking would enable me to more quickly accomplish tasks.
PU2Using OTA platforms would improve the booking experience.
PU3Using OTA platforms for this booking would increase my booking efficiency.
PU4Using OTA platforms would enhance my effectiveness for this booking.
PU5Using OTA platforms would make it easier to book this hotel.
PU6I would find OTA platforms useful in booking this hotel.
PCS1It is cheaper to seek hotel information on OTA platforms than other places.
PCS2It is easier to seek hotel information on OTA platforms than other places.
PCS3It is less time-consuming to seek hotel information on OTA platforms than other places.
PCS4It is important to me that searching for hotel information be cheap.
PCS5It is important to me that searching for hotel information is easy.
PCS6It is important to me that searching for hotel information is less time-consuming.
OC1I do not always know exactly which booking platforms meet my needs best.
OC2There are so many platforms to choose from that sometimes feel confused.
OC3Due to the host of hotels, it is sometimes difficult to decide which one to book.

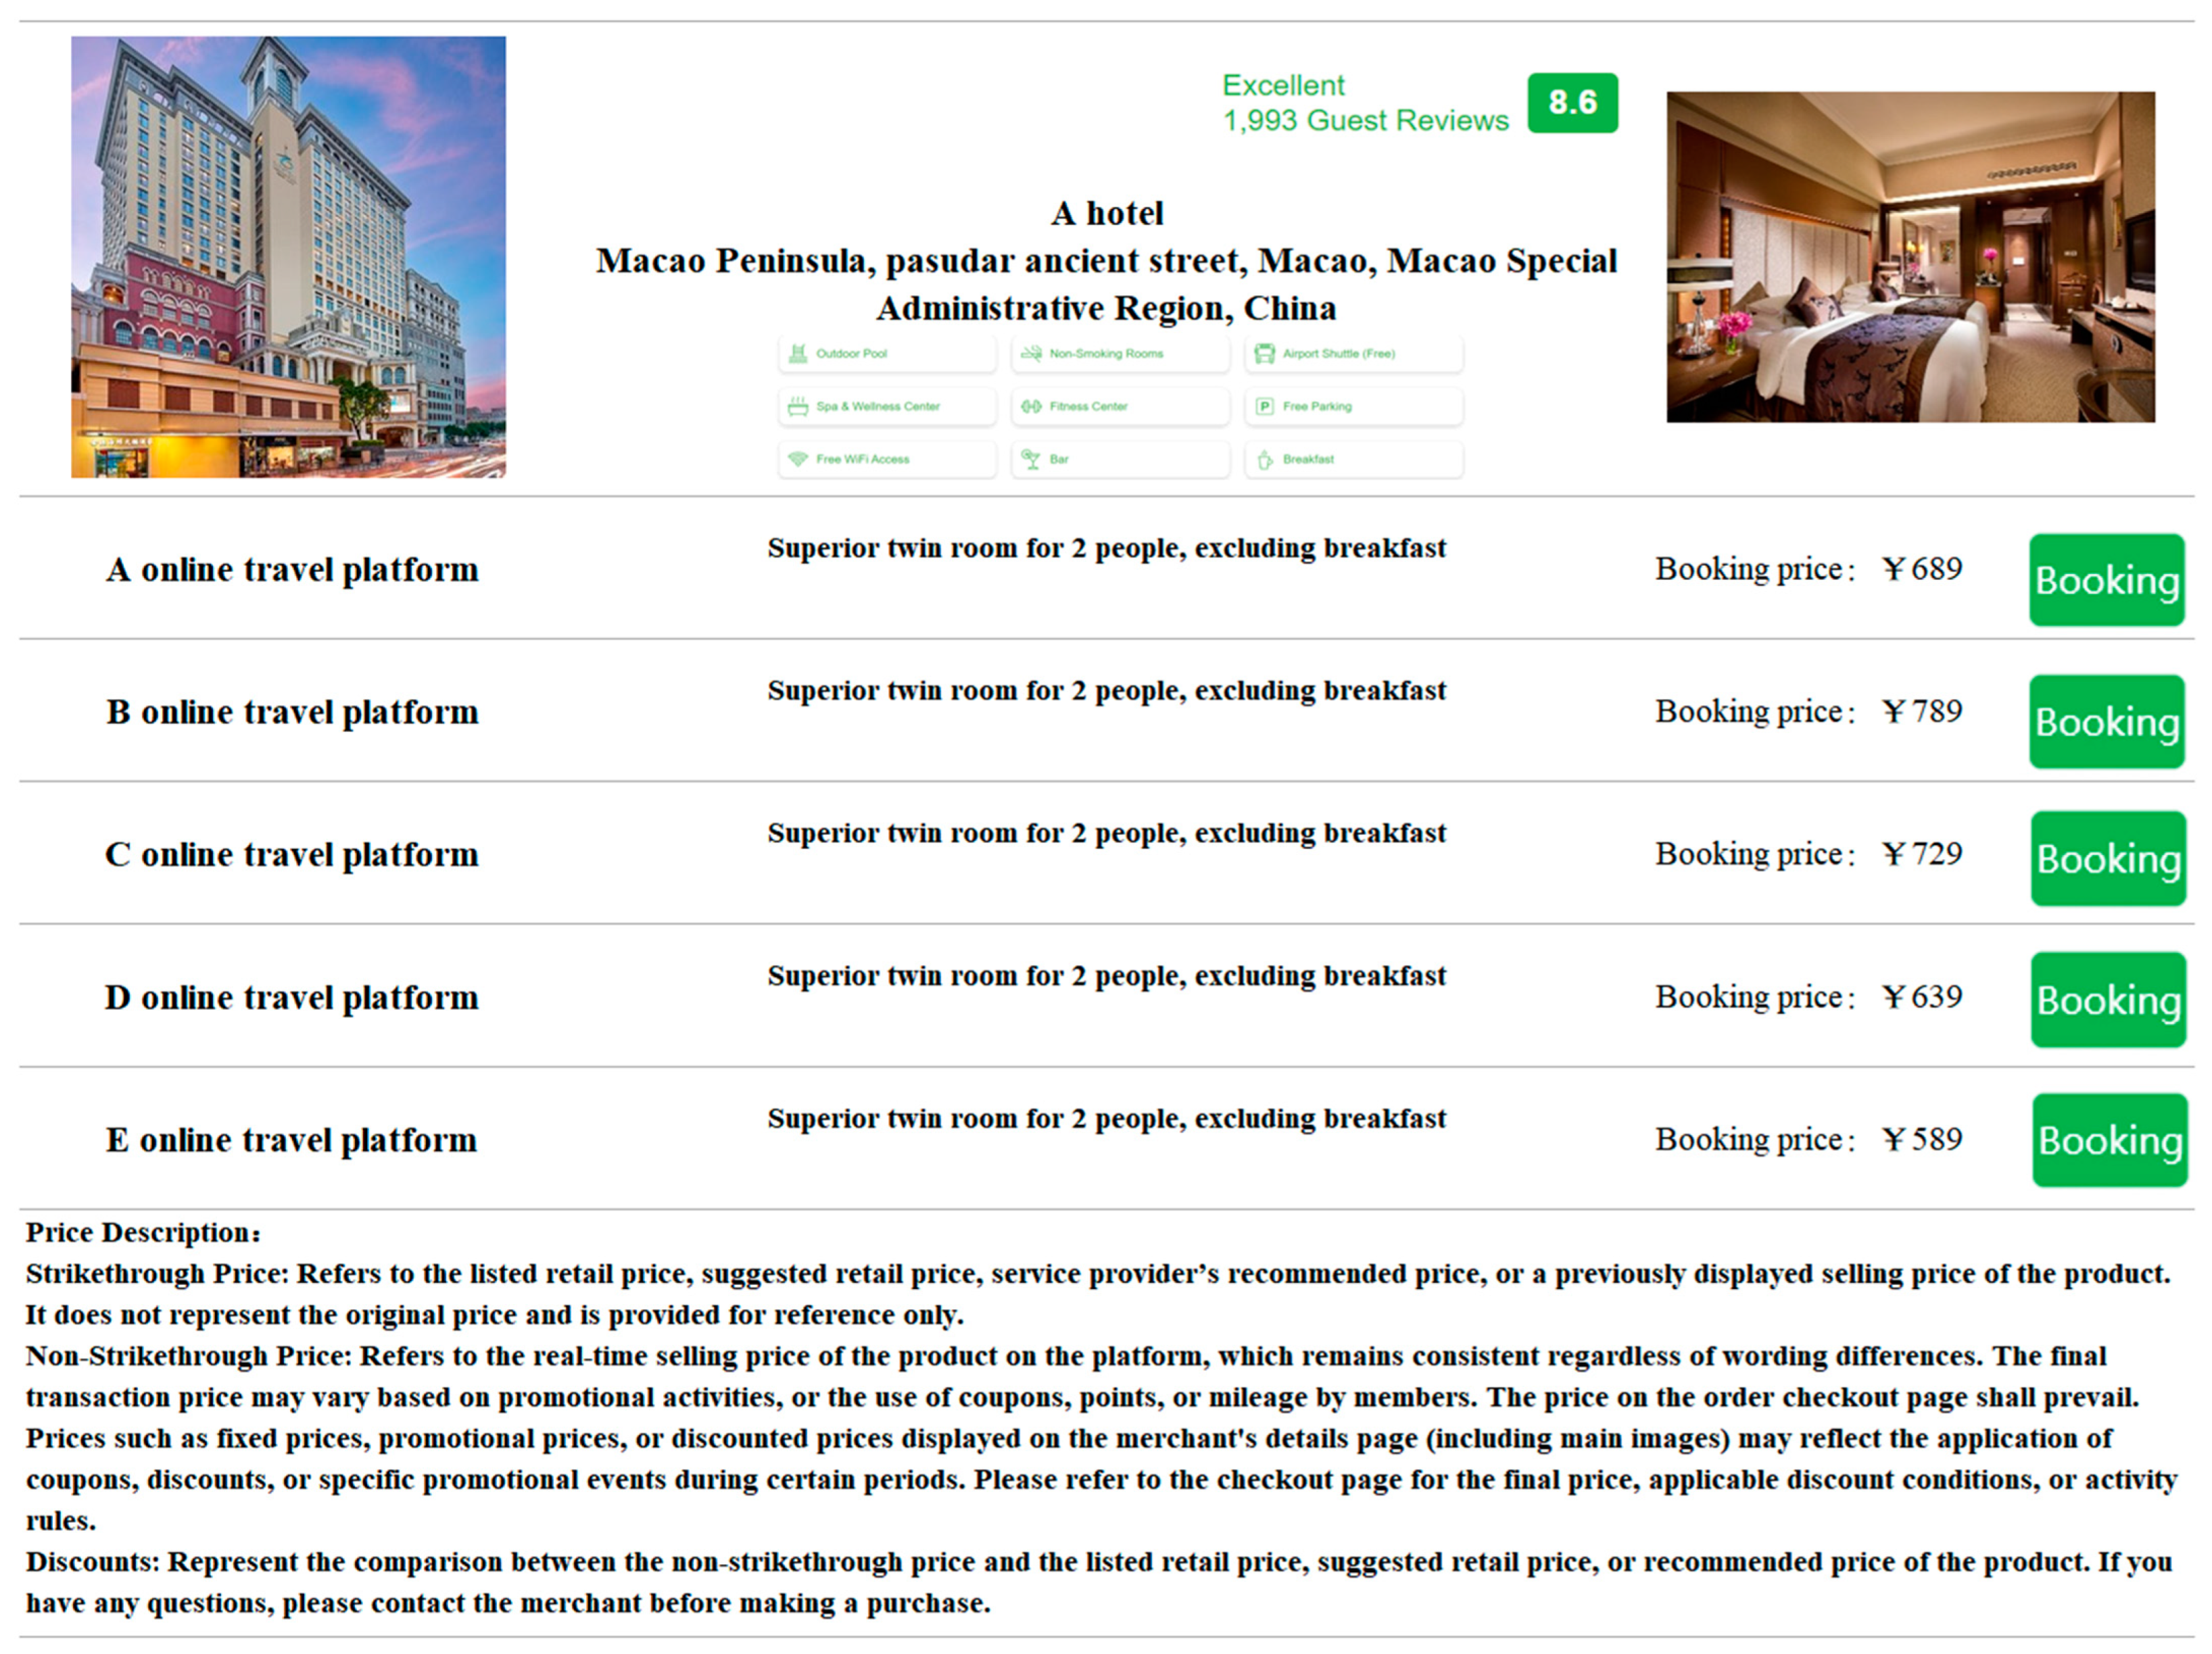
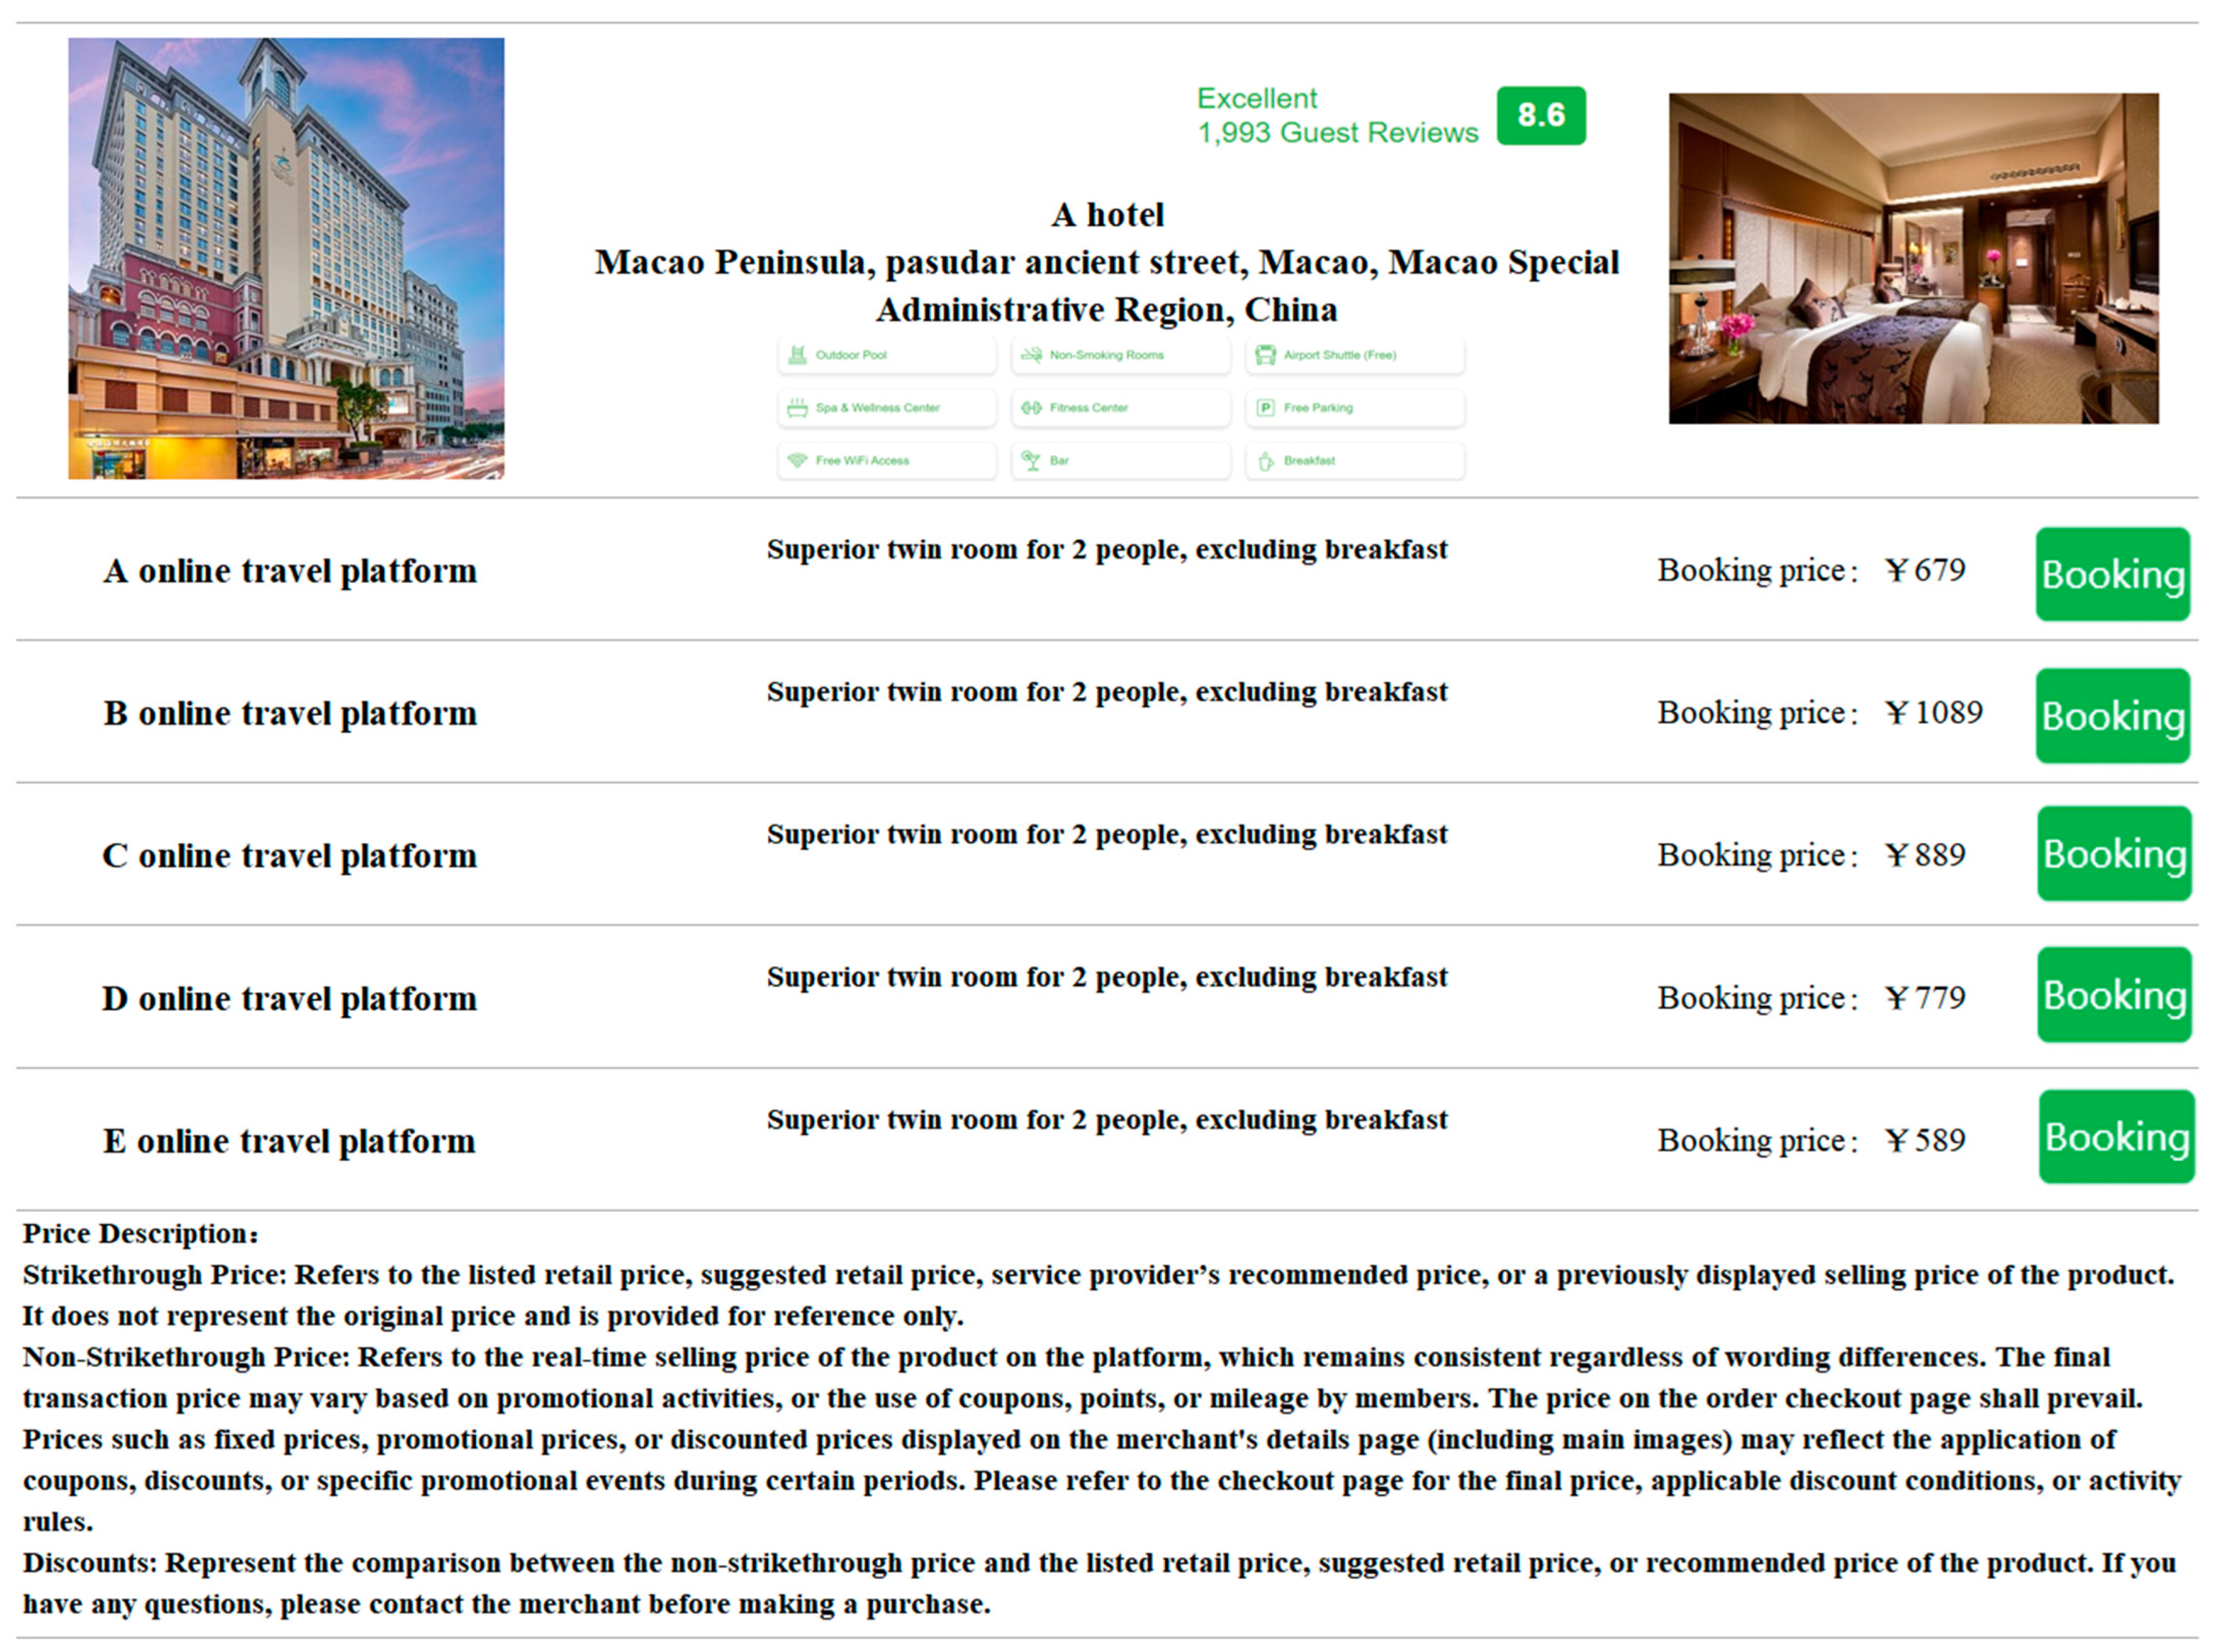
Appendix A.5. Experimental Materials Used in Study 1

Figure A3. Informed consent form for respondents.
Jtaer 20 00047 g0a3
Figure A4. Introduction to the experiment.
Jtaer 20 00047 g0a4
Figure A5. Experimental scenario: low perceived price dispersion.
Jtaer 20 00047 g0a5
Figure A6. Experimental scenario: high perceived price dispersion.
Jtaer 20 00047 g0a6

Appendix A.6. Detailed Statistics in Study 1

Table A6. Descriptive statistics in Study 1.
Characteristic VariablesCategoryFrequency (Percent)
GenderMale130 (65%)
Female70 (35%)
Age18–20 years old6 (3%)
21–30 years old101 (50.5%)
31–40 years old83 (41.5%)
41–50 years old7 (3.5%)
51–60 years old3 (1.5%)
Above 60 years old0 (0%)
Education degreeHigh school and below4 (2%)
Junior college8 (4%)
Undergraduate degree145 (72.5%)
Master’s degree or higher43 (21.5%)
Income per monthLess than CNY 300017 (8.5%)
CNY 3001–500021 (10.5%)
CNY 5001–800055 (27.5%)
CNY 8001–12,00062 (31%)
Above CNY 12,00045 (22.5%)
Number of OTA platform bookings in 6 months0 times0 (%)
1–3 times126 (63%)
4–6 times52 (26%)
7–10 times16 (8%)
More than 10 times6 (3%)
Kinds of OTA platforms or OTA apps used14 (2%)
272 (36%)
393 (46.5%)
423 (11.5%)
More than 48 (4%)
Table A7. Factor loading statistics in Study 1.
Conceptual Variable Factor LoadingStandard ErrorT-Statistics
PPD10.79270.021736.43
PPD20.84630.016052.67
PPD30.95630.0044215.22
PTU10.81840.019042.99
PTU20.74530.026727.91
PTU30.88690.011775.48
PAU10.72620.028625.32
PAU20.59920.041014.60
PAU30.62290.038816.04
PAU40.67270.034019.76
PAU50.69570.031721.91
PAU60.64350.036817.45
PAU70.55710.044812.43
PAU80.74380.026827.68
PAU90.70560.030722.94
PI10.83800.016949.41
PI20.80950.019940.52
PI30.90820.009495.69
PU10.81510.019342.05
PU20.70690.030623.08
PU30.75350.025829.14
PU40.71960.029324.53
PU50.71230.030123.67
PU60.77730.023333.25
Table A8. Internal reliability and validity in Study 1.
Variable AVECRCronbach’s Alpha
PPD0.75300.90090.8406
PTU0.67060.85870.7546
PAU0.44290.87650.8363
PI0.72740.88870.8140
PU0.56020.88400.8426
Table A9. Cross- loading statistics in Study 1.
PPDPTUPAUPI
PPD10.79270.22150.25980.3039
PPD20.84630.27100.22870.3627
PPD30.95630.21330.19210.3305
PTU10.18220.81840.58530.3367
PTU20.22860.74530.51580.3036
PTU30.23070.88690.55590.3358
PAU10.19890.53640.72620.2578
PAU20.24850.51240.59920.3242
PAU30.06520.52250.62290.2862
PAU40.15390.44540.67270.2825
PAU50.09070.39420.69570.3129
PAU60.15630.36920.64350.3409
PAU70.06760.27630.55710.2075
PAU80.22580.47170.74380.4518
PAU90.21380.48050.70560.4601
PI10.30260.40660.46060.8380
PI20.33380.34040.46180.8095
PI30.32760.29050.36650.9082

Appendix A.7. Detailed Statistics in Study 2

Table A10. Descriptive statistics in Study 2.
Characteristic VariablesCategoryFrequency (Percent)
GenderMale96 (46.15%)
Female112 (53.85%)
Age18–20 years old9 (4.33%)
21–30 years old132 (63.46%)
31–40 years old57 (27.4%)
41–50 years old9 (4.33%)
51–60 years old1 (0.48%)
Above 60 years old0 (0%)
Education degreeHigh school and below3 (1.44%)
Junior college11 (5.29%)
Undergraduate degree153 (73.56%)
Master’s degree or higher41 (19.71%)
Income per monthLess Than CNY 300042 (20.19%)
CNY 3001–500027 (12.98%)
CNY 5001–800063 (30.29%)
CNY 8001–12,00045 (21.63%)
Above CNY 12,00031 (14.9%)
Number of OTA platform bookings in 6 months0 times3 (1.44%)
1–3 times115 (55.29%)
4–6 times58 (27.88%)
7–10 times24 (11.54%)
More than 10 times7 (3.37%)
Kinds of OTA platforms or OTA apps used11 (0.48%)
242 (20.19%)
3123 (59.13%)
436 (17.31%)
More than 46 (2.89%)
Table A11. Factor loading statistics in Study 2.
Conceptual Variable Factor LoadingStandard ErrorT-Statistics
PPD10.79790.020838.36
PPD20.91520.0086106.61
PPD30.96170.0038252.04
PTU10.86010.014360.04
PTU20.82820.017746.91
PTU30.88650.011676.63
PAU10.74720.026028.74
PAU20.65720.034918.84
PAU30.68980.031721.74
PAU40.74140.026627.89
PAU50.64890.035718.19
PAU60.68060.032620.86
PAU70.57460.042413.54
PAU80.68630.032121.40
PAU90.75800.024930.43
PI10.88200.012073.28
PI20.78810.021836.12
PI30.79690.020938.11
PU10.73150.027626.51
PU20.50840.048010.60
PU30.71140.029624.03
PU40.45780.05198.83
PU50.73620.027127.15
PU60.67980.032720.79
PCS10.66020.034619.08
PCS20.70010.030722.79
PCS30.65200.035418.43
PCS40.50810.048010.58
PCS50.69640.031122.41
PCS60.72210.028525.31
OC10.84770.015654.31
OC20.97120.0029339.58
OC30.92820.0072128.26
Table A12. Internal reliability and validity in Study 2.
VariableAVECRCronbach’s Alpha
PPD0.79970.92250.8810
PTU0.73710.89370.8220
PAU0.47500.89000.8551
PI0.67800.86300.7637
PU0.41890.80760.7147
PCS0.43590.82090.7295
OC0.84110.94060.9096
Table A13. Cross-loading statistics in Study 2.
PPDPTUPAUPI
PPD10.7980.4000.2800.344
PPD20.9150.3050.2410.262
PPD30.9620.2960.2150.269
PTU10.3360.8600.5860.422
PTU20.2680.8280.5270.336
PTU30.2910.8860.5600.363
PAU10.3360.6480.7470.488
PAU20.0700.3970.6570.302
PAU30.1700.5010.6900.355
PAU40.3060.5680.7410.380
PAU50.0940.3040.6490.311
PAU60.0700.3950.6810.365
PAU70.0870.2360.5750.241
PAU80.1170.3540.6860.347
PAU90.2450.5100.7580.288
PI10.2600.4240.4730.882
PI20.2470.3320.3690.788
PI30.2520.3040.3860.797

References

  1. Clemons, E.K.; Hann, I.-H.; Hitt, L.M. Price dispersion and differentiation in online travel: An empirical investigation. Manag. Sci. 2002, 48, 534–549. [Google Scholar] [CrossRef]
  2. Larrieu, T. Pricing Strategies in Online Market Places and Price Parity Agreements: Evidence From the Hotel Industry; Mimeo Working Paper; Mimeo: New York, NY, USA, 2019. [Google Scholar]
  3. Chatterjee, P.; Wang, Y. Online comparison shopping behavior of travel consumers. J. Travel Res. 2012, 51, 61–72. [Google Scholar] [CrossRef]
  4. Roma, P.; Zambuto, F.; Perrone, G. Price dispersion, competition, and the role of online travel agents: Evidence from business routes in the Italian airline market. Transp. Res. E Logist. Transp. Rev. 2014, 69, 146–159. [Google Scholar] [CrossRef]
  5. Kim, J.; Chen, J.; Shin, H. Consumers’ price sensitivity and willingness to pay in the sharing economy: Moderating effects of temporal orientation and collectivism. J. Bus. Res. 2020, 113, 258–273. [Google Scholar]
  6. Biswas, A.; Pullig, C.; Yagci, M. The effects of price fairness perceptions on consumer purchase intentions: The moderating role of price consciousness. J. Bus. Res. 2006, 59, 949–957. [Google Scholar]
  7. André, S.; Erraoui, M.; Loutia, A.; Nannariello, E. Price dynamics and hedonic adjustment in the online market for short-term rentals. Tour. Manag. 2022, 93, 104568. [Google Scholar]
  8. Burman, B.; Biswas, A. Reference Prices in Retail Advertisements: Moderating Effects of Market Price Dispersion and Need for Cognition on Consumer Value Perception and Shopping Intention. J. Prod. Brand Manag. 2004, 13, 379–389. [Google Scholar] [CrossRef]
  9. Hunold, M.; Kesler, R.; Laitenberger, U.; Schlütter, F. Evaluation of best price guarantees: Evidence from German hotel chains. Int. J. Ind. Organ. 2020, 70, 102570. [Google Scholar]
  10. Salop, S.C.; Stiglitz, J.E. Bargains and ripoffs: A model of monopolistically competitive price dispersion. Rev. Econ. Stud. 1977, 44, 493–510. [Google Scholar] [CrossRef]
  11. Stigler, G.J. The economics of information. J. Polit. Econ. 1961, 69, 213–225. [Google Scholar] [CrossRef]
  12. Varian, H.R. Price discrimination. In Handbook of Industrial Organization; Schmalensee, R., Willig, R.D., Eds.; Elsevier: Amsterdam, The Netherlands, 1989; pp. 597–654. [Google Scholar]
  13. Lee, H.; Denizci Guillet, B.; Law, R. An examination of the relationship between online travel agents and hotels: A case study of Choice Hotels International and Expedia.com. Cornell Hosp. Q. 2013, 54, 95–107. [Google Scholar] [CrossRef]
  14. Varian, H.R. A model of sales. Am. Econ. Rev. 1980, 70, 651–659. [Google Scholar]
  15. Urbany, J.E. An experimental examination of the economics of information. J. Cons. Res. 1986, 13, 257–271. [Google Scholar] [CrossRef]
  16. Tam, C.; Pereira, F.C.; Oliveira, T. What influences the purchase intention of online travel consumers? Tour. Hosp. Res. 2024, 24, 304–320. [Google Scholar] [CrossRef]
  17. Baye, M.R.; Morgan, J.; Scholten, P. Information, search, and price dispersion. In Economics and Information Systems; Hendershott, T., Ed.; Elsevier: Amsterdam, The Netherlands, 2006; Volume 1, pp. 323–375. [Google Scholar] [CrossRef]
  18. Mohapatra, S.; Dash, S.K.; Maji, S. Consumer price sensitivity in the context of online versus offline shopping. J. Retail Consum. Serv. 2024, 70, 102128. [Google Scholar]
  19. Kim, J.; Shin, H.; Chung, K.H. Exploring consumers’ perceived risk and trust toward price comparison websites in the sharing economy: The role of need for cognition and past experience. J. Retail Consum. Serv. 2020, 53, 101947. [Google Scholar]
  20. Nicolau, J.L.; Sharma, A. To ban or not to ban rate parity, that is the question… or not? Int. J. Hosp. Manag. 2019, 77, 523–527. [Google Scholar] [CrossRef]
  21. Burdett, K.; Judd, K.L. Equilibrium price dispersion. Econometrica 1983, 51, 955–969. [Google Scholar] [CrossRef]
  22. Wilde, L.L.; Schwartz, A. Equilibrium comparison shopping. Rev. Econ. Stud. 1979, 46, 543–553. [Google Scholar] [CrossRef]
  23. Al-Matarneh, H.; Akroush, M.; Bataineh, H. The impact of online price comparison websites on consumer purchasing decisions in the Jordanian market. J. Internet Bank Commer. 2016, 21, 1–17. [Google Scholar]
  24. Zhuang, H.; Popkowski Leszczyc, P.T.L.; Lin, Y. Why is price dispersion higher online than offline? The impact of retailer type and shopping risk on price dispersion. J. Retail 2018, 94, 136–153. [Google Scholar] [CrossRef]
  25. Geyskens, I.; Steenkamp, J.-B.; Kumar, N. Generalizations about trust in marketing channel relationships using meta-analysis. Int. J. Res. Mark. 2002, 19, 223–248. [Google Scholar] [CrossRef]
  26. Zhang, Z. How price dispersion influences intention to join online group buying: The role of perceived price fairness. J. Mark. Manag. 2020, 8, 9–22. [Google Scholar] [CrossRef]
  27. Fan, Y.; Wang, Y.; Gao, S. Price fairness perceptions of Chinese online consumers in the context of price comparison websites. J. Travel Res. 2024, 63, 12–27. [Google Scholar]
  28. Manolică, A.; Guță, A.S.; Roman, T.; Dragăn, L.M. Is Consumer Overchoice a Reason for Decision Paralysis? Sustainability 2021, 13, 5920. [Google Scholar] [CrossRef]
  29. Hassan, S.; Mukhtar, S.; Qadeer, A. Consumer attitude towards online reviews in the hotel industry. J. Hosp. Tour. Technol. 2019, 10, 529–542. [Google Scholar]
  30. Kurien, H.; Sudhakar, B.; Radha, K.R. The effect of price dispersion on consumer loyalty: Evidence from the Indian airline industry. Int. J. Mark. Bus. Commun. 2014, 3, 1–14. [Google Scholar]
  31. Gourville, J.T.; Soman, D. Overchoice and assortment type: When and why variety backfires. Mark. Sci. 2005, 24, 382–395. [Google Scholar] [CrossRef]
  32. Inversini, A.; Masiero, L. Selling rooms online: The use of social media and online travel agents. Int. J. Contemp. Hosp. Manag. 2014, 26, 272–292. [Google Scholar] [CrossRef]
  33. Jung, H.; Choi, B.; Kim, T. Customer engagement and loyalty through social media: A case study of Korean luxury hotels. Cornell Hosp. Q. 2013, 54, 333–341. [Google Scholar]
  34. Xiang, Z.; Schwartz, Z.; Gerdes, J.H.; Uysal, M. What can big data and text analytics tell us about hotel guest experience and satisfaction? Int. J. Hosp. Manag. 2015, 44, 120–130. [Google Scholar] [CrossRef]
  35. Xiang, Z.; Wang, D.; O’Leary, J.T.; Fesenmaier, D.R. Adapting to the internet: Trends in travellers’ use of the web for trip planning. J. Travel Res. 2015, 54, 511–527. [Google Scholar] [CrossRef]
  36. Toh, R.S.; DeKay, C.F.; Raven, P.C. Travel planning: Search engines, OTAs, and direct hotel sites. J. Travel Tour. Mark. 2011, 28, 829–835. [Google Scholar] [CrossRef]
  37. Gazzoli, G.; Kim, W.; Palakurthi, R. Online distribution channels in the hotel industry. J. Hosp. Mark. Manag. 2008, 17, 247–262. [Google Scholar]
  38. Brynjolfsson, E.; Smith, M.D. Frictionless commerce? A comparison of internet and conventional retailers. Manag. Sci. 2000, 46, 563–585. [Google Scholar] [CrossRef]
  39. Lowengart, O. The effect of gender on price sensitivity: A meta-analysis. J. Retail Consum. Serv. 2002, 9, 223–229. [Google Scholar]
  40. Anderson, E.T.; Simester, D.I. Effects of $9 price endings on retail sales: Evidence from field experiments. Quant. Mark. Econ. 2003, 1, 93–110. [Google Scholar] [CrossRef]
  41. Wolff, F.C. Does price dispersion increase with quality? Evidence from the online diamond market. Appl. Econ. 2015, 47, 5996–6009. [Google Scholar] [CrossRef]
  42. Wang, W.; Li, F. What Determines Online Transaction Price Dispersion? Evidence from the Largest Online Platform in China. Electron. Commer. Res. Appl. 2020, 42, 100968. [Google Scholar] [CrossRef]
  43. Biswas, D.; Burman, B. The effects of product digitalization and price dispersion on search intentions in offline versus online settings: The mediating effects of perceived risks. J. Prod. Brand Manag. 2009, 18, 477–486. [Google Scholar] [CrossRef]
  44. Xia, L.; Monroe, K.B.; Cox, J.L. The price is unfair! A conceptual framework of price fairness perceptions. J. Mark. 2004, 68, 1–15. [Google Scholar] [CrossRef]
  45. Thaler, R.H. Mental accounting and consumer choice. Mark. Sci. 1985, 4, 199–214. [Google Scholar] [CrossRef]
  46. Thaler, R.H. Mental accounting matters. J. Behav. Decis. Mak. 1999, 12, 183–206. [Google Scholar] [CrossRef]
  47. Lichtenstein, D.R.; Netemeyer, R.G.; Burton, S. Distinguishing coupon proneness from value consciousness: An acquisition-transaction utility theory perspective. J. Mark. 1990, 54, 54–67. [Google Scholar] [CrossRef]
  48. Genesove, D.; Mayer, C. Loss aversion and seller behavior: Evidence from the housing market. Q. J. Econ. 2001, 116, 1233–1260. [Google Scholar] [CrossRef]
  49. Long, N.; Nasiry, J. Price fairness perceptions and the effect of a minimum price threshold. J. Retail Consum. Serv. 2015, 26, 54–61. [Google Scholar]
  50. Tversky, A.; Kahneman, D. Advances in prospect theory: Cumulative representation of uncertainty. J. Risk Uncertain. 1992, 5, 297–323. [Google Scholar] [CrossRef]
  51. Grewal, D.; Monroe, K.B.; Krishnan, R. The effects of price-comparison advertising on buyers’ perceptions of acquisition value, transaction value, and behavioral intentions. J. Mark. 1998, 62, 46–59. [Google Scholar] [CrossRef]
  52. Ye, Q.; Li, H.; Wang, Z.; Law, R. The influence of hotel price on perceived service quality and value in e-tourism: An empirical investigation based on online traveler reviews. J. Hosp. Tour. Res. 2014, 38, 23–39. [Google Scholar] [CrossRef]
  53. Spence, M. Market Signaling: Informational Transfer in Hiring and Related Screening Processes; Harvard University Press: Cambridge, MA, USA, 1974. [Google Scholar]
  54. Wei, Y.; Niu, Z.; Li, C. Consumer trust and price fairness in online hotel booking. J. Hosp. Tour. Technol. 2024, 15, 12–30. [Google Scholar]
  55. Muehlbacher, S.; Kirchler, E.; Hoelzl, E. Price unfairness and social context. J. Econ. Psychol. 2011, 32, 446–452. [Google Scholar] [CrossRef]
  56. Bateman, I.J.; Munro, A.; Rhodes, B.; Starmer, C.; Sugden, R. A test of the theory of reference-dependent preferences. Q. J. Econ. 1997, 112, 479–505. [Google Scholar] [CrossRef]
  57. Kahneman, D.; Tversky, A. Prospect theory: An analysis of decision under risk. Econometrica 1979, 47, 263–291. [Google Scholar] [CrossRef]
  58. Sajeesh, S.; Song, M. A model of price comparison site competition and its implications for retailers. Manag. Sci. 2017, 63, 2304–2315. [Google Scholar] [CrossRef]
  59. Li, M.; Zhang, Z.; Yu, J. Impact of perceived risk on consumers’ online purchase intentions: A moderated mediation model. J. Electron. Commer. Res. 2021, 22, 1–16. [Google Scholar]
  60. Law, R.; Qi, S.; Buhalis, D. Progress in tourism management: A review of website evaluation in tourism research. Tour. Manag. 2015, 31, 297–313. [Google Scholar] [CrossRef]
  61. Statistics and Census Bureau of the Macau Special Administrative Region. Tourism Statistics Report; Statistics and Census Bureau of the Macau Special Administrative Region: Macao, China, 2024.
  62. Davis, F.D. Perceived usefulness, perceived ease of use, and user acceptance of information technology. MIS Q. 1989, 13, 319–340. [Google Scholar] [CrossRef]
  63. Venkatesh, V.; Bala, H. Technology acceptance model 3 and a research agenda on interventions. Decis. Sci. 2008, 39, 273–315. [Google Scholar] [CrossRef]
  64. Venkatesh, V.; Davis, F.D. A theoretical extension of the technology acceptance model: Four longitudinal field studies. Manag. Sci. 2000, 46, 186–204. [Google Scholar] [CrossRef]
  65. Law, R.; Buhalis, D.; Cobanoglu, C. Progress on information and communication technologies in hospitality and tourism. Int. J. Contemp. Hosp. Manag. 2014, 26, 727–750. [Google Scholar] [CrossRef]
  66. Ho, C.J.; Lee, R. Price consciousness in e-commerce: Shopping at auctions and mass merchants. J. Bus. Res. 2007, 60, 564–571. [Google Scholar] [CrossRef]
  67. Kuruzovich, J.; Viswanathan, S.; Agarwal, R.; Gosain, S.; Weitzman, S. Marketspace or marketplace? Online information search and channel outcomes in auto retailing. Inf. Syst. Res. 2008, 19, 182–201. [Google Scholar] [CrossRef]
  68. Granados, N.; Gupta, A.; Kauffman, R.J. Online and offline demand and price elasticities: Evidence from the air travel industry. Inf. Syst. Res. 2012, 23, 164–181. [Google Scholar] [CrossRef]
  69. Grubb, M.D. Consumer inattention and bill-shock regulation. Rev. Econ. Stud. 2015, 82, 219–257. [Google Scholar] [CrossRef]
  70. Özkan, Y.; Tolon, M. Factors affecting hotel price fairness perceptions. J. Hosp. Tour. Manag. 2015, 25, 50–57. [Google Scholar] [CrossRef]
  71. Walsh, G.; Hennig-Thurau, T.; Sassenberg, K.; Bornemann, T. The role of culture in customer fairness perceptions when online retailers raise prices: A multilevel investigation. J. Bus. Res. 2007, 60, 240–248. [Google Scholar]
  72. Wang, C.; Shukla, P. Online consumer behavior: Influence of online customer reviews on trust, perceived price fairness, and purchase intention. J. Retail Consum. Serv. 2013, 20, 450–456. [Google Scholar] [CrossRef]
  73. Baron, R.M.; Kenny, D.A. The moderator–mediator variable distinction in social psychological research: Conceptual, strategic, and statistical considerations. J. Pers. Soc. Psychol. 1986, 51, 1173–1182. [Google Scholar] [CrossRef]
  74. Chen, Y.; Shang, R.L.; Kao, C. The effects of information overload on consumers’ subjective state towards buying decision in the internet shopping environment. Electron. Commer. Res. Appl. 2009, 8, 48–58. [Google Scholar] [CrossRef]
  75. Kim, J.; Franklin, D.; Phillips, M.; Hwang, E. Online travel agency price presentation: Examining the influence of price dispersion on travelers’ hotel preference. J. Travel Res. 2019, 59, 704–721. [Google Scholar] [CrossRef]
  76. Huber, J.; Puto, C. Market boundaries and product choice: Illustrating attraction and substitution effects. J. Consum. Res. 1983, 10, 31–44. [Google Scholar] [CrossRef]
  77. Mohammed, I.; Guillet, B.D.; Law, R. Modeling dynamic price dispersion of hotel rooms in a spatially agglomerated tourism city for weekend and midweek stays. Tour. Econ. 2019, 25, 1245–1264. [Google Scholar] [CrossRef]
  78. Kim, J.; Kim, P.B.; Kim, J.E. Different or similar choices: The effect of decision framing on variety seeking in travel bundle packages. J. Travel Res. 2018, 57, 99–115. [Google Scholar] [CrossRef]
  79. Guillet, B.D.; Mattila, A.; Gao, L. The effects of choice set size and information filtering mechanisms on online hotel booking. Int. J. Hosp. Manag. 2020, 87, 102379. [Google Scholar] [CrossRef]
  80. Liang, X.; Liu, P.; Wang, Z. Hotel selection utilizing online reviews: A novel decision support model based on sentiment analysis and DL-VIKOR method. Technol. Econ. Dev. Econ. 2019, 25, 1139–1161. [Google Scholar] [CrossRef]
  81. Roschk, H.; Loureiro, S.M.C.; Breitsohl, J. Calibrating 30 years of experimental research: A meta-analysis of the atmospheric effects of music, scent, and color. J. Retail. 2017, 93, 228–240. [Google Scholar] [CrossRef]
  82. Walters, J.; Apter, M.J.; Svebak, S. Color preference, arousal, and the theory of psychological reversals. Motiv. Emot. 1982, 6, 193–215. [Google Scholar] [CrossRef]
  83. Nicolau, J.L.; Màs, F.J. Heckit modelling of tourist expenditure: Evidence from Spain. Int. J. Serv. Indus. Manag. 2005, 16, 271–293. [Google Scholar] [CrossRef]
  84. Thai, N.T.; Yuksel, U. Too many destinations to visit: Tourists’ dilemma? Ann. Tour. Res. 2017, 62, 38–53. [Google Scholar] [CrossRef]
  85. Song, X.; Mo, Z.; Liu, M.T.; Niu, B.; Huang, L. Cooperator or supporter: How can cross-boundary Macau–Zhuhai metropolis promote regional tourism together? Asia Pac. J. Mark. Logist. 2022, 34, 2207–2236. [Google Scholar] [CrossRef]
  86. Talwar, S.; Dhir, A.; Kaur, P.; Budhwar, P. Why do people purchase online? The need for online shopping motivation and technology acceptance. Technol. Forecast Soc. Change 2020, 158, 120118. [Google Scholar] [CrossRef]
  87. Spears, N.; Singh, S.N. Measuring attitude toward the brand and purchase intentions. J. Curr. Issues Res. Advert. 2004, 26, 53–66. [Google Scholar] [CrossRef]
  88. Hair, J.F.; Black, W.C.; Babin, B.J.; Anderson, R.E.; Tatham, R.L. Multivariate Data Analysis, 6th ed.; Pearson: Hoboken, NJ, USA, 2006; pp. 103–105. [Google Scholar]
  89. Comrey, A.L.; Lee, H.B. A First Course in Factor Analysis, 2nd ed.; Lawrence Erlbaum Associates: Mahwah, NJ, USA, 1992. [Google Scholar]
  90. Stevens, J. Applied Multivariate Statistics for the Social Sciences, 5th ed.; Routledge: London, UK, 2012. [Google Scholar]
  91. Cho, E.; Kim, S. Cronbach’s coefficient alpha: Well-known but poorly understood. Organ. Res. Methods 2015, 18, 207–230. [Google Scholar] [CrossRef]
  92. Taber, K.S. The use of Cronbach’s alpha when developing and reporting research instruments in science education. Res. Sci. Educ. 2018, 48, 1273–1296. [Google Scholar] [CrossRef]
  93. Fornell, C.; Larcker, D.F. Evaluating structural equation models with unobservable variables and measurement error. J. Mark. Res. 1981, 18, 39–50. [Google Scholar] [CrossRef]
  94. Lam, R. Structural equation modeling (SEM) in hospitality and tourism research. J. Hosp. Tour. Technol. 2012, 3, 63–73. [Google Scholar]
  95. Xu, W. The application of structural equation modeling in reliability testing. Stat. Inf. Forum 2008, 23, 9–13. [Google Scholar]
  96. Rajendran, K.N.; Tellis, G.J. Contextual and temporal components of reference price. J. Mark. 1994, 58, 22–34. [Google Scholar] [CrossRef]
  97. McNeish, D.; Wolf, M.G. Dynamic fit indices for evaluating time-varying models. Multivar. Behav. Res. 2020, 55, 597–618. [Google Scholar]
  98. Waldman, A.E. Cognitive biases, dark patterns, and the “privacy paradox”. Curr. Opin. Psychol. 2020, 31, 105–109. [Google Scholar] [CrossRef]
  99. Kim, J.; Kim, S.; Lee, J.; Kim, P.B.; Cui, Y. Influence of choice architecture on the preference for a pro-environmental hotel. J. Travel Res. 2020, 59, 512–527. [Google Scholar] [CrossRef]
  100. Shugan, S.M. Brand loyalty programs: Are they shams? Market. Sci. 2005, 24, 185–193. [Google Scholar] [CrossRef]
  101. Kim, K.K.; Kim, W.G.; Lee, M. Impact of dark patterns on consumers’ perceived fairness and attitude: Moderating effects of types of dark patterns, social proof, and moral identity. Tour. Manag. 2023, 98, 104763. [Google Scholar] [CrossRef]
  102. Marzi, G.; Nobili, D.; Marzucchi, A. Digital transformation in the tourism industry: Current trends and future directions. J. Bus. Res. 2023, 154, 113–122. [Google Scholar] [CrossRef]
  103. Jepsen, A.L. Factors affecting consumer use of the Internet for information search. J. Interac. Mark. 2007, 21, 21–34. [Google Scholar] [CrossRef]
  104. Bentler, P.M.; Bonett, D.G. Significance tests and goodness of fit in the analysis of covariance structures. Psychol. Bull. 1980, 88, 588–606. [Google Scholar] [CrossRef]
  105. Marsh, H.W.; Hocevar, D. Application of confirmatory factor analysis to the study of self-concept: First- and higher-order factor models and their invariance across groups. Psychol. Bull. 1985, 97, 562–582. [Google Scholar] [CrossRef]
  106. Marsh, H.W.; Balla, J.R.; McDonald, R.P. Goodness-of-fit indexes in confirmatory factor analysis: The effect of sample size. Psychol. Bull. 1988, 103, 391–410. [Google Scholar] [CrossRef]
  107. Jöreskog, K.G.; Sörbom, D. LISRELVI: Analysis of Linear Structural Relationships by Maximum Likelihood, Instrumental Variables, and Least Squares Methods; Scientific Software: Mooresville, NC, USA, 1989. [Google Scholar]
  108. Qiu, J. Structural equation modeling: A quantitative approach to research. In Proceedings of the International Conference on Education and Information Management, Guangzhou, China, 18–20 November 2011; pp. 154–160. [Google Scholar]
  109. McDonald, R.P.; Ho, M.H.R. Principles and practice in reporting structural equation analyses. Psychol. Methods 2002, 7, 64–82. [Google Scholar] [CrossRef]
  110. Browne, M.W.; Cudeck, R. Alternative ways of assessing model fit. In Testing Structural Equation Models; Bollen, K.A., Long, J.S., Eds.; Sage Publications: Los Angeles, CA, USA, 1992; pp. 136–162. [Google Scholar]
  111. He, W.; Wang, X.; Huang, Y. The role of perceived price fairness in online hotel booking. J. Hosp. Tour. Technol. 2024, 15, 104–120. [Google Scholar]
  112. Hudson, S. The future of tourism: Insights from experts. Tour. Hosp. Res. 2020, 20, 112–122. [Google Scholar]
  113. Chesbrough, H.; Lettl, C.; Ritter, T. Value propositions for digital transformation in tourism: The role of business models. Tour. Hosp. Res. 2018, 18, 239–250. [Google Scholar]
  114. Reibstein, D.J. What attracts customers to online stores, and what keeps them coming back? J. Acad. Mark. Sci. 2002, 30, 465–473. [Google Scholar] [CrossRef]
  115. Noone, B.M.; Robson, S.K. Customer experience in hotel booking channels: An exploratory study of mobile apps. J. Hosp. Mark. Manag. 2016, 25, 265–281. [Google Scholar]
  116. Wen, J.; Huang, S.; Goh, E. Effects of perceived risk and trust on purchase intention in the online hotel booking context. J. Hosp. Tour. Manag. 2021, 46, 110–118. [Google Scholar]
  117. Bin, S. Social Network Emotional Marketing Influence Model of Consumers’ Purchase Behavior. Sustainability 2023, 15, 5001. [Google Scholar] [CrossRef]
  118. Tanford, S.; Baloglu, S.; Erdem, M. Travel Packaging on the Internet: The Impact of Pricing Information and Perceived Value on Consumer Choice. J. Travel Res. 2012, 51, 68–80. [Google Scholar] [CrossRef]
  119. Deng, M.; Gu, X. Information Acquisition, Emotion Experience and Behaviour Intention During Online Shopping: An Eye-Tracking Study. Behav. Inf. Technol. 2021, 40, 635–645. [Google Scholar] [CrossRef]
  120. Wu, M.L. Structural Equation Modeling: Operations and Applications of AMOS; Chongqing University Press: Chongqing, China, 2009. (In Chinese) [Google Scholar]
Figure 1. Research framework.
Jtaer 20 00047 g001
Figure 2. Mean-variance test of the initial reference price mean value between high and low PPD scenarios.
Jtaer 20 00047 g002
Figure 3. Mean-variance test of perceived price dispersion average score between high and low PPD scenarios.
Jtaer 20 00047 g003
Figure 4. Kernel density estimation of purchase intention for different perceived price dispersion levels.
Jtaer 20 00047 g004
Figure 5. Path coefficient framework in Study 2.
Jtaer 20 00047 g005
Table 1. Path coefficients in Study 1.
PathCoefficient (Std)T-Statistic
PPD→PI0.330 (0.061) ***5.42
PPD→PTU0.184 (0.057) ***3.24
PTU→PAU0.609 (0.062) ***9.87
PAU→PI0.364 (0.066) ***5.49
Note: * p < 0.1, ** p < 0.05, *** p < 0.01.
Table 2. Path coefficients in Study 2.
PathCoefficient (Std)T-Statistic
PPD→PI0.155(0.046) ***3.34
PPD→PTU0.250 (0.058) ***4.31
PTU→PAU0.061 (0.092) ***5.78
PAU→PI0.144(0.059) **2.45
Note: * p < 0.1, ** p < 0.05, *** p < 0.01.
Table 3. Model goodness-of-fit comparison in Study 2.
Model 1Model 2Model 3Model 4Model 5Model 6
PPD→PTU0.249 (0.056) ***0.247 (0.055) ***0.232 (0.056) ***0.233 (0.056) ***0.239 (0.056) ***0.256 (0.056) ***
PTU→PAU0.532 (0.059) ***0.532 (0.060) ***0.522 (0.059) ***0.520 (0.059) ***0.550 (0.061) ***0.562 (0.060) ***
PAU→PI0.144 (0.054) ***0.144 (0.054) ***0.143 (0.054) ***0.145 (0.054) ***0.202 (0.054) ***0.203 (0.054) ***
Chi-square/DF3.0132.9512.7892.6292.5482.685
CFI0.9830.9840.9850.9860.9860.085
TLI0.8840.9030.9250.9450.9580.925
RMSEA0.0990.0970.0930.0890.0860.090
GFI0.9770.9770.9780.9790.9780.977
PUControlledControlledControlledControlledControlledControlled
PCSControlledControlledControlledControlledNot controlledNot controlled
OCControlledControlledControlledNot controlledNot controlledNot controlled
IncomeControlledControlledNot controlledNot controlledNot controlledControlled
GenderControlledNot controlledNot controlledNot controlledNot controlledControlled
Note: * p < 0.1, ** p < 0.05, *** p < 0.01.
Disclaimer/Publisher’s Note: The statements, opinions and data contained in all publications are solely those of the individual author(s) and contributor(s) and not of MDPI and/or the editor(s). MDPI and/or the editor(s) disclaim responsibility for any injury to people or property resulting from any ideas, methods, instructions or products referred to in the content.

