Article

How AI Brand Endorsers Influence Generation MZ’s Consumer Behavior in Metaverse Marketing Scenarios

1
College of Media and International Culture, Zhejiang University, Hangzhou 310058, China
2
Future Imaging Laboratory, Innovation Center of Yangtze River Delta, Zhejiang University, Jiaxing 314100, China
3
School of Literature, Zhejiang University, Hangzhou 310058, China
4
School of Television and Audiovisual Arts (Documentary School), Communication University of Zhejiang, Hangzhou 310058, China
5
Department of Design Media, Zhejiang Fashion Institute of Technology, Ningbo 315000, China
6
Academy of Fine Arts, Beihai University of Art and Design, Beihai 536000, China
*
Author to whom correspondence should be addressed.
These authors contributed equally to this work.
J. Theor. Appl. Electron. Commer. Res. 2025, 20(2), 82; https://doi.org/10.3390/jtaer20020082
Submission received: 21 October 2024 / Revised: 7 April 2025 / Accepted: 8 April 2025 / Published: 24 April 2025
(This article belongs to the Topic Digital Marketing Dynamics: From Browsing to Buying)

Abstract

:
With the rapid development of metaverse technology in the marketing field, it has become increasingly important to understand consumer purchase intentions for AI Brand Endorsers (AIBEs) within this digital environment. Based on cognitive–affective–behavioral (CAB) theory, this study constructs a new theoretical framework to explore the key factors influencing consumer purchase intentions for AIBE-recommended products in the context of the metaverse. We conducted an online survey with 302 Generation MZ consumers who have purchasing experience, employing Partial Least Squares Structural Equation Modeling (PLS-SEM) for in-depth data analysis and model evaluation. Additionally, we performed Multi-Group Analysis (MGA) to reveal differences among various occupations and generations. The findings indicate that attractiveness (ATT), anthropomorphism (ANT), and interactivity (INT) significantly influence hedonic motivation (HM) and social presence (SP). Furthermore, authenticity (AUT) positively affects both SP and trust in AIBEs (TAI). Consumer purchase intention (PI) is significantly impacted by SP but is not directly influenced by HM and TAI. Notably, technology readiness (optimism and innovativeness) positively and significantly influences consumer PI but does not alter the potential moderating effects of HM, SP, and TAI. This study not only broadens and deepens the application of CAB theory but also elucidates the potential development of AIBEs in future metaverse research, providing practical implications and guidance for marketers to enhance consumer purchase intentions and boost product sales.

1. Introduction

In light of the growing prominence of the metaverse, artificial intelligence, and other digital trends, society is moving towards increasing digitization, digital convergence, and inclusivity. The concept of the metaverse has become the focus of extensive discussion among marketers, educators, researchers, and the global technology sector [1]. As an open, immersive, and highly interactive virtual world, the metaverse is influencing industries and revolutionizing the way consumers interact with global brands. This unique, innovative, and social experience provides consumers with a rich brand experience and an environment to customize their products and make them feel that the brand values their needs. In addition, it has inspired global brands to further explore ways to achieve better market performance through enhanced consumer brand engagement, optimized marketing strategies, and increased revenue [2]. For example, Gucci, ZARA, Nike, Vans, Louis Vuitton, and Burberry have connected with consumers in the metaverse through virtual showrooms, fashion shows, and virtual fitting rooms [3], allowing consumers to experience and perceive the brand’s products more intuitively in an immersive environment [4].
AI virtual influencers (AIVIs), as key elements in the world of the metaverse, have become one of the most talked-about marketing trends and are widely regarded as an important part of the future of marketing, advertising, and business, based on the innovative construction of advanced AI technologies [5]. Existing studies also emphasize that the advertising and entertainment industries are currently leading the trend of AIVI usage, with AIVIs often being frequently used to promote various branded products [6,7,8]. Different from Human Brand Endorsement (HBE), AIVIs have greater advantages in engaging consumers and delivering brand messages and are rapidly gaining prominence in the field of digital marketing [6]. As a necessary element in the evolution of advertising communication in the context of digital transformation [9], an increasing number of global brands are utilizing AIVIs as brand advocates in their global brand marketing campaigns. In this research, AI Brand Endorsers (AIBEs) are defined as virtual characters or avatars generated by computer programs or AI technology, aiming to interact with consumers through digital platforms, deliver and promote brand messages, and enhance consumer engagement and purchase intention, while enhancing their intelligence and interactivity by virtue of AI technology. The current top streaming AIBEs are Lu do Magalu, Lil Miquela, Shudu, Guggimon, Imma, and Liu Yexi [10]. The Brazilian AIBE Lu do Magalu, one of the most popular AIBEs in the world, has had 7.3 million followers on TikTok, 6.93 million followers on Instagram, and 2.81 million followers on YouTube since its debut on YouTube in August 2009, as of 24 April 2024 [11]. These data clearly show that AIBEs have significant influence and marketing potential in social networks. However, a noteworthy phenomenon is that 57% of AIBEs are losing followers; for example, Lil Miquela lost almost 3 million followers [12]. Thus, while AIBEs offer great opportunities and appeal for brands in the marketing arena, they also face criticisms and concerns that cannot be ignored.
The cognitive–affective–behavioral (CAB) framework has its origins in early rationality-focused decision-making models, with subsequent developments incorporating affective aspects for exploring the interactions and influences between cognitive, affective, and behavioral factors in consumer experiences [13]. This theoretical framework has been widely adopted in the field of marketing and advertising, providing an important theoretical basis for understanding and predicting consumer purchase behavior [14] and, at the same time, providing brand marketers with insights that help them develop more efficient strategies [15]. The framework suggests that cognitive processes directly influence affective responses, which in turn drive specific behaviors [16].
There is a growing number of studies on AIBEs in academia [17,18,19,20]. However, exploring consumers’ purchase intention for AIBE-recommended products in the context of the metaverse is still relatively limited. To fill this research gap, this study has the following innovations and contributions. First, most of the existing studies use Social Cognitive Theory (SCT) [21], SOR model [22], ECM [23], Flow model [24], and TAM [25] as the theoretical frameworks to construct models to study AIVIs. We build on Thomas and Fowler’s [20] study to expand the marketing field of AI’s application by utilizing AIVIs as a brand endorser and, for the first time, using the CAB framework to analyze how AIBEs affect consumers’ purchase intention. Second, given that AIBEs are an innovative AI technology and that consumer technology readiness plays a key role in its marketing effectiveness, we considered the positive factors of technology readiness (optimism and innovativeness) as moderating variables of consumer affect and behavior. Third, most previous AIBE studies have focused on social media environments and have not delved into the more immersive and interactive environments of the metaverse [3]. Fourth, most of the literature analyzes the effects of AIBEs mainly from cognitive and behavioral perspectives, while fewer studies have examined their affective perspective [26]. Our study echoes Yan et al. [26] by emphasizing the importance of affective factors in mediating the effects of AIBE characteristics (attractiveness, anthropomorphism, interactivity, and authenticity) on purchase intention through affective factors (hedonic motivation, social presence, and trust in AIBEs). Finally, unlike past studies that were limited to the consumer purchase behavior of all consumer groups, this study more comprehensively considered the purchase intentions of consumers of different generations and occupations for AIBE-recommended products. Therefore, exploring the marketing mechanism and effectiveness of AIBEs as a brand endorsement strategy is not only a topic worthy of in-depth research [19] but also has important practical application value.
This study aims to build a new theoretical model by integrating the cognitive–affective–behavioral (CAB) framework while incorporating the moderating role of technological readiness to explore the impact of AI Brand Endorsers (AIBEs) on consumer purchase intention in the context of the metaverse. We conducted a questionnaire survey with 302 Gen M and Gen Z Chinese consumers. The hypotheses and models were validated using PLS-SEM. From a theoretical perspective, this research provides a new empirical study on how AIBEs can increase consumers’ purchase intention, extends the existing marketing theoretical framework, and provides a stronger theoretical basis and a clearer direction for future research. From a practical perspective, this study provides effective insights for developers and marketers to optimize the metaverse platform and its endorsement marketing strategies. In response to the above, this study is designed to address the following four questions: (1) What cognitive and affective factors influence consumer purchase behavior of AIBE-recommended brand products? (2) How do these factors interact and influence each other? (3) Does technology readiness have a moderating effect on the relationship between affective factors and behavior factors? (4) How do consumers’ purchase intentions for AIBE-recommended products vary across generations and occupations?
The structure of the rest of this paper is as follows: Section 2 provides an extensive review of the relevant literature. Section 3 presents the research hypotheses and constructs the model. Section 4 describes the research methodology in detail, including the creation of the questionnaire, data collection, and analysis methods. Section 5 presents the empirical results. Section 6 presents the discussion. Section 7 summarizes the research implications, limitations, and future directions.

2. Literature Review and Hypothesis Development

2.1. The Metaverse and AI Brand Endorsers (AIBEs)

The metaverse is a highly immersive and spatial-temporally transversal virtual shared space that blends the trinity of the physical world, human activities, and digital environments [27]. In recent years, scholars have conducted extensive research on the metaverse across multiple disciplines, including marketing, education, business, healthcare, tourism, and culture [28]. Dwivedi et al. explore the broad business implications of the metaverse in digital marketing, advertising, brand management, service innovation, and consumer well-being, emphasizing its research potential in these areas [29]. Metaverse emergence enables brands and marketers to build stronger connections with consumers through innovative approaches, leading to more engaging interactive experiences and collaboration opportunities, increasing global brand exposure, and enabling consumers to transcend physical boundaries and interact with brands in new virtual ways [30].
AI virtual influencers (AIVIs) play an important role in the metaverse, providing a conduit for human virtual experiences and facilitating effective communication between the physical and virtual worlds, which has far-reaching implications for marketing and brand ecosystems [1]. With the rapid development of AI technology, AIVIs have been widely used in the financial industry, entertainment and gaming, online shopping, social media, digital healthcare, education and science, brand marketing, live broadcasting, and TV programs [12]. Current AIVIs are mainly categorized into various forms such as AI idols, AI anchors, AI assistants, AI employees, AI models and AI Brand Endorsers (AIBEs) [1]. Global brands are increasingly focusing on the potential of AIVIs as a brand marketing tool by partnering with AIVIs [31] to promote and advertise their brands on social media and metaverse virtual platforms to enhance consumer engagement and brand loyalty, which has attracted widespread attention, especially among highly digitized Generation MZ consumers. Based on previous studies, we categorized AIBEs into human-like AIVIs, animated human AIVIs, and non-human AIVIs [26]. Table 1 shows information on AIBEs on social media from different countries as of 24 April 2024, which was compiled from social platforms such as Instagram, TikTok, and Weibo and the related literature. Vila-López et al. analyzed 1740 documents through bibliometrics and found that existing AIVI research focuses on marketing, communication, and psychology, highlighting the importance of AIVIs in marketing [32]. Lou et al. concluded that AIVIs facilitate brand image and brand awareness, which in turn promotes brand promotion, marketing, and communication and enhances consumers’ emotional connection and interactive experience [33]. Table 2 summarizes the empirical studies of AIVIs in different fields in recent years.
AIBEs are gradually replacing Human Brand Endorsers (HBEs) and generating the same branding effects as HBEs, providing a variety of significant advantages for the digital marketing of brands [20]. First, AIBEs overcome the temporal and spatial limitations of HBEs and are able to efficiently accomplish branding tasks on various metaverse platforms from anywhere at any time, significantly reducing operational costs [35]. Secondly, AIBEs are able to create a more immersive and interactive user experience on the metaverse platform, enhancing the relationship between brands and consumers. In addition, AIBEs have been able to consistently keep brands fresh with its unique innovative ability and rich database, which has won the trust of consumers and attracted widespread attention [19]. Finally, AIBEs can always maintain a consistent brand image and messaging, avoiding the risks and uncertainties associated with changes in HBEs’ image and behavior. Reviewing previous academic research, Moustakas et al. [40] explored the potential challenges of AIBEs in marketing from the perspective of an expert in the field of digital media, emphasizing the fact that AIBEs can provide a higher level of reliability and predictability to the brand experience. Huang et al. used a quasi-replication approach to explore how VIBE characteristics affect consumers’ purchase intentions for clothing [41]. Yu et al. [42] developed a comprehensive framework to explain the advantages and risks of AIBEs in brand marketing and their potential operational mechanisms. Franke et al. [35] state that AIBEs can inject more novelty into brand advertising. Thus, the promotion of products and services through the metaverse can create a new interactive and collaborative experience in which AIBEs will play a key role [43].
Moreover, this study takes Gen M (1980–1994) and Gen Z (1995–2009) Chinese consumers as core survey respondents for the following main reasons: (1) they were born in the era of the information technology boom and are digital natives and major consumers of social media [25]; (2) they are usually positive and optimistic about AI technology and are willing to use AI technology products extensively in their life and work [44]; (3) as the main purchasing power in the current marketing management, these groups are avant-garde and willing to pay for novel and personalized products [42]. Generation MZ is therefore the most attractive target group for AIBEs and is more likely to buy products recommended by AIBEs.

2.2. Cognitive–Affective–Behavioral Framework

The cognitive–affective–behavioral (CAB) framework originates from the field of cognitive psychology and is primarily a theory used to understand an individual’s attitudes by linking the cognitive, affective, and behavioral dimensions to reveal how these factors interact and together influence an individual’s decision making and behavior [45]. The CAB framework describes the intrinsic mechanism from cognitive to behavioral intentions and provides a new perspective for understanding decision-making behavior [13]. In previous research on AIBEs, the cognitive perspective usually focuses on credibility, authenticity, and information quality; the affective perspective mainly focuses on consumers’ emotional attitudes toward AIBEs; and the behavioral perspective examines factors such as consumer engagement, social interaction of the classes, word of mouth, and purchase intention [26].
Researchers have also frequently used the CAB framework as a theoretical foundation in different contexts. Gursoy confirmed that consumers’ cognitive and affective factors towards AI devices jointly influence their behavioral intentions [46]. Wang et al., based on the CAB framework, found that consumers’ positive affective experience enhances the effect of cognitive appraisal, which influences their use of AI voice assistants and promotes purchase behavior [47]. Lim and Kim argued that online consumers are affectively influenced in e-commerce transactions, and therefore, it is important to utilize consumer affect to develop an e-marketing strategy, which in turn enhances the shopping experience [14]. Chen and Girish investigated the consumer experience brought by service robots in Taiwan’s restaurants through the CAB framework and showed through empirical research that affect and satisfaction can positively and significantly influence consumer acceptance behavior [48]. Soomro et al. collected data from cellular mobile network brand owners and used the CAB framework to explain that consumers with different mindsets generate unused behavioral intentions through brand trust [45]. Huang et al. used the CAB framework to understand consumer experiences with AI bots in hospitality and tourism environments [49]. Wahid applied the CAB framework to a green retail environment, and a review showed that consumer experience positively and negatively affected satisfaction and repurchase intentions [16].
This study chose the CAB framework as its theoretical foundation for four reasons. Firstly, CAB frameworks have been widely used to understand consumer behavior in the marketing, retail, and AI literature, proving their high applicability and explanatory power. Secondly, these frameworks provide a comprehensive understanding of consumers’ perceptions, affective attitudes, and behavioral responses to brands, providing valuable insights for marketers to develop and implement more effective strategies [15,50]. Thirdly, CAB frameworks emphasize that affective factors play a key role in consumer cognition and behavior. Finally, in emerging digital environments such as the metaverse and AI, CAB frameworks can provide a new theoretical perspective and a firm foundation as consumer behavioral patterns exhibit significant variability compared to traditional environments.

3. Research Model and Hypothesis Development

3.1. Relationship Between Cognitive and Affective Factors

In this study, we redefine the cognitive–affective–behavioral (CAB) framework to better fit the contextual needs of AIBEs. In particular, “cognitive” refers to how consumers perceive and understand the external characteristics of AIBEs. Previous scholars have defined the characteristics of AIVIs in detail, and Table 3 summarizes the characteristics of AIVIs by researchers in the last four years. Due to the unique attributes of AIBEs, we selected attractiveness, anthropomorphism, interactivity, and authenticity as cognitive factors.
Attractiveness (ATT) refers to the extent to which AIBEs’ appearance (such as facial appearance, body shape, and clothing) and overall visual style attract consumers and are well-liked by people. The research shows that 92% of AIBEs that are popular Brand Endorsers are between the ages of 19 and 30 [63]. Over time, these AIBEs also maintain consistent aesthetic standards and messaging because they do not age or undergo cosmetic changes [58,59]. Research has confirmed that AIVIs are highly appealing with their unique appearance and virtual personalities and attract consumers’ attention [52]. They provide an innovative way for brands to connect with their target groups and can attract a large number of followers on social media [53]. Hwang and Ki argue that when an AI idol haves more ATT in terms of appearance and behavior, viewers will be more inclined to see it as a real object of social interaction [24]. In addition, Huang and Yu also showed that AI anchors can evoke pleasant and positive emotions if they have an external image that is pleasant to consumers [23]. We predict that, when an AIBE has a high degree of ATT, it enhances the overall image of a brand so that consumers perceive the brand more positively and are willing to interact with the brand. Therefore, we formulate the following hypotheses:
H1a. 
The ATT of AIBEs is positively correlated with consumers’ HM.
H1b. 
The ATT of AIBEs is positively correlated with their SP among consumers.
Anthropomorphism (ANT) refers to the consumer’s perception that AIBEs have human-like characteristics and affective manifestations, including behavior, tone, and emotion, which makes AIBEs appear more real and believable. Yan et al. [26] suggested that when consumers feel that an AI agent is anthropomorphic, their SP is significantly increased. Kim and Park [64] emphasized the positive impact of the ANT of AI robots on their SP and consumers’ satisfaction of the shopping experience. Ku [65] concluded that ANT services are highly correlated with consumers’ intention to consistently use the services of an AI chatbot. Feng et al. [18] found that ATT and ANT significantly influence consumers’ acceptance of AIVIs as brand endorsers through a mixed-methods study. Jain [66], who is from the field of environmental communication, emphasized that AI Brand Endorsers deliver ANT, which enhances consumers’ positive affect and prompts them to establish an emotional connection with the brand, which in turn increases HM and SP. Another study showed that AI idols with a high degree of ANT can significantly increase social engagement in online marketing [41]. In a previous study, AI agents with ANT provided more interactive fun and has higher SP than non-anthropomorphic agents [56]. We predicted that when AIBEs exhibit significant human characteristics and emotions, they will have increased SP, and consumers will be more willing to interact with them and experience more HM during the interaction. So, we propose the following hypotheses:
H2a. 
The ANT of AIBEs is positively correlated with consumers’ HM.
H2b. 
The ANT of AIBEs is positively correlated with their SP among consumers.
Interactivity (INT) refers to the frequency and quality of interactions between AIBEs and consumers, including the speed of response, depth of interaction, and degree of personalized experience. As a product of digital technology, AI endorsers are mainly active on Internet platforms and therefore have a variety of channels and platforms to interact with consumers, and this high degree of interactivity can significantly increase consumer pleasure [35]. Thomas and Fowler [20] showed that AIBEs’ interaction with consumers received positive feedback from consumers, and resulted in significant brand benefits that contributed to the success of the brand. In addition, Byun and Ahn [67], through comparing the similarities and differences between AIBEs and human endorsements in terms of marketing advertisements, strategic messages, and consumer responses, showed that AIBEs are able to interact with consumers in a unique manner, which is important in enhancing brand engagement in online environments. Yin and Qiu [68] further emphasized this point by stating that the high degree of INT of AI technologies facilitates the formation of their SP and consumer HM. Jafar et al. [69] also identified INT as a key media feature that enhances consumer presence in metaverse environments, arguing that consumers’ entry into metaverse environments creates a sense of presence, which alters consumers’ perceptions of reality. We predict that, through the metaverse environment, AIBEs can provide consumers with enriched interactive experiences (visual, auditory, and tactile) on an ongoing basis, thus significantly enhancing their consumer HM and AIBEs’ SP. Consequently, we proposed the following hypotheses:
H3a. 
INT with AIBEs is positively correlated with consumers’ HM.
H3b. 
INT with AIBEs is positively correlated with their SP among consumers.
Authenticity (AUT) refers to the consumer’s perception of the brand messages delivered by AIBEs as truthful, accurate, and unbiased. In the literature on social media endorsers, AUT is seen as a key feature that attracts consumers. Therefore, it is crucial for brand endorsers who wish to recommend their products to consumers through their messages to stay authentic [61]. With the advent of the digital age, issues such as retouching, fake news, inauthentic followers, and the like have provided novel research directions for the field of AIVI marketing [32]. Garg and Bakshi [59] showed that authenticity, transparency, professionalism, and reliability play a vital role in building trust in online content creators. To take full advantage of AI, brands need to continually audit interactions to confirm that AIBEs adhere to brand guidelines and quickly adapt to changing consumer expectations [58]. Since AIBEs speak on behalf of the brand, it is essential to maintain brand authenticity. Zhao and Han [54] emphasize that when the sources of information are more authentic, consumers will perceive them as more trustworthy and that this authenticity will have a positive impact on consumer attitudes and behaviors. Relevant studies have further shown that AUT in advertisements increases consumer trust and enhances their positive attitudes towards the brand [62]. So, we proposed the following hypotheses:
H4a. 
The AUT of AIBEs is positively correlated with consumers’ HM.
H4b. 
The AUT of AIBEs is positively correlated with their SP among consumers.

3.2. Relationship Between Affective and Behavioral Factors

This study proposes that consumers’ affective factors towards AIBEs mainly include hedonic motivation, social presence, and trust in AIBEs. Yu et al. [42] argued that consumers’ love and support for virtual idols would be enhanced by increased affective engagement, which in turn would promote the marketing effectiveness of virtual idols and increase consumer purchases. Li et al. [70] proposed that people are able to emotionally connect with avatars and obtained empirical evidence that emotional responses increase consumers’ attitudes and behavioral intentions related to AIVIs, further emphasizing the importance of affective responses in marketing.
Hedonic motivation (HM) refers to the fun and entertainment value that consumers derive from interacting with AIBEs, an experience that enhances their favorable opinion of the brand. Shao [60] showed that the hedonic value of AIVIs has a significant positive impact on customer engagement and brand attitude. When AI anchors and consumers engage in two-way communication, the emotional connection and prosocial relationship between them are enhanced, resulting in more hedonic experiences and behavioral intentions [25]. Wang et al. [36] argued that the perceived hedonics of AI live streaming anchors positively affect consumer PI. Taglinger et al. [71] also further validated the positive impact of consumer HM on the use of AI digitizers in online shopping through an empirical study.
Social presence (SP) refers to the fact that consumers can feel an authentic social presence in their interactions with AIBEs, making AIBEs seem like a real person. Wang et al. [36] emphasized that better types of SP will emerge in future metaverse worlds as AI technology improves. SP can shorten the psychological distance between consumers and brands and create a sense of familiarity, intimacy, and connection between consumers and virtual anchors, thus increasing PI [72]. Because AIBEs are manipulated by computers and corporate teams, they post and respond to comments on social platforms more frequently than Human Brand Endorsers (HBEs), making followers feel recognized and appreciated. This enhanced presence may increase brand engagement and PI [26]. Gao et al. [34] showed through an empirical study that SP significantly induced consumers’ PI in the context of AI anchors.
Trust in AI Brand Endorsers (TAI) refers to the consumer’s trust in the quality and brand message of the products recommended by AIBEs, including trust in the truthfulness, ethicality, and transparency of the information conveyed. From a marketing perspective, trust is recognized as a key factor in building and maintaining long-term successful relationships [59]. In the interaction between consumers and AI, trust is crucial, and consumers feel safer when they have established trust with an AI anchor [36]. Gerlich [10] showed through a questionnaire that, when AIVIs are more trustworthy, credible, and in line with consumer preferences, they increase consumers’ PI for branded products. As consumers build trust in AIBEs, they will also trust the products that AIBEs recommend, making them more likely to purchase those products. Accordingly, we propose the following hypothesis:
H5a. 
Consumers’ HM resulting from AIBEs is positively correlated with PI.
H5b. 
AIBEs’ SP among consumers is positively correlated with PI.
H5c. 
TAI is positively correlated with consumers’ PI.

3.3. Moderating Effect of Technology Readiness

Technology readiness (TR) explains consumers’ intention and readiness to adopt a particular technology and primarily measures consumers’ personality traits and attitudes rather than their technological capabilities. When consumers are confronted with a new AI technology, they may have positive or negative emotional reactions. Among the positives are optimism and innovation, while the negatives are discomfort and insecurity [73]. Positive emotions tend to drive the adoption and purchase of new technologies and services, while negative emotions inhibit and reject this acceptance process [73]. Seong and Hong [74] obtained empirical evidence that when users of a virtual sports game perceive the new technology more positively, they perceive the game as more enjoyable and player-friendly, which in turn promotes the acceptance of the new technology by boosting optimism and innovation. Therefore, consumers with higher TR are usually more receptive to changes brought about by new technologies [74].
Innovative individuals tend to be more motivated by purchase incentives because they crave novel and unique experiences and want to stay ahead of the technological curve. They actively pursue innovative products or services and are willing to try new experiences, which enhances their PI. Research has shown that individuals with higher innovation have a positive effect on their PI [73]. Kim et al. [75] also noted that optimism and innovativeness play a significant positive moderating role in consumers’ happiness and behavioral intentions in experiencing AI virtual travel. This openness to new ideas and products inspires consumers to explore and acquire innovative products, which further drives their PI. So, we predict that positive TR features (optimism and innovativeness) will amplify the positive impact of HM, SP, and TAI on consumer PI. Therefore, we propose the following hypothesis:
H6a. 
Consumers’ OPT is positively correlated with PI.
H6b. 
OPT positively moderates the correlation between consumers’ HM and PI.
H6c. 
OPT positively moderates the correlation between AIBEs’ SP and consumers’ PI.
H6d. 
OPT positively moderates the correlation between consumers’ TAI and PI.
H7a. 
Consumers’ INN is positively correlated with PI.
H7b. 
INN positively moderates the correlation between consumers’ HM and PI.
H7c. 
INN positively moderates the correlation between AIBEs’ SP and consumers’ PI.
H7d. 
INN positively moderates the correlation between consumer’s TAI and PI.

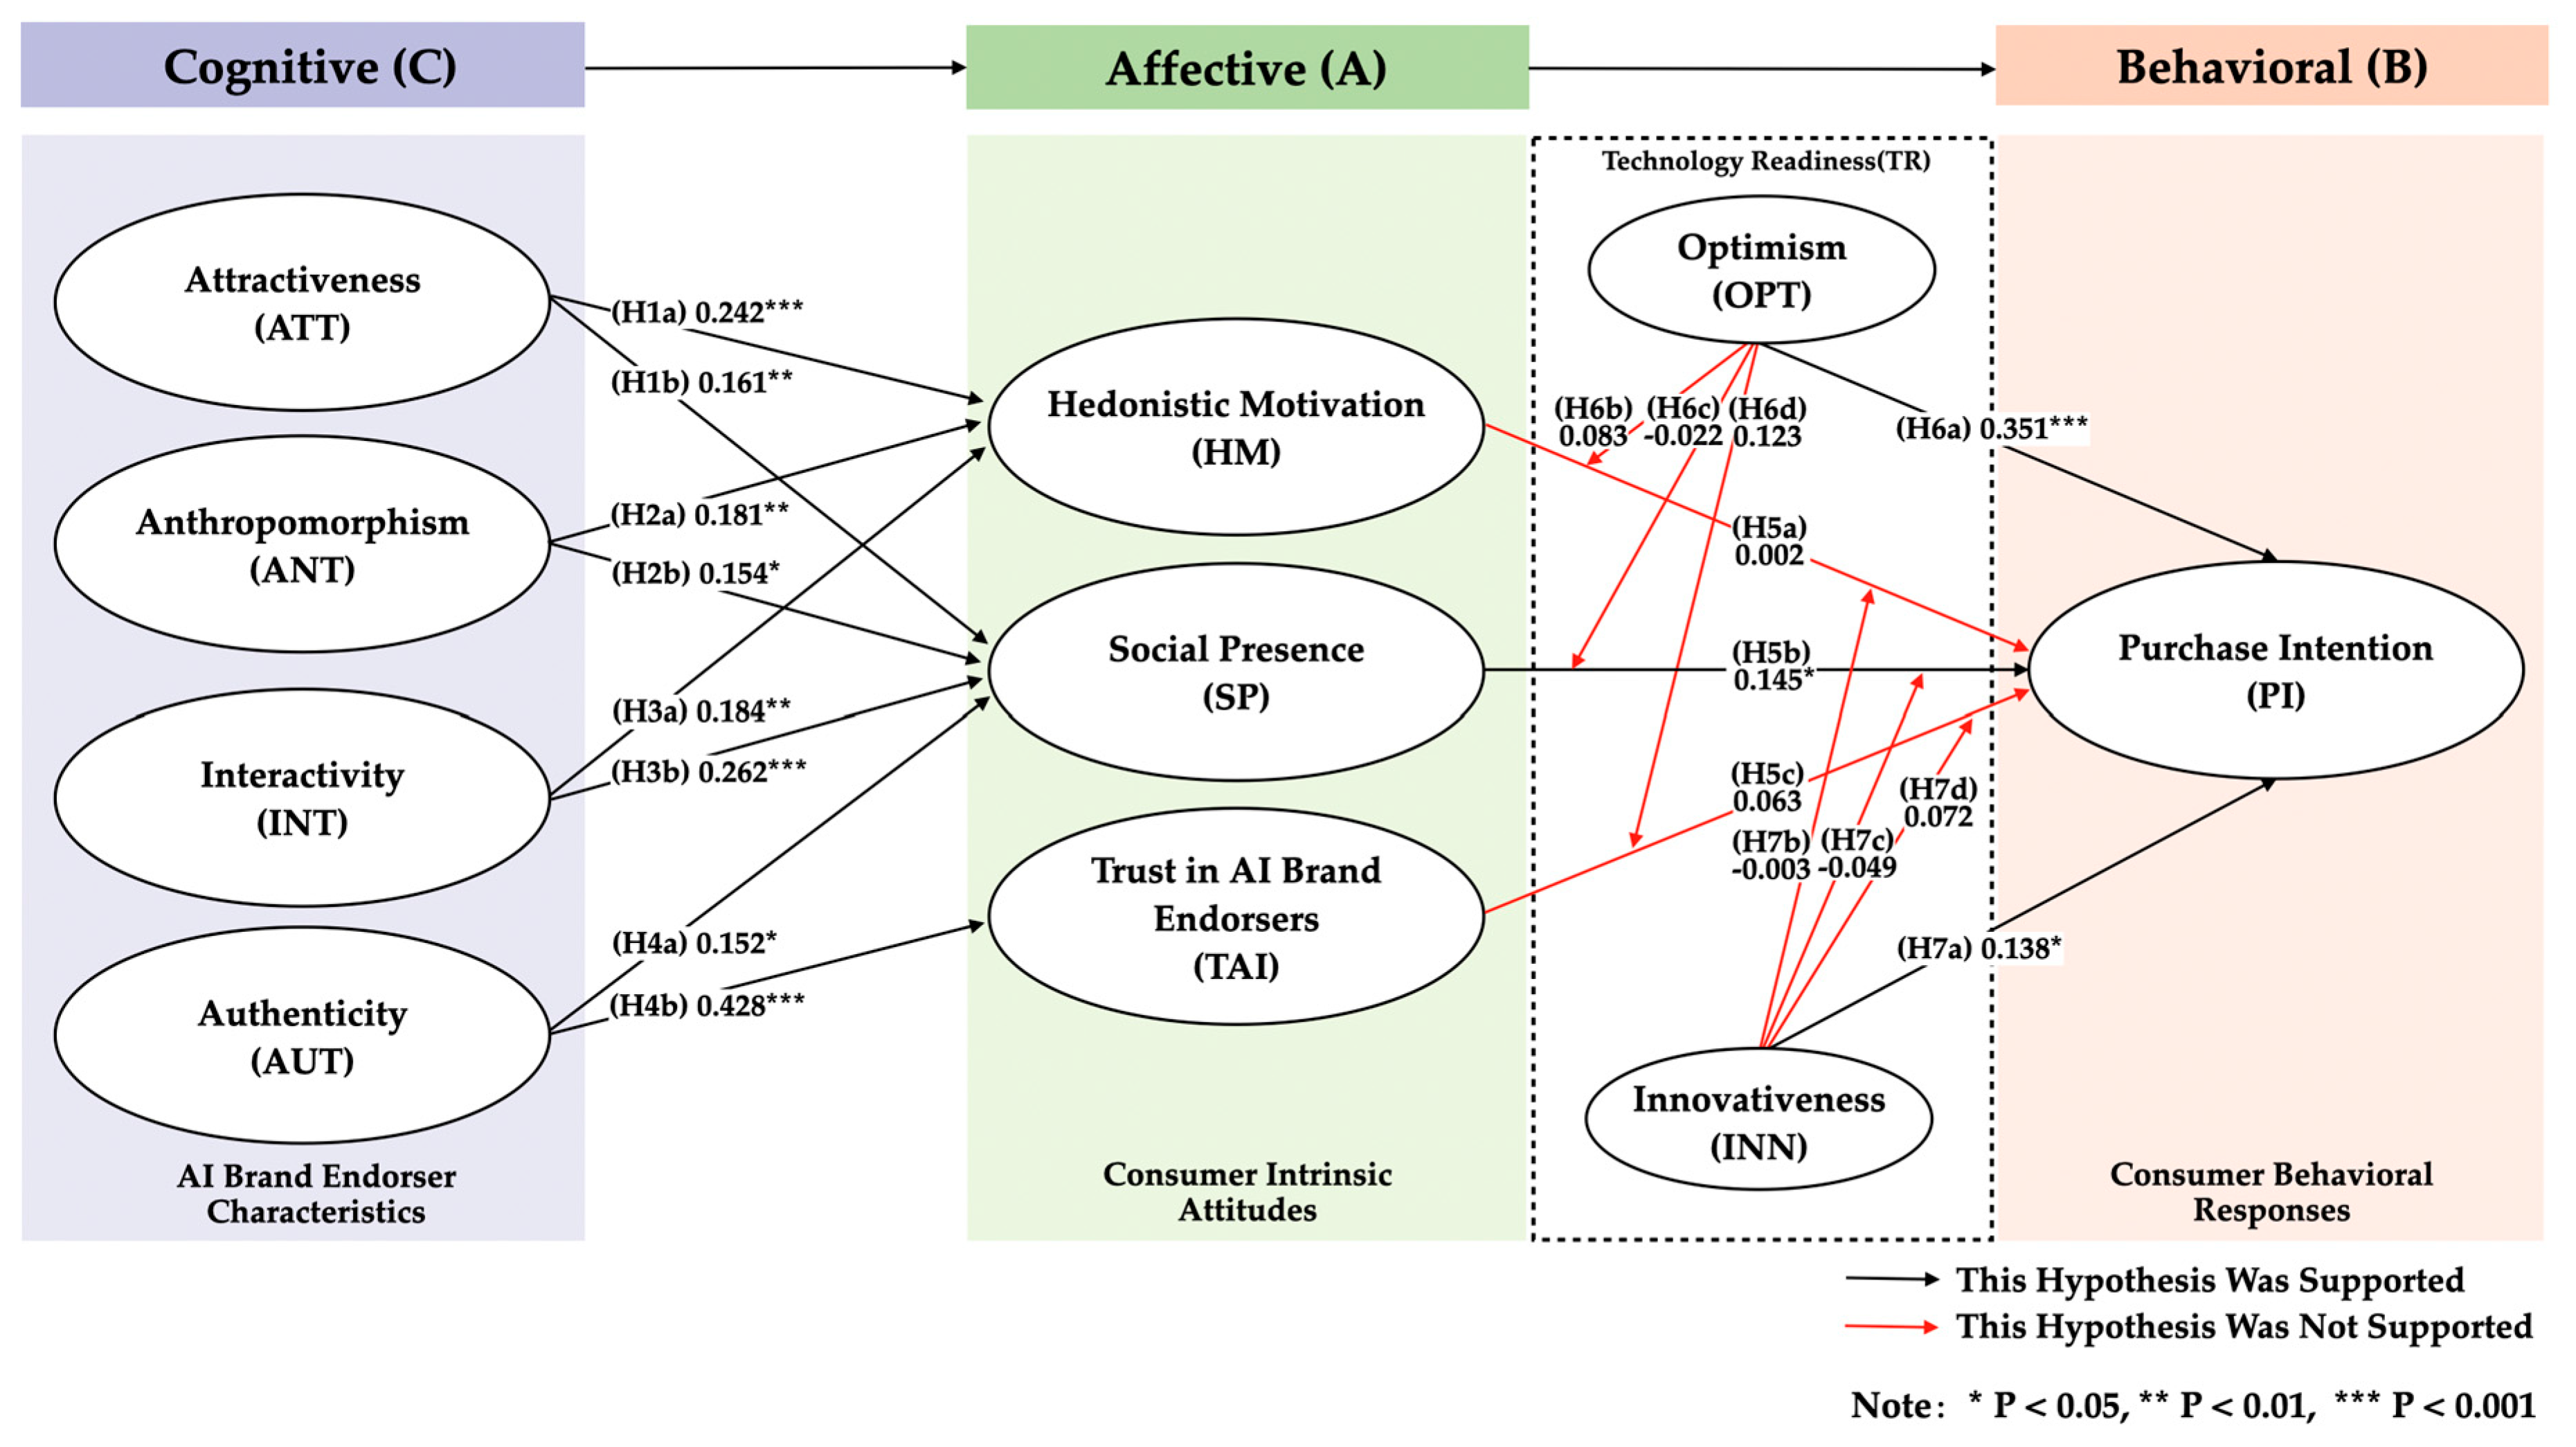
3.4. Proposed Research Model

This research uses the CAB framework to analyze the factors that influence consumers’ purchase intention of AIBE-recommended products, as shown in Figure 1. In this framework, cognitive factors mainly include the characteristics of AIBEs (attractiveness, anthropomorphism, interactivity, and authenticity), while affective factors focus on consumers’ attitudes (hedonic motivation, social presence, and trust in AIBEs). Purchase intention is considered as a behavioral factor. In addition, we introduced technology readiness (optimism and innovativeness) as a moderating variable to explore how its interaction with the primary constructs further affects consumers’ purchase intention.

4. Research Methods

Our study used a quantitative survey method for data collection, first using SPSS 27.0 for basic numerical testing of the questionnaire and then Smart PLS 4.0 for hypothesis testing and evaluation of the model.

4.1. Questionnaire Development

In order to ensure the scientific validity of the questionnaire, all the measurement items in this study were adapted from the existing literature, and a total of 40 measurement items and 10 measurement variables were designed (see Appendix A for details). The questionnaire was divided into three sections: The first part provided a detailed explanation of AI Brand Endorsers (AIBEs) to help respondents understand the concept more visually and fully. AIBEs showcase and share branded products through the metaverse, a virtual venue that provides an immersive and unique experience for consumers. We chose Oh Rozy from South Korea as the AIBE representative, and presented a video of her branded fashion runway show on the metaverse platform Spatial as stimulus material in the questionnaire (shown in Figure 2). We chose Oh Rozy for several reasons: Firstly, Rozy was created by Sidus Studio X in August 2020 [76] as Korea’s first AI virtual webcomic; she quickly rose to fame with her 171 cm height and fixed 22 year old image and has been portrayed as a singer, model, and DJ, as well as recently being appointed as a Goodwill Ambassador for the 2030 Busan World Exposition. Also, she is a Brand Endorser for various brands such as Tiffany & Co, Hera, and CK [77]. Secondly, in April 2023, Rozy participated in the second Metaverse Fashion Week (MVFW) on the metaverse platform Spatial as an invited model and brand ambassador for the brand Ilona Song [78], launched her own virtual fashion brand “OHROZY COLLECTION” using digital fashion and blockchain technology, and released two music tracks [78]. Finally, Rozy’s team has captured the attention of a large number of Generation MZ by not only creating engaging travel and lifestyle scenarios quickly and affordably with the help of AI tools such as Midjourney and DALL-E3, but also using AI technology to enable them to more naturally interact with their fans on social media, responding and adapting their content in a timely manner [79]. Currently, she has 173 thousand followers on her Instagram account (@rozy.gram) https://www.instagram.com/rozy.gram/?hl=en (accessed on 1 July 2024) [80]. Once the respondents were aware of this information, they were able to continue with the follow-up questionnaire.
The second part of the questionnaire deals with the demographic information of the respondents, including basic characteristics such as gender, age, education level, and income. The third part then contains the relevant questions used to measure the different variables, each of which is measured through 3–5 items. All measures were rated on a Likert 7-point scale ranging from “strongly disagree” (1) to “strongly agree” (7). The initial version of the questionnaire was in English. To ensure that there were no misunderstandings and ambiguities, we first invited three university professors who were proficient in both Chinese and English to translate the questionnaire. Secondly, the questionnaire was scrutinized for validity, logic, and structure by scholars specialized in the field of research. Finally, we invited 60 consumers who had purchased AIBE-recommended products to participate in the pre-testing of the questionnaire before the formal distribution of the questionnaire, and we collected timely feedback to ensure that the adjusted questionnaire was clearer and easier to understand. The small sample of data collected during the pre-testing phase was not included in the subsequent large-scale survey.

4.2. Data Collection

We collected the data through Questionnaire Star (https://www.wjx.cn/ (accessed on 1 July 2024)), an online survey platform in China. Before respondents could complete the questionnaire, an informed consent form had to be signed, clearly stating that all responses provided would be kept strictly confidential and anonymized. These data were only used for academic research to ensure that no personal information was leaked. In order to study the attitudes and behaviors of the two target groups, university students and workers in China’s Generation MZ, we used stratified random sampling to ensure the diversity and representativeness of the sample. The university student sample consists of consumers who are currently enrolled in undergraduate and graduate education, while the workers sample consists of adults who are already in the workforce and have some work experience. We set up the following screening question in the questionnaire to verify the purchase experience of the respondents: “Have you ever heard of products recommended by AI Brand Endorsers (AIBEs) before?” Only respondents who answered “yes” were considered valid. The questionnaire survey was conducted between 3 July 2024 and 25 September 2024. A total of 428 questionnaires were collected, and a total of 126 questionnaires were screened by the Questionnaire Star platform to remove incomplete questionnaires, duplicate answers, too-fast completion time, and respondents that had not purchased products recommended by AIBEs. Eventually, there were 302 valid questionnaires, or 70.56% of the total questionnaires, and these questionnaire data were used for further analysis.

4.3. Sample Analysis

There was a balanced gender distribution among the 302 respondents, with 48.3% (146 people) males and 51.7% (156 people) females. In terms of age distribution, there were 158 Generation Z respondents, accounting for 52.3%, and 144 Generation M respondents, accounting for 47.7%. In regard to educational background, the majority of the respondents had an undergraduate degree (163 people, 54.0%), in addition, 33 people (13%) had graduate and doctoral degrees. In terms of occupational distribution, 35.1% (106 people) were university students, and 64.9% (196 people) were workers. In terms of monthly income distribution, the majority of respondents had a monthly income of CNY 3001–6000, accounting for 46.0% (139 people); this was followed by those with a monthly income of less than CNY 3000 (38.5%) (116 people) and those with a monthly income of more than CNY 6001 (15.6%) (47 people). Table 4 details information on the demographic distribution of the respondents.

5. Results

We used the Partial Least Squares Structural Equation Modeling (PLS-SEM) method and SmartPLS 4 to analyze the questionnaire data in our study [81]. The main reasons for choosing PLS-SEM are that it can effectively handle complex models, is suitable for predictive analysis, and has good adaptability to small sample sizes and non-normally distributed data [82].

5.1. Common Method Bias

Following the approach recommended by Hair [83], we needed to assess whether there was a potential common method bias (CMB). When the value of the Variance Inflation Factor (VIF) is greater than 3.3, it indicates that there is a serious multicollinearity problem among the predictor variables. In our study, all VIF values were below 3.3 (1.000 to 1.543). Therefore, there was no common method bias in this model.

5.2. Measurement Model

We evaluated the measurement models based on internal consistency, convergent validity, and discriminant validity for each variable [8]. We measured two internal metrics, composite reliability (CR) and Cronbach’s alpha (CA), and all values exceeded 0.8 (see Table 5): specifically, 0.941–0.958 for CR and 0.906–0.945 for CA. This implies that the questionnaire structure has good reliability [84]. For convergent validity, we used Average Variance Extracted (AVE) and standardized factor loadings, and the results in Table 5 and Table 6 show that the AVE for all variables is greater than 0.5, with values ranging from 0.810 to 0.841. The standardized factor loadings had a range of values from 0.895 to 0.935, all of which were greater than 0.7, supporting the convergence effect of the measurement model [85].
In addition, we used three methods to evaluate discriminant validity. First, according to the Fornell–Larcker criterion, the square root of the AVE values and the correlation coefficients were compared, and as shown in Table 6, the square root of each AVE was greater than the correlation of the other structures. Secondly, the heterotrait–monotrait ratio of correlations (HTMT) was further explored, and according to the measurements in Table 7, the maximum HTMT value is 0.456, which is below the threshold value of 0.85 [85]. Finally, we performed cross-loading analysis, and Table 8 shows that the loadings of all the metrics exceeded the cross-loadings [85]. In conclusion, all the results show that our model has excellent reliability and validity.

5.3. Structural Model and Hypothesis Test

In PLS-SEM, a standardized root-mean-square residual (SRMR) value ≤ 0.05 and a normalized fit index (NFI) value ≥ 0.80 indicate a good fit of the structural model [86]. In our study, NFI = 0.892 and SRMR = 0.034, thus indicating a good model fit for the research model.
According to the data in Table 9 and Figure 3, 11 of the 19 hypotheses presented in this study are supported. Specifically, ATT significantly affected HM (β = 0.242, p < 0.001) and SP (β = 0.161, p < 0.01), thus supporting H1a and H1b. ANT had a positive effect on HM (β = 0.181, p < 0.01) and SP (β = 0.154, p < 0.05), in support of H2a and H2b. INT positively affected HM (β = 0.184, p < 0.01) and SP (β = 0.262, p < 0.001), in favor of H3a and H3b. AUT had a significant effect on SP (β = 0.152, p < 0.05) and TAI (β = 0.428, p < 0.001), supporting H4a and H4b. Meanwhile, SP (β = 0.145, p < 0.05), OPT (β = 0.351, p < 0.001), and INN (β = 0.138, p < 0.05) produced significant positive correlations with PI, supporting H5b, H6a, and H7a. However, HM (β = 0.002, p = 0.981) and TAI (β = 0.063, p = 0.397) did not have a significant effect on PI, and H5a and H5c are thus not confirmed. In addition, we propose that the moderating effect of technical readiness (OPT and INN) was not found to be significant, and H6b, H6c, H6d, H7b, H7c, and H7d are not supported.

5.4. Post Hoc Analyses: Multi-Group Analysis (MGA)

In the present study, since the moderating effects of OPT and INN have not been confirmed, in order to reveal potential differences between the groups and the effects of these differences on the study model, and to help provide a clearer understanding of how the relationships between the variables vary according to specific group characteristics, we further conducted a Multi-Group Analysis of the respondents’ age (Gen Z and Gen M) and occupation (university students and workers). For the age of the respondents, Table 10 shows that there are two significantly different paths in the structural model path analysis for the Gen Z and Gen M groups. H3b was validated, and the effect of INT on SP was significantly different between these two age groups (p = 0.022), with the Gen M group (β = 0.381, p < 0.001) showing a stronger correlation compared to the Gen Z group (β = 0.111, p = 0.174). H5a was validated, and there was a significant difference in the effect of HM on PI (p = 0.050), which was highly significant in the Gen Z group (β = 0.102, p = 0.309) but very insignificant in the Gen M group (β = −0.146, p = 0.05).
For the respondents’ occupations, Table 11 shows the structural model path analysis for the university student and worker groups with four significantly different paths. Firstly, H2a holds, and there is a significant difference between ANT and SP (p = 0.014). While there was almost no effect in the worker group (β = 0.074, p = 0.307), a strong positive effect was shown in the university student group (β = 0.398, p < 0.001). Secondly, H3b was validated, and INT also showed a significant difference on SP (p = 0.039). A significant effect of strong correlation was shown for the workers (β = 0.323, p < 0.001), but a significant effect of weak correlation was shown for the university student group (β = 0.067, p = 0.486). In addition, H5c was validated, and TAI and PI were significantly different between the two groups (p = 0.046), with the influence of the worker group (β = 0.188, p < 0.001) being significantly higher than that of the university student group (β = −0.124, p = 0.303). Finally, H7d was validated, and the interaction of INN and TAI with PI was also significantly different between the two groups (p = 0.048), with a weaker effect in the worker group (β = −0.087, p = 0.375) and a stronger effect in the university student group (β = 0.198, p = 0.062).

6. Discussion

Through a comprehensive analysis of the studies, we have made important findings from the new theoretical models.
H1a, H2a, and H3a are validated. ATT, ANT, and INT have a positive effect on HM, with ATT being the most influential factor. This result echoes the research of Huang et al. [41]; the multidimensional experience of visual, auditory, and spatial sensations in the metaverse made consumers feel as if they were genuinely involved in the activities of AI Brand Endorsers (AIBEs), and not only did the appearance of AIBEs attract consumers’ attention but the attraction of AIBEs as a source of information also improved the effectiveness of brand–consumer communication and thus increased consumer HM. Other scholars have similarly validated this view [58,59]. When AIBEs are highly visually appealing, consumers are more likely to have a pleasant emotional experience in anticipation of the interaction [53]. Therefore, company marketers and technical teams should keep updating AIBEs’ clothing, styling, and hairstyles, so as to keep the aesthetic trends of its audience in line. ANT has a positive effect on HM, which suggests that when AIBEs’ behavior, appearance, and language style are more closely aligned with those of real humans, they enhance consumers’ feelings of closeness and pleasure [18]. AIBEs’ lively facial expressions, body language, and voice interactions will enhance their emotional connection with consumers. Jain [66] also confirms the view that consumers would want AIVIs to have a higher degree of ANT, which would promote their positive emotions. The significant effect of INT on HM suggests that consumers will feel more entertained only if AIBEs provide timely feedback and highly personalized interactions [69]. Especially in a virtual environment like the metaverse, their real-time interactive process with AIBEs feels pleasant and satisfying as they feel they are being attended and responded to in a timely manner.
H1b, H2b, H3b, and H4a are validated. ATT, ANT, INT, and AUT are confirmed have a positive and significant effect on SP. INT is the most important predicting factor. This is followed, in order, by ATT, ANT, and AUT. The metaverse provides consumers with an exclusive immersive interaction that puts them in a virtual world with AIBEs, creating an immersive experience [69]. This result has also been validated in a previous study [68]; AIBEs simulate real-life social interaction scenarios with consumers in the metaverse, placing them in a shared social environment that stimulates a sense of social connectedness and belonging. Furthermore, this is consistent with Hwang and Ki’s finding that AI idols with a high level of ATT are more likely to create an SP with consumers [24]. AIBEs enhance their SP among consumers by attracting their attention through their beautiful virtual appearance, highly realistic visuals, and harmonious integration into the metaverse environment [33]. The positive effect of ANT on SP has been confirmed in Yang et al.’s [56] research, in which AI agents with ANT have higher SP. AIBEs reduce the sense of detachment and mechanicalness when consumers interact with each other, and this shortens the sense of psychological distance between them by mimicking the expressions, gestures, and language habits of real human beings. As stated by Koles et al. [61], detailed and truthful product information is crucial to help increase the frequency of consumer interaction with AIBEs as a source of information that can be relied upon to increase their SP. AIBEs display reliable information about recommended products and a transparent recommendation process that demonstrates full authenticity [40]. Furthermore, H4b holds that AUT has a significant effect on TAI. This research result is in line with Um’s view [62] that when more detailed information about a product is provided (ingredients, sources, and effects of use) and a consumer has a clearer understanding of the true value of the recommended product, AIBE skepticism is reduced and trust in the recommended product is increased, which influences the PI. Previous scholars have also emphasized that a high degree of AUT in AIBEs is an important prerequisite for being perceived as credible by consumers [87].
H5b is validated. SP has a positive effect on PI. This is in contrast to Yan et al. proposing that a high degree of SP would allow consumers to have a more realistic experience in socializing with AIBEs, thus enhancing their PI [26]. The metaverse not only provides a highly immersive virtual environment but also offers consumers a unique sensory experience. Consumers are not only able to interact with AIBEs in a virtual space; they can test a product’s features in the virtual space [70]. As a result, a stronger SP is established, and consumers feel closer to AIBEs. In addition, AIBEs provide a consumer experience that crosses traditional physical boundaries by simulating human interaction behaviors, which increases their SP and offers consumers a stronger sense of engagement, thus making AIBE recommendations more influential and driving purchase intentions [34,71]. For Gen MZ consumers, AIBEs are no longer just a branding tool but a virtual “idol” or “friend” with social attributes. They will feel a stronger appreciation for SP and consider the experience novel and worth the investment. However, our study also found that HM and TAI had no significant effect on PI, and H5a and H5c are not validated. This is inconsistent with previous findings [25,36] and may be explained by the fact that AIBEs’ behavior in the metaverse enhances consumers’ HM and TAI, but consumers may be more concerned with the practical value of AIBE-recommended products in terms of utility, cost effectiveness, and brand reputation. TAI enhances the interactive experience, but this is not sufficient for it to translate to direct purchase motivation [59]. In addition, short-term pleasure in the metaverse, although it can enhance the interactive experience, has a weak impact on consumers’ long-term purchase decisions. This study is consistent with the results of Song et al. [19] demonstrating that the lack of persuasiveness of AI endorsers creates apathy and mistrust among consumers when they want to purchase specific experiential products. It also adds to Wan and Jiang’s [25] opinion that consumers do not find AIBEs more pleasant or easy to use, or that they motivate them toward PI, compared to HBEs.
Based on the analysis of the results, H6a and H7a hold, indicating that technology readiness (OPT and INN) directly affects the user’s PI for the products recommended by AIBEs, which suggests that, the higher the consumer’s OPT and INN, the higher the PI for the products recommended by AIBEs. This finding is also consistent with the insights of Kang et al. [73] that consumers with a higher level of TR are likely to accept new AI technologies. However, contrary to our expectations, OPT and INN do not mediate the effects of HM, SP, and TAI on PI. Specifically, the effects of these variables on PI do not change regardless of changes in OPT and INN.
The analysis of the different behaviors of Gen Z and Gen M consumers in the MGA shows that, on one hand, INT has a significant effect on the SP felt by both groups, but this effect is more pronounced for Gen M consumers. This difference may be due to the fact that they have experienced longer Internet and social media development, are more familiar with interacting with AIBEs in metaverse scenarios in their work and life, and feel more positively toward this type of interaction, thus increasing the SP they feel from AIBEs. Sharma et al. [88] also concluded that Gen M users feel that digital agents are highly efficient in terms of INT and can guide their purchase behavior. On the other hand, HM also had a significant effect on the PI of both groups, but Gen Z valued HM more than Gen M. This may be due to the fact that Gen Z consumers are usually more inclined to seek out entertaining, enjoyable, and personalized experiences similar to those of the metaverse and AIBEs; are happy to explore; and are more willing to spend. Gen M is then more likely to focus on the functionality and brand value of the product, with HM having less influence.
Different consumer behaviors were exhibited by the university student and worker groups. Firstly, the stronger correlation between ANT and SP among university students may imply that university students are more sensitive to the emotions, behaviors, and appearance exhibited by AIBEs. Since university students are in the stage of exploring new things and technologies, ANT can fulfill their emotional connection with AIBEs and thus increase the SP they feel from AIBEs. On the contrary, workers lead a faster-paced life and place more emphasis on actual functionality and product benefits. Secondly, workers value INT and have higher SP compared to university students. This difference may be due to the fact that workers want more efficient and personalized interactions with AIBEs in the metaverse due to their limited time at work and in life. And university students are more inclined to entertaining and novel experiences, ignoring the importance of INT. In addition, the impact of TAI on PI is more significant for workers than for university students. Since workers rely more on AIBEs’ professional recommendations to make purchase decisions, TAI is more likely to be converted into PI. University students are more curiosity-driven. Finally, an interesting finding was that the interaction between INN and TAI also had a different effect on PI. INN and TAI are significantly higher in university students than workers, indicating that the INN of university students is more likely to have a linkage effect with TAI and that they have a higher interest in and acceptance of the metaverse and AIBEs, which promotes their PI. Workers are more concerned with product utility and reliability. Thus, these differences provide marketers with a basis for more targeted strategies.

7. Implications, Limitations, and Future Research Directions

7.1. Implications

The theoretical contribution of this study is to extend the model of consumer interaction with AI Brand Endorsers (AIBEs) in a metaverse environment through the cognitive–affective–behavioral framework, further refining the model of consumer behavior in the metaverse. Firstly, while previous studies have focused on the influence of traditional social media or human endorsers on consumer behavior, this study examines how AIBE features (ATT, ANT, INT, and AUT) influence consumers’ HM and TAI and the SP they feel from AIBEs in a metaverse environment and verifies that consumers’ affective connection, enjoyment, and interactive experience can be significantly enhanced through AIBE features that increase enjoyment and which in turn influence PI through SP [71]. Secondly, this study confirms the significant mediating effect of SP on PI when consumers interact with AIBEs. Through immersive interactions, simulated social behaviors, and real-time feedback in metaverse scenarios, SP enhances consumers’ sense of AIBEs’ authenticity and trust in them, making AIBEs’ product recommendations more persuasive [26]. Third, our study introduces two variables of optimism (OPT) and innovativeness (INN) in technology readiness (TR), demonstrating that highly TR consumers are more likely to accept AIBE-recommended products and, furthermore, influence behavioral decision making in a metaverse environment [73]. It not only demonstrates the direct effect of OPT and INN on PI but also emphasizes that these two variables do not modulate the effect of HM, SP, and TAI on PI. This provides a new perspective for better understanding the relationship between TR and consumer behavior. Finally, through a comparison of different consumer groups (university students and workers; Gen Z and Gen M), it was found that INT had a strong impact on the SP of each group, further improving their PI. This finding adds to the literature on differences in consumer behavior across generations and reveals the potential for a wide range of applications of AIBEs across different user groups. Therefore, this study not only bridges the gap in metaverse research but also provides theoretical support for the application of AI endorsers in virtual marketing, enriches the theory of interpersonal interaction, and shows that SP is an important factor in constructing consumer loyalty and driving consumer purchase behavior in virtual environments.
From a practical perspective, the results of this study provide important insights for government agencies, marketers, metaverse platform companies, and developers. Government departments can support AIBE technological innovation by introducing policies, for example, providing tax breaks or R&D funding subsidies to incentivize enterprises to increase their investment in AIBE technology and promote its popularization and the development of the metaverse and AI technology. It is also possible to develop and improve regulation for the metaverse and AI systems, focusing on trust issues and moral and ethical dimensions [33], to ensure that consumers are provided with reliable and transparent information when using AIBE-recommended products. In addition, the government can raise consumer awareness and digital literacy of AI technology through educational programs and public outreach. According to the results, ATT, ANT, INT, and AUT have a significant effect on PI through SP, indicating that AIBEs are effective in enhancing consumers’ social experience in the metaverse [26]. With INT as the most important influencing factor, companies and developers can equip AIBEs with real-time feedback capabilities to dynamically adjust recommended content based on consumer behavior (clicking, browsing, and asking questions in conversations). When consumers show interest in a certain type of product, AIBEs can immediately provide more information about the relevant product or even give discounts or limited-time offers to stimulate quick decision making. For ATT and ANT, it is recommended that developers customize AIBEs’ appearance, voice, and personality traits according to consumer preferences [25] and include more human-like features (nodding and smiling, bowing and shaking hands, and emotional care) [34] to enhance AIBEs’ approachability and humanization. It further strengthens consumers’ emotional connection, prompting AIBEs to transform from a mere product recommendation role to the role of a virtual friend and enhancing consumer loyalty through long-term interaction. In terms of AUT, companies should ensure the transparency and consistency of product information, avoid exaggerating product features or misrepresentation, and make AIBE performance more realistic and believable by developing high-quality and creative storylines [61]. The direct impact of OPT and INN on consumer PI shows that developers and companies should continue to innovate smart technologies, offer more personalized and customized interactions, and introduce technologically forward-looking products and services to attract high-TR consumers and increase their PI [72].

7.2. Limitations and Future Research Directions

The current study, while providing an important contribution to the theoretical development and practical application of the metaverse and AI Brand Endorsers, still has some limitations that need to be improved in future research. Firstly, this study only used China as the sample source, and the findings may only be applicable to countries with similar conditions and backgrounds, with limitations on generalizability. Future research could be extended to other countries to explore the differential consumer responses to AIBEs across cultures and geographies. Secondly, although this study used an online questionnaire to collect data, it may not be able to tap into the deeper emotional experiences of consumers. In the future, a combined research methodology could be used, incorporating more qualitative methods (in-depth interviews, focus groups, and the use of rootedness theory) to provide a more comprehensive understanding of consumer feedback and emotional responses and to further validate the comprehensiveness of this study’s findings. In addition, the current study we conducted is a cross-sectional study with data collected only at a specific point in time, whereas it is crucial to track consumer acceptance and behavioral changes in AIBEs over time, and longitudinal studies should be considered in the future to explore the dynamic changes in consumer attitudes over time. Finally, this study mainly focuses on the application of AI Brand Endorsers in the metaverse, while future research can be extended to other areas, such as virtual customer service, virtual mentors, virtual doctors, and virtual idols, to explore the different impacts of avatars on user behavior in different scenarios.

7.3. Conclusions

With the rise of the metaverse concept, the rapidly evolving advertising, marketing, and entertainment industries are undergoing unprecedented changes as human endorsers are gradually being replaced by AI Brand Endorsers (AIBEs). Therefore, researchers in the marketing field need to pay more attention to consumer attitudes and behavioral responses to AIBEs. Based on the cognitive–affective–behavioral theory, this study aims to construct a theoretical model that influences consumers’ intention to purchase AIBE-recommended products in a metaverse context. Data from 302 consumers from China’s MZ generation were collected through a questionnaire and were analyzed empirically using Partial Least Squares Structural Equation Modeling (PLS-SEM). The results of this study showed that 8 of the 19 hypotheses proposed were not valid. Specifically, attractiveness (ATT), anthropomorphism (ANT), interactivity (INT), and authenticity (AUT) indirectly affect consumer purchase intention (PI) through the mediating variable of Social Presence (SP), with INT having the most significant effect, followed by ATT, ANT, and AUT. In contrast, hedonic motivation (HM) and trust in AIBEs (TAI) do not significantly affect PI. Moreover, although optimism (OPT) and innovativeness (INN) fail to moderate the indirect effects of HM, SP, and TAI on PI but directly and significantly affect PI. Multi-Group Analysis (MGA) further showed that Gen Z and Gen M differed significantly in two relationships (INT-SP and HM-PI). University students and workers had significant effects on four relationships (ANT-SP, INT-SP, TAI-PI, and INN x TAI-PI). This study not only enriches the theoretical basis for the application of AIBEs in the metaverse environment but also provides valuable practical insights for related enterprises and developers on building virtual social business models and optimizing intelligent user experiences.

Author Contributions

Conceptualization, J.X. and Y.F.; methodology, J.X. and Y.F.; software, J.X.; validation, J.X.; formal analysis, W.L.; investigation, Q.H. and J.X.; resources, J.X.; data curation, J.X.; writing—original draft preparation, J.X.; writing—review and editing, J.X.; visualization, J.X. and Y.F.; supervision, Z.F. All authors have read and agreed to the published version of the manuscript.

Funding

This research was supported by the National Social Science Fund of China under the Major Program of Arts (20ZD19).

Institutional Review Board Statement

All subjects gave their informed consent for inclusion before they participated in this study. Ethics approval is not required for this type of study. This study was conducted following the local legislation: https://www.law.go.kr/LSW//lsLinkCommonInfo.do?lspttninfSeq=75929&chrClsCd=010202 (accessed on 1 July 2024).

Informed Consent Statement

Informed consent was obtained from all subjects involved in this study.

Data Availability Statement

The raw data supporting the conclusions of this article will be made available by the authors on request.

Acknowledgments

The authors would like to thank those who supported us in this work. We thank the reviewers for their comments and efforts to help improve this paper.

Conflicts of Interest

The authors declare no conflicts of interest.

Appendix A

Table A1. Questionnaire for variable items (n = 40) and references.
ConstructItemIssueReference
Attractiveness
(ATT)
(4 items)
ATT1I find the appearance of AIBE to be very impressive.(Lee et al., 2021) [52], (Q.-Q. Huang et al., 2022) [41], (Y. Huang & Yu, 2023) [23], (Yu et al., 2023) [42]
ATT2I find the image of AIBE very attractive.
ATT3I find the branded products recommended by AIBE appealing.
ATT4Overall, I find AIBE very attractive.
Anthropomorphism (ANT)
(4 items)
ANT1The AIBE behaves like a real person.(Sestino & D’Angelo, 2023) [37], (Song et al., 2024) [19], (Dabiran et al., 2024) [39]
ANT2The actions and expressions of AIBE feel very realistic to me.
ANT3The behavior and language of AIBE are natural.
ANT4The AIBE makes me feel like it has emotions and personalities.
Interactivity
(INT)
(4 items)
INT1That AIBE can respond to my questions and needs on social media platforms in a timely manner.(Um, 2023) [62], (Sestino & D’Angelo, 2023) [37], (Garg & Bakshi, 2024) [59]
INT2My interactions with AIBE are very flexible and pleasant.
INT3My interactions with AIBE feel like real social relationships.
INT4My interactions with AIBE made me feel very engaged.
Authenticity
(AUT)
(4 items)
AUT1I believe the product information passed on by AIBE is well-founded.(Lee et al., 2021) [52], (Oliveira & Chimenti, 2021) [53], (Um, 2023) [62]
AUT 2I believe that the information about the products recommended by AIBE is true.
AUT 3I believe that the information about the products recommended by AIBE is conclusive.
AUT 4I believe that the information provided by AIBE is transparent and not hidden.
Hedonic Motivation
(HM)
(5 items)
HM1I think interacting with AIBE is fun.(Taglinger et al., 2023) [70], (Xu et al., 2023) [44], (Shao, 2024) [60]
HM2I think AIBE is delightful.
HM3I think it’s interesting for brands to have AIBE endorse their products.
HM4I have pleasure in buying AIBE-endorsed products.
HM5I think AIBE gives me a lot of joy.
Social Presence
(SP)
(4 items)
SP1I feel like AIBE is interacting with me like a real person.(Gao et al., 2023) [34], (Wang et al., 2023) [36], (Yan et al., 2024) [26]
SP2I feel a sense of intimacy from AIBE.
SP3I feel AIBE is very personable.
SP4I feel like AIBE is engaging in a real conversation with me.
Trust in AIBEs (TAI)
(4 items)
TAI1I trust the quality of branded products recommended by AIBE.(Y. Huang & Yu, 2023) [23], (Wan & Jiang, 2023) [25], (Dabiran et al., 2024) [39]
TAI2I trust that the product content published by AIBE is trustworthy.
TAI3I trust that AIBE will not mislead me.
TAI4I consider AIBE to be a reliable partner.
Purchase Intention
(PI)
(4 items)
PI1I find products recommended by AIBE to be worthwhile purchases.(Thomas & Fowler, 2021) [20], (Song et al., 2024) [19], (Wang & Qiu, 2024) [89]
PI2The AIBE recommendation influences my intention to make a purchase.
PI3I will be frequently purchase the recommended products by AIBE in the future.
PI4I will strongly recommend others to buy products endorsed by AIBE.
Technology Readiness
(TR)
(7 items)
OPT1I think AIBE can improve my quality of life.(Kim et al., 2020) [75], (Arachchi & Samarasinghe, 2023) [72], (Kang et al., 2024) [73]
OPT 2I am optimistic about the future of AIBE.
OPT3I think AIBE will bring more convenience and opportunities.
OPT4I believe that AIBE can make my shopping experience better.
INN1I am more likely to buy products recommended by AIBE.
INN 2I usually don’t need help from others to learn about AIBE.
INN 3I keep up with the latest technological developments in the AIBE field.

References

  1. Qi, Y.; Sun, Y. Visualization and Bibliometric Analysis of Research Evolution on Digital Human. In Proceedings of the 2023 6th International Conference on Big Data Technologies, Qingdao, China, 22 September 2023; ACM: New York, NY, USA, 2023; pp. 181–188. [Google Scholar]
  2. Petkov, M. Unlocking the Potential of the Metaverse for Branding. Available online: https://www.linkedin.com/pulse/unlocking-potential-metaverse-branding-martin-petkov (accessed on 4 May 2024).
  3. Sands, S.; Ferraro, C.; Demsar, V.; Chandler, G. False Idols: Unpacking the Opportunities and Challenges of Falsity in the Context of Virtual Influencers. Bus. Horiz. 2022, 65, 777–788. [Google Scholar] [CrossRef]
  4. Jafar, R.M.S.; Ahmad, W.; Sun, Y. Unfolding the Impacts of Metaverse Aspects on Telepresence, Product Knowledge, and Purchase Intentions in the Metaverse Stores. Technol. Soc. 2023, 74, 102265. [Google Scholar] [CrossRef]
  5. Robinson, B. Towards an Ontology and Ethics of Virtual Influencers. Australas. J. Inf. Syst. 2020, 24. [Google Scholar] [CrossRef]
  6. Barbosa, B. Virtual Influencers: A Bibliometric Analysis. In Using Influencer Marketing as a Digital Business Strategy; IGI Global: Hershey, PA, USA, 2024; pp. 163–188. ISBN 9798369305515. [Google Scholar]
  7. Global, K.E.D. Virtual Humans Expand Territory in Real World. Available online: https://www.kedglobal.com/artificial-intelligence/newsView/ked202205310020 (accessed on 23 April 2024).
  8. King, C. What Are Virtual Influencers and How Do They Work? Available online: https://hypeauditor.com/blog/the-rise-of-virtual-influencers-should-you-be-working-with-them/ (accessed on 4 May 2024).
  9. Rodrigo-Martín, L.; Rodrigo-Martín, I.; Muñoz-Sastre, D. Los Influencers Virtuales Como Herramienta Publicitaria En La Promoción de Marcas y Productos. Estudio de La Actividad Comercial de Lil Miquela. Rev. Lat. Comun. Soc 2021, 79, 69–90. [Google Scholar] [CrossRef]
  10. Gerlich, M. The Power of Virtual Influencers: Impact on Consumer Behaviour and Attitudes in the Age of AI. Adm. Sci. 2023, 13, 178. [Google Scholar] [CrossRef]
  11. Who Is Lu of Magalu? @magazineluiza, Explained. Available online: https://www.virtualhumans.org/human/lu-do-magalu (accessed on 4 May 2024).
  12. Shen, Z. Shall Brands Create Their Own Virtual Influencers? A Comprehensive Study of 33 Virtual Influencers on Instagram. Humanit. Soc. Sci. Commun. 2024, 11, 177. [Google Scholar] [CrossRef]
  13. Tesic, D.; Bogetić, Z. Models of Consumer Behavior: A Literature Review. Open J. Syst. 2022, 16, 21. [Google Scholar] [CrossRef]
  14. Lim, S.H.; Kim, D.J. Does Emotional Intelligence of Online Shoppers Affect Their Shopping Behavior? From a Cognitive-Affective-Conative Framework Perspective. Int. J. Hum.–Comput. Interact. 2020, 36, 1304–1313. [Google Scholar] [CrossRef]
  15. Dirwan, D.; Latief, F. Understanding the Psychology Behind Consumer Behavior. Adv. Bus. Ind. Mark. Res. 2023, 1, 130–145. [Google Scholar] [CrossRef]
  16. Hussin, H.; Abdul Wahid, N. Conceptualizing Customer Experience in Organic Food Purchase Using Cognitive-Affective-Behavior Model. J. Gov. Integr. 2023, 6, 577–586. [Google Scholar] [CrossRef]
  17. Huang, Y. The Effect of Virtual Endorserson Chinese Consumer’s Brand Attitude. Thammasat Rev. 2023, 26, 92113. [Google Scholar] [CrossRef]
  18. Feng, Y.; Chen, H.; Xie, Q. AI Influencers in Advertising: The Role of AI Influencer-Related Attributes in Shaping Consumer Attitudes, Consumer Trust, and Perceived Influencer–Product Fit. J. Interact. Advert. 2024, 24, 26–47. [Google Scholar] [CrossRef]
  19. Song, Y.; Wang, L.; Zhang, Z.; Hikkerova, L. AI or Human: How Endorser Shapes Online Purchase Intention? Comput. Hum. Behav. 2024, 158, 108300. [Google Scholar] [CrossRef]
  20. Thomas, V.L.; Fowler, K. Close Encounters of the AI Kind: Use of AI Influencers As Brand Endorsers. J. Advert. 2021, 50, 11–25. [Google Scholar] [CrossRef]
  21. Gao, J.; Zhao, X.; Zhai, M.; Zhang, D.; Li, G. AI or Human? The Effect of Streamer Types on Consumer Purchase Intention in Live Streaming. Int. J. Hum.–Comput. Interact. 2024, 41, 305–317. [Google Scholar] [CrossRef]
  22. Cheah, C.W.; Koay, K.Y.; Lim, W.M. Social Media Influencer Over-Endorsement: Implications from a Moderated-Mediation Analysis. J. Retail. Consum. Serv. 2024, 79, 103831. [Google Scholar] [CrossRef]
  23. Huang, Y.; Yu, Z. Understanding the Continuance Intention for Artificial Intelligence News Anchor: Based on the Expectation Confirmation Theory. Systems 2023, 11, 438. [Google Scholar] [CrossRef]
  24. Hwang, S.-I.; Ki, C. Impact of Virtual Idol Characteristics on Flow of Viewers, Performance Satisfaction, and Intention of Reviewing. J. Digit. Contents Soc. 2023, 24, 2277–2286. [Google Scholar] [CrossRef]
  25. Wan, A.; Jiang, M. Can Virtual Influencers Replace Human Influencers in Live-Streaming E-Commerce? An Exploratory Study from Practitioners’ and Consumers’ Perspectives. J. Curr. Issues Res. Advert. 2023, 44, 332–372. [Google Scholar] [CrossRef]
  26. Yan, J.; Xia, S.; Jiang, A.; Lin, Z. The Effect of Different Types of Virtual Influencers on Consumers’ Emotional Attachment. J. Bus. Res. 2024, 177, 114646. [Google Scholar] [CrossRef]
  27. Abilkaiyrkyzy, A.; Elhagry, A.; Laamarti, F.; Saddik, A.E. Metaverse Key Requirements and Platforms Survey. IEEE Access 2023, 11, 117765–117787. [Google Scholar] [CrossRef]
  28. Xu, J.; Liu, S.; Yang, W.; Fang, M.; Pan, Y. Beyond Reality: Exploring User Experiences in the Metaverse Art Exhibition Platform from an Integrated Perspective. Electronics 2024, 13, 1023. [Google Scholar] [CrossRef]
  29. Dwivedi, Y.K.; Hughes, L.; Wang, Y.; Alalwan, A.A.; Ahn, S.J.; Balakrishnan, J.; Barta, S.; Belk, R.; Buhalis, D.; Dutot, V.; et al. Metaverse Marketing: How the Metaverse Will Shape the Future of Consumer Research and Practice. Psychol. Mark. 2023, 40, 750–776. [Google Scholar] [CrossRef]
  30. Metaverse Influencer Marketing: Role, Future, and Top Influencers—Landvault Blog. Available online: https://landvault.io/blog/metaverse-influencer-marketing (accessed on 4 May 2024).
  31. Nan, L. Introducing China’s Top Virtual Idols: Ayayi and Luo Tianyi. Available online: https://jingdaily.com/posts/virtual-idols-china-celebrities-crackdown-ayayi-luo-tianyi (accessed on 23 April 2024).
  32. Vila-López, N.; Kuster-Boluda, I.; Mora-Pérez, E.; Pascual-Riquelme, I. A Bibliometric Analysis of Virtual Influencers in the Web of Science. J. Mark. Anal. 2023. [Google Scholar] [CrossRef]
  33. Lou, C.; Kiew, S.T.J.; Chen, T.; Lee, T.Y.M.; Ong, J.E.C.; Phua, Z. Authentically Fake? How Consumers Respond to the Influence of Virtual Influencers. J. Advert. 2023, 52, 540–557. [Google Scholar] [CrossRef]
  34. Gao, W.; Jiang, N.; Guo, Q. How Do Virtual Streamers Affect Purchase Intention in the Live Streaming Context? A Presence Perspective. J. Retail. Consum. Serv. 2023, 73, 103356. [Google Scholar] [CrossRef]
  35. Franke, C.; Groeppel-Klein, A.; Müller, K. Consumers’ Responses to Virtual Influencers as Advertising Endorsers: Novel and Effective or Uncanny and Deceiving? J. Advert. 2023, 52, 523–539. [Google Scholar] [CrossRef]
  36. Wang, K.; Wu, J.; Sun, Y.; Chen, J.; Pu, Y.; Qi, Y. Trust in Human and Virtual Live Streamers: The Role of Integrity and Social Presence. Int. J. Hum.–Comput. Interact. 2023, 40, 8274–8294. [Google Scholar] [CrossRef]
  37. Sestino, A.; D’Angelo, A. My Doctor Is an Avatar! The Effect of Anthropomorphism and Emotional Receptivity on Individuals’ Intention to Use Digital-Based Healthcare Services. Technol. Forecast. Soc. Change 2023, 191, 122505. [Google Scholar] [CrossRef]
  38. Zhang, R.; Wu, Q. Impact of Using Virtual Avatars in Educational Videos on User Experience. Sci. Rep. 2024, 14, 6592. [Google Scholar] [CrossRef]
  39. Dabiran, E.; Farivar, S.; Wang, F.; Grant, G. Virtually Human: Anthropomorphism in Virtual Influencer Marketing. J. Retail. Consum. Serv. 2024, 79, 103797. [Google Scholar] [CrossRef]
  40. Moustakas, E.; Lamba, N.; Mahmoud, D.; Ranganathan, C. Blurring Lines between Fiction and Reality: Perspectives of Experts on Marketing Effectiveness of Virtual Influencers. In Proceedings of the 2020 International Conference on Cyber Security and Protection of Digital Services (Cyber Security), Dublin, Ireland, 15–19 June 2020; pp. 1–6. [Google Scholar]
  41. Huang, Q.-Q.; Qu, H.-J.; Li, P. The Influence of Virtual Idol Characteristics on Consumers’ Clothing Purchase Intention. Sustainability 2022, 14, 8964. [Google Scholar] [CrossRef]
  42. Yu, Y.; Kwong, S.C.M.; Bannasilp, A. Virtual Idol Marketing: Benefits, Risks, and an Integrated Framework of the Emerging Marketing Field. Heliyon 2023, 9, e22164. [Google Scholar] [CrossRef]
  43. Haikel-Elsabeh, M. Virtual Influencers versus Real Influencers Advertising in the Metaverse, Understanding the Perceptions, and Interactions with Users. J. Curr. Issues Res. Advert. 2023, 44, 252–273. [Google Scholar] [CrossRef]
  44. Xu, J.; Zhang, X.; Li, H.; Yoo, C.; Pan, Y. Is Everyone an Artist? A Study on User Experience of AI-Based Painting System. Appl. Sci. 2023, 13, 6496. [Google Scholar] [CrossRef]
  45. Soomro, S.A.; Eyupoglu, S.Z.; Ali, F. Linking Customer Mindsets, Brand Engagement, and Citizenship Behavior: The Moderating Role of Brand Trust. J. Prod. Brand Manag. 2024, 33, 385–396. [Google Scholar] [CrossRef]
  46. Gursoy, D.; Chi, O.H.; Lu, L.; Nunkoo, R. Consumers Acceptance of Artificially Intelligent (AI) Device Use in Service Delivery. Int. J. Inf. Manag. 2019, 49, 157–169. [Google Scholar] [CrossRef]
  47. Wang, X.; Liu, Y.; He, W.; Wuji, S.; Luo, R. The Impact of Artificial Intelligence Voice Assistants on Consumer Experience Based on the Cognitive-Affective-Conative Model. SSRN J. 2022. [Google Scholar] [CrossRef]
  48. Chen, C.-F.; Girish, V.G. Investigating the Use Experience of Restaurant Service Robots: The Cognitive–Affective–Behavioral Framework. Int. J. Hosp. Manag. 2023, 111, 103482. [Google Scholar] [CrossRef]
  49. Huang, D.; Chen, Q.; Huang, J.; Kong, S.; Li, Z. Customer-Robot Interactions: Understanding Customer Experience with Service Robots. Int. J. Hosp. Manag. 2021, 99, 103078. [Google Scholar] [CrossRef]
  50. Fiore, A.M.; Kim, J. An Integrative Framework Capturing Experiential and Utilitarian Shopping Experience. Int. J. Retail. Distrib. Manag. 2007, 35, 421–442. [Google Scholar] [CrossRef]
  51. Zhu, L.; Li, H.; Nie, K.; Gu, C. How Do Anchors’ Characteristics Influence Consumers’ Behavioural Intention in Livestream Shopping? A Moderated Chain-Mediation Explanatory Model. Front. Psychol. 2021, 12, 730636. [Google Scholar] [CrossRef] [PubMed]
  52. Lee, D.; Seong Chou, H.; Yuran, P. Virtual influencers’ impacts on brand attitudes and purchasing intention of services and products. Inf. Soc. Media 2021, 22, 55–79. [Google Scholar] [CrossRef]
  53. Da Silva Oliveira, A.B.; Chimenti, P. “Humanized Robots”: A Proposition of Categories to Understand Virtual Influencers. Australas. J. Inf. Syst. 2021, 25, 1–27. [Google Scholar] [CrossRef]
  54. Zhao, D.; Han, K. How Virtual Influencer Characteristics Affect Purchase Intention: Focusing on Uncanny Valley Theory. Korean J. Advert. Public Relat. 2022, 24, 135–169. [Google Scholar] [CrossRef]
  55. Mouritzen, S.L.T.; Penttinen, V.; Pedersen, S. Virtual Influencer Marketing: The Good, the Bad and the Unreal. Eur. J. Mark. 2023, 58, 410–440. [Google Scholar] [CrossRef]
  56. Yang, J.; Chuenterawong, P.; Lee, H.; Chock, T.M. Anthropomorphism in CSR Endorsement: A Comparative Study on Humanlike vs. Cartoonlike Virtual Influencers’ Climate Change Messaging. J. Promot. Manag. 2023, 29, 705–734. [Google Scholar] [CrossRef]
  57. Kim, H.; Park, M. Virtual Influencers’ Attractiveness Effect on Purchase Intention: A Moderated Mediation Model of the Product–Endorser Fit with the Brand. Comput. Hum. Behav. 2023, 143, 107703. [Google Scholar] [CrossRef]
  58. Allal-Chérif, O.; Puertas, R.; Carracedo, P. Intelligent Influencer Marketing: How AI-Powered Virtual Influencers Outperform Human Influencers. Technol. Forecast. Soc. Change 2024, 200, 123113. [Google Scholar] [CrossRef]
  59. Garg, M.; Bakshi, A. Exploring the Impact of Beauty Vloggers’ Credible Attributes, Parasocial Interaction, and Trust on Consumer Purchase Intention in Influencer Marketing. Humanit. Soc. Sci. Commun. 2024, 11, 235. [Google Scholar] [CrossRef]
  60. Shao, Z. From Human to Virtual: Unmasking Consumer Switching Intentions to Virtual Influencers by an Integrated fsQCA and NCA Method. J. Retail. Consum. Serv. 2024, 78, 103715. [Google Scholar] [CrossRef]
  61. Koles, B.; Audrezet, A.; Moulard, J.G.; Ameen, N.; McKenna, B. The Authentic Virtual Influencer: Authenticity Manifestations in the Metaverse. J. Bus. Res. 2024, 170, 114325. [Google Scholar] [CrossRef]
  62. Um, N. Predictors Affecting Effects of Virtual Influencer Advertising among College Students. Sustainability 2023, 15, 6388. [Google Scholar] [CrossRef]
  63. Yu, J.; Dickinger, A.; So, K.K.F.; Egger, R. Artificial Intelligence-Generated Virtual Influencer: Examining the Effects of Emotional Display on User Engagement. J. Retail. Consum. Serv. 2024, 76, 103560. [Google Scholar] [CrossRef]
  64. Kim, H.; Park, M. When Digital Celebrity Talks to You: How Human-like Virtual Influencers Satisfy Consumer’s Experience through Social Presence on Social Media Endorsements. J. Retail. Consum. Serv. 2024, 76, 103581. [Google Scholar] [CrossRef]
  65. Ku, E.C.S. Anthropomorphic Chatbots as a Catalyst for Marketing Brand Experience: Evidence from Online Travel Agencies. Curr. Issues Tour. 2023, 27, 4165–4184. [Google Scholar] [CrossRef]
  66. Jain, R. The Influence of Anthropomorphic Spokescharacters on Consumers’ Recycling Intentions. Ph.D. Dissertation, Queensland University of Technology, Brisbane, QLD, Australia, 2021. [Google Scholar]
  67. Byun, K.J.; Ahn, S.J. (Grace) A Systematic Review of Virtual Influencers: Similarities and Differences between Human and Virtual Influencers in Interactive Advertising. J. Interact. Advert. 2023, 23, 293–306. [Google Scholar] [CrossRef]
  68. Yin, J.; Qiu, X. AI Technology and Online Purchase Intention: Structural Equation Model Based on Perceived Value. Sustainability 2021, 13, 5671. [Google Scholar] [CrossRef]
  69. Li, S.; Ham, J.; Eastin, M.S. Social Media Users’ Affective, Attitudinal, and Behavioral Responses to Virtual Human Emotions. Telemat. Inform. 2024, 87, 102084. [Google Scholar] [CrossRef]
  70. Taglinger, M.; Jordan, S.; Kracklauer, A.H. Acceptance of Artificially Intelligent Digital Humans in Online Shops: A Modelling Approach. J. Appl. Interdiscip. Res. 2023, 28–49. [Google Scholar] [CrossRef]
  71. Nadeem, W.; Khani, A.H.; Schultz, C.D.; Adam, N.A.; Attar, R.W.; Hajli, N. How Social Presence Drives Commitment and Loyalty with Online Brand Communities? The Role of Social Commerce Trust. J. Retail. Consum. Serv. 2020, 55, 102136. [Google Scholar] [CrossRef]
  72. Arachchi, H.A.D.M.; Samarasinghe, G.D. Intention to Adopt Intelligent Clothing in the Fashion Retail Industry: Extending the HISAM Model with Technology Readiness. Int. J. Hum.–Comput. Interact. 2023, 40, 6374–6388. [Google Scholar] [CrossRef]
  73. Kang, W.; Shao, B.; Zhang, Y. How Does Interactivity Shape Users’ Continuance Intention of Intelligent Voice Assistants? Evidence from SEM and fsQCA. Psychol. Res. Behav. Manag. 2024, 17, 867–889. [Google Scholar] [CrossRef] [PubMed]
  74. Seong, B.-H.; Hong, C.-Y. Corroborating the Effect of Positive Technology Readiness on the Intention to Use the Virtual Reality Sports Game “Screen Golf”: Focusing on the Technology Readiness and Acceptance Model. Inf. Process. Manag. 2022, 59, 102994. [Google Scholar] [CrossRef]
  75. Kim, M.J.; Lee, C.-K.; Preis, M.W. The Impact of Innovation and Gratification on Authentic Experience, Subjective Well-Being, and Behavioral Intention in Tourism Virtual Reality: The Moderating Role of Technology Readiness. Telemat. Inform. 2020, 49, 101349. [Google Scholar] [CrossRef]
  76. Yu, H. Who Is Rozy, South Korea’s First Virtual Influencer? Available online: https://www.tatlerasia.com/style/fashion/rozy-virtual-influencer-south-korea (accessed on 19 July 2024).
  77. Service (KOCIS), K.C. and I. AI Model Rozy Gives “interview” on Career, Interests: Korea.Net: The Official Website of the Republic of Korea. Available online: https://www.korea.net/NewsFocus/HonoraryReporters/view?articleId=206305 (accessed on 19 July 2024).
  78. MVFW—LOCUS-X x OHROZY x ILONA SONG Fashion Show by Exclusible. Available online: https://decentraland.org/events/event/?id=f88bfe1a-0d25-4053-bcf7-447f168bf98f (accessed on 19 July 2024).
  79. Na, Y.; Kim, Y.; Lee, D. Investigating the Effect of Self-Congruity on Attitudes toward Virtual Influencers: Mediating the Effect of Emotional Attachment. Int. J. Hum.–Comput. Interact. 2023, 40, 5534–5547. [Google Scholar] [CrossRef]
  80. Chen, E. The Power of AI: How Virtual Korean Influencer Rozy Is Set to Earn $2 Million in Sponsorships. Available online: https://www.linkedin.com/pulse/power-ai-how-virtual-korean-influencer-rozy-set-earn-2-erik-chen (accessed on 24 April 2024).
  81. Hair, J.F.; Hult, G.T.M.; Ringle, C.M.; Sarstedt, M. A Primer on Partial Least Squares Structural Equation Modeling (PLS-SEM); Sage Publications: Thousand Oaks, CA, USA, 2014; ISBN 978-1-4522-1744-4. [Google Scholar]
  82. Shanthi, R. Multivariate Data Analysis: Using Spss snd Amos; MJP Publishers: Chennai, India, 2019. [Google Scholar]
  83. Hair, J.F., Jr.; Sarstedt, M.; Hopkins, L.; Kuppelwieser, V.G. Partial Least Squares Structural Equation Modeling (PLS-SEM): An Emerging Tool in Business Research. Eur. Bus. Rev. 2014, 26, 106–121. [Google Scholar] [CrossRef]
  84. Chin, W.; Marcoulides, G. The Partial Least Squares Approach to Structural Equation Modeling. Mod. Methods Bus. Res. 1998, 295, 295–336. [Google Scholar]
  85. Amora, J.T. Convergent Validity Assessment in PLS-SEM: A Loadings-Driven Approach. Data Anal. Perspect. J. 2021, 2, 1–6. [Google Scholar] [CrossRef]
  86. Gupta, G.; Singharia, K. Consumption of OTT Media Streaming in COVID-19 Lockdown: Insights from PLS Analysis. Vision 2021, 25, 36–46. [Google Scholar] [CrossRef]
  87. Lee, J.A.; Sudarshan, S.; Sussman, K.L.; Bright, L.F.; Eastin, M.S. Why Are Consumers Following Social Media Influencers on Instagram? Exploration of Consumers’ Motives for Following Influencers and the Role of Materialism. Int. J. Advert. 2022, 41, 78–100. [Google Scholar] [CrossRef]
  88. Sharma, M.; Joshi, S.; Luthra, S.; Kumar, A. Impact of Digital Assistant Attributes on Millennials’ Purchasing Intentions: A Multi-Group Analysis Using PLS-SEM, Artificial Neural Network and fsQCA. Inf. Syst. Front. 2024, 26, 943–966. [Google Scholar] [CrossRef] [PubMed]
  89. Wang, X.; Qiu, X. The Positive Effect of Artificial Intelligence Technology Transparency on Digital Endorsers: Based on the Theory of Mind Perception. J. Retail. Consum. Serv. 2024, 78, 103777. [Google Scholar] [CrossRef]
Figure 1. Proposed conceptual model.
Jtaer 20 00082 g001
Figure 2. Oh Rozy at the 2nd Metaverse Fashion Week (MVFW).
Jtaer 20 00082 g002
Figure 3. Proposed conceptual model.
Jtaer 20 00082 g003
Table 1. Relevant information about AIBEs on social media from different countries.
NameTimeOccupationPlatformFansNationBrandsCompanyPictureType
Lu Do Magalu2009.8.13Virtual ambassadorInstagram693 wBrazil16 brands (Adidas, Red Bull, MAC, Maybelline, Samsung)Magazine LuizaJtaer 20 00082 i001A
Lil Miquela2016.4.23Global pop starInstagram261 wUSA47 brands (Chanel, Prada, UGG, Calvin Klein, Burberry, LV)BrudJtaer 20 00082 i002A
Shudu2017.4.22Digital supermodelInstagram240 wSouth Africa34 brands (LV, Cosmopolitan, Vogue, Air Jordans, Ferragamo, Prada, CK)The DigitalsJtaer 20 00082 i003A
Noonoouri2018.2.1ActivistInstagram44 wFrance43 brands (Dior, Honor, Gucci, Skims, Prada, Lacoste, Versace)IMG ModelsJtaer 20 00082 i004B
Imma2018.7.12Fashion girlInstagram38.8 wJapan11 brands (IKEA, Amazon, Dior, Puma, Nike, Coach, SK-II, Lenovo)aww.tokyoJtaer 20 00082 i005A
Guggimon2019.6.18Fashion horror artistInstagram136 wUSA5 brands (Gucci, Rico Nasty, Snoop Dogg)SuperplasticJtaer 20 00082 i006C
Nobody Sausage2020.4.5Happy partnerInstagram788 wPortugal30 brands (Hugo Boss, Netflix, Adidas, Boss, Lotte)Kael CabralJtaer 20 00082 i007C
Oh Rozy2020.8.19Singer, modelInstagram16.8 wRepublic of Korea50 brands (Tiffany & Co, Hera, CK)Sidus Studio XJtaer 20 00082 i008A
Liu Yexi2021.10.31Virtual beauty artistTikTok809 wChina200 brands (Xiaopeng Motors, VIVO, Clarins, Anta)Chuangyi VideoJtaer 20 00082 i009A
Retrieved 24 April 2024 from Instagram, TikTok, and Weibo. Type A = human-like VIs, type B = animated human VIs, type C = non-human VIs.
Table 2. Empirical studies of AIVIs in different areas in recent years.
AuthorsObject/FieldIVMVDVMain Findings
W. Gao et al. [34]Virtual streamers,
live streaming commerce
Likeability, animacy, responsiveness, social presence, telepresence/Purchase intentionLikability, animacy, and responsiveness enhance social presence and telepresence, thus promoting purchase intentions. Likability and responsiveness directly increase purchase intentions, but animacy does not.
Franke et al. [35]Virtual advertising endorsers,
advertising industry
Attitude toward the influencer,
perceived novelty,
perceived innovativeness,
labeling information,
attitude toward
perceived expertise
Product categoryPurchase intentionVirtual endorsers lead to higher ad novelty. Advertised product categories moderated purchase intentions.
Wang et al. [36]Virtual live streamers,
live business
Integrity, ability, benevolence, perceived predictability, trust, social presence, perceived enjoyment, perceived similarity/Purchase intentionSocial presence affects trust in both types of virtual live streamers, but it only directly affects purchase intentions. Perceived enjoyment and similarity also affect purchase intentions.
Sestino and D’Angelo [37]Virtual agents,
digital healthcare service

Perceived anthropomorphism, intention to use,
human-like interaction level (low vs. high)
Emotional receptivityIntention to useHigher levels of interaction with humans positively influence an individual’s intention to use such medical services through the effect of perceived anthropomorphism. This effect is only significant in individuals with higher emotional receptivity.
Y. Huang and Yu [23]Virtual news anchors,
television news industry
Perceived anthropomorphism, perceived intelligence, perceived attractiveness, perceived novelty, information quality, trust, satisfaction, confirmation of expectations/Continuance intentionSatisfaction, perceived intelligence, and trust directly predicted continuance intention.
J. Gao et al. [21]Virtual streamers,
online shopping
Streamer type,
perceived intimacy, perceived responsiveness
Consumers’novelty seekingConsumer purchase intentionCompared with virtual streamers, consumers have higher purchase intention when they receive services from human streamers. Perceived intimacy and perceived responsiveness positively affect consumers’ purchase intention.
Cheah et al. [22]Virtual influencers,
social media
Over-endorsement, influencer authenticity, influencer credibilityProduct interestPurchase intentionsOver-endorsement did not directly affect consumers’ purchase intentions; reduced credibility of SMEs can moderate purchase intentions.
Zhang and Wu [38]Virtual avatars,
educational science
Video quality, content quality, virtual avatar expressiveness,/Learning effect, emotional experience, user engagementHigh levels of avatar expressiveness can significantly improve user learning, emotional experience, and user engagement, and the content quality dimension of the influencing factor has a significant negative effect on all three dimensions of the user experience.
Dabiran et al. [39]Virtual humans,
marketing
Appearance, moral virtue, cognitive experience, conscious emotionality, perceived credibility, parasocial relationshipsInfluencer–product congruencePurchase intentionAppearance had no significant effect on conscious emotion. Perceived credibility and parasocial relationships both had a positive effect on purchase intentions, with the effect of parasocial relationships being stronger.
Table 3. Researchers’ summaries of the characteristics of AIVIs in the last four years.
VI CharacteristicRelevant WordsDefinitionSources
Attractiveness/AIVIs have the appearance or character to attract the attention and interest of consumers.A, B, C, D, E, G, H, J, M, N, P, Q
ProfessionalismExpertiseAIVIs have professional knowledge and technical expertise in a specific field or industry.A, D, E, M, O, P, Q
AuthenticityTrustworthiness, ReliabilityAIVIs are reliable; consumers trust their words and actions and create an emotional connection with AIVIs.B, C, E, P, T, U
AnthropomorphismIntegrity, Benevolence, Cuteness, Likeability, Animacy, CuriosityAIVIs have a human-like appearance and behavioral characteristics that make consumers feel close to them.B, C, D, E, H, I, K, L, R, S, U
ScalabilityTranscendenceAIVIs can adapt flexibly to different application scenarios and brand needs.C, J
ControllabilityOwnership, Customization, Automation, StabilityAIVIs can be easily controlled and adjusted in terms of their behavior, performance, or expression by the designer.C, F, J
PopularityCommercialityAIVIs are popular among consumers and have a large influence.D, J
Relevance/AIVIs can have strong relevance to specific themes, topics, and target audiences.D, O
HomogeneitySimilarityAIVIs may have similarities to real humans in appearance, behavior, and personality.D, E, G, J, M
Exposure/AIVIs have high exposure and visibility on social media or platforms.G
IntelligenceResponsiveness, AbilityAIVIs have the ability to simulate human expressions and actions.H, I, K, S
Predictability/AIVIs can use big data to make predictions about consumer behavior.K
Parasocial Interaction/AIVIs interact with consumers in a way similar to genuine social relationships.L, Q, U
Sources: A (Zhu et al. [51]); B (Lee et al. [52]); C (Oliveira & Chimenti [53]); D (Q.-Q. Huang et al. [41]); E (Zhao & Han [54]); F (Mouritzen et al. [55]); G (Yu et al. [42]); H (Y. Huang & Yu [23]); I (Gao et al. [34]); J (Hwang & Ki [24]); K (Wang et al. [36]); L (Sestino & D’Angelo [37]); M (Yang et al. [56]); N (Kim & Park [57]); O (Gerlich [10]); P (Allal-Chérif et al. [58]); Q (Garg & Bakshi [59]); R (Dabiran et al. [39]); S (Shao [60]); T (Koles et al. [61]); U (Um [62]).
Table 4. Statistical information on the demographic distribution of the participants, n = 302.
VariableCategoryFrequency (n = 302)Percent (%)
GenderMale14648.3
Female15651.7
Age (years)18~29 (Gen Z)15852.3
30~44 (Gen M)14447.7
EducationBelow undergraduate10635.1
Undergraduate16354.0
Postgraduate217.0
Doctor124.0
OccupationUniversity students10635.1
Workers19664.9
Monthly income (CNY)≤CNY 300011638.4
CNY 3001–600013946.0
CNY 6001–90003411.3
CNY 9001–12,00072.3
≥CNY 12,00162.0
Explore AIBE-recommended productsYes30284.36
No5615.64
Total participants 100.0
Table 5. Reliability and validity analysis.
ConstructCACRAVE
CognitiveAttractiveness (ATT)0.9340.9530.834
Anthropomorphism (ANT)0.9220.9450.810
Interactivity (INT)0.9300.9500.826
Authenticity (AUT)0.9340.9530.835
AffectiveHedonic motivation (HM)0.9450.9580.820
Social presence (SP)0.9270.9480.821
Trust in AIBEs (TAI)0.9370.9550.840
BehavioralPurchase intention (PI)0.9340.9530.835
Technology
Readiness
Optimism (OPT)0.9340.9530.835
Innovativeness (INN)0.9060.9410.841
Table 6. Discriminant validity (Fornell–Larcker criterion).
ATTANTINTAUTHMSPTAIPIOPTINN
ATT0.913
ANT0.2690.900
INT0.2140.2680.909
AUT0.3330.3220.3600.914
HM0.3300.2950.2840.4480.905
SP0.3090.3170.3930.3500.3190.906
TAI0.2640.3030.3890.4280.3710.3410.917
PI0.1680.2410.2730.2720.2300.3280.2850.914
OPT0.2680.3400.3330.3520.4040.4110.4250.4260.914
INN0.3630.2820.1970.2730.3710.2990.3660.2520.2350.917
Table 7. Discriminant validity (HTMT values).
ATTANTINTAUTHMSPTAIPIOPTINN
ATT-
ANT0.288-
INT0.2270.287-
AUT0.3540.3460.383-
HM0.3500.3140.2980.477-
SP0.3310.3410.4200.3750.340-
TAI0.2810.3230.4130.4560.3940.365-
PI0.1800.2570.2920.2890.2440.3500.302-
OPT0.2870.3660.3540.3770.4320.4430.4530.452-
INN0.3950.3080.2150.2960.3980.3240.3970.2700.259-
Table 8. Discriminant validity (cross-loadings).
ATTANTINTAUTHMSPTAIPIOPTINN
ATT10.909 0.227 0.154 0.240 0.269 0.262 0.231 0.160 0.225 0.333
ATT20.917 0.262 0.211 0.377 0.340 0.266 0.291 0.180 0.286 0.368
ATT30.922 0.207 0.198 0.297 0.310 0.309 0.227 0.138 0.244 0.317
ATT40.905 0.287 0.213 0.295 0.281 0.289 0.212 0.137 0.221 0.308
ANT10.251 0.902 0.242 0.259 0.251 0.294 0.271 0.227 0.309 0.257
ANT20.211 0.908 0.230 0.290 0.253 0.242 0.260 0.220 0.301 0.216
ANT30.275 0.895 0.250 0.313 0.306 0.306 0.311 0.221 0.304 0.265
ANT40.224 0.895 0.240 0.294 0.247 0.292 0.242 0.199 0.310 0.271
INT10.197 0.259 0.908 0.326 0.266 0.326 0.328 0.301 0.271 0.201
INT20.213 0.272 0.915 0.370 0.313 0.395 0.402 0.241 0.348 0.165
INT30.184 0.216 0.914 0.294 0.252 0.359 0.330 0.222 0.300 0.164
INT40.179 0.221 0.897 0.311 0.186 0.339 0.345 0.231 0.283 0.192
AUT10.303 0.283 0.341 0.911 0.377 0.357 0.389 0.255 0.320 0.260
AUT 20.306 0.307 0.359 0.917 0.444 0.334 0.395 0.282 0.345 0.250
AUT 30.290 0.269 0.313 0.914 0.412 0.298 0.394 0.221 0.319 0.233
AUT 40.318 0.318 0.301 0.911 0.405 0.285 0.385 0.233 0.301 0.256
HM10.292 0.293 0.271 0.392 0.916 0.298 0.328 0.210 0.363 0.281
HM20.317 0.259 0.279 0.435 0.914 0.318 0.346 0.214 0.370 0.395
HM30.323 0.229 0.248 0.415 0.895 0.272 0.352 0.175 0.367 0.266
HM40.271 0.282 0.258 0.397 0.905 0.298 0.356 0.221 0.387 0.372
HM50.293 0.272 0.229 0.389 0.897 0.258 0.300 0.222 0.343 0.363
SP10.283 0.324 0.347 0.362 0.311 0.905 0.293 0.242 0.382 0.233
SP20.292 0.291 0.342 0.287 0.278 0.901 0.291 0.308 0.341 0.286
SP30.300 0.250 0.356 0.341 0.318 0.917 0.360 0.334 0.374 0.307
SP40.243 0.285 0.377 0.278 0.249 0.901 0.289 0.304 0.393 0.254
TAI10.213 0.264 0.367 0.371 0.316 0.342 0.918 0.281 0.395 0.317
TAI20.269 0.285 0.345 0.422 0.382 0.333 0.914 0.246 0.406 0.379
TAI30.248 0.264 0.319 0.363 0.318 0.293 0.907 0.212 0.340 0.305
TAI40.236 0.294 0.390 0.407 0.341 0.282 0.926 0.299 0.412 0.337
PI10.152 0.277 0.262 0.274 0.237 0.306 0.250 0.904 0.407 0.229
PI20.161 0.221 0.241 0.244 0.209 0.306 0.256 0.925 0.386 0.245
PI30.156 0.158 0.212 0.216 0.187 0.247 0.239 0.900 0.355 0.201
PI40.147 0.217 0.277 0.257 0.207 0.333 0.293 0.925 0.404 0.243
OPT10.219 0.309 0.313 0.307 0.343 0.349 0.379 0.441 0.924 0.166
OPT 20.259 0.358 0.279 0.337 0.358 0.420 0.387 0.381 0.910 0.236
OPT 20.225 0.270 0.285 0.312 0.372 0.355 0.388 0.356 0.906 0.210
OPT 20.283 0.305 0.341 0.334 0.410 0.382 0.404 0.369 0.915 0.254
INN10.341 0.285 0.219 0.268 0.346 0.294 0.341 0.232 0.241 0.912
INN20.325 0.236 0.175 0.248 0.359 0.276 0.328 0.259 0.190 0.931
INN30.336 0.257 0.145 0.234 0.310 0.248 0.341 0.196 0.217 0.908
Table 9. Summary of hypothesis tests.
HRelationshipβT-Valuep2.50% CI97.50 CIVIFStatus
H1aATT → HM0.2424.3750.0000.1330.3521.104Yes
H2bATT → SP0.1612.7210.0070.0420.2781.170Yes
H2aANT → HM0.1813.1660.0020.0700.2951.135Yes
H2bANT → SP0.1542.5280.0120.0360.2751.182Yes
H3aINT → HM0.1843.3430.0010.0780.2961.103Yes
H3bINT → SP0.2624.4920.0000.1460.3751.191Yes
H4aAUT → SP0.1522.2800.0230.0220.2831.300Yes
H4bAUT → TAI0.4287.9430.0000.3220.5341.000Yes
H5aHM → PI 0.0020.0230.981−0.1230.1391.424No
H5bSP → PI0.1452.2180.0270.0190.2761.381Yes
H5cTAI → PI0.0630.8470.397−0.0840.2111.481No
H6aOPT → PI 0.3514.8940.0000.2080.4941.504Yes
H6bOPT × HM → PI 0.0831.1200.2630.0130.2711.323No
H6cOPT × SP → PI−0.0220.3060.760−0.0670.2091.543No
H6dOPT × TAI → PI0.1231.5910.112−0.1640.1181.380No
H7aINN → PI 0.1382.1020.036−0.0640.2301.527Yes
H7bINN × HM → PI −0.0030.0530.958−0.0290.2761.426No
H7cINN × SP → PI−0.0490.7110.477−0.1390.1231.387No
H7dINN × TAI → PI0.0721.0180.309−0.1870.0821.479No
CI refers to the Confidence Interval, which in this table represents the 2.5%–97.5% range.
Table 10. MGA analysis by generation: Gen Z (n = 158) vs. Gen M (n = 144).
Gen Z (n = 158)Gen M (n = 144)
HPathβT-Valuep-ValueβT-Valuepp (Difference)Status
H1aATT → HM0.2903.9660.0000.1942.3260.0200.386No
H2bATT → SP0.1491.8740.0610.1721.9480.0510.848No
H2aANT → HM0.1562.0420.0410.2192.5470.0110.611No
H2aANT → SP0.2622.9830.0030.0820.9430.3460.133No
H3aINT → HM0.2042.5140.0120.1762.2760.0230.815No
H3bINT → SP0.1111.3600.1740.3814.5290.0000.022Significant
H4aAUT → SP0.1841.8880.0590.1641.7530.0800.899No
H4bAUT → TAI0.4035.3100.0000.4726.0270.0000.517No
H5aHM → PI 0.1021.0180.309−0.1461.8720.0610.050Significant
H5bSP → PI0.2132.3820.0170.1311.1900.2340.485No
H5cTAI → PI−0.0150.1370.8910.1801.5410.1230.212No
H6aOPT → PI 0.3783.8500.0000.3142.7300.0060.749No
H6bOPT × HM → PI 0.1131.0510.2930.0800.7860.4320.782No
H6cOPT × SP → PI−0.0860.7630.446−0.0200.1810.8560.806No
H6dOPT × TAI → PI0.0790.6800.4960.1861.4930.1360.668No
H7aINN → PI 0.1421.4920.1360.1861.9870.0470.515No
H7bINN × HM → PI 0.0500.5710.5680.0110.1250.9000.734No
H7cINN × SP → PI−0.0690.6130.540−0.0210.1200.9050.707No
H7dINN × TAI → PI0.1942.2120.027−0.0990.7050.4810.076No
Table 11. MGA analysis by occupation: university students (n = 106) vs. workers (n = 196).
University Students (n = 106)workers (n = 196)
HRelationshipβT-ValuepβT-Valuepp (Difference)Status
H1aATT → HM0.2863.2450.0010.2173.0960.0020.539No
H2bATT → SP0.1071.2020.2300.1932.6790.0070.450No
H2aANT → HM0.1821.9270.0540.2052.9290.0030.831No
H2aANT → SP0.3983.7240.0000.0741.0220.3070.014Significant
H3aINT → HM0.1141.2590.2080.2193.2750.0010.356No
H3bINT → SP0.0670.6810.4960.3234.3850.0000.039Significant
H4aAUT → SP0.1621.6490.0990.1641.8890.0590.980No
H4bAUT → TAI0.4324.8130.0000.4306.4540.0000.984No
H5aHM → PI 0.1120.9690.332−0.0781.0440.2970.167No
H5bSP → PI0.2262.0070.0450.0921.0980.2720.332No
H5cTAI → PI−0.1241.0310.3030.1882.0750.0380.046Significant
H6aOPT → PI 0.3923.3050.0010.3073.2750.0010.569No
H6bOPT × HM → PI 0.1751.6330.1030.1712.1510.0320.973No
H6cOPT × SP → PI0.2031.6090.1080.0360.4100.6820.275No
H6dOPT × TAI → PI−0.1551.2430.2140.0060.0680.9460.285No
H7aINN → PI 0.0290.2240.8230.1861.8240.0680.339No
H7bINN × HM → PI −0.0830.6320.5280.0751.0460.2960.273No
H7cINN × SP → PI0.0490.3740.708−0.0350.4040.6860.557No
H7dINN × TAI → PI0.1981.8700.062−0.0870.8870.3750.048Significant
Disclaimer/Publisher’s Note: The statements, opinions and data contained in all publications are solely those of the individual author(s) and contributor(s) and not of MDPI and/or the editor(s). MDPI and/or the editor(s) disclaim responsibility for any injury to people or property resulting from any ideas, methods, instructions or products referred to in the content.

