Abstract
The PARSIFAL project (Prandtlplane ARchitecture for the Sustainable Improvement of Future AirpLanes) aims to promote an innovative box-wing aircraft: the PrandtlPlane. Aircraft developed adopting this configuration are expected to achieve a payload capability higher than common single aisle analogues (e.g., Airbus 320 and Boeing 737 families), without any increase in the overall dimensions. We estimated the exhaust emissions from the PrandtlPlane and compared the corresponding impacts to those of a conventional reference aircraft, in terms of Global Warming Potential (GWP) and Global Temperature Potential (GTP), on two time-horizons and accounted for regional sensitivity. We considered carbon dioxide, carbonaceous and sulphate aerosols, nitrogen oxides and related ozone production, methane degradation and nitrate aerosols formation, contrails, and contrail cirrus. Overall, the introduction of the PrandtlPlane is expected to bring a considerable reduction of climate change in all the source regions considered, on both the time-horizons examined. Moreover, fuel consumption is expected to be reduced by 20%, as confirmed through high-fidelity Computational Fluid Dynamics (CFD) simulations. Sensitivity of data, models, and metrics are detailed. Impact reduction and mitigation strategies are discussed, as well as the gaps to be addressed in order to develop a comprehensive Life Cycle Assessment on aircraft emissions.
1. Introduction
Climate change is going to become even more of public concern. As stated from the Intergovernmental Panel on Climate Change (IPCC) in the Special Report ‘Global Warming of 1.5 °C’, which will be included in the 2022 AR6 Synthesis Report:
“Human activities are estimated to have caused approximately 1.0 °C of global warming above pre-industrial levels, with a likely range of 0.8 °C to 1.2 °C. Global warming is likely to reach 1.5 °C between 2030 and 2052 if it continues to increase at the current rate (high confidence).”[1]
In 2015, international aviation consumed ~160 Mt of fuel, corresponding to the emission of ~506 Mt of carbon dioxide and ~2.50 Mt of nitrogen oxides [2]. Amongst the several impacts of aircraft emissions on the ecosystems, there is the modification of the composition and the radiation balance of the atmosphere. The 2018 net aviation Effective Radiative Forcing (ERF) has been estimated as +100.9 milliwatts (mW) m−2 (5–95% likelihood range of (55, 145)), with major contributions from contrail cirrus (57.4 mW m−2), CO2 (34.3 mW m−2), and NOx (17.5 mW m−2) [3]. Moreover, since 2005, air transport has increased from 2.14 to 4.32 billion passengers carried on scheduled services in 2018 [4,5]. The demand for air transport continues to grow; the ICAO [6] forecasts in terms of Revenue Passengers-Kilometer (RPK) are shown in Figure S1. The predicted Compound Annual Growth Rate (CAGR) until 2035 is equal to 4.3%.
Atmospheric emissions resulting from aircraft operations include carbon dioxide (CO2), other carbonaceous gases and carbonaceous particles, sulfur, nitrogen oxides (NOx), and water. All these substances act over different spatial and temporal scales [7]. CO2 production is directly proportional to the fuel burnt (3155 g kg−1) [8,9]. Once emitted, other carbonaceous gases undergo photochemical transformation processes. The resulting compounds may condense due to their low volatility and form the fraction of carbonaceous aerosol referred as organic carbon (OC), while directly emitted carbonaceous particles associated to incomplete combustion are known as black carbon (BC) [10]. Sulphur content of the fuel undertake oxidation to SO2 and then to SO4--, leading to sulfuric acid aerosols [11]. Emissions of NOx lead to ozone (O3) production and methane (CH4) degradation [12]. Furthermore, NOx emissions enhance nitrate aerosol concentrations [13]. Water vapor produced by aircraft engines may condense into droplets originating contrails (or ‘condensation trails’), line-shaped high-altitude clouds, while aerodynamic contrails can result from expansion of the air flowing across the wings. Moreover, cirrus clouds evolve from contrails under suitable atmospheric conditions [14,15].
1.1. Available Strategies to Fight Climate Change
There are different strategies to reduce or mitigate the climate impact of aircraft emissions: operational measures, technological advances, and regulatory approaches.
Amongst the first, intermediate stop operations (i.e., opting for intermediate landings for refueling) may reduce fuel consumption [16,17,18]. Indeed, higher average cruise altitudes can be maintained due to the decreased aircraft mass. Recently, missions were simulated, assuming an intermediate stop at the location corresponding to the highest fuel saving [14]. Results demonstrate that if this strategy was adopted globally, fuel consumption would be reduced, as well as CO2, water, and sulfur dioxide emissions, by 4.8%. Moreover, a 4.6% decrease of NOx emission would be expected. Conversely, an increase of 33.3% and 43.4% of CO and HC emissions, respectively, would be expected. Indeed, these substances are mostly released in descent, approach, and landing flight phases at low engine thrust level.
Further operational measures under investigation are Eco-Efficient Flight procedures. Optimum trajectories have been proposed, considering the strong dependency of the non-CO2 emissions impact on location and time of generation [19,20,21]. However, avoiding high sensitivity areas results in augmented costs due to detours and off-design altitudes [22].
The optimization of the engine cycle with the aim to reduce the fuel demand or allow the use of alternative fuel is both promising, but only the former has received proper attention. Consistent reductions in fuel burn have been reached through the reduction of the turbofan engine specific fuel consumption [23], enhancing fan diameter and fan flow (i.e., reducing specific thrust, increasing the propulsive efficiency) and raising the temperature at the high-pressure turbine rotor and the overall pressure ratio (i.e., increasing thermal efficiency) [24]. Alternative approaches are the implementation of advanced intercooled cycles [25,26,27,28] and intercooled–recuperated core cycles [29,30,31]. The optimization of aircraft engines can be carried out either by the minimization of the fuel burn, and thus CO2 emissions, or by minimizing the production of nitrogen oxides [32]. Aggressive turbofan designs are associated to reduced CO2 emission, but high NOx emissions are expected due to augmented flame temperatures [24].
As highlighted in the strategic document “FlightPath 2050: Europe’s Vision for Aviation” [33], the European vision of the future aviation is focused on the challenge of reducing pollutant emissions, while meeting the expected increase in air traffic demand. Hence, academia and industry are exploring both new technologies to reduce fuel consumption and alternative fuels with low environmental footprint (e.g., hydrogen, biofuels, etc.). Among the new technologies, a significant role is played by the research on novel aircraft configurations, which aims to explore the benefits of architectures different than conventional “tube and wing” ones.
An example is given by Strut-Braced Wing (SBW) aircraft, which are characterized by a higher aspect ratio wing with reduced weight than equally sized conventional cantilever wing aircraft, allowing the use of smaller engines with associated reduction of fuel demand. This configuration, with a counter-rotating open rotor engine, has been investigated as a more efficient alternative to the 101–150 seat aircrafts [14,34].
The SBW and other similar concepts are based on the increase of aircraft wingspan, which is in contrast with the low availability of space in the increasingly saturated present airports. Therefore, different alternative architectures have been proposed to improve the aerodynamics with no increase of the overall aircraft dimensions, hence maintaining the compatibility with the actual airport layout. Among these, the box-wing configuration has been studied since 1990s at University of Pisa. This layout has been inspired by studies carried out by Ludwig Prandtl in 1924 on the so-called “best wing system” which reduces the induced drag [35]. Research performed at the University of Pisa have confirmed the existence of a closed-form-solution to the minimum induced drag problem [36], and thus the application of the Prandtl’s concept to several categories [37], including both passenger and leisure aircraft [38]. In Prandtl’s honor, the aircraft architecture based on the “best wing system” has been then called PrandtlPlane, hereafter called PrP.
The regulatory approach is the main drive of operational and technological advances. Environmental economics theory has demonstrated that taxes, charges, and emissions trading (i.e., measures implemented on the basis of marginal cost pricing) induce major benefits than ‘command and control’ politics, complying with environmental targets cost efficiently [39,40]. An Emissions Trading Scheme (EU ETS) regulating emissions of carbon dioxide from stationary sources is in force in the European Union, Iceland, Norway, and Liechtenstein since 2005 [41]. The EU ETS relies on the ‘cap and trade’ approach. A cap on the amount of defined greenhouse gases generated by installations is set and reduced over time. Companies can receive or buy emission allowances and trade them; if a company cannot surrender enough allowances to cover all its emissions yearly, heavy fines are imposed. Conversely, spare allowances resulting from emission profiles over the cap can be kept for future needs or sell them to other companies. Trading guarantees emission cut where it costs least to do so [42]. International aviation has been part of the EU-ETS since 2012 [43]. However, only CO2 impacts have been included in the EU-ETS [44,45]. The same applies for the ‘Carbon Offsetting and Reduction Scheme for International Aviation’ (CORSIA), South Korean, New Zealand, and the Chinese Trading Schemes. Besides these policies, the International Civil Aviation Organization (ICAO) set NOx emission standards for aircraft engines [41].
1.2. Climate Metrics
Very recently, the European Council encouraged the EU Commission to increase the effort on addressing the impact of non-CO2 aircraft emissions [46]. How can these be included in the EU-ETS?
Climate metrics allow the aggregation of different greenhouse impacts on a common scale. The Global Warming Potential (GWP) metric is the time-integrated global mean radiative forcing of 1 kg pulse emissions of some compound relative to that of 1 kg of CO2, which is the reference gas [47]. The application of GWP can convert any greenhouses gas into carbon dioxide equivalents (CO2-eq), as well as the Global Temperature change Potential (GTP) metric. The GTP is founded on analytical climate models to denote the temperature response at time H from 1 kg of gas x, divided by the temperature response at time H from 1 kg of emission of carbon dioxide, with both gases emitted at present [11,48]. Climate change is an environmental impact evaluated in most of the Life Cycle Assessments (LCAs), by the use of the GWP metric. The characterization factors used in the vast majority of LCA studies are those published by the IPCC with the reference year 2013 [49] or 2006 [50]. However, effects of soot and sulphate aerosols, O3 formation and CH4 degradation due to NOx emissions, contrails, and contrails cirrus have been barely accounted for as no standardized methodology was available to provide reliable characterization factors for the different emissions [12].
A Radiative Forcing Index (RFI) has been introduced to this purpose, defined as the ratio between the radiative forcing due to all past emissions of aviation and that from only past carbon dioxide emissions [7]. This factor can be multiplied by the estimated carbon dioxide production accounting for all impacts on climate. This choice relies on the assumption that the emissions will be in a steady state and it does not refer to a specific time frame of observation. Jungbluth and Meili investigated the major approaches of available literature, observing that RFI applied to aircraft emissions range between 1 (no factor at all) and 2.7, corresponding to the application of a characterization factor of 1 to 8.5 to the emission of carbon dioxide in the upper troposphere and lower stratosphere. They then suggested an RFI of 1.7 to 2 [12], as based on the most recent literature [51,52,53]. The same conclusion was reached on the basis of different literature sources [54,55]. Azar and Johansson estimated emission weighting factors (EWFs) for the aircraft carbon dioxide by applying several metrics (GWP, GTP, Sustained GTP, cost-effective trade-off, and relative damage cost). The proposed EWF was 1.3 to 2.9, with 1.7 being the best estimate on the basis of the GWP metric [13].
However, many effects of non-CO2 emissions depend strongly on flight altitude, latitude, daytime, weather situation, etc. [15]. Hence, the introduction of a multiplying factor in order to account for non-CO2 emissions is questionable, especially whenever a more accurate estimation of emission by modelling is possible. Indeed, notwithstanding CO2 and SO2 can be assumed as proportional to fuel burned [8,9], valid methods have been developed for NOx [9] and BC [56] estimation. Moreover, metrics which account for regional sensitivity are required, to account the effects of location in which the emission is generated, due to the nonlinear chemistry of the atmosphere [12]. To this aim, Köhler et al. studied the impact of nitrogen oxides emission emitted in different regions and latitudes by using various climate metrics [57]. More recently, Lund and co-workers investigated a wide set of forcing mechanisms and emissions, proposing regional GWPs and GTPs which denote the different impacts on global climate due to different source regions [58].
1.3. Aim and Scope of the Investigation
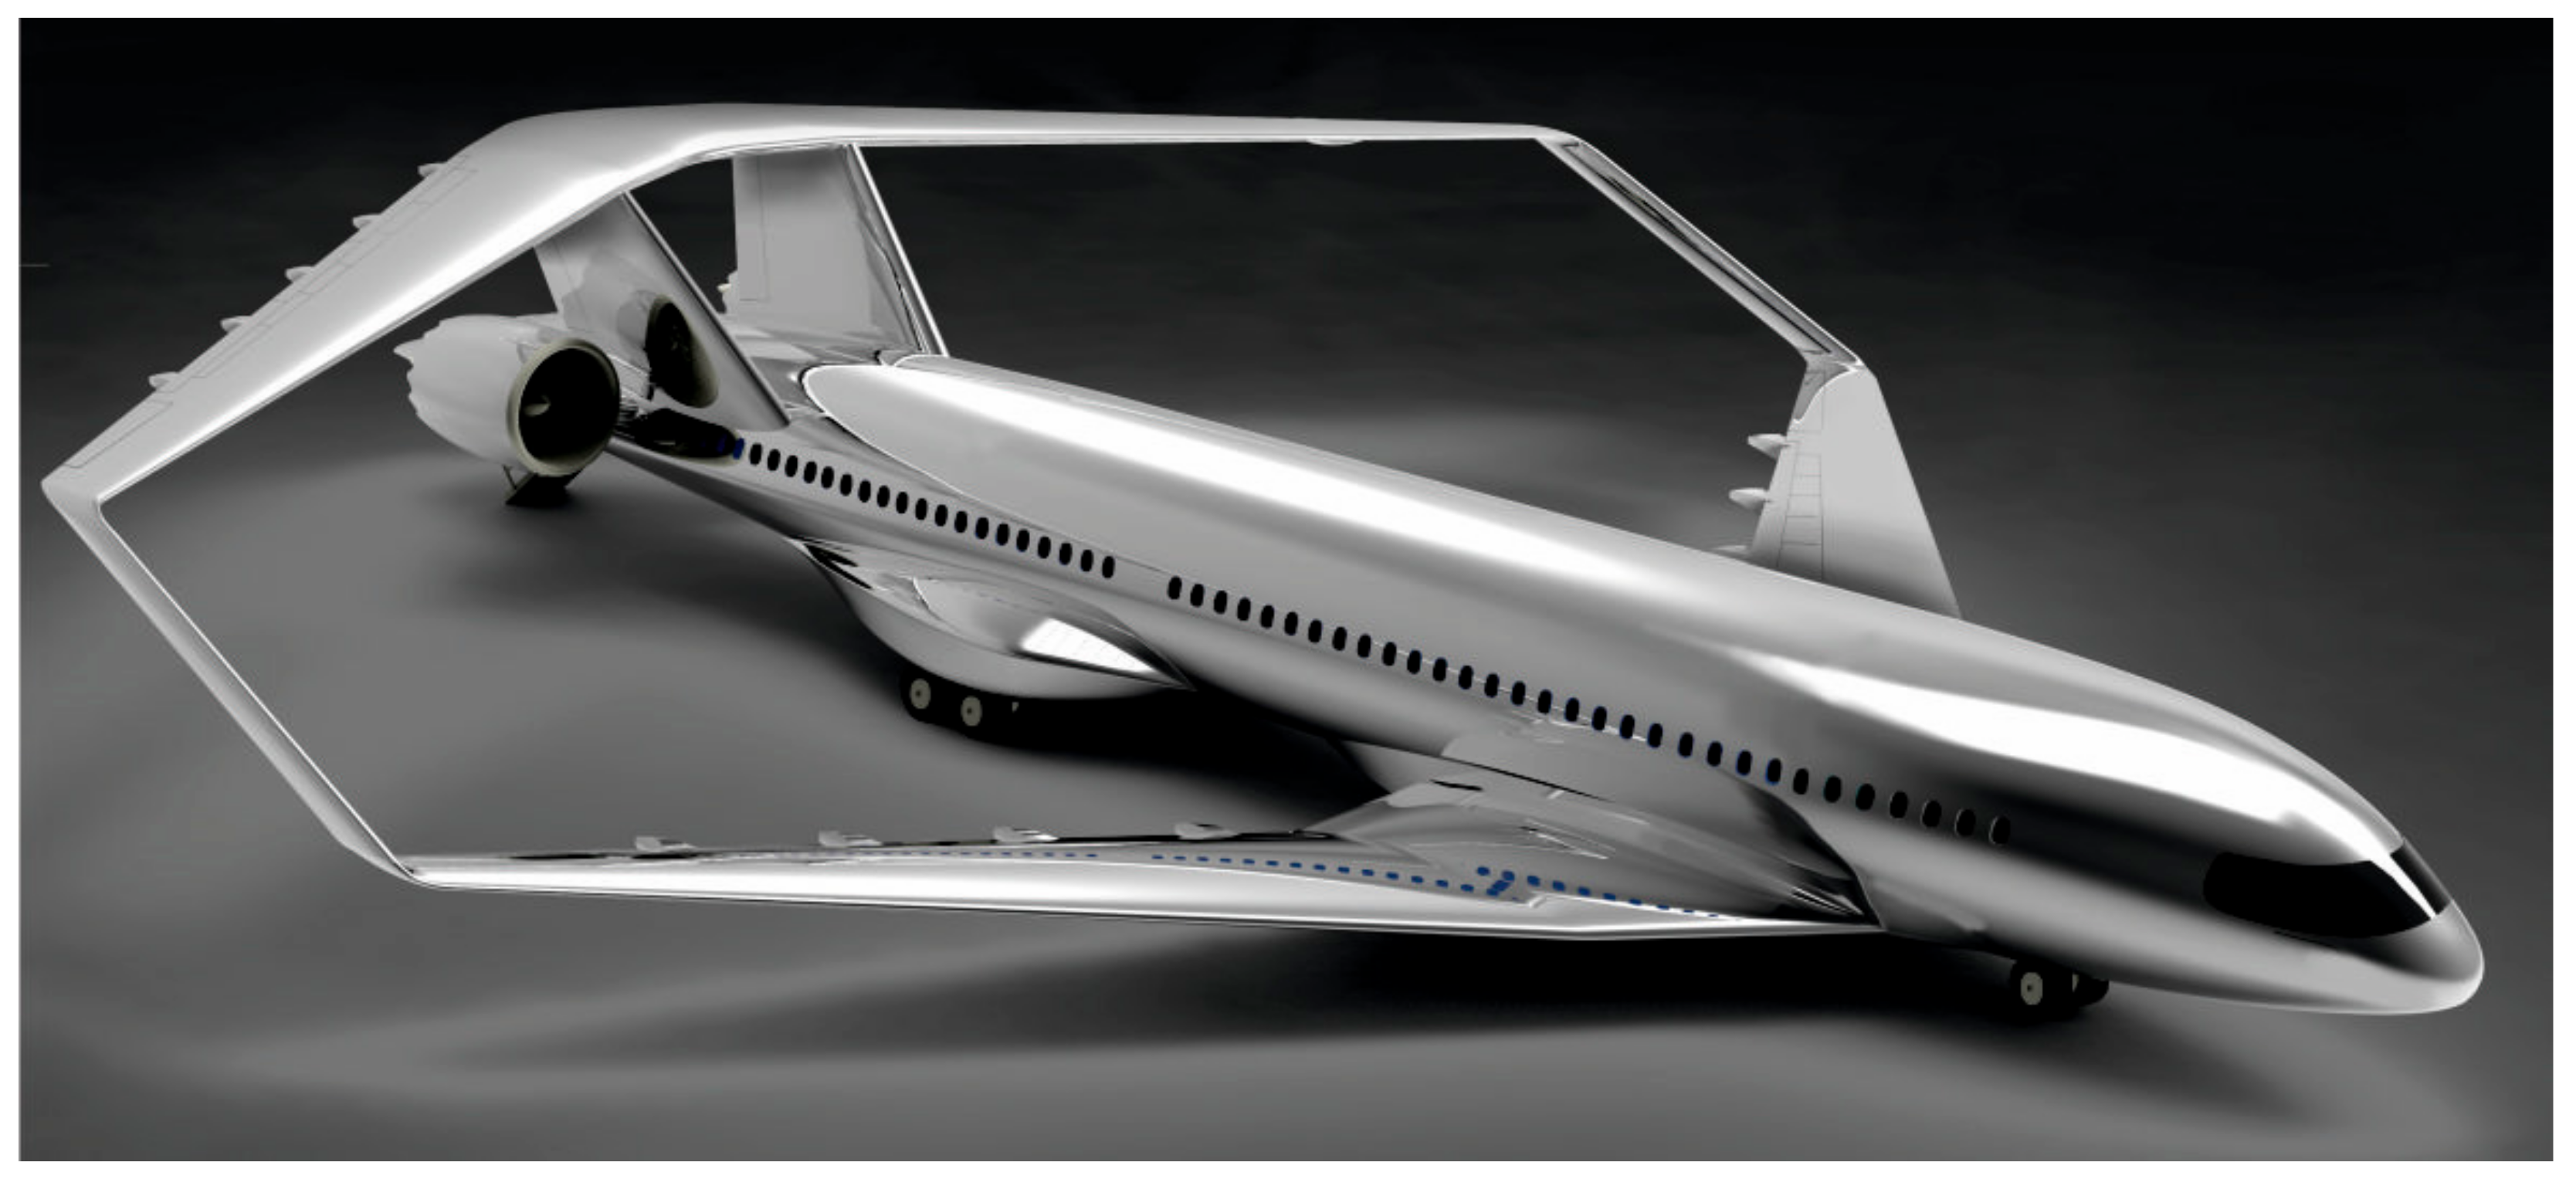
This work is related to the climate impact assessment of the proposed adoption of the PrandtlPlane (Figure 1) as a passenger aircraft, and it concerns the investigation carried out within the project PARSIFAL (“Prandtlplane ARchitecture for the Sustainable Improvement of Future AirpLanes”), funded by the European Union under the Horizon 2020 Program [59].
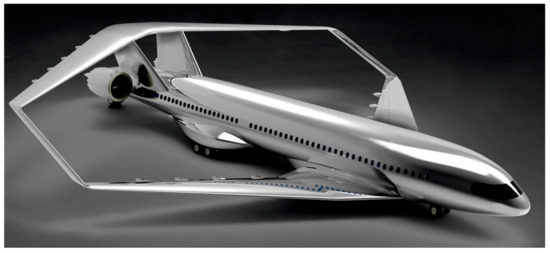
Figure 1.
Representation of the PrandtlPlane (PrP) under development within the project “Prandtlplane ARchitecture for the Sustainable Improvement of Future AirpLanes” (PARSIFAL) [59].
We estimated for the first time the emissions from the innovative box-wing aircraft and we compared the corresponding impacts to those of a conventional reference aircraft in six source regions in terms of GWP and GTP on two different time horizons (20 and 100 years). We considered CO2, carbonaceous and sulphate aerosols, NOx and related O3 production and CH4 degradation, contrails, and contrail cirrus. The impact assessment was carried out according to the Life Cycle Assessment (LCA) methodology. Moreover, the additional research required to develop a comprehensive LCA on aircraft emissions is discussed.
2. Materials and Methods
2.1. Goal and Scope of the Investigation
The PARSIFAL project aims to introduce an innovative box-wing aircraft, the PrP, in the civil aviation sector. The adoption of this configuration is expected to confer higher payload capability comparing with today competitor aircraft (e.g., Airbus 320 and Boeing 737 families), without any increase in the overall dimensions. The enhanced aerodynamic of the box-wing combined to an increased passenger number allow for a reduced fuel demand per passenger-kilometer (pax-km). Therefore, the aim of this study is to support this investigation by providing an estimation of the emissions of the PrP and compare the corresponding impacts to those of a conventional reference aircraft. Concerning this latter, it is noteworthy to clarify that the industrial and academic aeronautic community adopts shared reference models to have a commonly accepted datasets representing the state-of-the art in aircraft industry. In the PARSIFAL project, such a common reference model is the CeRAS—Short Range Reference Aircraft ([60]), hereafter called CERAS, which has been updated replacing the IAE V2527-A5 turbofan engine with the more recent CFM LEAP 1A-26.
All the impacts presented are referred to the functional unit pax-km. Furthermore, the additional research required to develop a comprehensive LCA on aircraft emissions is detailed.
2.2. System Boundaries
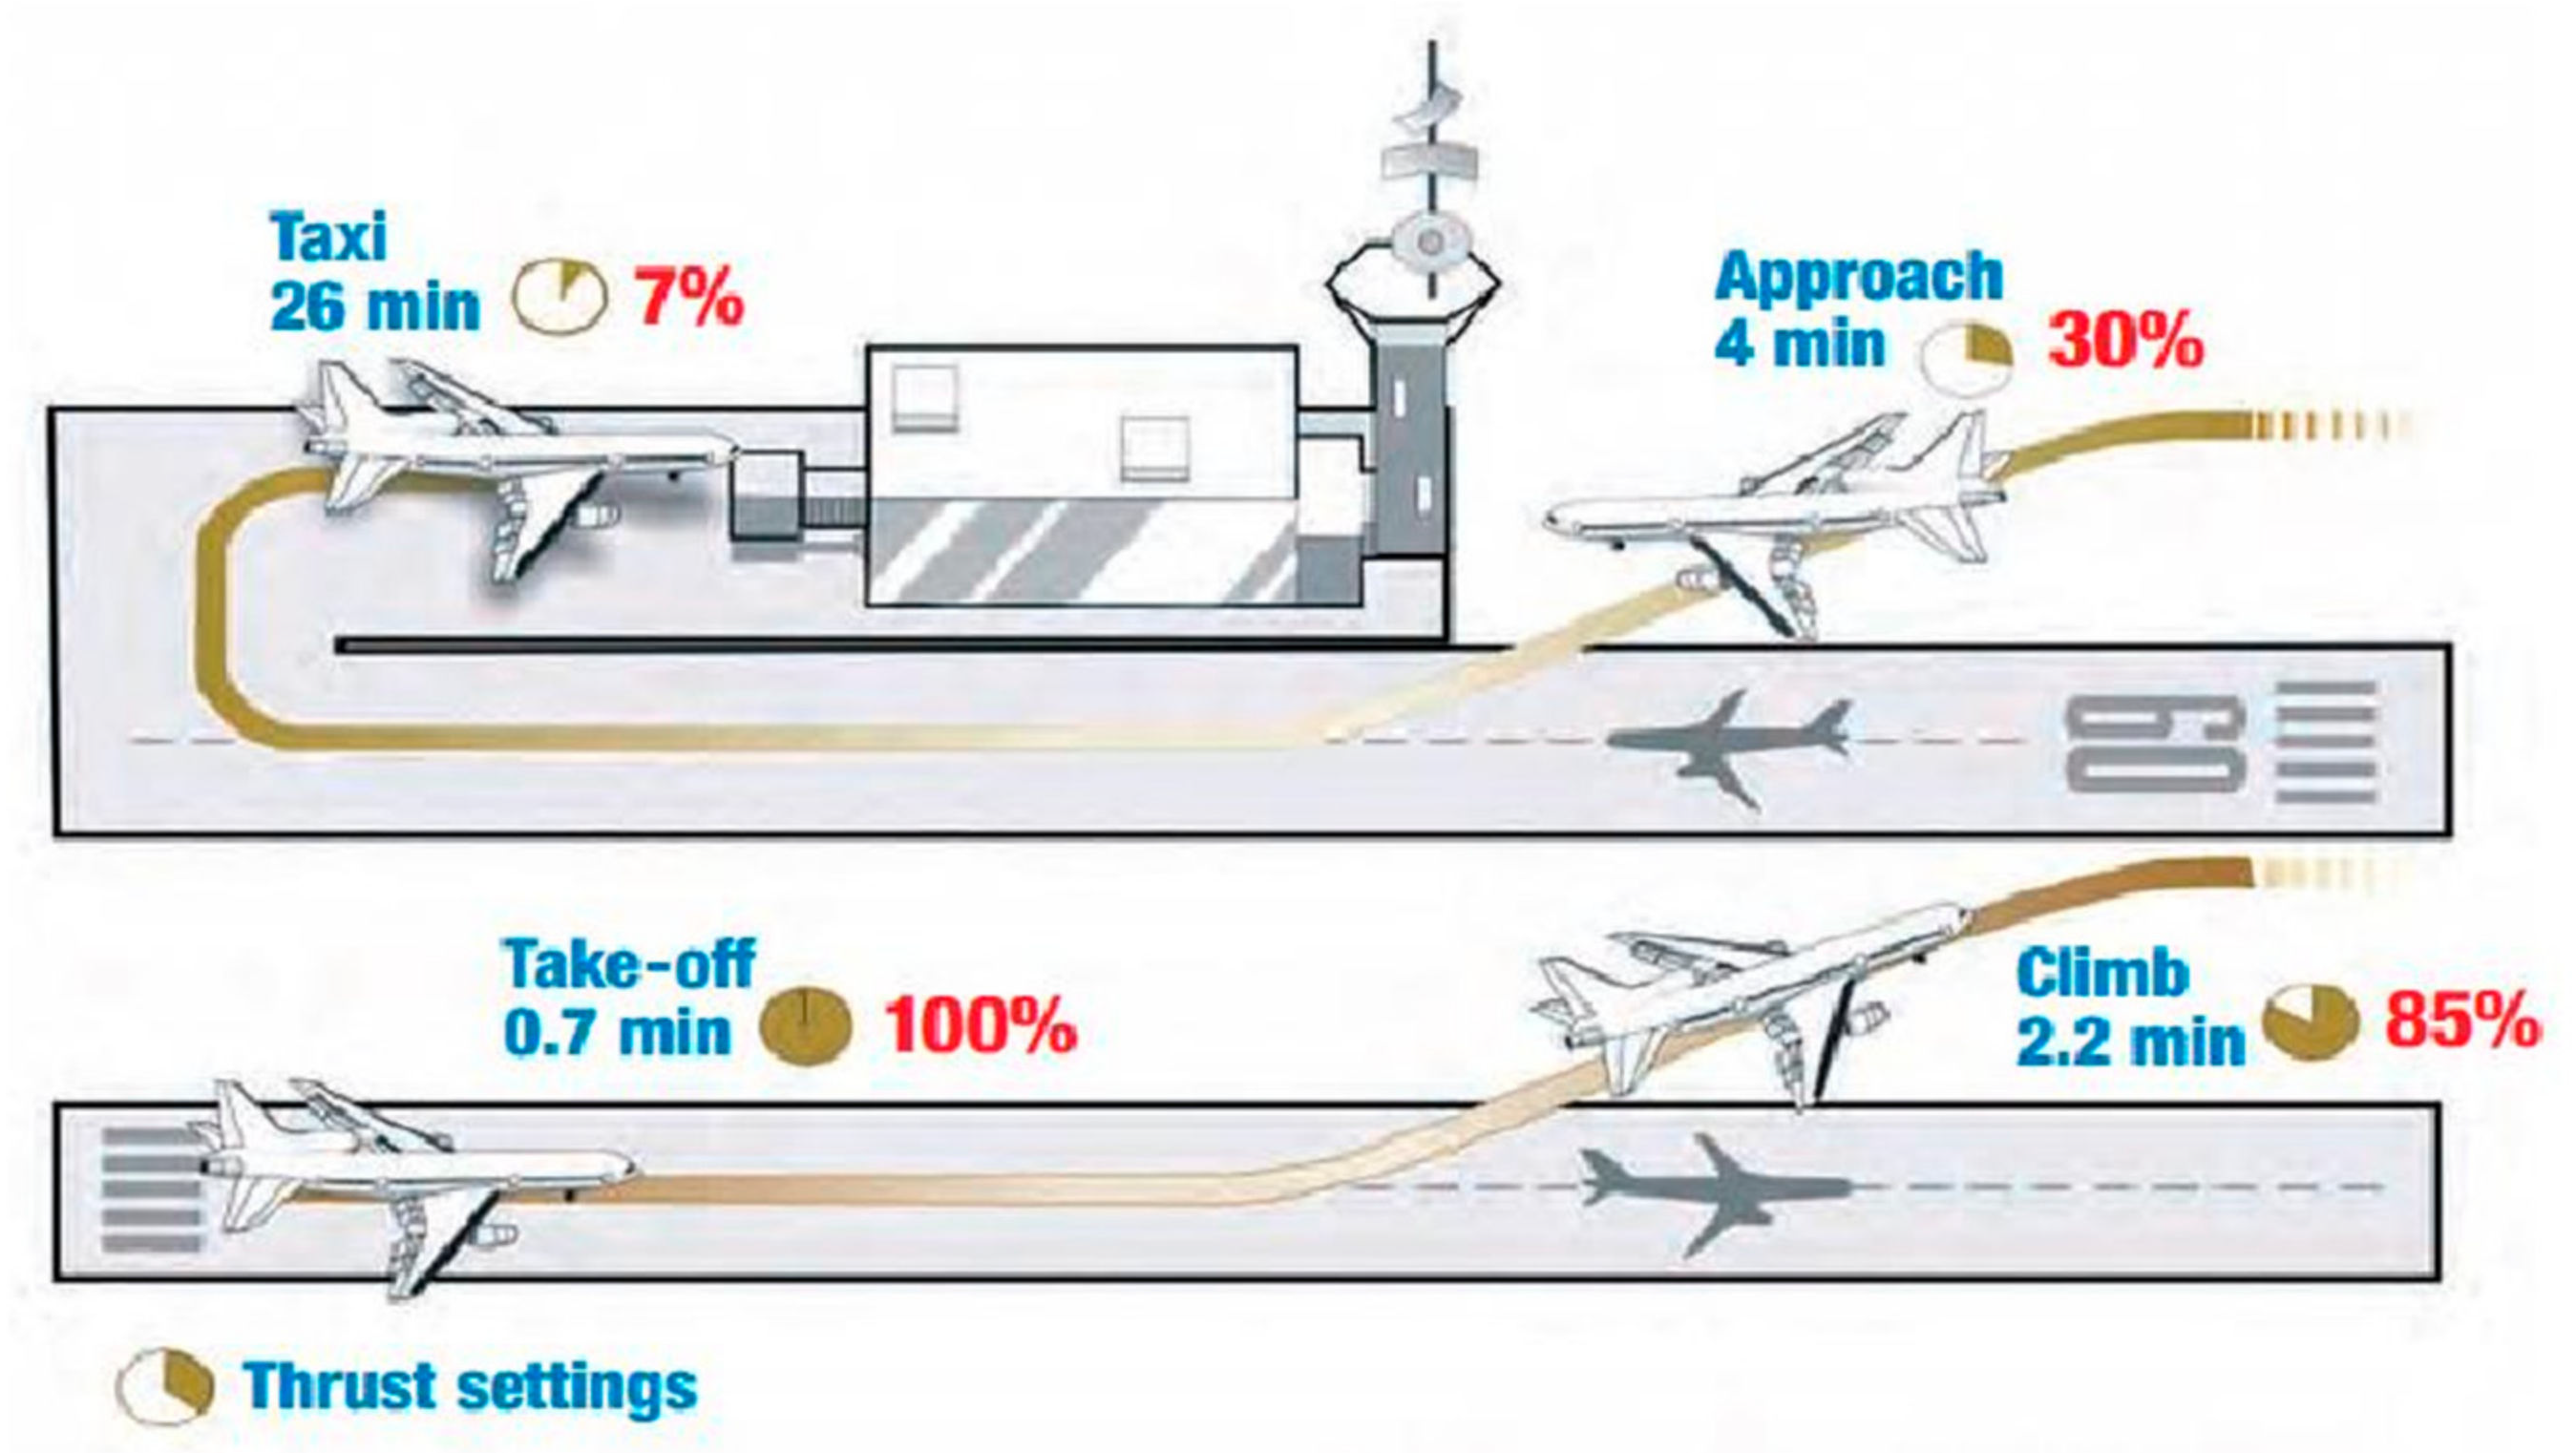
The Landing Take-Off (LTO) phase includes engines running idle, taxi-in and out, and climbing and descending under 914 m (3000 ft). The “Cruise” phase, which usually refers to the flight at the higher altitudes, in emission studies conventionally includes all activities above 914 m, including further climb-out from and descent to this altitude [61]. The LTO cycle was defined in accordance to ICAO engine emission databank [62], as summarized in Figure 2.
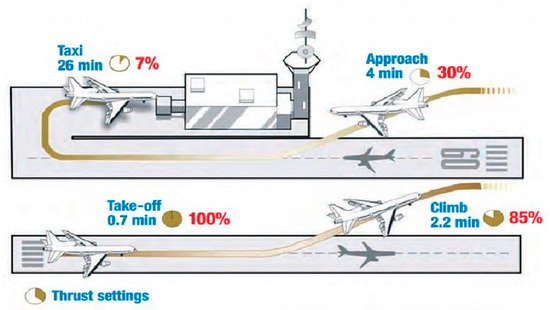
Figure 2.
Landing Take-Off (LTO) cycle definition according to ICAO databank. Percentage refers to the power setting (maximum thrust).
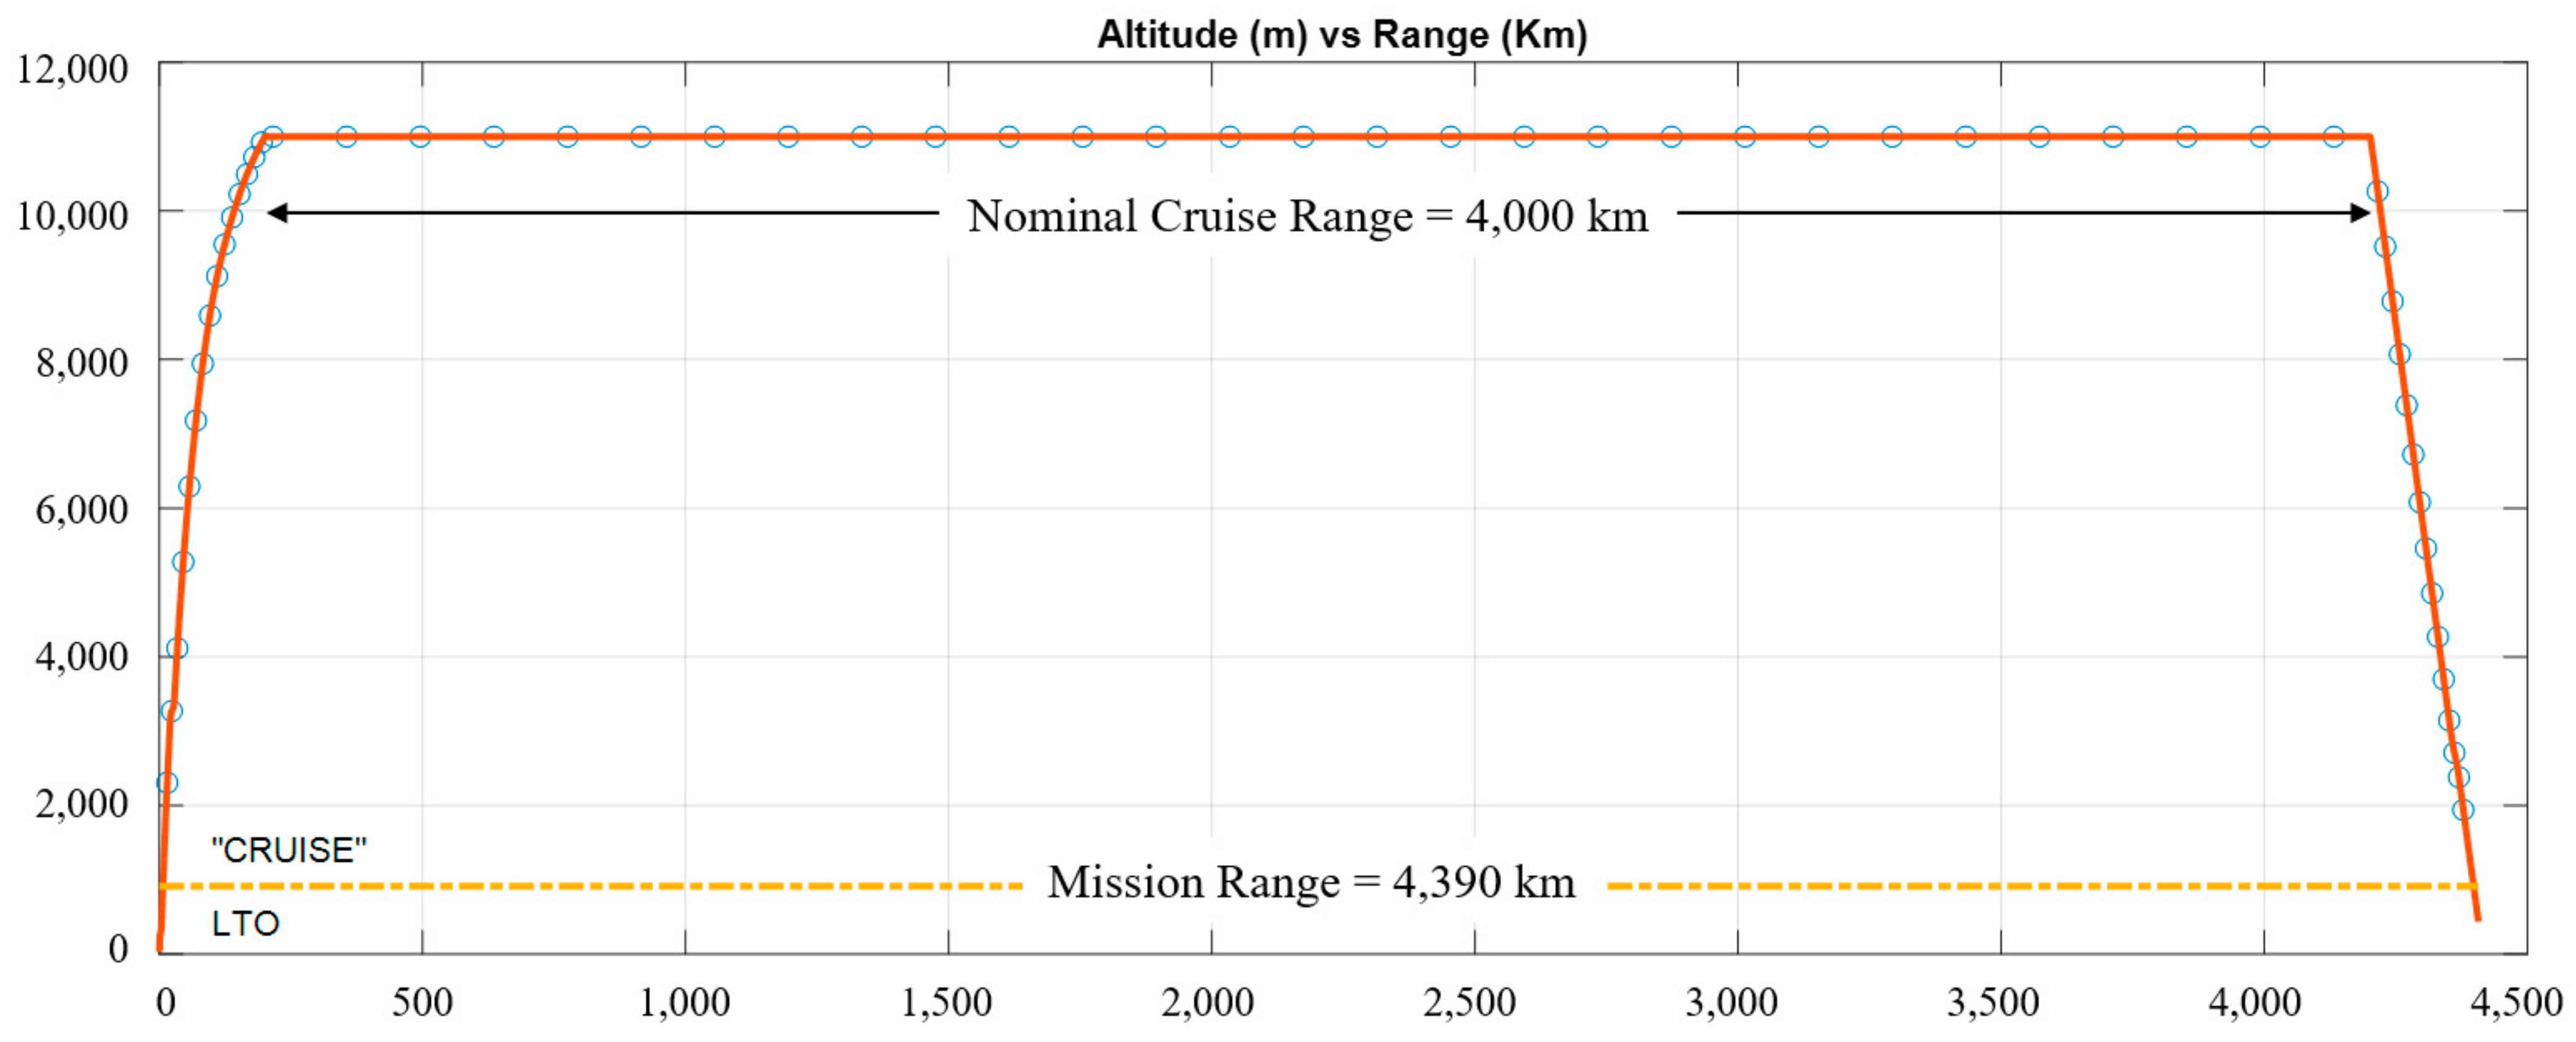
According to the “cruise” definition, the mission range was defined as the total flown distance considering a climb phase from 914 m to 11,000 m (actual cruise altitude according to PARSIFAL project requirements [63]), a level flight phase for a given nominal cruise range (typical value is 4000 km, as shown in Figure 3) and a descent phase from 11,000 m to 914 m.
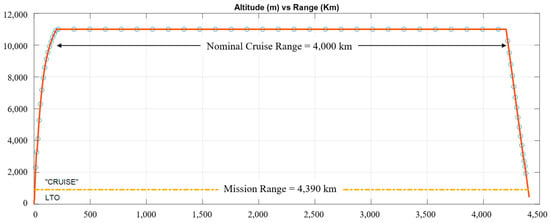
Figure 3.
Example of reference mission profile divided in LTO and “CRUISE” phases (nominal cruise range: 4000 km).
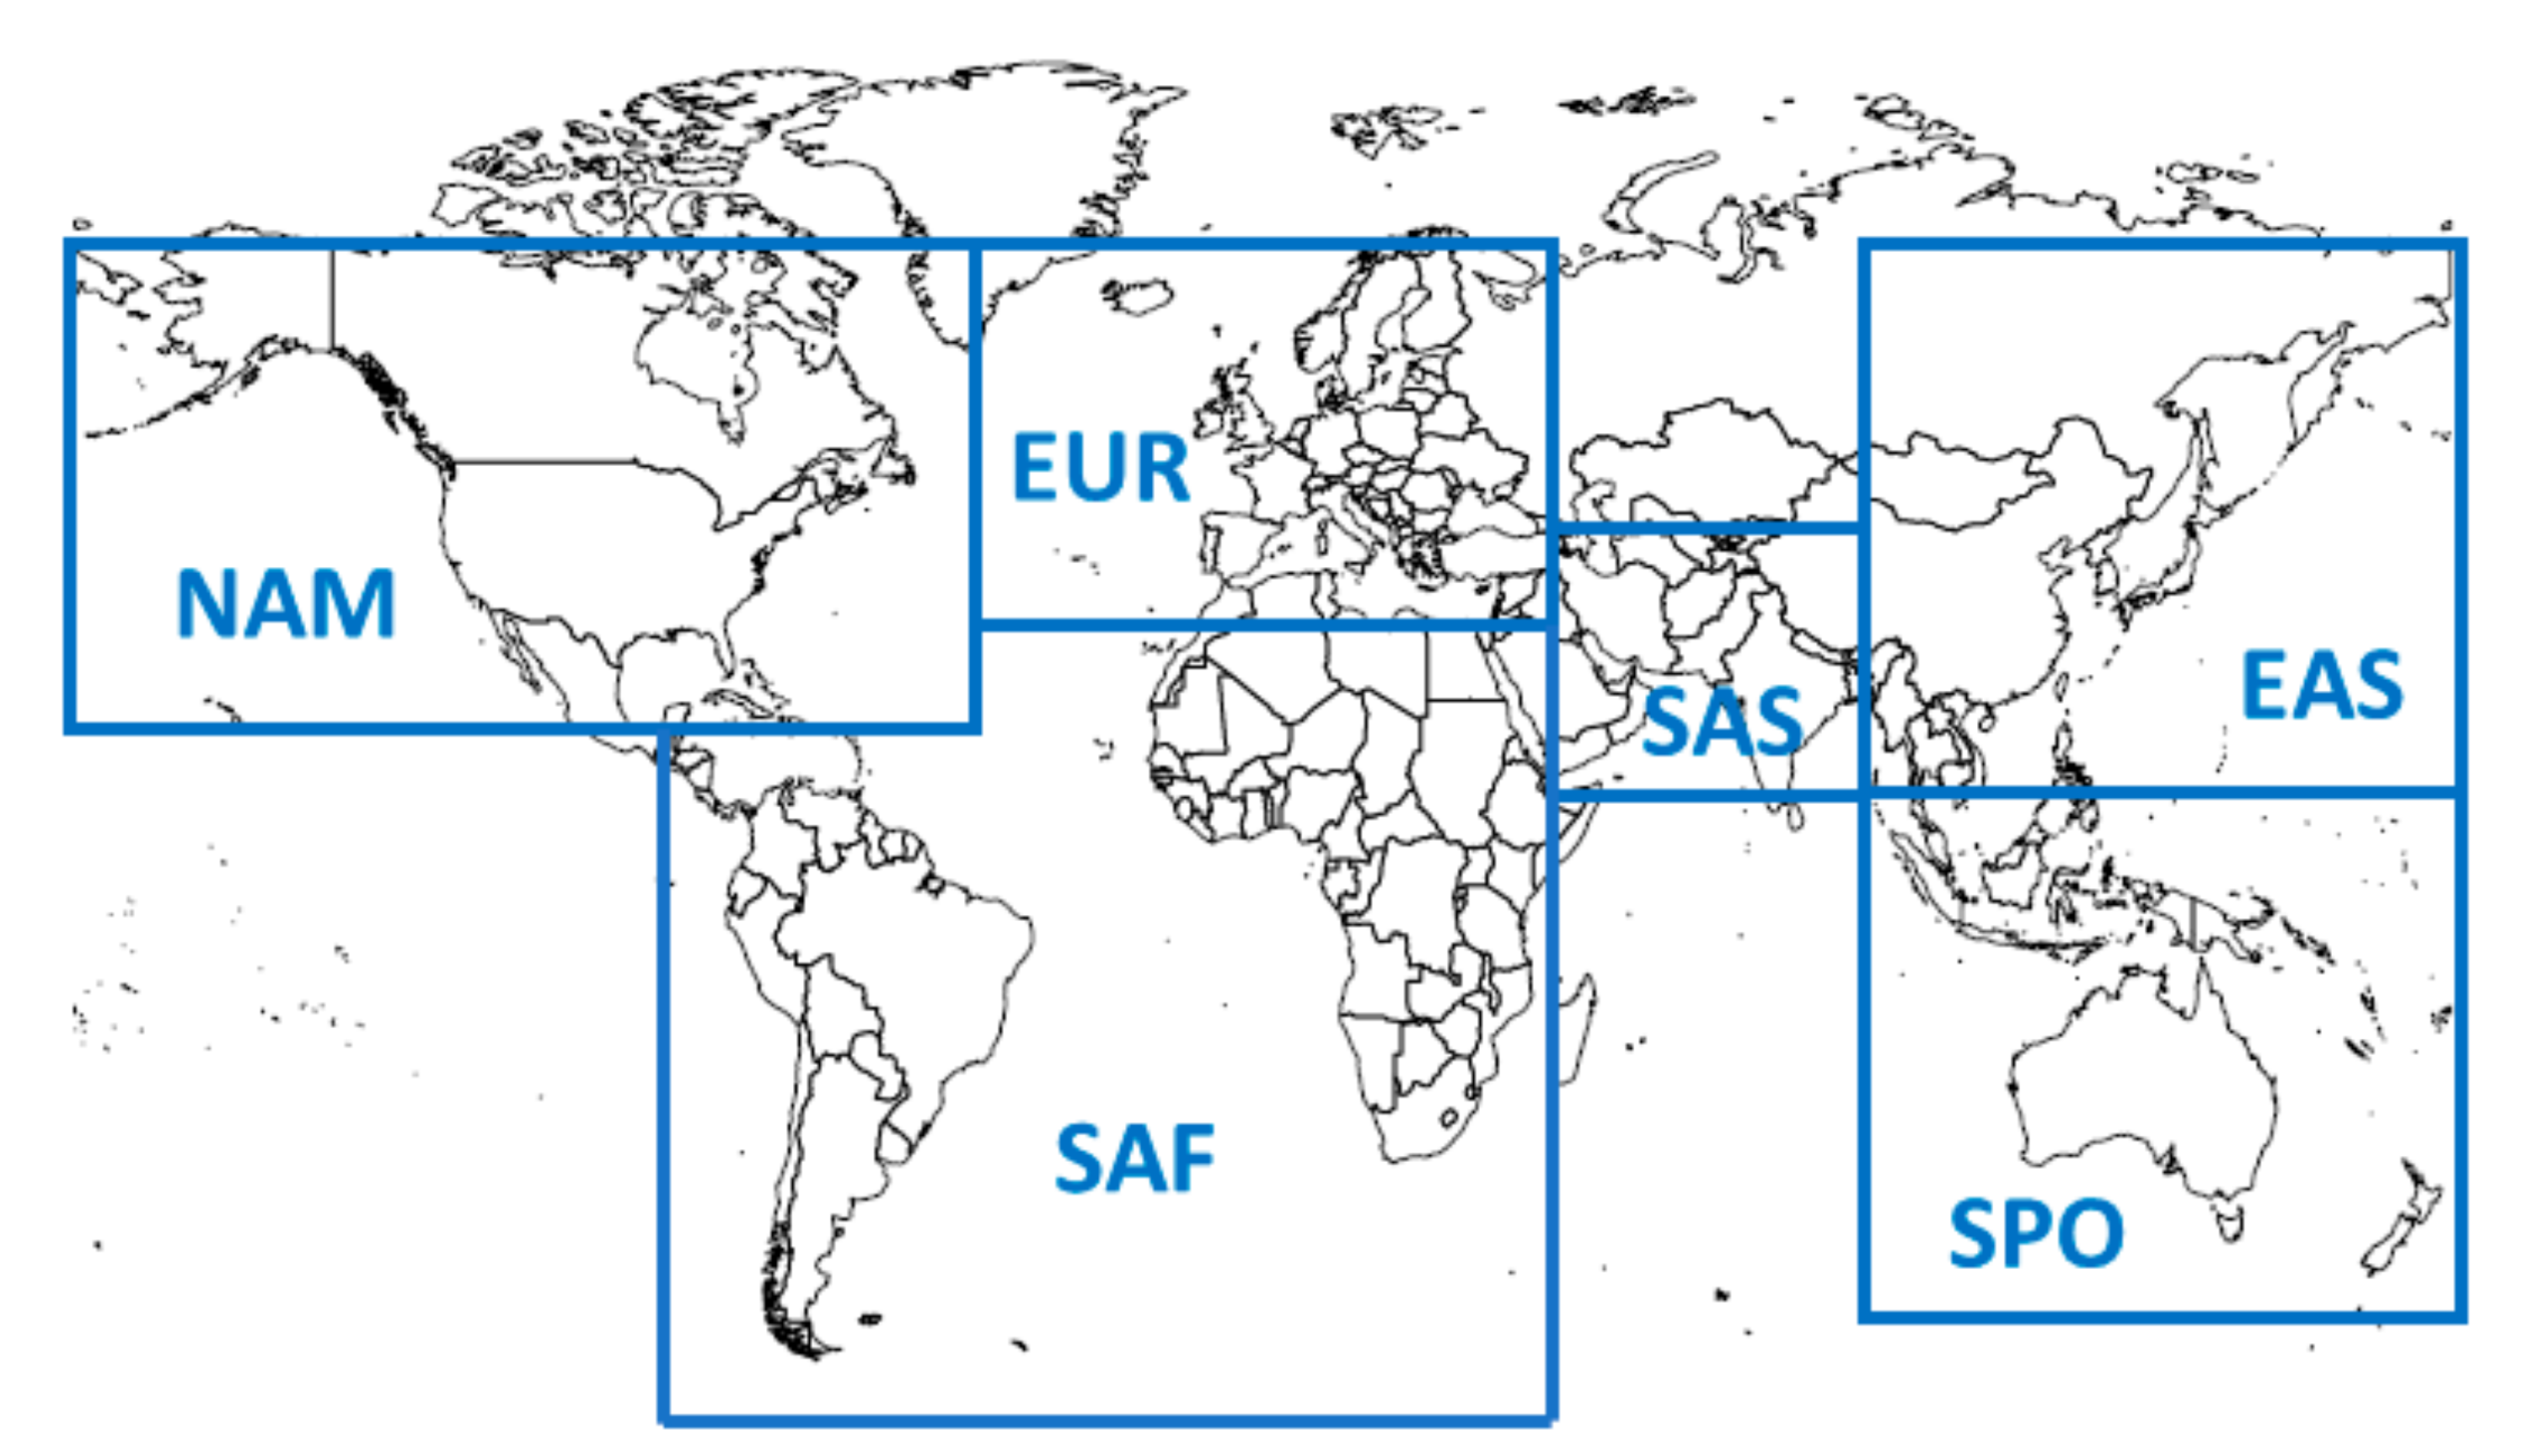
With regard to the boundaries in relation to nature, atmosphere was both the cradle and grave of the outputs, which were investigated over six different regions (Figure 4), according to Lund et al. [58]. Neither allocation nor cut-off criteria were applied.
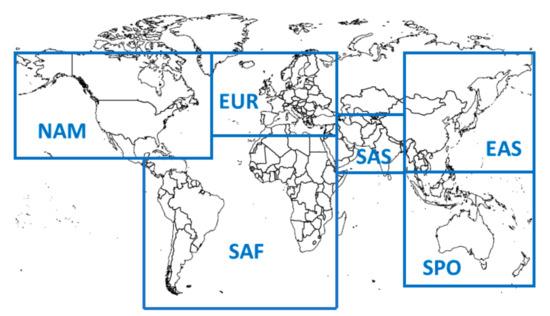
Figure 4.
Spatial boundaries. NAM: North America; SAF: South America and Africa; EUR: Europe; SAS: South Asia and Middle East; EAS: East Asia; SPO: South Pacific Ocean. Adapted from Lund et al. [58].
2.3. Emission Inventory and Modelling
Emission of carbon dioxide, SO2, BC, nitrogen oxides, and formation of contrails and contrail cirrus were included in the inventory, as well as the nitrogen oxide-induced impacts on O3, CH4 and nitrate aerosols, contrails, and cirrus development were accounted for by the emission metrics (Section 2.4). Emission of organic carbon was not taken in account due to the lack of both related emission models and impact assessment methods. Same applies for the formation of aerodynamic contrails, which climate impact was recognized to be significantly lower than that due to exhaust contrails [64], notwithstanding no reliable assessment is available at present. No CH4 was assumed to be generated during the cruise phase [8], while the fraction produced in the LTO phase was neglected.
Emissions of CO2 and SO2 were assumed as proportional to the fuel burnt. The CO2 LTO and CO2 CRUISE emission indexes were both assumed equal to 3155 g kg−1 fuel burnt [8,9]. The SO2 LTO and SO2 CRUISE emission indexes were set both as equal to 1 g kg−1 fuel burnt [8]. Details related to contrails and contrail cirrus are provided in Section 2.4.
Emissions of BC and NOx are influenced by the type of engine type and its power setting, flight speed, altitude, and atmospheric conditions. Nitrogen oxide is mainly emitted at high engine power settings, while particulate resulting from incomplete combustion as BC is mainly produced at low engine power levels, due to the low efficiency of fuel-air mixing. Hence, specific models were applied to estimate NOx and BC emission indexes.
The improved fox (ImFOX) method developed by Abrahamson and co-workers was chosen to estimate both LTO and cruise emissions of BC [56]. This predictive relation also includes an exponential term to evaluate emissions from alternative fuels and fuel blends:
where CBC is the concentration of BC in the exhaust (mg m−3), which can be related to mg of BC emitted per kg of fuel burnt by the volumetric flowrate Qcore (m3 exhaust gas kg−1 fuel combusted), referred to the core (i.e., not accounting for bypass flow):
where AFR is the air-to-fuel mass ratio.
The term H of Equation (1) refers to the hydrogen mass% of the fuel (typically within the range 13.4−14.3%), while mf is the fuel flow rate in kg s−1, and AFR is estimated according to Equations (3) and (4):
At fixed fuel flow rate AFRcruise is lower than AFRground, due to air density decrease with the altitude. T4 (K) is estimated by the engine cycle deck:
The pre-exponential frequency factor Aform recommended for the LTO phase (Equation (1)) is a function of the concentration of polycyclic aromatic hydrocarbons (PAH), which in turn is a function of acetylene, benzene, phenyl radical, and hydrogen. The concentration of these molecule is assumed to vary with thrust. An Aform cruise value of 295 was recommended as it reflects the relationship between EIBC and thrust at cruise [56], while Aox related to both LTO and cruise phase is equal to 608, as for FOX method [65].
The evaluation of HC, CO, and NOx Emissions Indices (EI) required the implementation of the following procedure:
- 1.
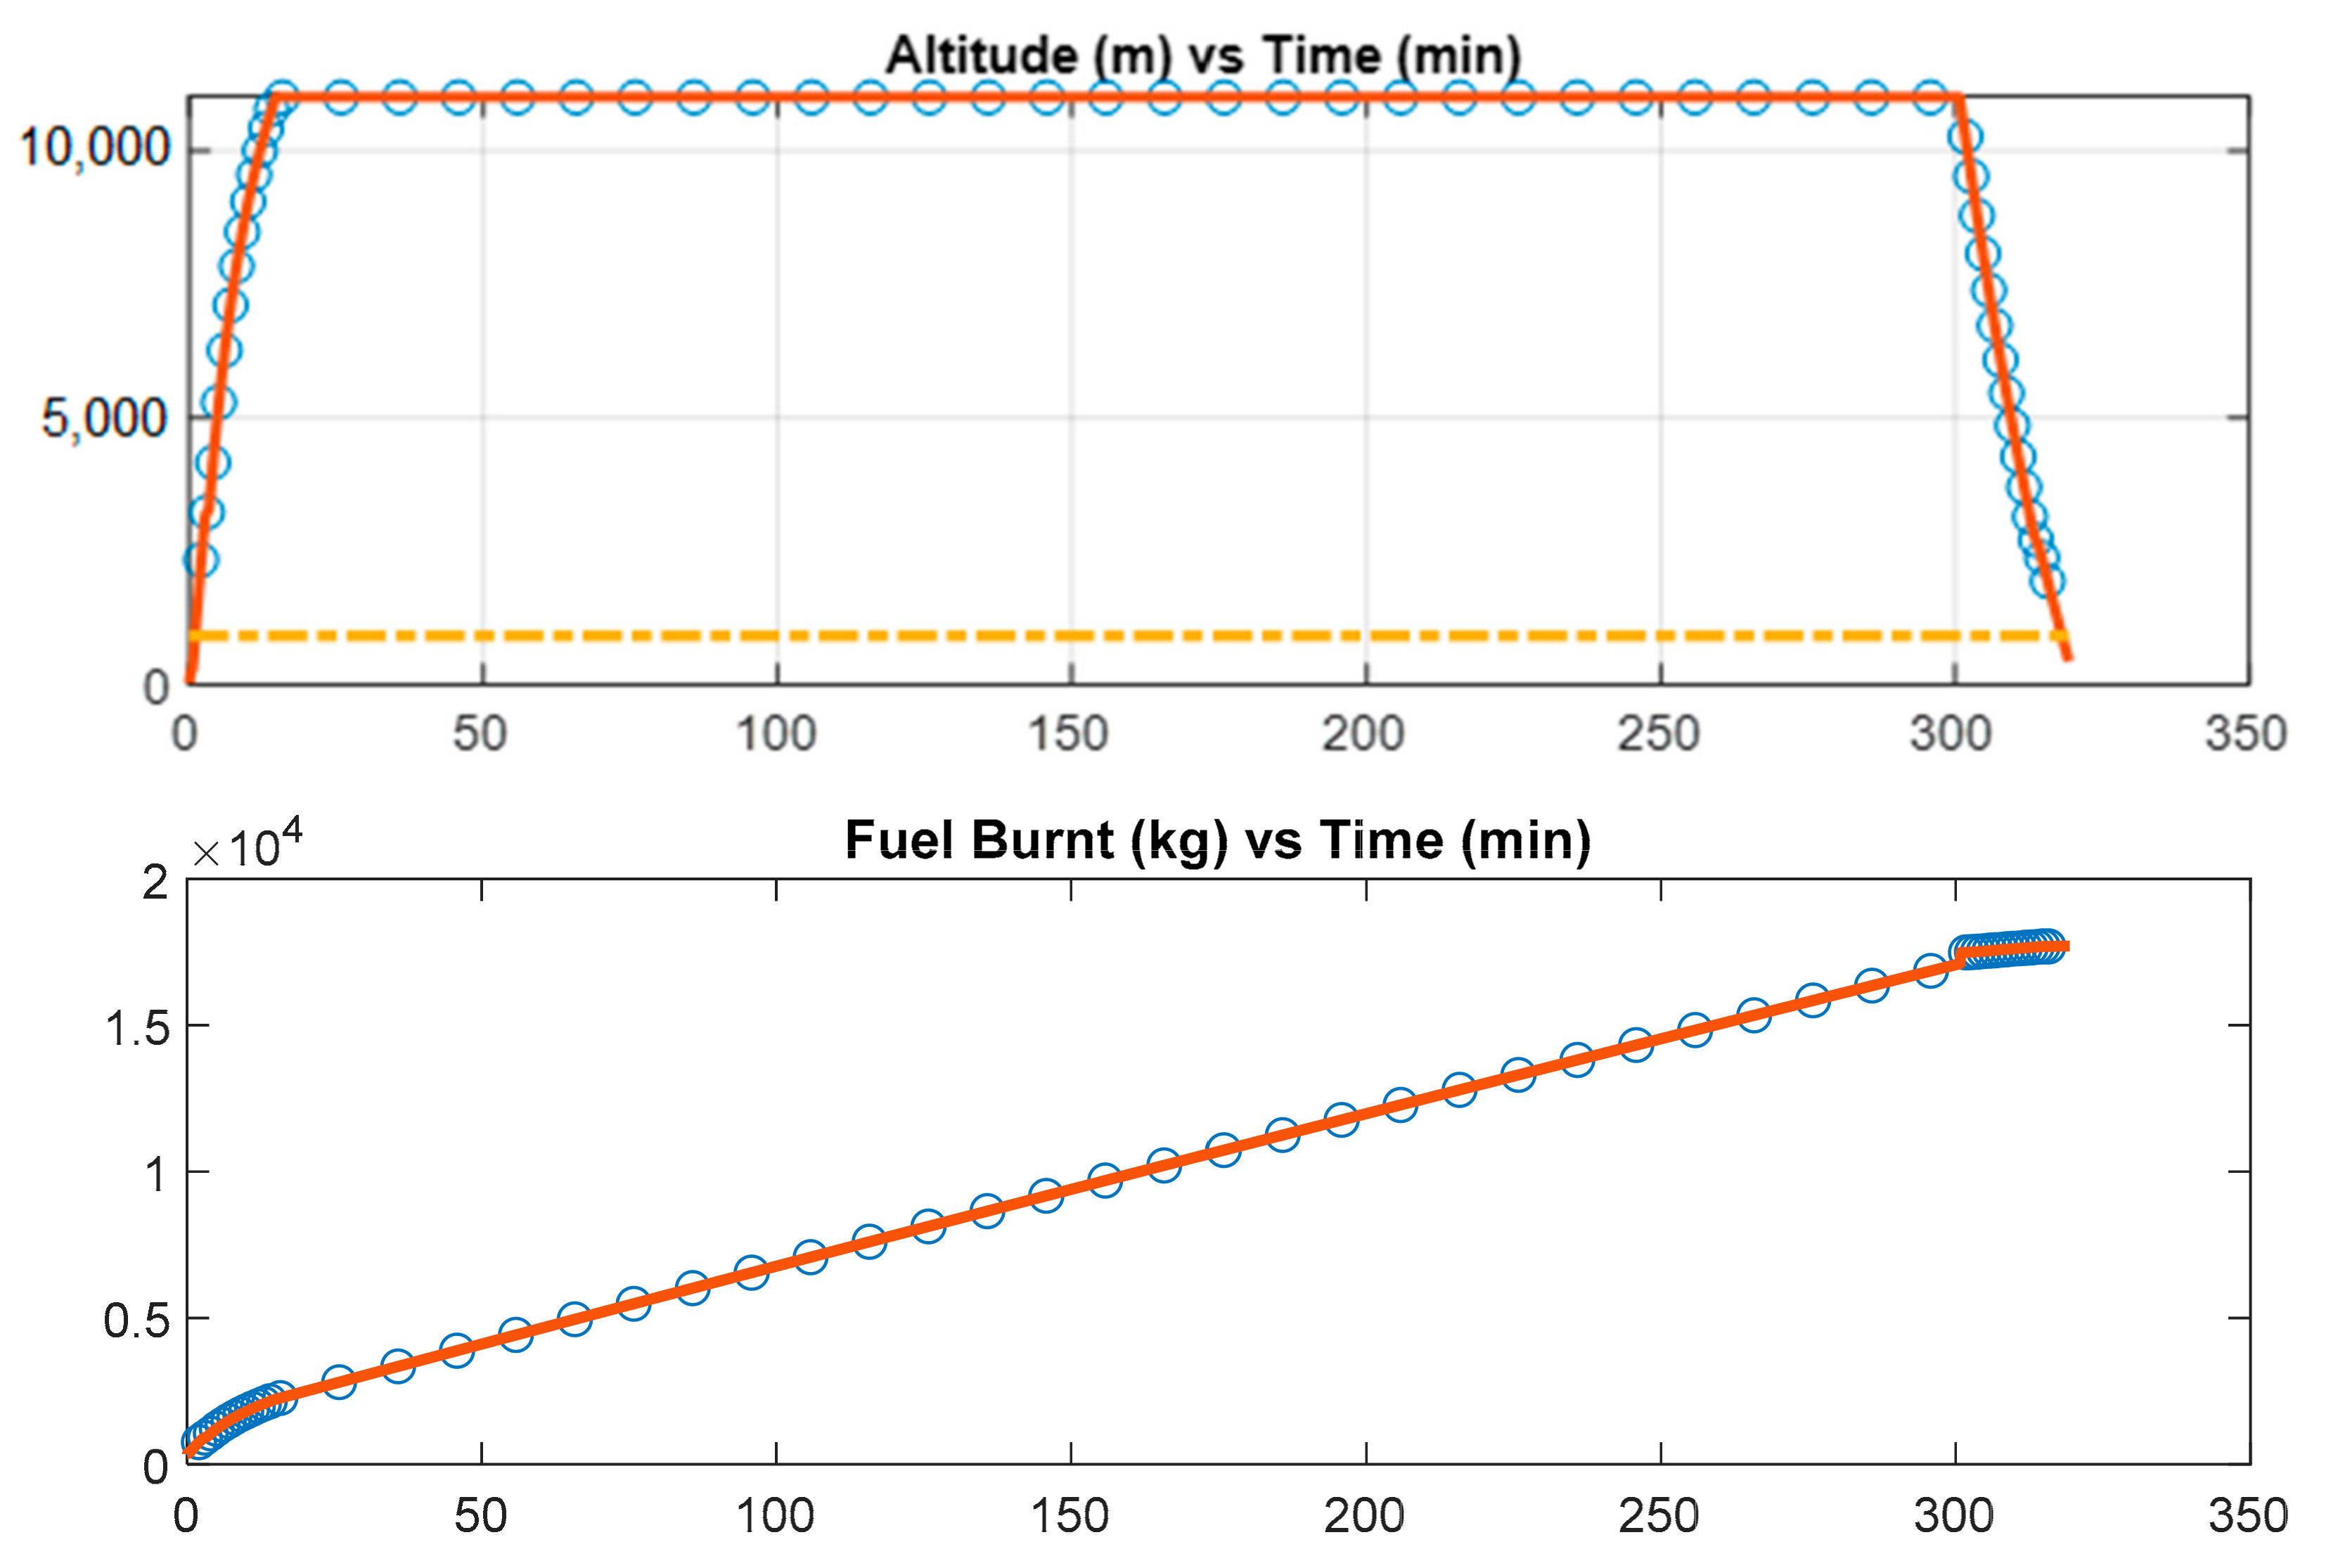
- Definition of the “CRUISE” mission profile as a set of pairs duration-altitude (t,h)i for an arbitrary number of flight phases indicated by the subscript i (see Figure 5);
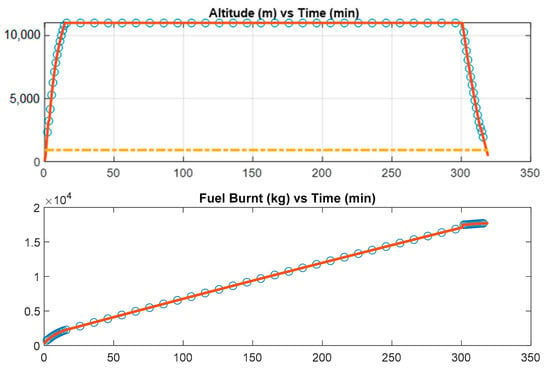 Figure 5. Example of time-sampling of the “CRUISE” phase of a typical mission.
 - 2.
- Evaluation of required engine thrust and fuel flow values at defined flight phases.
- 3.
- Definition of LTO emission indices (EI) for aircraft engine, referring to datasets as those available from the ICAO Engine Emissions Databank [62].
- 4.
- Estimation of HC, CO, and NOx emission along the “CRUISE” phase. Since ICAO Engine Emissions data are obtained from certification tests performed at ground level, a correction procedure is needed to take into account altitude effects. The procedure adopted, developed by Boeing, is known as “Fuel Flow Method 2” (FFM2, [9] and aims to correct the emission on the basis of air pressure, temperature and humidity at the given altitude values. Once the corrected emission indices (EI) are evaluated, the emissions from “CRUISE” phase (S) are calculated as follows:where n is the number of segments in which “CRUISE” phase is divided.
- 5.
- Evaluation of hydrocarbons, carbon monoxide and nitrogen oxides emissions during LTO phases multiplying the quantities indicated in the ICAO dataset by the number of engines.
- 6.
- Estimation of total HC, CO, and NOx emissions as sum of “cruise” and LTO contributions.
Concerning the 3rd step of the procedure, the engine selected for the CERAS aircraft was the CFM LEAP 1A-26, whose LTO emission indices were taken from the ICAO databank.
The engine sizing of the PrP was part of the project activities. Hence, none of the present engines could be considered as a reference. Therefore, the LTO emission indices of the PrP engine have been estimated by using two different approaches:
- (1)
- Interpolating the data of a subset of engines of the ICAO databank, assuming the PrP required maximum thrust (or “rated output”) as input value.
- (2)
- Adopting the methods implemented in the software GSP by NLR [66] to correct the reference engine EI, using the combustor inlet data resulting from the engine sizing performed through the same software, as described in [67].
These approaches are denoted as “ICAO interpolation” and “GSP sizing”, respectively.
Whilst the ICAO interpolation approach evaluates the emission indices of the PrP engine through an interpolation strategy based on the thrust, i.e., a performance parameter of the entire engine, the GSP sizing acts at an inner level, being based on the combustor performance. The former is not physic-based but allows to consider a reference engine set as large as desired, choosing the engines from those listed in the ICAO emissions databank. The second approach is physic-based, but combustor data were available only for the engines already modelled (and validated) in GSP.
Concerning the ICAO interpolation approach, the criterion adopted to define the reference engines set was technology level in line with engines installed on New Engine Option (NEO) versions of Airbus aircraft models A320 and A330; LEAP-1A26/26E1 (manufacturer CFM International) and Trent7000-72 (manufacturer Rolls-Royce), respectively. The result of the ICAO databank extraction is reported in Table 1, together with PrP engines expected performance.

Table 1.
Interpolation group extracted from the ICAO databank (New Engine Operation (NEO) engines in bold).
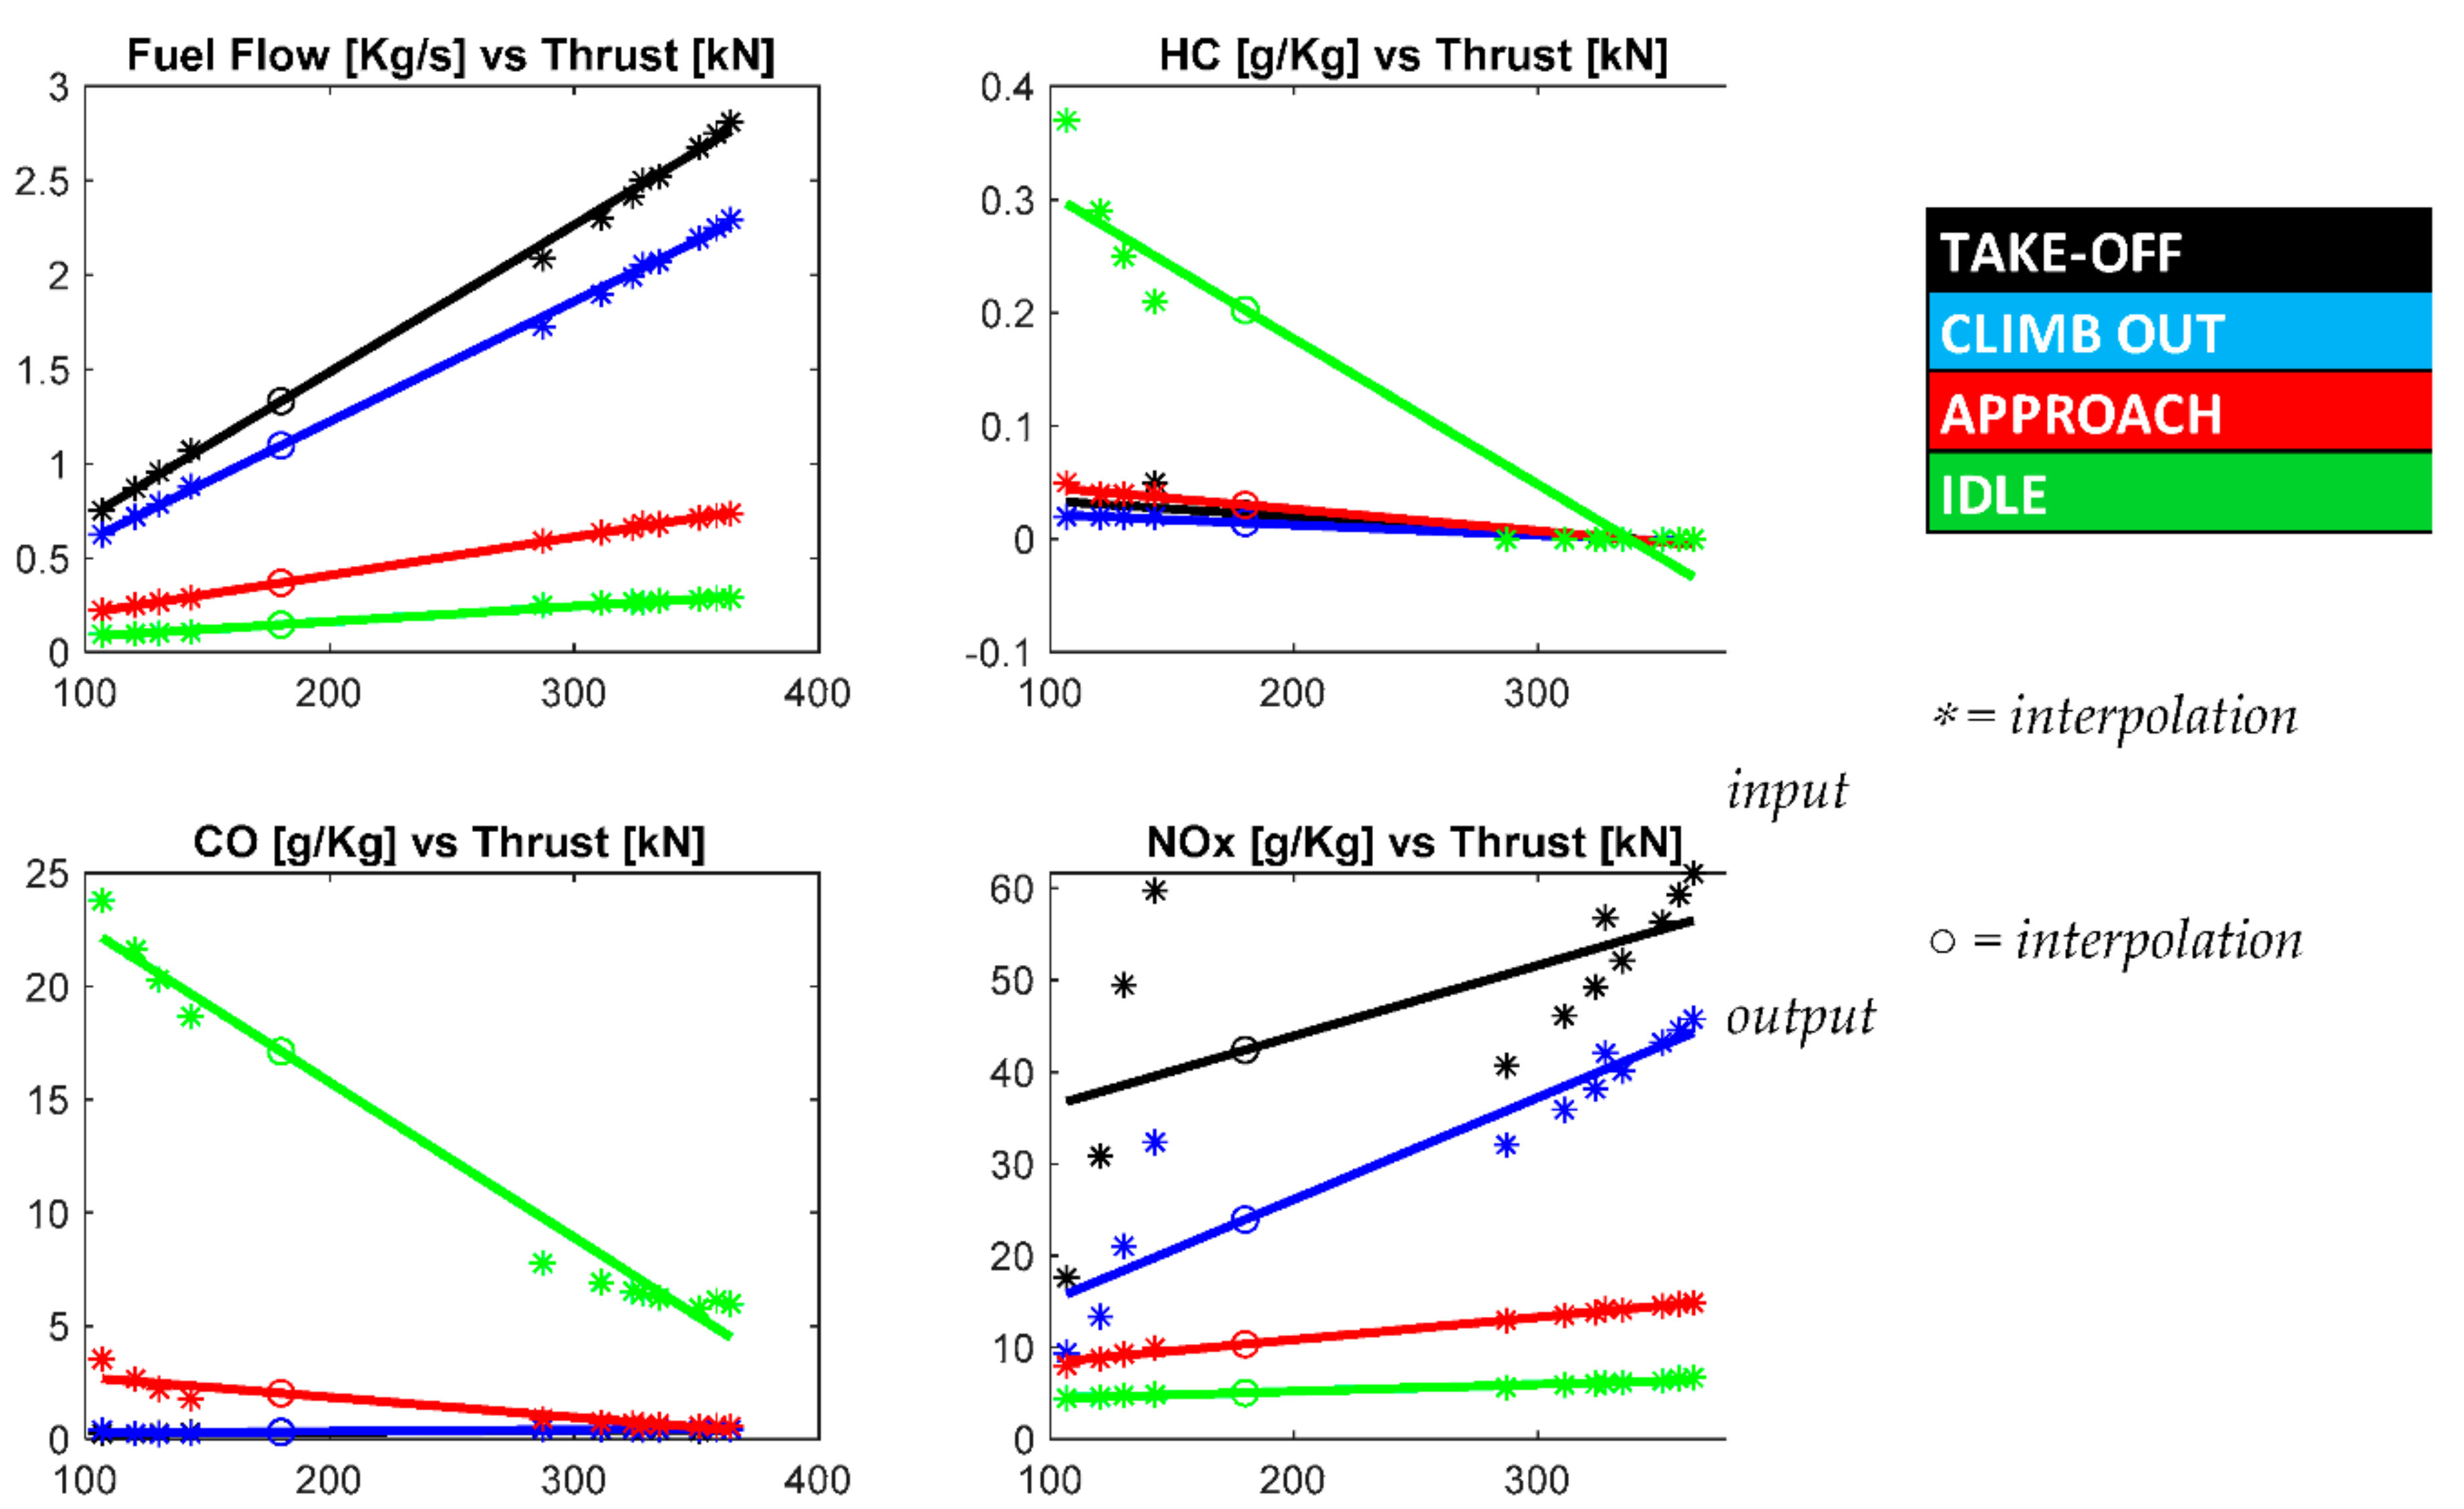
Given Foo = 180 kN as interpolation input, the HC, CO, and NOx emission indices were then calculated for each phase of the LTO cycle. Figure 6 shows the results of such interpolation, also including the evaluation of fuel flow.
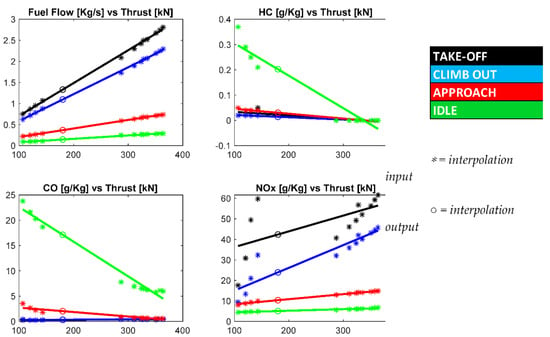
Figure 6.
Fuel Flow and Emission Indexes from “ICAO interpolation” approach.
Table 2 reports the LTO emission indices evaluated by using both the approaches.

Table 2.
LTO emission indices of the PrP from “ICAO interpolation” and “GSP sizing” approaches.
These values allow the direct estimation of the emissions of the LTO phase, whereas the Boeing FFM2 has been adopted to the “CRUISE” phase.
Given the LTO emission indices of the selected engine, the fourth step of the aforementioned procedure was implemented in MATLAB®, adopting mission sampling schemes as the one shown in Figure 5, where climb and descent phases have been discretized using a smaller time step.
It is worth to underline that fuel consumption of both the CERAS and PrP data have been estimated in a dedicated project task by performing high-fidelity CFD (Computational Fluid Dynamics) simulations, in which the aircraft mass was updated at each time-step in order to account for fuel consumption [68].
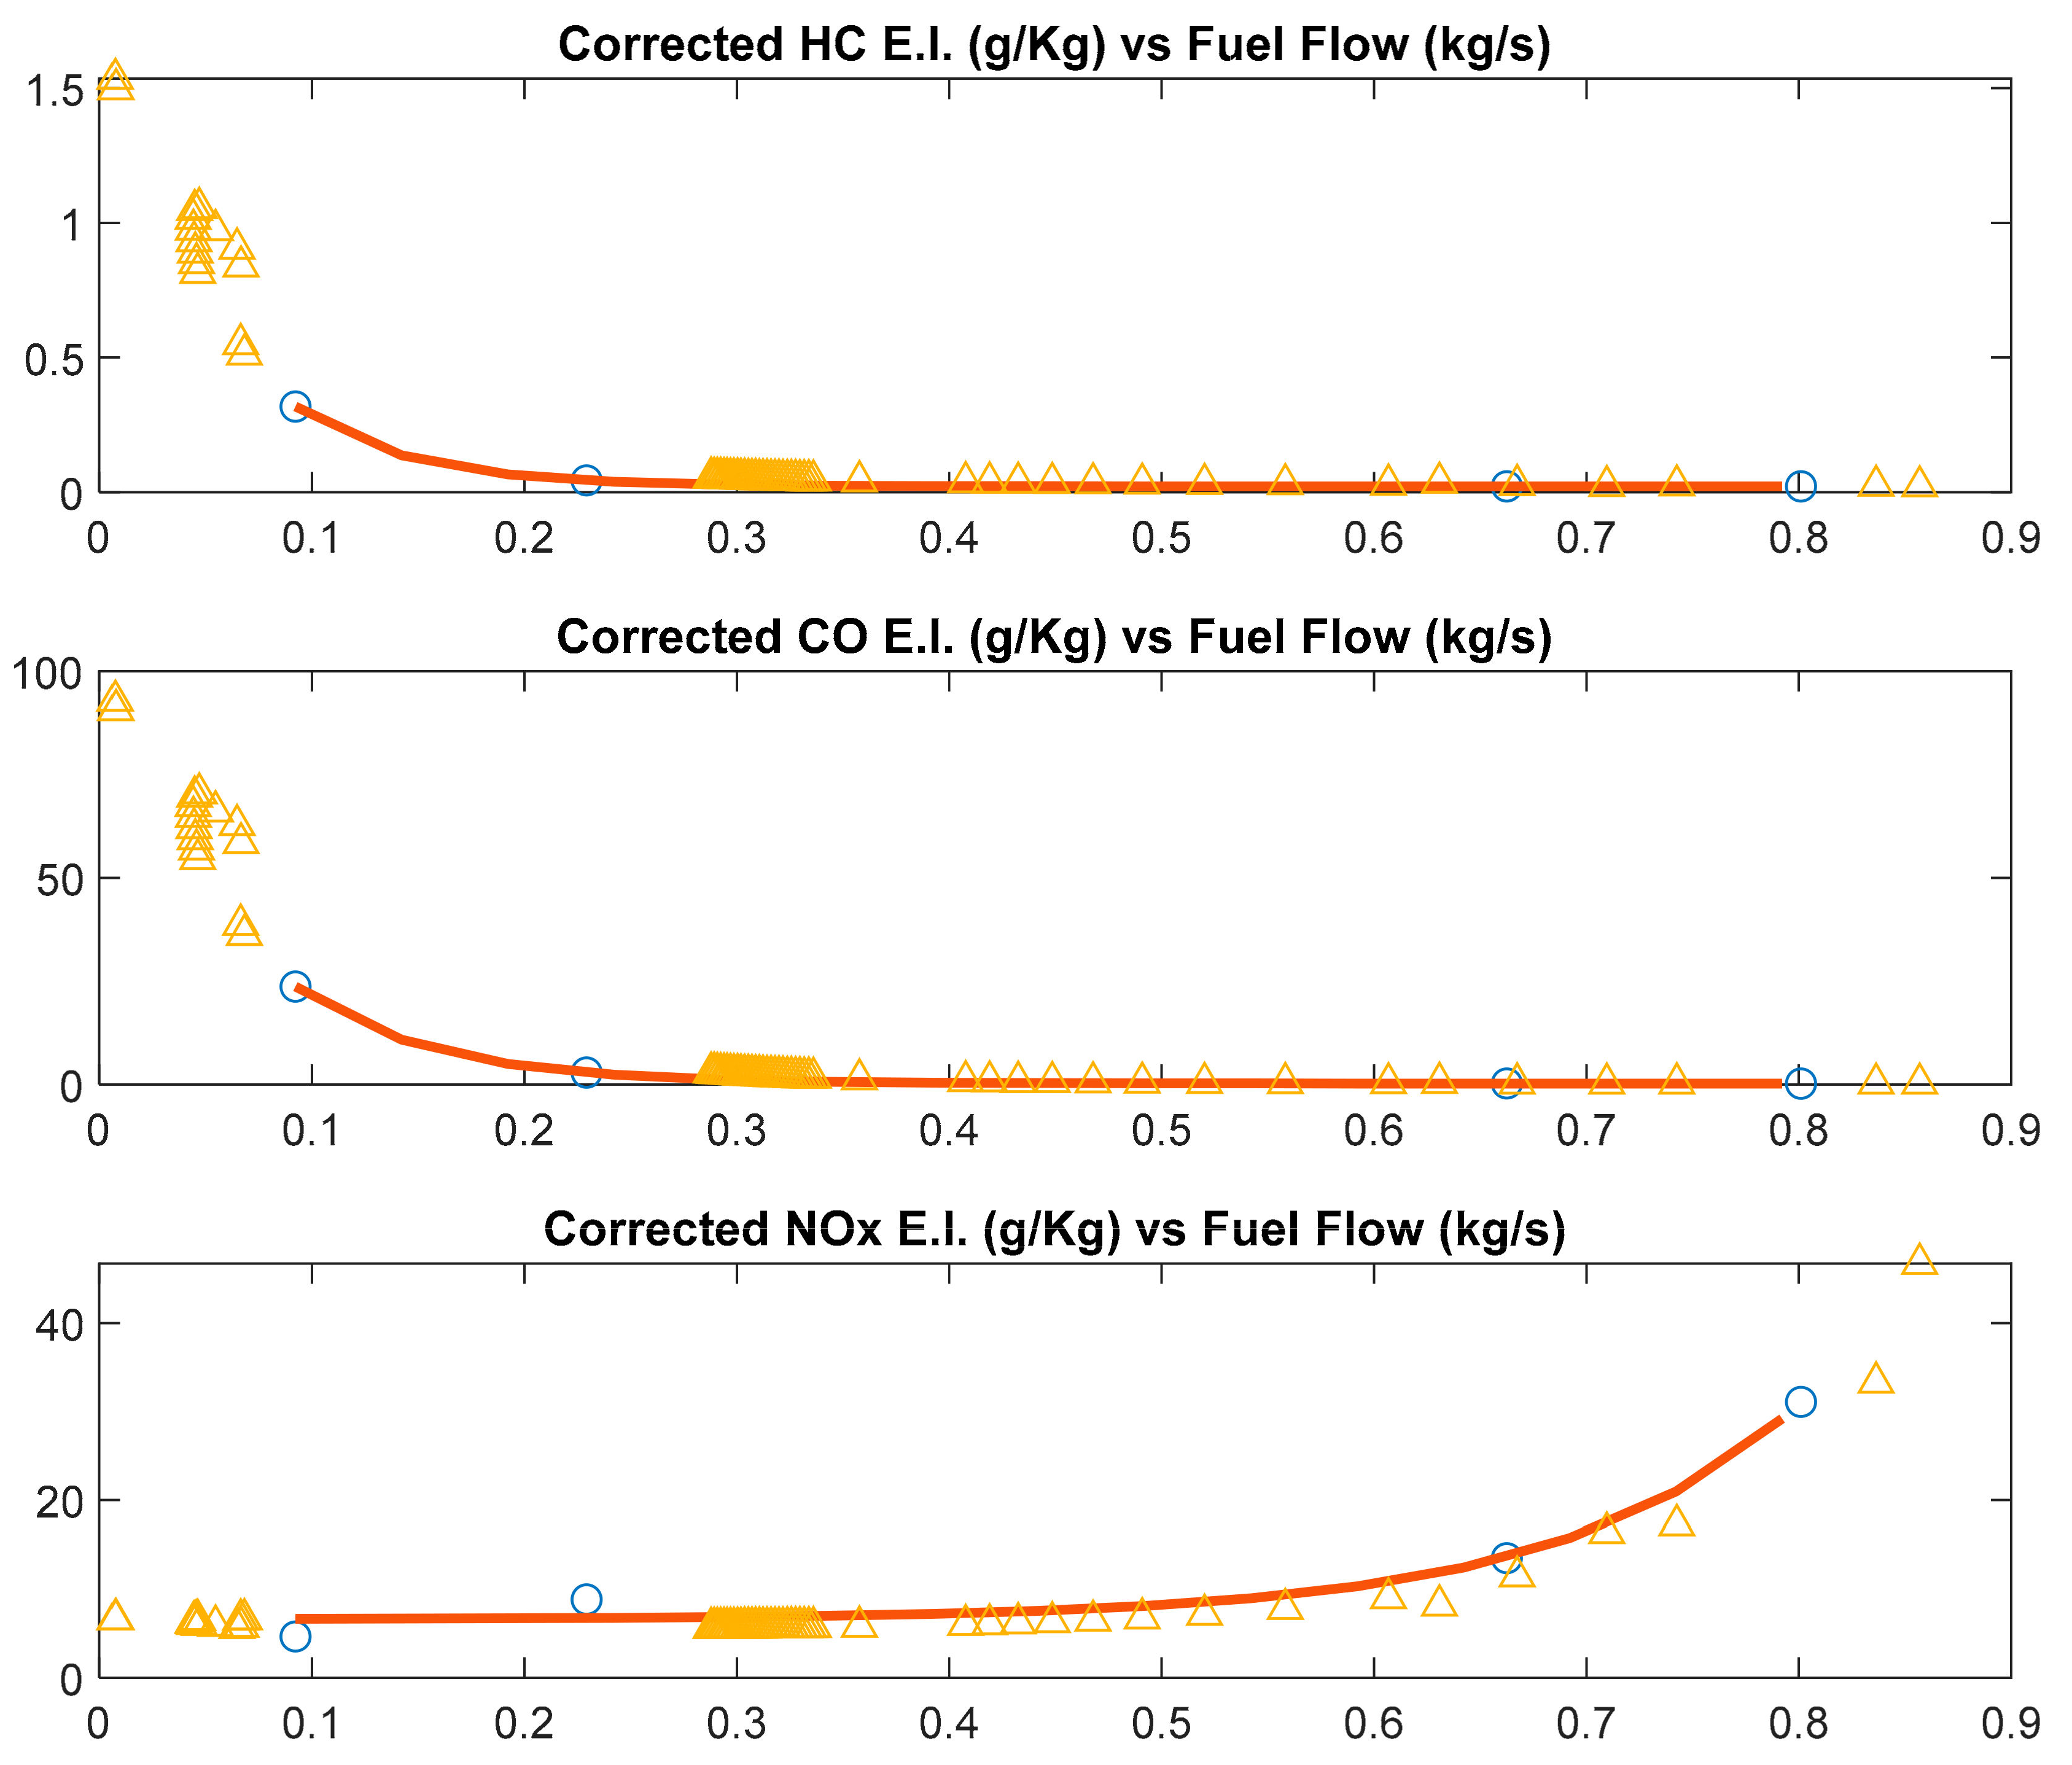
Therefore, at each time sample, EI of the LTO phases have been adjusted through the FFM2 procedure by defining relations between Fuel Flow and Emission Indices which takes the Mach number and altitude into account. EI were then interpolated or extrapolated using the “CRUISE” full flow values (Wf)i as input. Figure 7 shows the correlation steps of the CERAS scenario: LTO values corrected according to BFFM2 (blue circles), best-fitting exponential curve built on the LTO values (red lines), and “CRUISE” emission indices resulting from interpolation/extrapolation (yellow triangles). Moving on the charts showed in Figure 7, corrected EI are related to descent phase (lowest fuel flow values), cruise phase (set of closer triangles) and climb phase (highest fuel flow values).
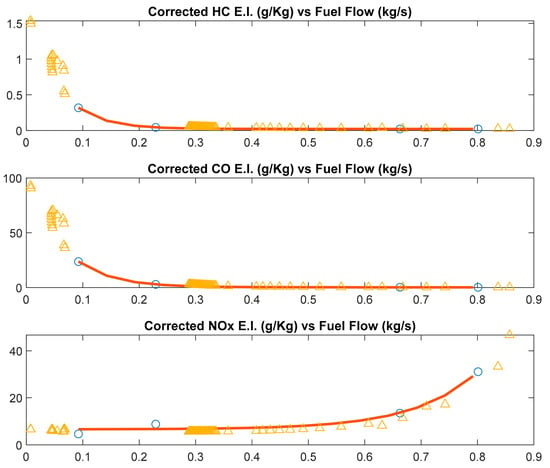
Figure 7.
Corrected Emission Indices for CeRAS—Short Range Reference Aircraft (CERAS) (cruise at M = 0.79, h = 11,000 m).
2.4. Impact Assessment Method
Global and regional emission metrics proposed by Lund et al. GWP and GTP (time horizons: 20 and 100 years) have been applied, considering CO2, SO2, BC, NOx, and nitrogen oxide-induced impacts on O3, CH4, and nitrate aerosols, contrails, and contrail cirrus development [58]. HC and CO have not been included in the impact assessment, due to the lack of reliable metrics. As input to the GWP and GTP definition Lund and co-workers estimated the global-mean radiation forcing for the emissions and the region considered.
Global and regional GWPs and GTPs of CO2 are based on the impulse response function proposed by Joos et al. [69]. The direct forcing due to aerosols was accounted by the 3-D radiative forcing kernels proposed by Samset and Myhre [70]. The ozone forcing due to nitrogen oxides was quantified by the Oslo Radiative Transfer Model, with stratospheric temperature adjustment [71]. The radiative forcing (RF) of NOx-induced CH4 changes was quantified as follows:
where is the relative change in the lifetime of CH4 between the control run and each emission perturbation, [CH4]2010 is the 2010 global concentration of CH4, RFeff the gas radiative efficiency [49] and f the feedback factor proposed by Holmes et al. [72]. The radiative forcing of the corresponding CH4-induced ozone change—O3 primary mode (PM) [73] was estimated as:
Furthermore, the additional negative RF resulting from the diminution of the stratospheric water vapor (RFCH4-swv) due to the reduction of atmospheric methane [74] was included in the RFCH4 as:
Metrics for contrail cirrus are given on emitted CO2 basis. The ECHAM5-CCMod model [75,76], based on a two-moment microphysical scheme, was implemented to estimate the radiative forcing from the development and persistence of contrails and contrail cirrus. The RF was then reduced by 20% for all emission source regions to account for the decrease in natural cirrus clouds due to contrails cirrus formation [77].
3. Results
3.1. Fuel Consumption and Emissions
Fuel burnt and emissions have been estimated for both the CERAS and PrP scenario. The passenger Load Factor, i.e., the % of occupied seats, and the nominal cruise range have been assumed as equal to 1 and 4000 km, respectively. Table 3 summarizes the input considered for emission evaluation, including fuel consumption data resulting from CFD simulations.

Table 3.
Input for emission estimation.
Results of the comparison are given in term of percentual variation of the total emitted quantities per passenger-kilometer, calculated for the PrandtlPlane with respect to the CERAS case.
Referring to Table 4, the following comments can be made:

Table 4.
Estimated fuel consumption and emissions.
- The higher aerodynamic efficiency of the PrP combined with the higher payload capability, result in a reduction of fuel consumption per pax-km close to 20%, which does not depend on the engine EI estimation approach;
- CO2, H2O and SO2 emissions mainly depend on the “CRUISE” fuel demand. Hence, the fuel saving achievable by the higher aerodynamic performance of the PrP is reflected also on emissions, with small differences depending on the approach adopted to estimate engine EI approach;
- the PrP has lower HC and CO emissions compared to CERAS, although CO is significantly sensitive to engine EI estimation approach;
- NOx emissions variations are less significant and more affected by engine EI estimation approach, as shown by Table 4;
- BC emissions increase although sensitivity to engine EI approach is significant.
Since the uncertainties about engine technology affect the EI estimation, the most reliable outcomes in terms of PrP impact on emission with respect to the CERAS scenario are:
- In total, a ~20% reduction of fuel consumption, CO2 and SO2 per passenger-kilometre;
- More than 15% reduction in HC emitted per passenger-kilometre;
- Reduced CO emission per passenger-kilometre;
- Increased emission of Black Carbon (BC).
3.2. Impact Assessment of PrandtlPlane Emissions
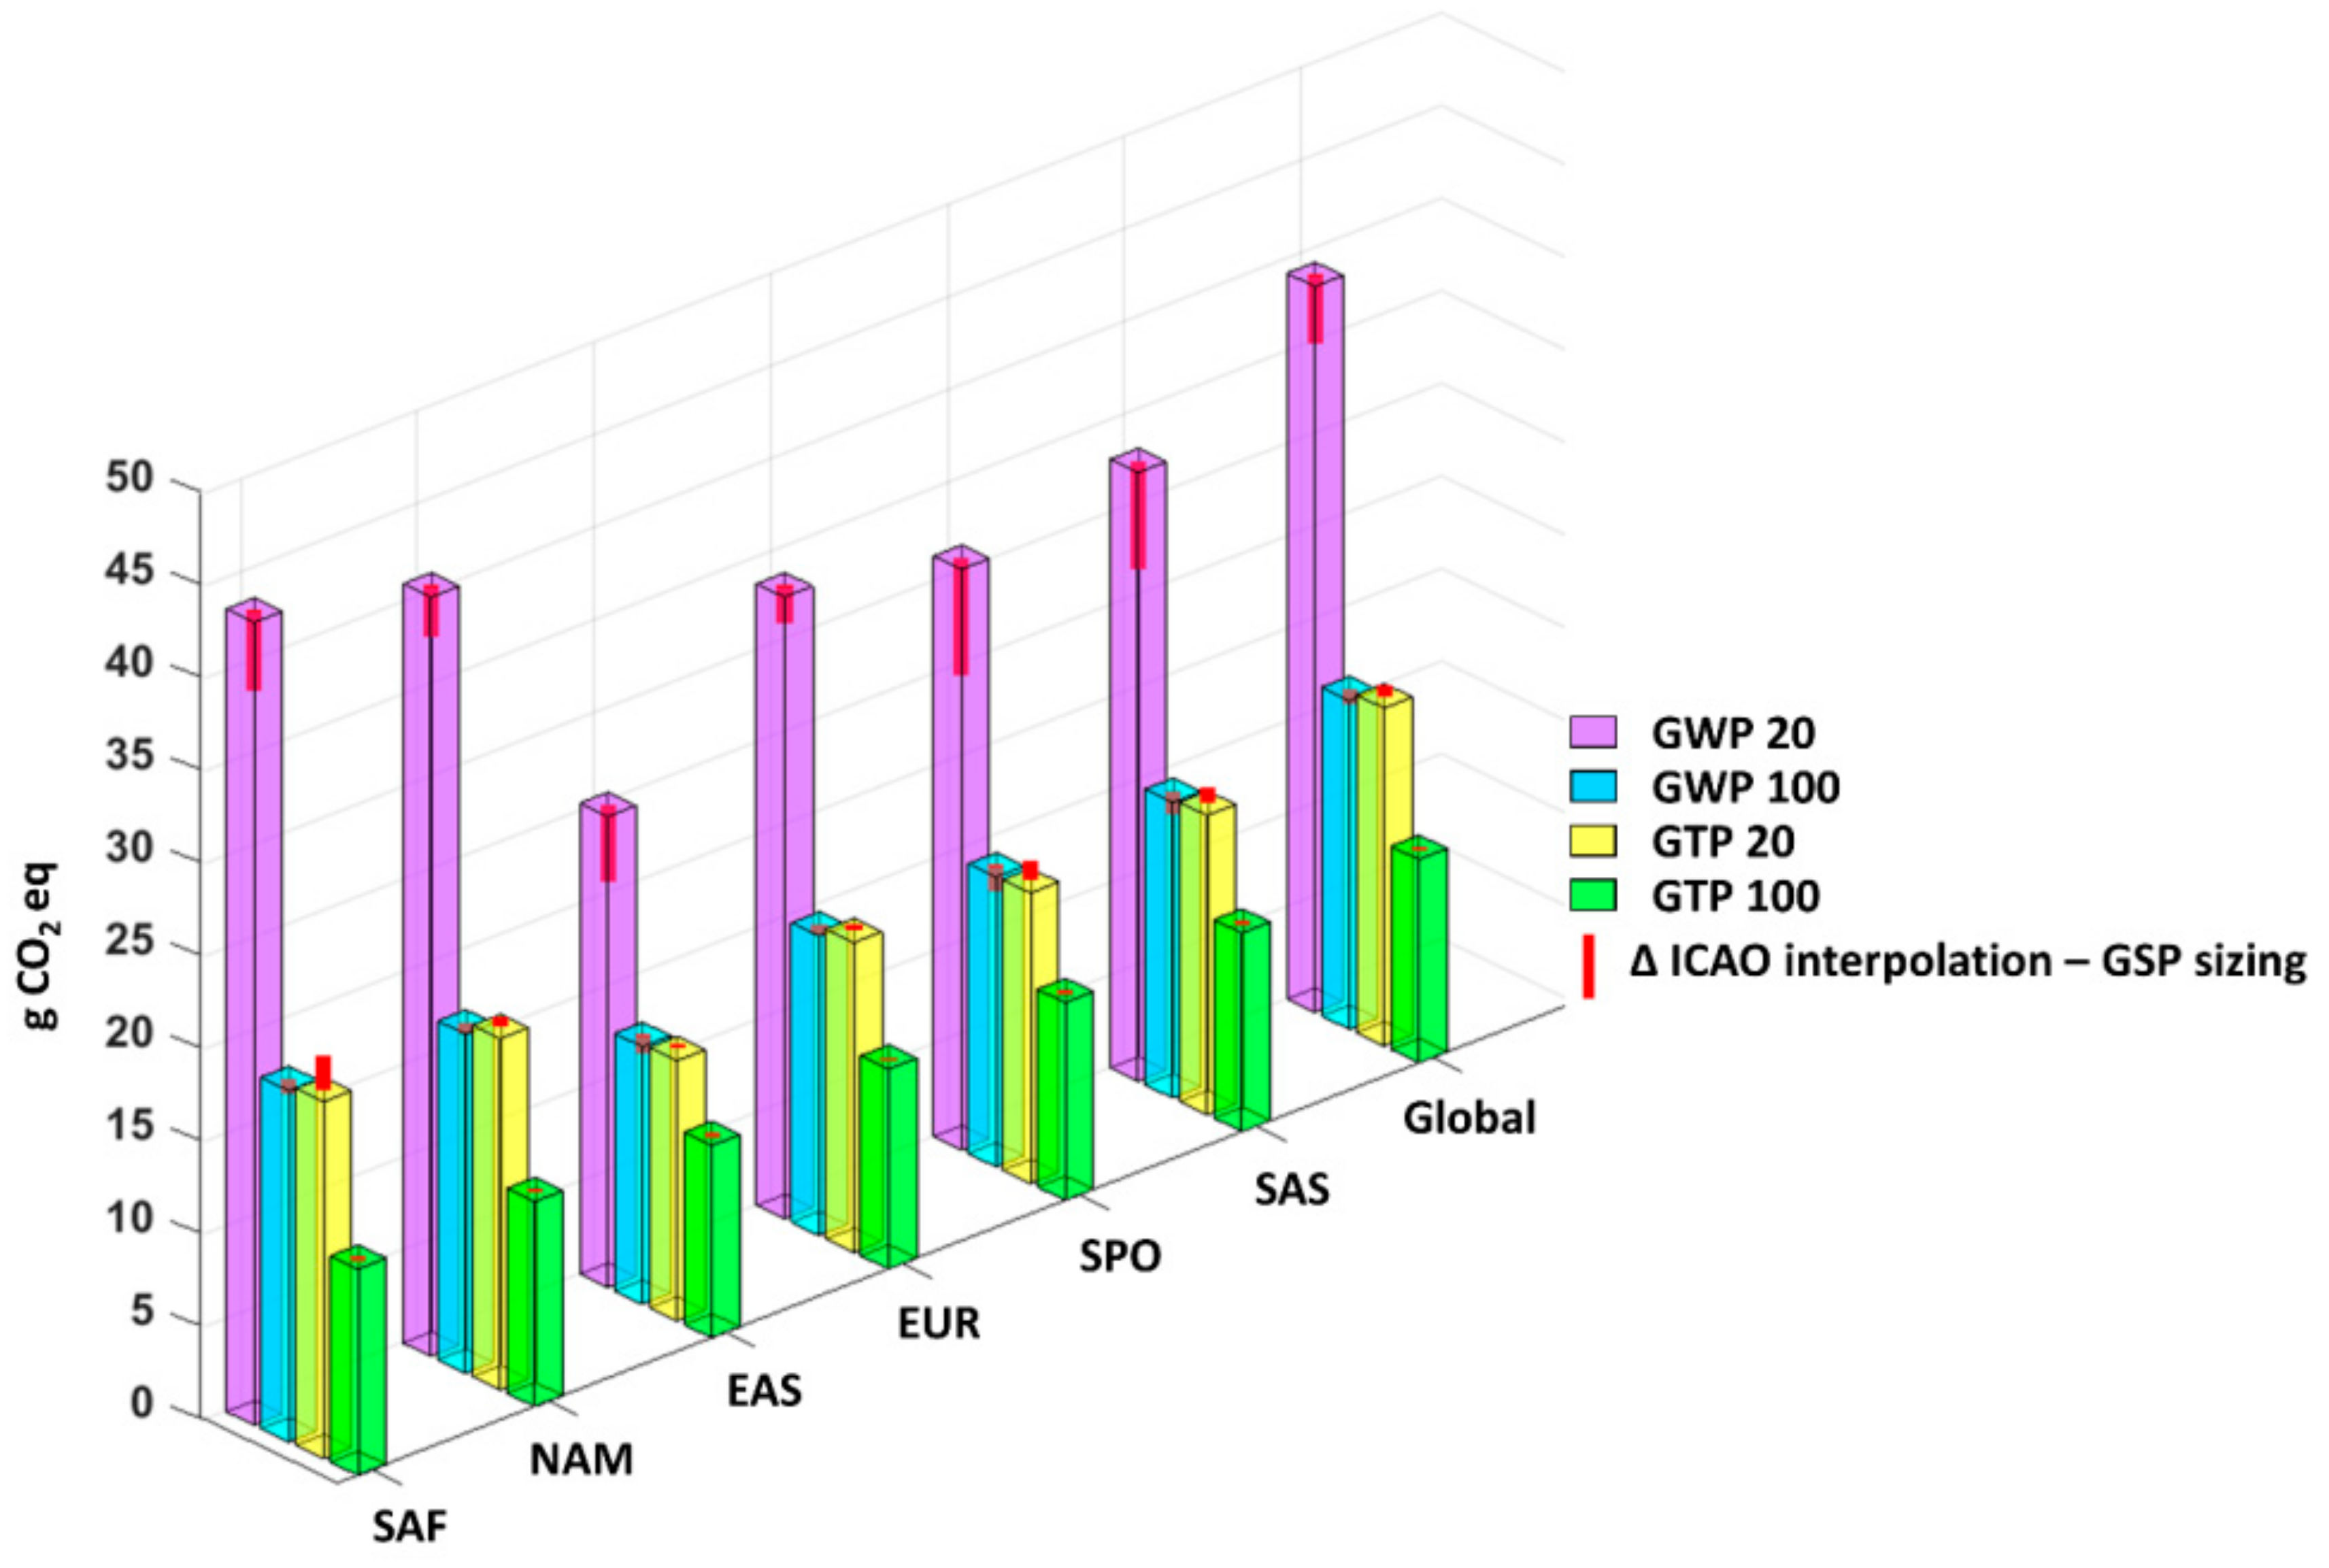
As reflected by the analysis of two temporal horizons, the lifetime of the estimated effects has different orders of magnitude (Figure 8 and Table 5). Contrails [14] and NOx exist for hours [78], NOx-induced impacts last from weeks to years [15], while CO2 has an atmospheric lifetime of centuries [11]. Furthermore, the estimated impacts depend significantly on emission regions, as the underlying metrics vary by a factor of 2–4 between source regions.
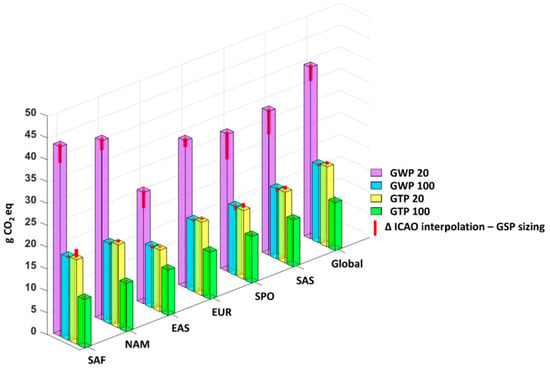
Figure 8.
Impact assessment: avoided impacts (PrP-CERAS) [g/(pax∙km)]. Red bars denote the difference between ICAO interpolation and GSP-sizing.

Table 5.
Estimated regional and global GWP and GTP on time horizons 20 and 100 years (g/(pax∙km)), GSP-sizing.
Overall, the introduction of the PrP is expected to bring a considerable reduction of impacts on climate in all the source regions considered, on both the time-horizons examined.
Aircraft exhausts are the only stratospheric direct source of anthropogenic black carbon [79]. The derived aerosols are radiation absorbers (i.e., result in positive forcing) with atmospheric lifetimes longer than other transportation sources [51]. Conversely, sulfuric acid aerosols increase the scattering of incoming radiation [11]. The results obtained reflect the highest aviation aerosol metric values for the South Asia and Middle East region, followed by South America and Africa and South Pacific Ocean, which is ascribed to the underlying distribution of emissions. Indeed, few flights land or depart from these regions; hence, aerosols are mainly produced at high altitudes, where their lifetime is likely less affected by wet scavenging. Aerosol–cloud interactions, not included in this investigation, demand to be assessed. Indeed, BC alters the albedo and lifetime of clouds [80]. Hence, upper troposphere BC and BC emitted in the stratosphere may enhance the climate change [10], serving as ice nucleation site and cloud activator [81,82,83]. Same applies to aerosol sulphate, as confirmed by the recent findings [84]. The bulk of the aerosol radiation forcing has been ascribed to the aerosol–cloud interactions, with aerosol sulphate playing a key role, affecting cloud droplet number concentration and radius once transported to low altitudes. Significant negative forcing is expected only if a large amount of ultra-fine sulphate particles is emitted [14].
Nitrogen oxides have a short atmospheric lifetime (hours to a day, depending on the source region [78]), while the warming effect of tropospheric ozone formed via smog reactions lasts from weeks to months. Additionally, methane in the atmosphere is destroyed (negative forcing) with a lifetime of years [15]. There are further negative radiative forcing effects connected to the reduction of the lifetime of methane, i.e., small reductions in background ozone and stratospheric water vapor [74]. Moreover, NOx emissions increase nitrate aerosol concentrations and enhance the SO2 to H2SO4 conversion rate, increasing the earth’s albedo (cooling effect) [85]. The overall balance is warming. The magnitude of NOx-induced impacts depends on altitude [86,87] and season [88]. Recently, aircraft measurements combined with climate-chemistry modelling show that the high ozone chemistry at low latitudes is a source of major contributions of aviation NOx to ozone production if emitted in a high-pressure ridge [14]. Here (Table 5), the relevance of the geographic region can be seen [89]: GWPs100 and GTPs100 of the PrandtlPlane range from 3.39 to 14.56 and from 0.37 to 1.74 g/(pax∙km), respectively.
Contrails and cirrus clouds act as a barrier to the incoming short-wave radiation, as well as to the outgoing long-wave radiation, resulting in a cooling and a warming effect, respectively. [11]. Persistent contrails develop near the tropopause, in ice supersaturated zones [90]. The related impact is related to the altitude of the exhaust emission, which together with the water available for deposition, depend on the latitude [91]. Recent observations reported within the ‘DLR WeCare PROJECT’, confirmed the major warming contribute during night, when the short wave forcing cannot occur [92]. Conversely, during daytime the balance negative and the positive forcing results in a negative contribution [92,93]. On a global and annual average, the overall effect results in a positive force [15]. The impact is expected to be higher for North America and Europe, where contrail development is prevalent [94], and in the tropics, where the optical depth of contrails is very high, due to the large availability of water vapor [58]. This cannot be directly appreciated by all the values shown in Table 5. Estimated impact of contrails cirrus was high in the North America region (PrP GWP100: 39.38 g/(pax∙km)), but even higher in the region of South America and Africa (PrP GWP100: 35.80 g/(pax∙km)). This is ascribed to the fact that the metrics adopted here take into account not only the probability of contrails development related to the regional difference of the atmosphere, but also the number and the type of flights occurring.
4. Discussion and Recommendations
Sensitivity of data, models, and metrics, along with the gaps to be addressed in order to carry out a comprehensive LCA on the aircraft emissions, are detailed in Section 4.1 and Section 4.2, while Reduction and mitigation strategies are discussed in Section 4.3. Finally, the challenges to the mass production on the aircraft are summarized in Section 4.4.
4.1. Emission Data and Estimation
The FOA3 methodology endorsed by the ICAO in 2007 [95] is still widely adopted to predict BC emission as function of measured SNs. However, the FOA3 has become unreliable due to lack of accuracy in the measurement of low smoke numbers of modern high bypass ratio engines, as it has been shown to underestimate BC production by >90% in 35% of directly measured scenarios [65]. The FOX method [65] is independent of the SN, but as the FOA3 is designed to predict emissions of black carbon at ground level (LTO), of human health concern, while cruise emission plays the key role on the climate forcing. The Döpelheuer and Lecht relation [96] predicts cruise BC by scaling ground values, but at the time of its development limited measurements were available. The ASAF method [97] was recently developed to quantify BC emission reductions due to the use of alternative jet fuels containing mainly iso- and normal paraffins, with less than 10% cycloparaffins and less than 1% aromatics.
The ImFOX recently, developed by Abrahamson and co-workers from the FOX method and adopted in the present assessment, is recommended in the assessment of BC from aircraft exhausts, as it can be used to estimate both LTO and cruise phase, taking into account the reduced aromatic content of alternative fuels if used. Furthermore, while the relationship between AFR and thrust is overlooked in the most used flame temperature prediction relationships, the ImFOX elects the temperature at the back of the combustor in place of primary zone flame temperature. This assumption is consistent with the AFR used (at the back of the combustor), being the combustion in the fuel-rich and fuel-lean regions, corresponding to the BC production and oxidation zones, respectively [56].
The p3T3 approach [98], where p3 and T3 are the combustor inlet pressure and temperature, requires the knowledge of internal engine parameters [99] to estimate NOx emission. Hence, DLR [100] and Boeing [101] fuel flow correlations have been developed to predict in-flight emission indexes as function of fuel flow, flight speed, and ambient atmospheric conditions. Engine-specific emissions data at sea-level static conditions are used as reference conditions. The in-flight fuel flow is reduced to reference conditions, then an emission index function of the reference fuel flow is obtained and translated to actual flight conditions (i.e., considering air pressure, temperature, humidity, and flight speed). The DLR method requires the input of total pressure and temperature, including stagnation and flight speed effects, while the Boeing approach demands ambient air pressure and the Mach number. Both methods are recommended, as the data available barely allow the implementation of the p3T3 relationship, while in-flight fuel flow can be computed by aircraft performance software. The accuracy of these fuel flow methods in predicting NOx cruise emission is estimated to be around 10% [102].
Notwithstanding the recent advances on emission characterization and modelling, major uncertainties remain. Emissions of organic carbon was not taken in account in the present investigation due to the lack of applicable models and inventories. Progress is encouraged in the quantification of many volatile organic compounds, which are known to be sources of tropospheric ozone by well-established atmospheric photochemical reactions [103]. The chemical speciation of particulate matter and the influence of lubrication oils, fuel and engine type, and engine aging demand deeper understanding, as well as the relationship between plumes aging and particulate matter mass and composition. The election of species which could serve as tracers for several emission sources is encouraged, together with the quantification/modelling of sulfuric acid, HONO, and HNO3 emission [103]. Our results do not include interactions between aerosols and clouds, as uncertainties on contrails and contrail cirrus are still large [104].
Whereas emission modelling is not possible, due to the lack of data/model availability, up-to-date inventories are needed. Indeed, available landing and take-off standards may cause significant uncertainties. The effects of actual fuel flow and time-in-mode on the averages of landing and take-off fuel burnt and emissions have been recently investigated, considering thousands of flights, performed by different models (A319, A320, A321, B737, B738) equipped with different engines (V2524-A5, V2527-A5, V2533-A5, CFM56-7B22, CFM56-7B24, CFM56-7B26, and CFM56-5B4/3). Comparing to the ICAO approach, minor time in mode averages were recorded, while great differences in fuel burnt were confirmed during take-off and approach. The resulting landing and take-off fuel burnt averages were estimated as 35% lower than ICAO data [105].
4.2. Impact Assessment: Towards a Holistic Approach
Gaps on the emission estimation reflect on the missing of applicable metrics. Impact estimation through different metrics is highly recommended, as radiative forcing and GWP provide only partial information on the impact to climate change [11]. Indeed, the emission of two gases with the same GWP but with high RF and short lifetime, and low RF and long lifetime, respectively, results in a different temperature response [48]. The information given by the GTP is strictly related to meteorological phenomena, while it is funded on significant uncertainties.
Introducing an uplift factor in order to account for short-lived species is not appropriate, due to the spatial variability assessed both from emission to impact and from RF to temperature response, together with the influence of emission timing. Metrics which account for regional sensitivity are required.
Notwithstanding that the GWPs of NOx estimated by Lund et al. include the cooling effect the induced formation of nitrate aerosols, they are higher than those provided by Skowron and co-workers [106] and Myhre et al. [107], but within the range reported by Fuglestvedt et al. [108]. GWPs and GTPs for BC and SO2 from Lund et al. are higher than those of Fuglestvedt et al. by a factor of 2 and 4, the latter based on several anthropogenic sources (i.e., not specific for aircraft emissions) [109]. The GWPs and GTPs of contrails and contrail cirrus given by Lund et al. do not include aerosol–cloud interactions and significantly depends on routes and flight altitudes, climate, propulsion efficiency. Their values are similar to those of Fuglestvedt et al. However, Lund and co-workers estimated a different CO2 impulse response factor, included the combined radiation forcing of contrails and cirrus originated from them, and the feedback of natural clouds.
Different sources regions correspond to different impacts. Concerning the Lund et al. assessment, considerable differences can be observed. The regional GWPs20 of NOx agree with the estimation of Köhler et al. (2013), while regional GTPs20 are ~50% lower in absolute magnitude, and GWP100 and GTP100 of the North America region and Europe region are 50–100% higher. Differences may be due to the definition of source regions, input radiative forcing, CH4-induced effects on O3 and stratospheric water vapor, and in the parameters of the impulse response function [58].
Notwithstanding the altitude profile of the emission can be known (as in the present investigation), aviation specific GWPs and GTPs with a vertical resolution able to capture different efficacies of emissions at different altitudes do not exists. However, those proposed by Lund and co-workers are derived using realistic profiles of emissions and thus, to an extent, already encompass such differences.
Despite the progress made in the impact assessment, many issues remain unaddressed. Enhanced knowledge is required on atmospheric chemical and physical modifications of particulate matter, oxidation of HC to less volatile species, and development of sulphate on existing particles [103]. More in-depth research is needed in order to reduce the uncertainties on contrails and contrail cirrus, as well as on the interactions between aerosol clouds. The bulk of the aerosol forcing has been ascribed to the aerosol–cloud interactions, and aviation-induced aerosol sulphate may be the key component, but the assumed size distribution of emitted sulfur particles is fundamental [14].
Notwithstanding the relevance of exhaust emissions, a comprehensive LCA on climate impacts of aviation should also take into account of auxiliary power units, ground power units, fixed ground electrical power, transport for flights and passengers, and transport in and out to the airport [103]. Furthermore, despite the significance of aviation-induced climate change, further research is encouraged with the aim to highlight the impact of this sector on human health, terrestrial acidification, water, soil ecotoxicity, and resource depletion.
4.3. Impact Reduction and Mitigation
The debate over the estimation of aircraft emission and impacts must progress towards improvements in the definition of technological and operative strategies.
Significant reductions in aviation fuel demand require the implementation of radical technologies.
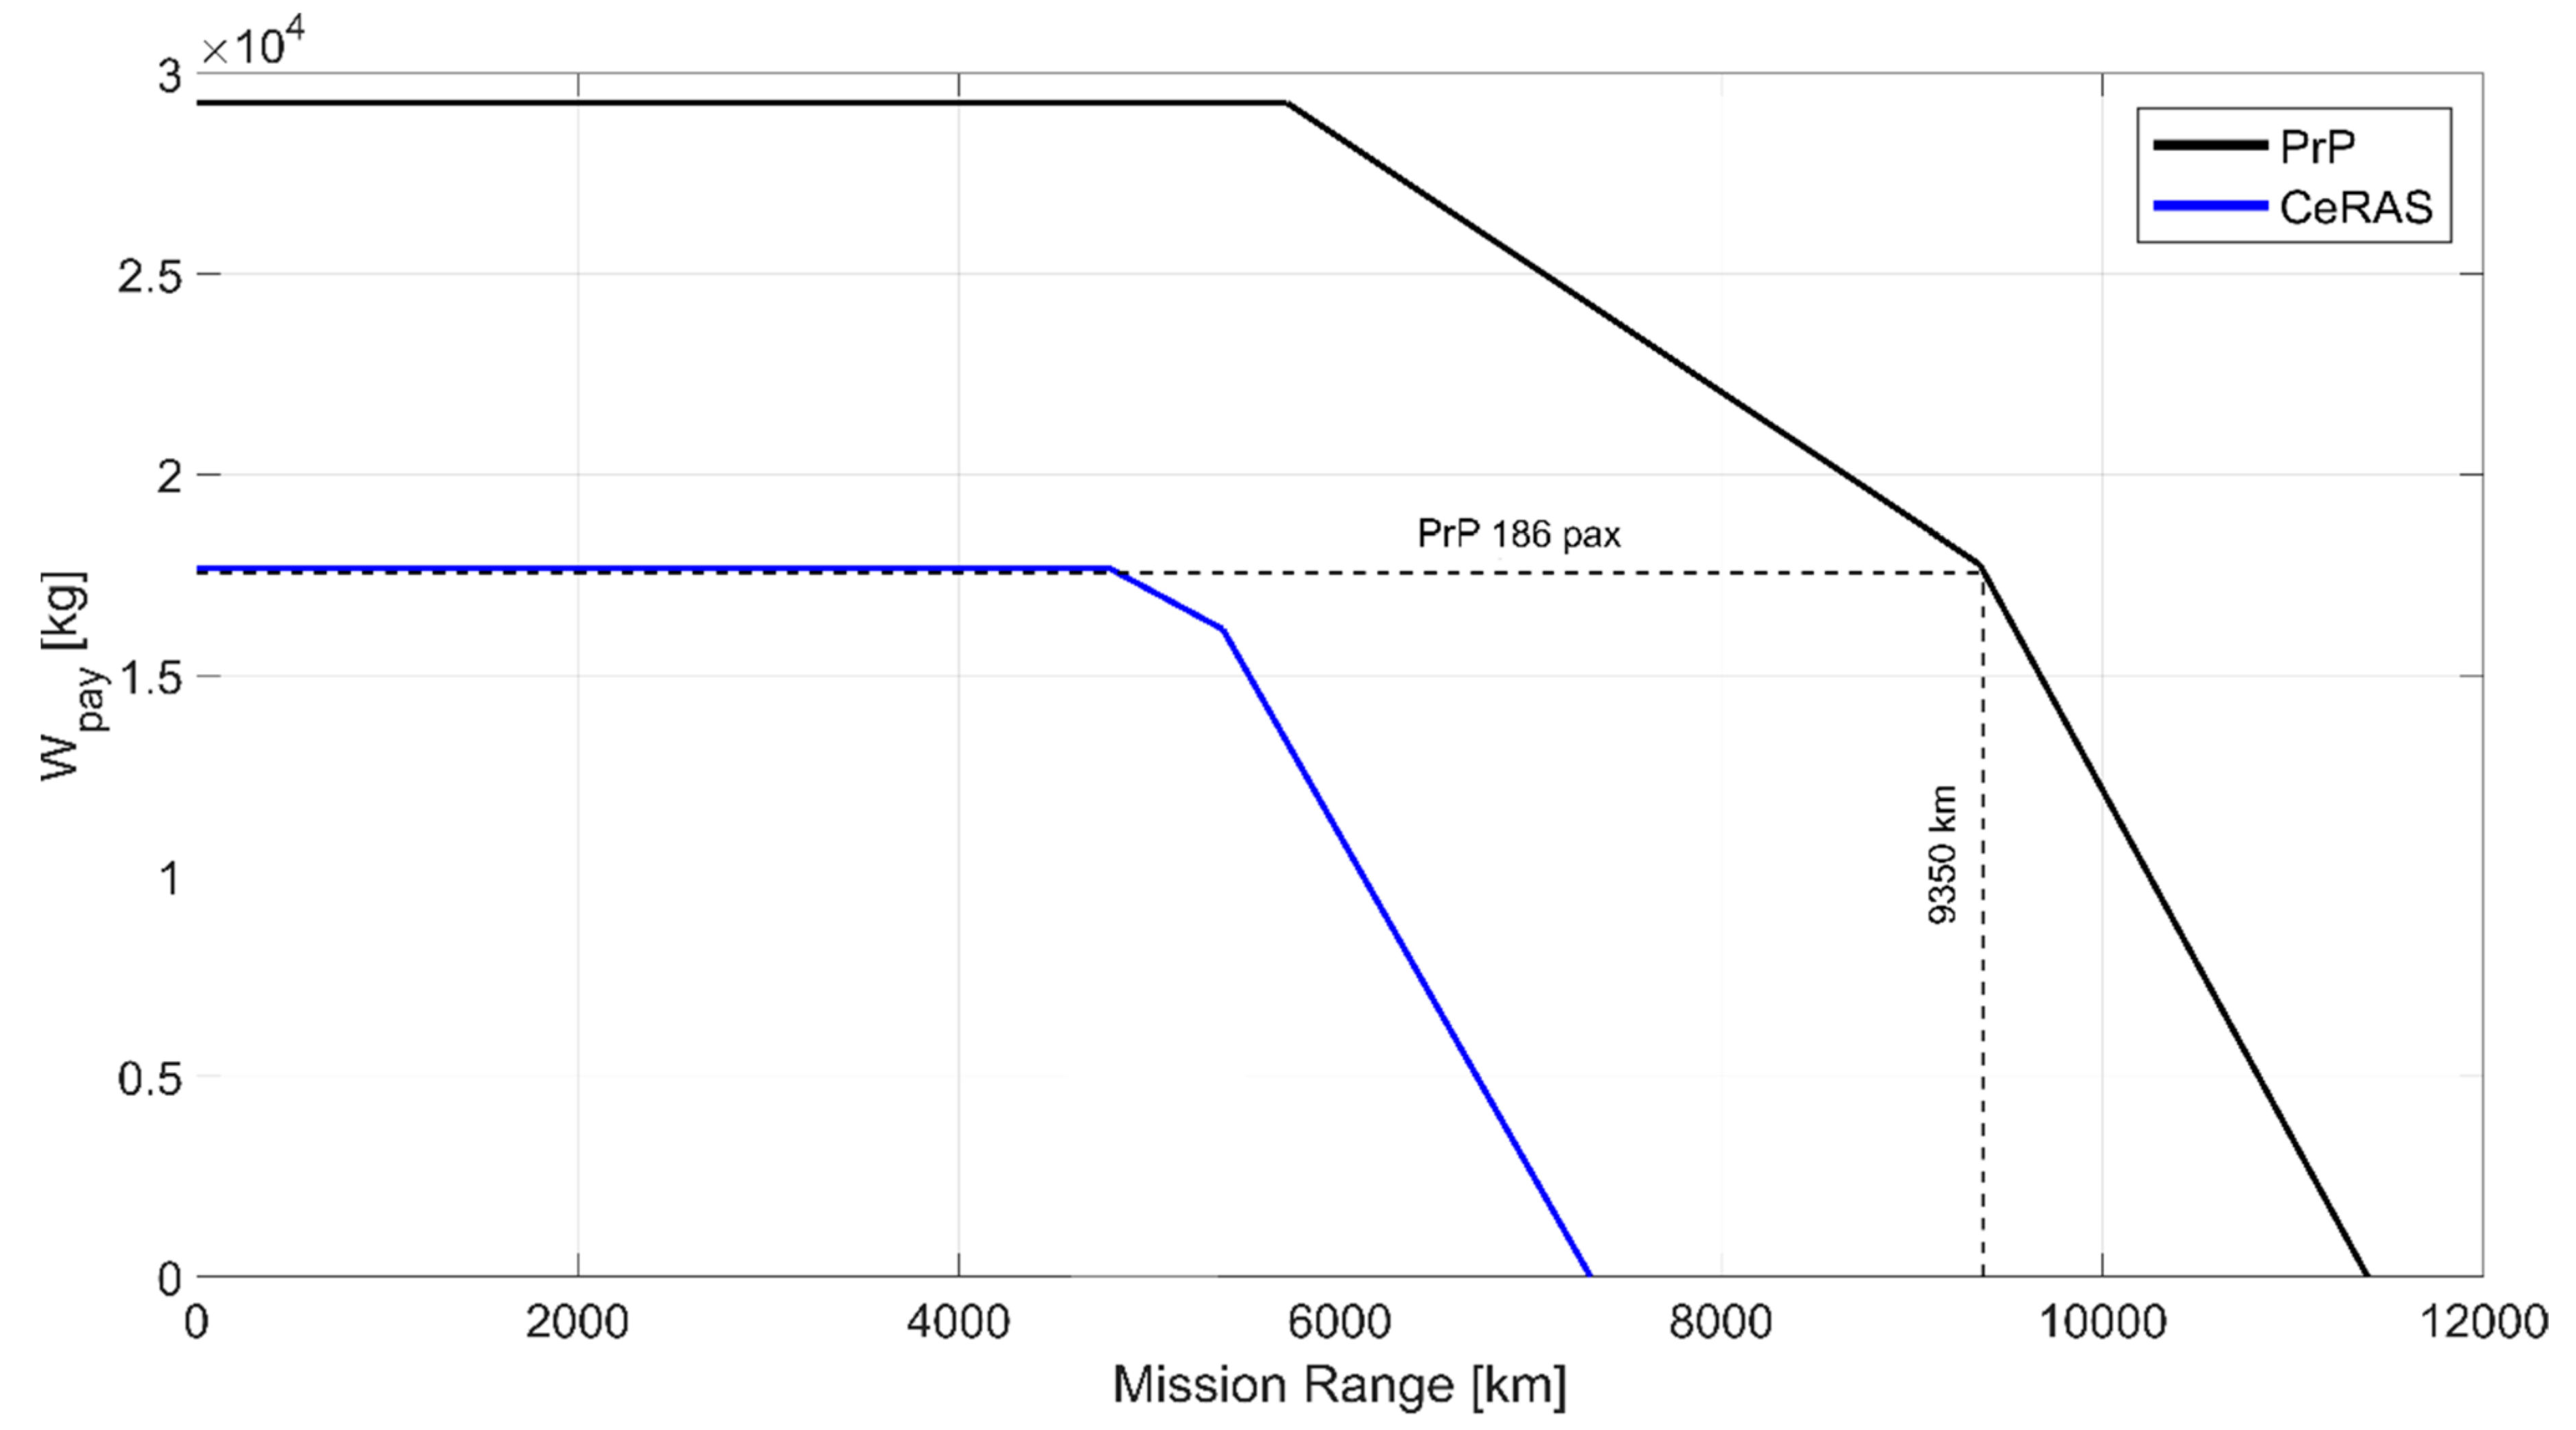
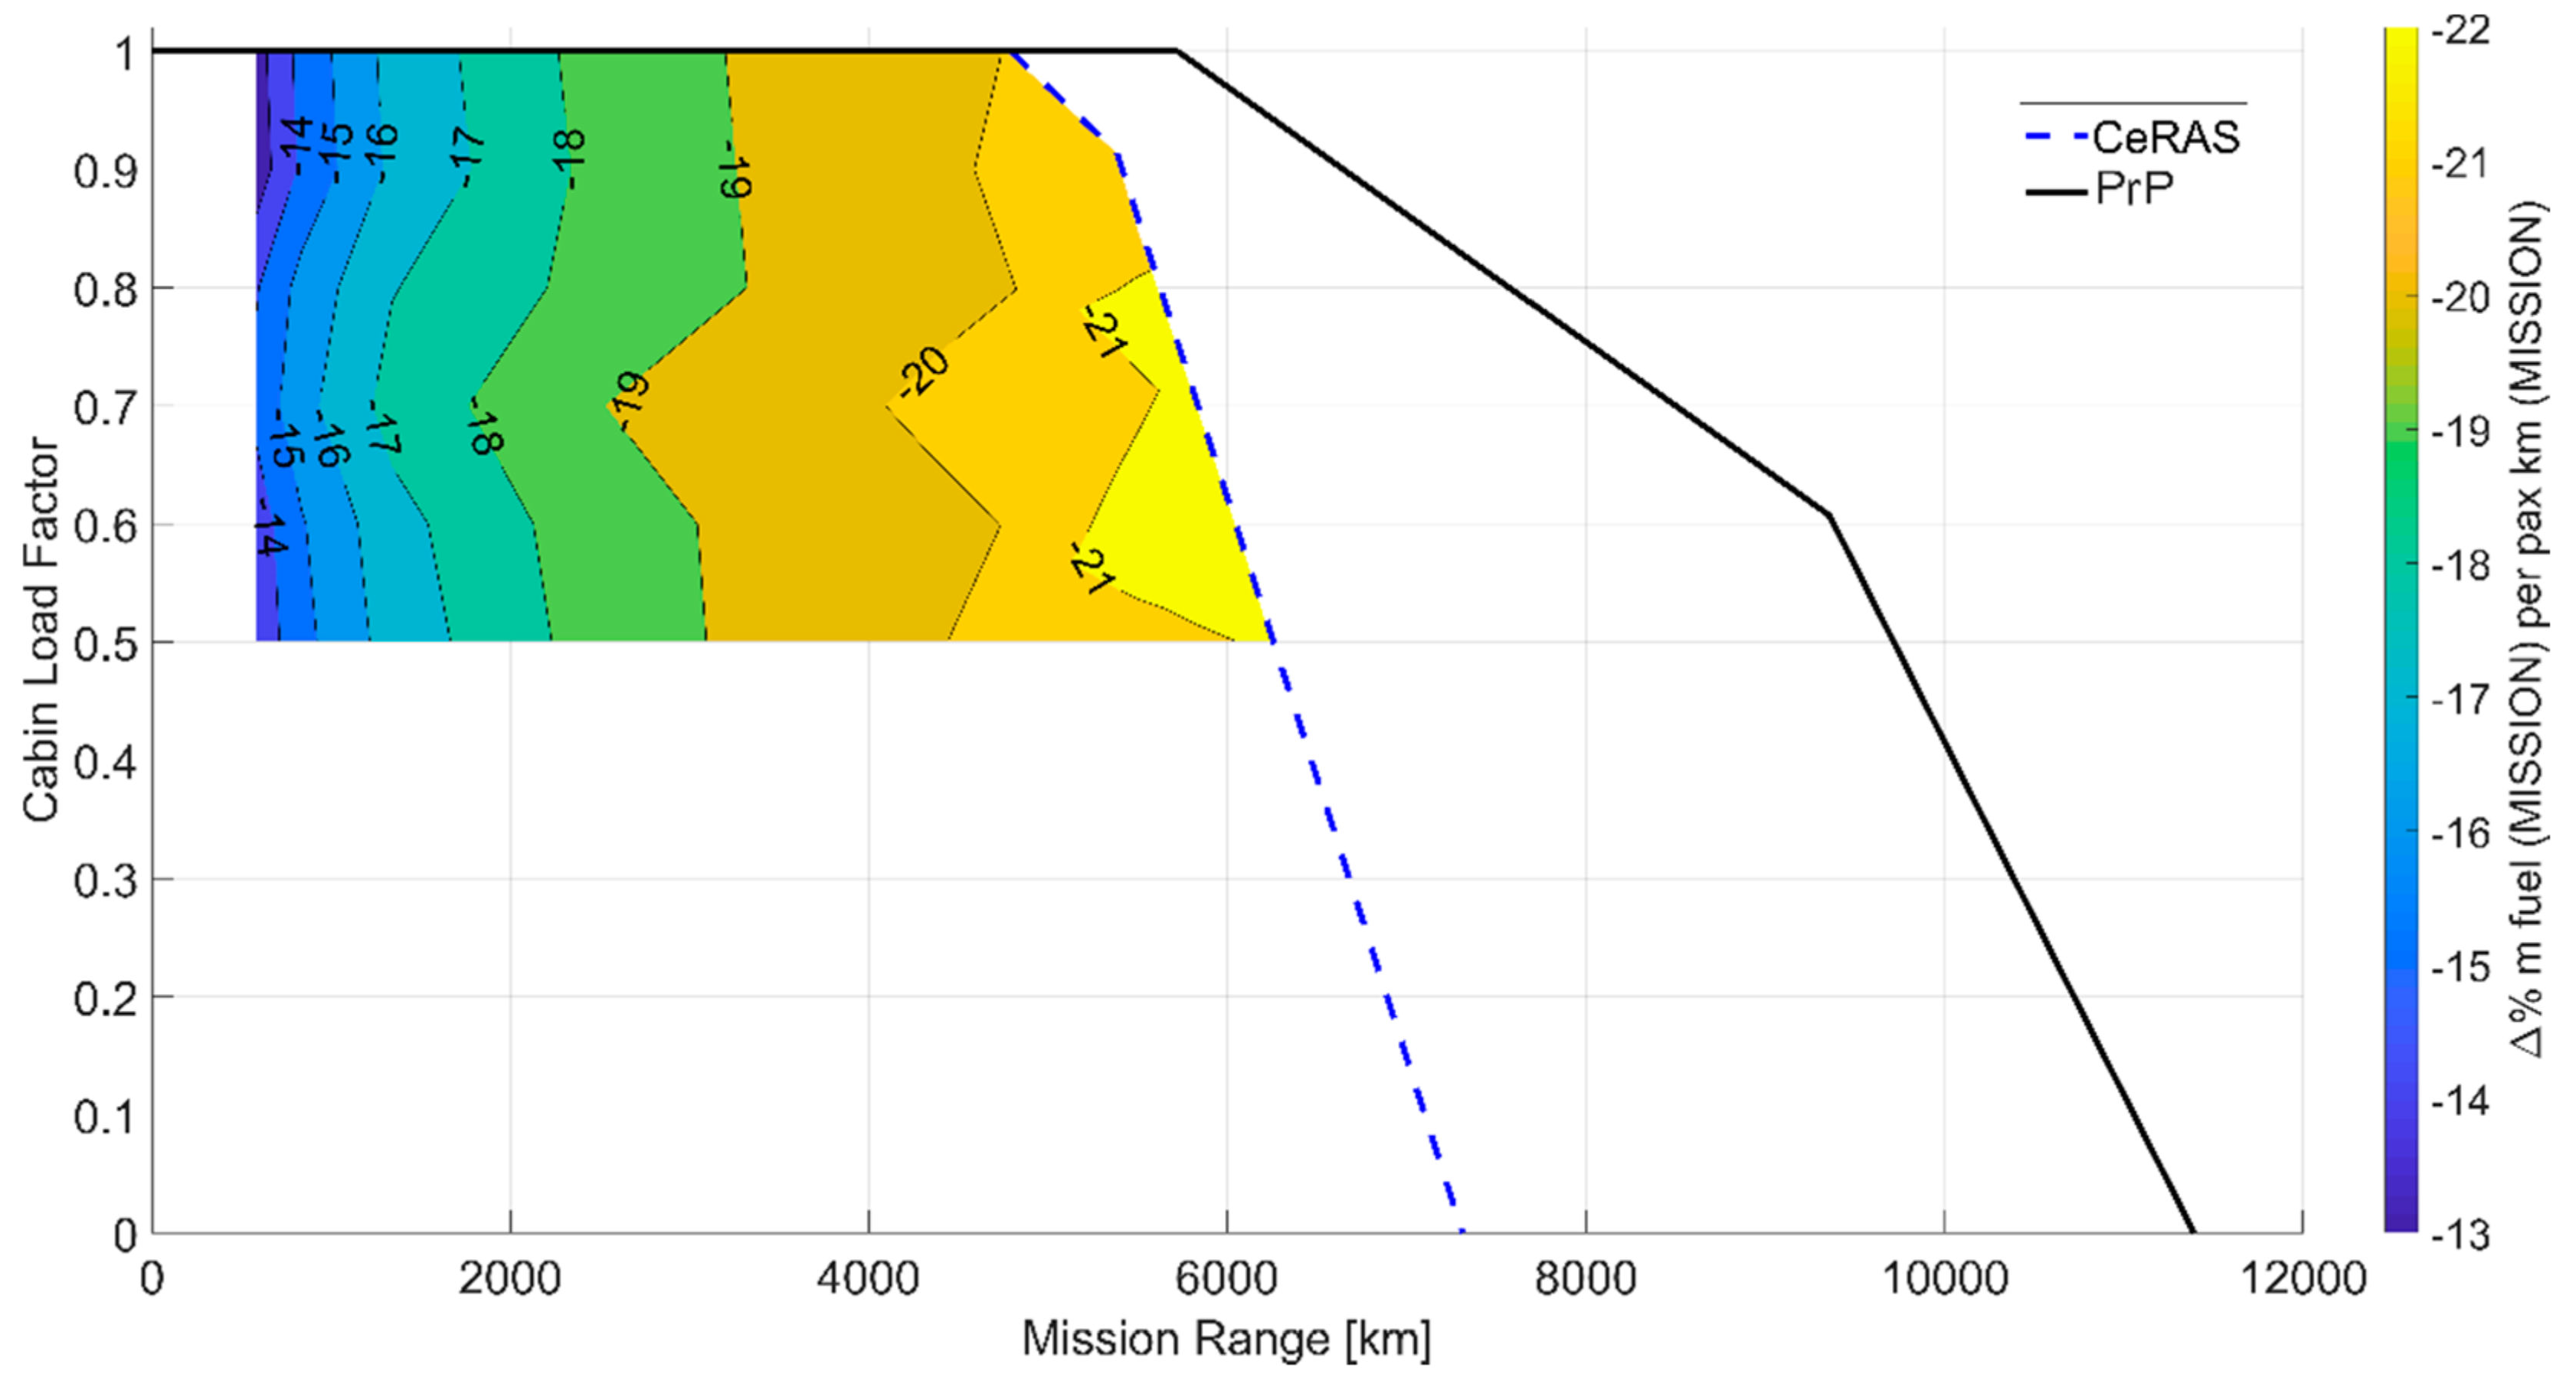
Derived from the “best wing system” concept due Ludwig Prandtl, the PrP developed in the project PARSIFAL takes advantage of its higher aerodynamic efficiency to increase the payload capability, hence reducing the fuel consumption per passenger-kilometer. The technology advance consists in the enabling an increase of the so called “span efficiency” of the aircraft, which is related to the induced drag. Whereas conventional aircraft, once optimized, can be provided with a higher span efficiency only increasing the wingspan, the box-wing configuration has additional degrees of freedom which allow to overperform the conventional wing, maintaining the wingspan below a given value. This advantage is used in the PARSIFAL project increasing the fuselage width (hence the number of seats), and, under the same wingspan constraint, improving the span efficiency [110]. The resulting effects are both the increase of number of passengers and the reduction burnt fuel per passenger-kilometer. The main characteristics of the PrP and CERAS are reported in Table S1. Numerical CFD simulations have been used to assess the aerodynamics of the two reference configurations; details of these computations are provided in [111]. Figure S3 shows the trend of the aerodynamic efficiency, expressed as lift-to-drag ratio E, with respect to the trim lift L. The PARSIFAL PrandtlPlane exhibits higher aerodynamic efficiency in each flight condition considered. These data have been used to properly assess the mission simulation outcomes. The payload–range diagram comparison, reported in Figure 9, shows the payload increase for the PrP with respect to the conventional reference monoplane; the gain is equal to +65.6% in terms of maximum number of passengers, while maintaining the same maximum wingspan. The diagrams result from the simulation of several aircraft missions carried out with a physics-based mission simulator, described in [112], which receives as input the aerodynamic, structural, and aeromechanic features of the two considered aircrafts. The simulator provides as output the distance flown and the related fuel burnt. In Figure 10, the cabin Load Factor vs. range diagrams are reported, for the two configurations; in this graph a contour of the percentage reduction of the fuel burnt per passenger-kilometer of the PrandtlPlane with respect to the conventional competitor is reported for the corresponding values of cabin Load Factor–Range. These results have been obtained by using extensively the aforementioned mission simulator. The differences in aerodynamic performance between the two-reference aircraft, such as the trend in lift-to-drag ratio as a function of the aircraft weight, reflect also in a difference of fuel burnt for each mission simulated by varying the target range and payload. The contour map in Figure 10 represents the percentage reduction of the fuel burnt per pax-kilometer for the PrandtlPlane versus the CeRAS competitor, for each Load Factor–Range pair considered. The gain in terms of fuel burnt per passenger-kilometer reduction for the PrandtlPlane is up to −22% with respect the conventional competitor. As also shown by Figure 10, the capability of reducing fuel consumption (i.e., atmospheric emissions), increases as the mission range increases.
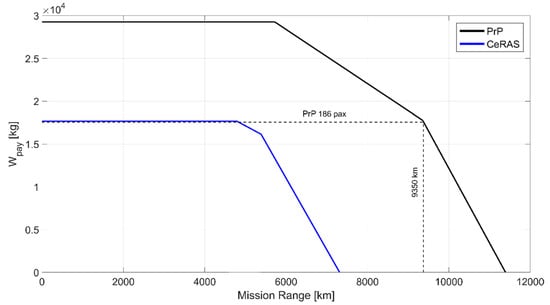
Figure 9.
PrP vs. CeRAS payload–range diagrams comparison.
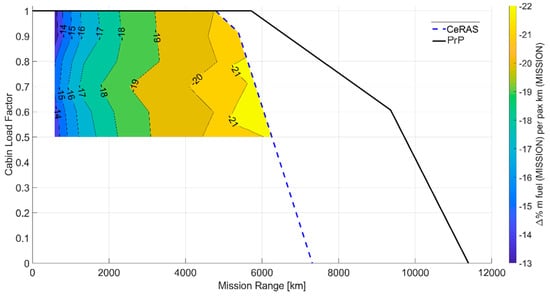
Figure 10.
PrP vs. CeRAS Comparison: percentage difference in fuel burnt per pax-km map for different Load Factor–Mission Range combinations.
In terms of alternative fuels, the large aerosol effects found in recent studies [14] encourages the desulfurization of jet fuels. While the introduction of biofuels is heavily connected with land-use concerns, liquid hydrogen may play a role if produced in a carbon-neutral way, but this demands the (r)evolution of the present energy economy [52].
Operative strategies can lead to counteracting effects. Reduced flight altitude may decrease some climate impacts related to O3, water vapor, and contrail formation, but with an increase of fuel consumption and thus the impact of fuel-proportional emissions [113]. Hence, it is again highlighted the importance of addressing all relevant climate agents, with the aim to properly assess mitigation scenarios [114]. Avoiding climate sensitive regions has a large potential in reducing climate impact and climate-optimal routing could be achieved, if market-based measures including non-CO2 effects were in force. However, the raising costs due to detours and off-design altitudes demands careful consideration [22].
Amongst the metrics available, GWPs and GTPs of regional aviation emissions identify the different impact associated to an equal emission occurring in different locations, providing a noteworthy tool to the policy makers. Different climate metrics express different aspects of the impact on climate; hence the overall climate target has to be addressed first [115]. It is then desirable that the metric is reliable across all climate-affecting sectors.
Notwithstanding the wide acknowledgement of non-CO2 aviation effects, they are still scarcely (or not at all) addressed in international agreements [14]. The EU Council’s intention to regulate the full climate impact of air transport must take into account the trade-off between CO2 and nitrogen oxides emission [41]. Indeed, improving the fuel performance of engines may reduce CO2, hydrocarbon, and carbon monoxide emissions, leading to an increase of combustor T and p, and thus of NOx production. On the opposite, reducing NOx through combustor modifications generally increases CO2 production. The existent literature suggests that a 2% fuel penalty would incur if nitrogen oxide production was reduced by 20% [116,117]. A more recent investigation fixed aviation carbon dioxide and nitrogen oxide emissions over a 100-year simulation, then the constant fuel use assumed was perturbed to reflect the variation in CO2 and NOx emissions. The linearity of the NOx–O3 and NOx–CH4 relationships in response to various background conditions was analyzed by the global chemistry transport model MOZART and the outcome of these model runs was used to develop a new non-linear NOx parametrization for the trade-off simulations, performed by simplified climate models. A 2% fuel (i.e., CO2) penalty has been associated to a more than 43% reduction of NOx emissions to accomplish an overall benefit [118].
Regarding how non-CO2 emissions could be included in international climate protocols from an economic prospect, the research project AviClim (Including Aviation in International Protocols for Climate Protection) identified four geopolitical scenarios, corresponding to different concerning for climate measures. The scenarios have been then associated to an ETS comprehensive of non-CO2 species, a climate tax, and a NOx emission fee combined with carbon dioxide trading and operational strategies. A global ETS including non-CO2 species has been recommended from both an economic (costs and impacts on competition) and environmental points of view [15].
4.4. Mass Production: Challenges
The mass production process of the PrandtlPlane still remains an unexplored field, as the assessment of serial production lines is an issue related to the individual industrial policy. Moreover, this topic is generally not conceived in aeronautical research. However, the macro-components of the aircraft (wings, fuselage, undercarriage, engines, moveable surfaces, fins) are not different from those of a conventional aircraft, as well as this, the assembly areas are not required to be larger than today. Hence, a preliminary analysis could exclude the major showstoppers related to the mass production of the PrP.
The aeromechanical characteristics of the PrandtlPlane have been preliminarily evaluated by means of predictive methods consolidated in the literature; subsequently, a radio-controlled flying model in dynamic scale has been built, and the flight qualities of the aircraft have been evaluated as a result of flight test campaigns [38]. The aerodynamics of the concept have again been evaluated by means of high-fidelity numerical aerodynamic analyses [112]; however, it has not yet been possible to perform wind tunnel tests, due to the limited availability and the high cost of transonic wind tunnels. A dynamically scaled flying model has also been built concerning the PARSIFAL PrandtlPlane (Figure S2). Flight tests on this model did not reveal any critical issues regarding the aeromechanics of the PrandtlPlane configuration and its flight qualities.
5. Conclusions
In agreement with Antoine de Saint Exupéry and the IPCC: ‘As for the future, it is not about predicting it, but about making it possible’ [119].
Within the project PARSIFAL we developed an innovative box-wing aircraft: the PrandtlPlane. Atmospheric emissions due to fuel burning have been estimated, and the corresponding impacts have been compared to those of a Boeing 737 in six different source regions in terms of GWP20, GWP100, GTP20, and GTP100. We considered CO2, carbonaceous and sulphate aerosols, impacts induced by nitrogen oxides on O3, CH4 and nitrate aerosols, contrails, and contrail cirrus. The introduction of the PrP is expected to bring a considerable reduction of climate change in all the source regions considered, on both the time-horizons examined. The development of a comprehensive Life Cycle Assessment on aircraft emissions will play a significant role in the definition of future impact reduction and mitigation strategies. Further research is recommended on contrails formation and development, as well as on the definition of the related metrics. Preliminary analysis of serial production lines will shed light on the mass production of the PrandtlPlane.
Supplementary Materials
The following are available online at https://www.mdpi.com/2071-1050/13/6/3282/s1.
Author Contributions
Conceptualization, A.L.T. and V.C.; methodology, software, validation, formal analysis, investigation, A.L.T., K.A.S., and V.C.; resources, V.C. and M.P.; data curation, A.L.T., K.A.S., and V.C.; writing—original draft preparation, writing—review and editing, visualization, A.L.T. and V.C.; supervision, V.C. and M.P.; project administration, V.C.; funding acquisition, V.C. All authors have read and agreed to the published version of the manuscript.
Funding
This paper concerns part of the investigation carried out within the research project PARSIFAL (“Prandtlplane ARchitecture for the Sustainable Improvement of Future AirpLanes”), funded by the European Union under the Horizon 2020 Research and Innovation Program (Grant Agreement n.723149).
Institutional Review Board Statement
Not applicable.
Informed Consent Statement
Not applicable.
Data Availability Statement
The data presented in this study are available in article.
Conflicts of Interest
The authors declare no conflict of interest.
Abbreviations
| AFR | air-to-fuel mass ratio |
| BC | black carbon |
| CFD | Computational Fluid Dynamics |
| EI | emission index |
| GTP | Global Temperature Potential |
| GWP | Global Warming Potential |
| HC | hydrocarbons |
| ICAO | International Civil Aviation Organization |
| LCA | Life Cycle Assessment |
| LTO | landing and takeoff |
| PRP | PrandtlPlane |
| RFI | Radiative Forcing Index |
References
- IPCC. Special Report: Global Warming of 1.5 °C. 2018. Available online: https://www.ipcc.ch/sr15/ (accessed on 16 May 2020).
- ICAO. 2019 Environmental Report. Available online: https://www.icao.int/environmental-protection/Pages/envrep2019.aspx (accessed on 16 May 2020).
- Lee, D.S.; Fahey, D.W.; Skowron, A.; Allen, M.R.; Burkhardt, U.; Chen, Q.; Doherty, S.J.; Freeman, S.; Forster, P.M.; Fuglestvedt, J.; et al. The contribution of global aviation to anthropogenic climate forcing for 2000 to 2018. Atmos. Environ. 2021, 244, 117834. [Google Scholar] [CrossRef]
- ICAO. Annual Report of the Council. 2018. Available online: https://www.icao.int/annual-report-2018/Pages/default.aspx (accessed on 16 May 2020).
- ICAO. Annual Report of the Council. 2014. Available online: https://www.icao.int/annual-report-2014/Pages/default.aspx (accessed on 16 May 2020).
- ICAO. Long Term Traffic Forecasts—Passengers and Cargo; ICAO: Quebec, QC, Canada, 2018. [Google Scholar]
- IPCC. Aviation and the Global Atmosphere; Cambridge University Press: Cambridge, UK, 1999. [Google Scholar]
- IPCC. Good Practice Guidance and Uncertainty Management in National Greenhouse Gas Inventories. 2000. Available online: https://www.ipcc-nggip.iges.or.jp/public/gp/english/ (accessed on 9 March 2020).
- Schaefer, M.; Bartosch, S. Overview on Fuel Flow Correlation Methods for the Calculation of NOx, CO and HC Emissions and Their Implementation into Aircraft Performance Software; Report Number: IB-325-11-13; Institut für Antriebstechnik: Köln, Germany, 2013. [Google Scholar]
- Penner, J. Carbonaceous Aerosols Influencing Atmospheric Radiation: Black and Organic Carbon; Lawrence Livermore National Lab.: Livermore, CA, USA, 1994.
- Dessens, O.; Köhler, M.O.; Rogers, H.L.; Jones, R.L.; Pyle, J.A. Aviation and climate change. Transp. Policy 2014, 34, 14–20. [Google Scholar] [CrossRef]
- Jungbluth, N.; Meili, C. Recommendations for calculation of the global warming potential of aviation including the radiative forcing index. Int. J. Life Cycle Assess. 2019, 24, 404–411. [Google Scholar] [CrossRef]
- Azar, C.; Johansson, D.J.A. Valuing the non-CO2 climate impacts of aviation. Clim. Chang. 2012, 111, 559–579. [Google Scholar] [CrossRef]
- Grewe, V.; Dahlmann, K.; Flink, J.; Frömming, C.; Ghosh, R.; Gierens, K.; Heller, R.; Hendricks, J.; Jöckel, P.; Kaufmann, S.; et al. Mitigating the Climate Impact from Aviation: Achievements and Results of the DLR WeCare Project. Aerospace 2017, 4, 34. [Google Scholar] [CrossRef]
- Scheelhaase, J.D.; Dahlmann, K.; Jung, M.; Keimel, H.; Nieße, H.; Sausen, R.; Schaefer, M.; Wolters, F. How to best address aviation’s full climate impact from an economic policy point of view?—Main results from AviClim research project. Transp. Res. Part D Transp. Environ. 2016, 45, 112–125. [Google Scholar] [CrossRef]
- Green, J.E. Air Travel—Greener by Design: Mitigating the Environmental Impact of Aviation: Opportunities and Priorities. Aeronaut. J. 2005, 109, 361–418. [Google Scholar]
- Creemers, W.; Slingerland, R. Impact of Intermediate Stops on Long-Range Jet-Transport Design. In Proceedings of the 7th AIAA ATIO Conf, 2nd CEIAT Int’l Conf on Innov and Integr in Aero Sciences, 17th LTA Systems Tech Conf; followed by 2nd TEOS Forum, Belfast, Northern Ireland, 18–20 September 2007. [Google Scholar]
- Poll, D.I.A. On the effect of stage length on the efficiency of air transport. Aeronaut. J. 2011, 115, 273–283. [Google Scholar] [CrossRef]
- Sausen, R.; Nodorp, D.; Land, C. Towards an optimal flight routing with respect to minimal environmental impact. In Impact of Emissions from Aircraft and Spacecraft upon the Atmosphere; Schumann, U., Wurzel, D., Eds.; DLR: Cologne, Germany, 1994; pp. 473–478. [Google Scholar]
- Mannstein, H.; Spichtinger, P.; Gierens, K. A note on how to avoid contrail cirrus. Transp. Res. Part D Transp. Environ. 2005, 10, 421–426. [Google Scholar] [CrossRef]
- Grewe, V.; Champougny, T.; Matthes, S.; Frömming, C.; Brinkop, S.; Søvde, O.A.; Irvine, E.A.; Halscheidt, L. Reduction of the air traffic’s contribution to climate change: A REACT4C case study. Atmos. Environ. 2014, 94, 616–625. [Google Scholar] [CrossRef]
- Lührs, B.; Linke, F.; Gollnick, V. Erweiterung eines Trajektorienrechners zur Nutzung Meteorologischer Daten für die Optimierung von Flugzeugtrajektorien; Deutsche Gesellschaft für Luft- und Raumfahrt (DGLR): Hamburg, Germany, 2014. [Google Scholar]
- Kyprianidis, K.G. Future Aero Engine Designs: An Evolving Vision. In Advances in Gas Turbine Technology; InTech: Vienna, Austria, 2011; pp. 3–24. [Google Scholar]
- Kyprianidis, K.G.; Dahlquist, E. On the trade-off between aviation NOx and energy efficiency. Appl. Energy 2017, 185, 1506–1516. [Google Scholar] [CrossRef]
- Papadopoulos, T.; Pilidis, P. Introduction of Intercooling in a High Bypass jet Engine; American Society of Mechanical Engineers: New York, NY, USA, 2000. [Google Scholar]
- Rolt, A.M.; Kyprianidis, K.G. Assessment of new aero engine core concepts and technologies in the EU framework 6 NEWAC programme. In Proceedings of the ICAS 2010 Congress Proceedings, Nice, France, 19–24 September 2010. [Google Scholar]
- Xu, L.; Grönstedt, T. Design and Analysis of an Intercooled Turbofan Engine. J. Eng. Gas Turbines Power 2010, 132. [Google Scholar] [CrossRef]
- Da Alves, M.A.; de Franca-Mendes-Carneiro, H.F.; Barbosa, J.R.; Travieso, L.E.; Pilidis, P.; Ramsden, K.W. An insight on intercooling and reheat gas turbine cycles. Proc. Inst. Mech. Eng. Part A J. Power Energy 2001, 215, 163–171. [Google Scholar] [CrossRef]
- Pellischek, G.; Kumpf, B. Compact heat exchanger technology for aero engines. In Proceedings of the 10th Symposium on Air Breathing Engines, Nottingham, UK, 1–6 September 1991. [Google Scholar]
- Xu, L.; Kyprianidis, K.G.; Grönstedt, T.U.J. Optimization Study of an Intercooled Recuperated Aero-Engine. J. Propuls. Power 2013, 29, 424–432. [Google Scholar] [CrossRef]
- McDonald, C.F.; Massardo, A.F.; Rodgers, C.; Stone, A. Recuperated gas turbine aeroengines. Part III: Engine concepts for reduced emissions, lower fuel consumption, and noise abatement. Aircr. Eng. Aerosp. Technol. 2008, 80, 408–426. [Google Scholar] [CrossRef]
- Rosskopf, M.; Lehner, S.; Gollnick, V. Economic–environmental trade-offs in long-term airline fleet planning. J. Air Transp. Manag. 2014, 34, 109–115. [Google Scholar] [CrossRef]
- European Commission. Flightpath 2050: Europe’s Vision for Aviation; European Commission: Brussels, Belgium, 2011. [Google Scholar]
- Apffelstaedt, A.; Langhans, S.; Gollnick, V. Identifying carbon dioxide reducing aircraft technologies and estimating their impact on global CO2 emissions. In Proceedings of the Deutscher Luft-und Raumfahrtkongress, Aachen, Germany, 8–10 September 2009. [Google Scholar]
- NACA. Induced Drag of Multiplanes; Technical Note 182, NACA: Washington, DC, USA, 1924. [Google Scholar]
- Frediani, A.; Montanari, G. Best wing system: An exact solution of the Prandtl’s problem. In Variational Analysis and Aerospace Engineering; Springer: New York, NY, USA, 2009; pp. 183–211. [Google Scholar]
- Frediani, A.; Cipolla, V.; Rizzo, E. The PrandtlPlane Configuration: Overview on Possible Applications to Civil Aviation. In Variational Analysis and Aerospace Engineering: Mathematical Challenges for Aerospace Design; Springer: New York, NY, USA, 2012; pp. 179–210. [Google Scholar]
- Frediani, A.; Cipolla, V.; Oliviero, F. Design of a prototype of light amphibious PrandtlPlane. In Proceedings of the 56th AIAA/ASCE/AHS/ASC Structures, Structural Dynamics, and Materials Conference, Kissimmee, FL, USA, 5–9 January 2015. [Google Scholar] [CrossRef]
- Dales, J.H. Pollution, Property & Prices: An Essay in Policy-Making and Economics; University of Toronto Press: Toronto, ON, Canada, 1968. [Google Scholar]
- Nordhaus, W. How fast should we graze the global commons. Am. Econ. Rev. 1982, 72, 242–246. [Google Scholar]
- Scheelhaase, J.D. How to regulate aviation’s full climate impact as intended by the EU council from 2020 onwards. J. Air Transp. Manag. 2019, 75, 68–74. [Google Scholar] [CrossRef]
- European Commission. EU Emissions Trading System (EU ETS). 2020. Available online: https://ec.europa.eu/clima/policies/ets_en (accessed on 5 May 2020).
- Anger, A.; Köhler, J. Including aviation emissions in the EU ETS: Much ado about nothing? A review. Transp. Policy 2010, 17, 38–46. [Google Scholar] [CrossRef]
- Council of the European Union. Directive EU 2008/101/EC; Council of the European Union: Brussels, Belgium, 2008.
- Council of the European Union. Directive 2009/29/EC; Council of the European Union: Brussels, Belgium, 2009.
- Council of the European Union. COM/2017/054 final; Council of the European Union: Brussels, Belgium, 2017.
- IPCC. Climate Change. The IPCC Impacts Assessment; IPCC: Paris, France, 1990. [Google Scholar]
- Shine, K.P.; Fuglestvedt, J.S.; Hailemariam, K.; Stuber, N. Alternatives to the Global Warming Potential for Comparing Climate Impacts of Emissions of Greenhouse Gases. Clim. Chang. 2005, 68, 281–302. [Google Scholar] [CrossRef]
- IPCC. Climate Change 2013: The Physical Science Basis. Contribution of Working Group I to the Fifth Assessment Report of the Intergovernmental Panel on Climate Change; Cambridge University Press: Cambridge, UK; New York, NY, USA, 2013. [Google Scholar]
- Solomon, S.; Manning, M.; Marquis, M.; Qin, D. Climate Change 2007: The Physical Science Basis. Contribution of Working Group I to the Fourth Assessment Report of the Intergovernmental Panel on Climate Change (IPCC); Cambridge University Press: Cambridge, UK; New York, NY, USA, 2007. [Google Scholar]
- Lee, D.S.; Fahey, D.W.; Forster, P.M.; Newton, P.J.; Wit, R.C.; Lim, L.L.; Owen, B.; Sausen, R. Aviation and global climate change in the 21st century. Atmos. Environ. 2009, 43, 3520–3537. [Google Scholar] [CrossRef]
- Lee, D.S.; Pitari, G.; Grewe, V.; Gierens, K.; Penner, J.E.; Petzold, A.; Prather, M.J.; Schumann, U.; Bais, A.; Berntsen, T.; et al. Transport impacts on atmosphere and climate: Aviation. Atmos. Environ. 2010, 44, 4678–4734. [Google Scholar] [CrossRef]
- Peters, G.P.; Aamaas, B.; Lund, M.T.; Solli, C.; Fuglestvedt, J.S. Alternative ‘Global Warming’ Metrics in Life Cycle Assessment: A Case Study with Existing Transportation Data. Environ. Sci. Technol. 2011, 45, 8633–8641. [Google Scholar] [CrossRef] [PubMed]
- Kollmuss, A.; Crimmins, A. Carbon Offsetting & Air Travel, Part 2: Non-CO2 Emissions Calculations, Stockholm. 2009. Available online: www.co2offsetresearch.org/PDF/SEI_Air_Travel_Emissions_Paper2_June_09.pdf (accessed on 2 March 2020).
- UBA. Klimawirksamkeit des Flugverkehrs: Aktueller Wissenschaftlicher Kenntnisstand Über Die Effekte des Flugverkehrs. Dessau, Germany. 2012. Available online: www.umweltbundesamt.de/klimaschutz/publikationen/klimawirksamkeit_des_flugverkehrs.pdf (accessed on 2 March 2020).
- Abrahamson, J.P.; Zelina, J.; Andac, M.G.; Wal, R.L.V. Predictive Model Development for Aviation Black Carbon Mass Emissions from Alternative and Conventional Fuels at Ground and Cruise. Environ. Sci. Technol. 2016, 50, 12048–12055. [Google Scholar] [CrossRef] [PubMed]
- Köhler, M.O.; Rädel, G.; Shine, K.P.; Rogers, H.L.; Pyle, J.A. Latitudinal variation of the effect of aviation NOx emissions on atmospheric ozone and methane and related climate metrics. Atmos. Environ. 2013, 64, 1–9. [Google Scholar] [CrossRef]
- Lund, M.T.; Aamaas, B.; Berntsen, T.; Bock, L.; Burkhardt, U.; Fuglestvedt, J.S.; Shine, K.P. Emission metrics for quantifying regional climate impacts of aviation. Earth Syst. Dyn. 2017, 8, 547–563. [Google Scholar] [CrossRef]
- PARSIFAL Project 2017–2020, Grant Agreement n. 723149. 2020. Available online: www.parsifalproject.eu (accessed on 4 July 2020).
- CERAS. CeRAS-CSR01: Short Range Reference Aircraft. 2015. Available online: http://ceras.ilr.rwth-aachen.de/trac/wiki/CeRAS/AircraftDesigns/CSR01 (accessed on 4 July 2020).
- ICAO. Airport Air Quality Manual; ICAO: Quebec, QC, Canada, 2011. [Google Scholar]
- ICAO. ICAO Aircraft Engine Emissions Databank. 2019. Available online: https://www.easa.europa.eu/easa-and-you/environment/icao-aircraft-engine-emissions-databank (accessed on 4 July 2020).
- Cipolla, V.; Frediani, A.; Salem, K.A.; Scardaoni, M.P.; Nuti, A.; Binante, V. Conceptual design of a box-wing aircraft for the air transport of the future. In Proceedings of the 2018 AIAA Aviation Technology, Integration, and Operations Conference, Atlanta, GA, USA, 25–29 June 2018. [Google Scholar] [CrossRef]
- Gierens, K.; Dilger, F. A climatology of formation conditions for aerodynamic contrails. Atmos. Chem. Phys. 2013, 13, 10847–10857. [Google Scholar] [CrossRef]
- Stettler, M.E.J.; Boies, A.M.; Petzold, A.; Barrett, S.R.H. Global civil aviation black carbon emissions. Environ. Sci. Technol. 2013, 47, 10397–10404. [Google Scholar] [CrossRef]
- Netherlands Aerospace Centre (NLR). Gas Turbine Simulation Program (GSP). 2020. Available online: www.gspteam.com (accessed on 4 July 2020).
- PARSIFAL Project Consortium. Definition of the Propulsion System for the PrandtlPlane and Steady State Performance Analysis; PARSIFAL Project Deliverable D7.1; European Commission: Luxembourg, 2020. [Google Scholar]
- Cipolla, V.; Salem, K.A.; Scardaoni, M.P.; Binante, V. Preliminary design and performance analysis of a box-wing transport aircraft. In Proceedings of the AIAA Scitech 2020 Forum, Orlando, FL, USA, 6–10 January 2020. [Google Scholar] [CrossRef]
- Joos, F.; Roth, R.; Fuglestvedt, J.S.; Peters, G.P.; Enting, I.G.; Bloh, W.V.; Brovkin, V.; Burke, E.J.; Eby, M.; Edwards, N.R.; et al. Carbon dioxide and climate impulse response functions for the computation of greenhouse gas metrics: A multi-model analysis. Atmos. Chem. Phys. 2013, 13, 2793–2825. [Google Scholar] [CrossRef]
- Samset, B.H.; Myhre, G. Vertical dependence of black carbon, sulphate and biomass burning aerosol radiative forcing. Geophys. Res. Lett. 2011, 38. [Google Scholar] [CrossRef]
- Myhre, G.; Karlsdóttir, S.; Isaksen, I.S.A.; Stordal, F. Radiative forcing due to changes in tropospheric ozone in the period 1980 to 1996. J. Geophys. Res. Atmos. 2000, 105, 28935–28942. [Google Scholar] [CrossRef]
- Holmes, C.D.; Prather, M.J.; Søvde, O.A.; Myhre, G. Future methane, hydroxyl, and their uncertainties: Key climate and emission parameters for future predictions. Atmos. Chem. Phys. 2013, 13, 285–302. [Google Scholar] [CrossRef]
- Wild, O.; Prather, M.J.; Akimoto, H. Indirect long-term global radiative cooling from NO x Emissions. Geophys. Res. Lett. 2001, 28, 1719–1722. [Google Scholar] [CrossRef]
- Myhre, G.; Nilsen, J.S.; Gulstad, L.; Shine, K.P.; Rognerud, B.; Isaksen, I.S.A. Radiative forcing due to stratospheric water vapour from CH4 oxidation. Geophys. Res. Lett. 2007, 34, L01807. [Google Scholar] [CrossRef]
- Bock, L.; Burkhardt, U. The temporal evolution of a long-lived contrail cirrus cluster: Simulations with a global climate model. J. Geophys. Res. Atmos. 2016, 121, 3548–3565. [Google Scholar] [CrossRef]
- Bock, L.; Burkhardt, U. Reassessing properties and radiative forcing of contrail cirrus using a climate model. J. Geophys. Res. Atmos. 2016, 121, 9717–9736. [Google Scholar] [CrossRef]
- Burkhardt, U.; Kärcher, B. Global radiative forcing from contrail cirrus. Nat. Clim. Chang. 2011, 1, 54–58. [Google Scholar] [CrossRef]
- Jaeglé, L.; Jacob, D.J.; Wang, Y.; Weinheimer, A.J.; Ridley, B.A.; Campos, T.L.; Sachse, G.W.; Hagen, D.E. Sources and chemistry of NO x in the upper troposphere over the United States. Geophys. Res. Lett. 1998, 25, 1705–1708. [Google Scholar] [CrossRef]
- Peck, J.; Oluwole, O.O.; Wong, H.-W.; Miake-Lye, R.C. An algorithm to estimate aircraft cruise black carbon emissions for use in developing a cruise emissions inventory. J. Air Waste Manage. Assoc. 2013, 63, 367–375. [Google Scholar] [CrossRef]
- Lohmann, U.; Feichter, J. Global indirect aerosol effects: A review. Atmos. Chem. Phys. 2005, 5, 715–737. [Google Scholar] [CrossRef]
- Haywood, J.M.; Shine, K.P. The effect of anthropogenic sulfate and soot aerosol on the clear sky planetary radiation budget. Geophys. Res. Lett. 1995, 22, 603–606. [Google Scholar] [CrossRef]
- Kärcher, B.; Peter, T.; Biermann, U.M.; Schumann, U. The Initial Composition of Jet Condensation Trails. J. Atmos. Sci. 1996, 53, 3066–3083. [Google Scholar] [CrossRef]
- Heymsfield, A.J.; Lawson, R.P.; Sachse, G.W. Growth of ice crystals in a precipitating contrail. Geophys. Res. Lett. 1998, 25, 1335–1338. [Google Scholar] [CrossRef]
- Righi, M.; Hendricks, J.; Sausen, R. The global impact of the transport sectors on atmospheric aerosol: Simulations for year 2000 emissions. Atmos. Chem. Phys. 2013, 13, 9939–9970. [Google Scholar] [CrossRef]
- Shindell, D.T.; Faluvegi, G.; Koch, D.M.; Schmidt, G.A.; Unger, N.; Bauer, S.E. Improved Attribution of Climate Forcing to Emissions. Science 2009, 326, 716–718. [Google Scholar] [CrossRef]
- Grewe, V.; Stenke, A. AirClim: An efficient tool for climate evaluation of aircraft technology. Atmos. Chem. Phys. 2008, 8, 4621–4639. [Google Scholar] [CrossRef]
- Köhler, M.O.; Rädel, G.; Dessens, O.; Shine, K.P.; Rogers, H.L.; Wild, O.; Pyle, J.A. Impact of perturbations to nitrogen oxide emissions from global aviation. J. Geophys. Res. 2008, 113, D11305. [Google Scholar] [CrossRef]
- Stevenson, D.S. Radiative forcing from aircraft NO x emissions: Mechanisms and seasonal dependence. J. Geophys. Res. 2004, 109, D17307. [Google Scholar] [CrossRef]
- Stevenson, D.S.; Derwent, R.G. Does the location of aircraft nitrogen oxide emissions affect their climate impact? Geophys. Res. Lett. 2009, 36, L17810. [Google Scholar] [CrossRef]
- Sausen, R.; Gierens, K.; Ponater, M.; Schumann, U. A Diagnostic Study of the Global Distribution of Contrails Part I: Present Day Climate ast. Theor. Appl. Climatol. 1998, 61, 127–141. [Google Scholar] [CrossRef]
- Newinger, C.; Burkhardt, U. Sensitivity of contrail cirrus radiative forcing to air traffic scheduling. J. Geophys. Res. Atmos. 2012, 117. [Google Scholar] [CrossRef]
- Vázquez-Navarro, M.; Mannstein, H.; Kox, S. Contrail life cycle and properties from 1 year of MSG/SEVIRI rapid-scan images. Atmos. Chem. Phys. 2015, 15, 8739–8749. [Google Scholar] [CrossRef]
- Meerkötter, R.; Schumann, U.; Doelling, D.R.; Minnis, P.; Nakajima, T.; Tsushima, Y. Radiative forcing by contrails. Ann. Geophys. 1999, 17, 1080–1094. [Google Scholar] [CrossRef]
- Irvine, E.A.; Shine, K.P. Ice supersaturation and the potential for contrail formation in a changing climate. Earth Syst. Dyn. 2015, 6, 555–568. [Google Scholar] [CrossRef]
- ICAO. Airport Air Quality Guidance Manual; ICAO: Montreal, QC, Canada, 2011. [Google Scholar]
- Döpelheuer, A.; Lecht, M. Influence of engine performance on emission characteristics. In Gas Turbine Engine Combustion, Emissions and Alternative Fuels; CRC Press: Boca Raton, FL, USA, 1998. [Google Scholar]
- Speth, R.L.; Rojo, C.; Malina, R.; Barrett, S.R.H. Black carbon emissions reductions from combustion of alternative jet fuels. Atmos. Environ. 2015, 105, 37–42. [Google Scholar] [CrossRef]
- Schumann, U. AERONOX/The Impact of NOx Emissions from Aircraft Upon the Atmosphere at Flight Altitudes 8–15 km; Final Report to the Commission of European Communities; Institute of Atmospheric Physics: Oberpfaffenhofen, Germany, 1995. [Google Scholar]
- Norman, P.D.; Lister, D.H.; Lecht, M.; Madden, P.; Park, K.; Penanhoat, O. Development of the Technical Basis for a New Emissions Parameter Covering the Whole AIRcraft Operation: NEPAIR; Final Technical Report; EU Publications Office: Luxembourg, 2003. [Google Scholar]
- Deidewig, F.; Döpelheuer, A.; Lecht, M. Methods to Assess Aircraft Engine Emissions in Flight. ICAS Proc. 1996, 20, 131–141. [Google Scholar]
- Baughcum, S.L.; Tritz, T.G.; Henderson, S.C.; Pickett, D.C. Scheduled Civil Analysis, Aircraft Emission Inventories for 1992: Database Development and NASA Contractor Report 4700; NASA: Washington, DC, USA, 1996.
- Martin, R.L.; Oncina, C.H.; Zeeben, P.J. A Simplified Method for Estimating Aircraft Engine Emissions. ICAO/CAEP/Working Group 3, Certification Subgroup, March 1995. Reported as ‘Boeing Method 2’ Fuel Flow Methodology Description in Appendix D of “Scheduled Civil Aircraft Emission Inventories f, 1996. Available online: https://ntrs.nasa.gov/search.jsp?R=19960038445 (accessed on 4 July 2020).
- Masiol, M.; Harrison, R.M. Aircraft engine exhaust emissions and other airport-related contributions to ambient air pollution: A review. Atmos. Environ. 2014, 95, 409–455. [Google Scholar] [CrossRef]
- Fahey, D.W.; Lee, D.S. Aviation and the Impacts of Climate Change Aviation and Climate Change: A Scientific Perspective. Carbon Clim. Law Rev. 2016, 10, 97–104. [Google Scholar]
- Turgut, E.T.; Cavcar, M.; Usanmaz, O.; Yay, O.D.; Dogeroglu, T.; Armutlu, K. Investigating actual landing and takeoff operations for time-in-mode, fuel and emissions parameters on domestic routes in Turkey. Transp. Res. Part D Transp. Environ. 2017, 53, 249–262. [Google Scholar] [CrossRef]
- Skowron, A.; Lee, D.S.; de León, R.R. The assessment of the impact of aviation NOx on ozone and other radiative forcing responses—The importance of representing cruise altitudes accurately. Atmos. Environ. 2013, 74, 159–168. [Google Scholar] [CrossRef]
- Myhre, G.; Shine, K.P.; Rädel, G.; Gauss, M.; Isaksen, I.S.A.; Tang, Q.; Prather, M.J.; Williams, J.E.; van Velthoven, P.; Dessens, O.; et al. Radiative forcing due to changes in ozone and methane caused by the transport sector. Atmos. Environ. 2011, 45, 387–394. [Google Scholar] [CrossRef]
- Fuglestvedt, J.S.; Shine, K.P.; Berntsen, T.; Cook, J.; Lee, D.S.; Stenke, A.; Skeie, R.B.; Velders, G.J.M.; Waitz, I.A. Transport impacts on atmosphere and climate: Metrics. Atmos. Environ. 2010, 44, 4648–4677. [Google Scholar] [CrossRef]
- Schulz, M.; Textor, C.; Kinne, S.; Balkanski, Y.; Bauer, S.; Berntsen, T.; Boucher, O.; Dentener, F.; Guibert, S.; Isaksen, I.S.A.; et al. Radiative forcing by aerosols as derived from the AeroCom present-day and pre-industrial simulations. Atmos. Chem. Phys. 2006, 6, 5225–5246. [Google Scholar] [CrossRef]
- Frediani, A.; Cipolla, V.; Salem, K.A.; Binante, V.; Scardaoni, M.P. Conceptual design of PrandtlPlane civil transport aircraft. Proc. Inst. Mech. Eng. Part G J. Aerosp. Eng. 2019. [Google Scholar] [CrossRef]
- PARSIFAL Project Consortium. PrandtlPlane Performance Analysis and Scaling Procedures, PARSIFAL Project Deliverable, D 3.4; European Commission: Luxembourg, 2020; CORDIS Website; Available online: https://cordis.europa.eu/project/id/723149/results (accessed on 4 March 2021).
- Carini, M.; Meheut, M.; Kanellopoulos, S.; Cipolla, V.; Salem, K.A. Aerodynamic analysis and optimization of a boxwing architecture for commercial airplanes. In Proceedings of the AIAA Scitech 2020 Forum, Orlando, FL, USA, 6–10 January 2020. [Google Scholar] [CrossRef]
- Frömming, C.; Ponater, M.; Dahlmann, K.; Grewe, V.; Lee, D.S.; Sausen, R. Aviation-induced radiative forcing and surface temperature change in dependency of the emission altitude. J. Geophys. Res. Atmos. 2012, 117. [Google Scholar] [CrossRef]
- Dahlmann, K.; Grewe, V.; Frömming, C.; Burkhardt, U. Can we reliably assess climate mitigation options for air traffic scenarios despite large uncertainties in atmospheric processes? Transp. Res. Part D Transp. Environ. 2016, 46, 40–55. [Google Scholar] [CrossRef]
- Grewe, V.; Dahlmann, K. How ambiguous are climate metrics? And are we prepared to assess and compare the climate impact of new air traffic technologies? Atmos. Environ. 2015, 106, 373–374. [Google Scholar] [CrossRef]
- Faber, J.; Greenwood, D.; Lee, D.; Mann, M.; de Leon, P.M.; Nelissen, D.; Owen, B.; Ralph, M.; Tilston, J.; van Velzen, A.; et al. Lower NOx at Higher Altitudes. Policies to Reduce the Climate Impact of Aviation NOx Emission; CE: Delft, The Netherlands, 2008. [Google Scholar]
- ICAO. ICAO Environmental Report 2010; ICAO: Montreal, QC, Canada, 2010. [Google Scholar]
- Freeman, S.; Lee, D.S.; Lim, L.L.; Skowron, A.; de León, R.R. Trading off Aircraft Fuel Burn and NO x Emissions for Optimal Climate Policy. Environ. Sci. Technol. 2018, 52, 2498–2505. [Google Scholar] [CrossRef]
- de Saint-Exupéry, A. Citadelle; ACT: Moscow, Russia, 1948. [Google Scholar]
Publisher’s Note: MDPI stays neutral with regard to jurisdictional claims in published maps and institutional affiliations. |
© 2021 by the authors. Licensee MDPI, Basel, Switzerland. This article is an open access article distributed under the terms and conditions of the Creative Commons Attribution (CC BY) license (http://creativecommons.org/licenses/by/4.0/).

