Article

The Oxidative Process of Acarbose, Maysin, and Luteolin with Maltase-Glucoamylase: Molecular Docking and Molecular Dynamics Study

by
Linda-Lucila Landeros-Martínez
1,
Néstor Gutiérrez-Méndez
1,
Juan Pedro Palomares-Báez
1,
Nora-Aydeé Sánchez-Bojorge
1,
Juan Pablo Flores-De los Ríos
2,
Hilda Amelia Piñón-Castillo
1,
Marco Antonio Chávez-Rojo
1 and
Luz-María Rodríguez-Valdez
1,*
1
Facultad de Ciencias Químicas, Universidad Autónoma de Chihuahua, Chihuahua 31125, Mexico
2
Facultad de Ingeniería, Universidad Autónoma de Chihuahua, Chihuahua 31125, Mexico
*
Author to whom correspondence should be addressed.
Appl. Sci. 2021, 11(9), 4067; https://doi.org/10.3390/app11094067
Submission received: 29 March 2021 / Revised: 24 April 2021 / Accepted: 26 April 2021 / Published: 29 April 2021
(This article belongs to the Special Issue The Application of Quantum Mechanics in Reactivity of Molecules II)

Abstract

:
Type 2 diabetes mellitus has been classified as the epidemic of the XXI century, making it a global health challenge. Currently, the commonly used treatment for this disease is acarbose, however, the high cost of this medicine has motivated the search for new alternatives. In this work, the maysin, a characteristic flavonoid from maize inflorescences, and its aglycon version, luteolin, are proposed as acarbose substitutes. For this, a theoretical comparative analysis was conducted on the molecular interactions of acarbose, maysin, and luteolin with human maltase-glucoamylase (NtMGAM), as well as their oxidative process. The binding energies in the active site of NtMGAM with acarbose, maysin, and luteolin molecules were predicted using a molecular docking approach applying the Lamarckian genetic algorithm method. Theoretical chemical reactivity parameters such as chemical hardness (η) and chemical potential (µ) of the acarbose, maysin, and luteolin molecules, as well as of the amino acids involved in the active site, were calculated using the electronic structure method called Density Functional Theory (DFT), employing the M06 meta-GGA functional in combination with the 6-31G(d) basis set. Furthermore, a possible oxidative process has been proposed from quantum-chemical calculations of the electronic charge transfer values (ΔN), between the amino acids of the active site and the acarbose, maysin, and luteolin. Molecular docking predictions were complemented with molecular dynamics simulations. Hence, it was demonstrated that the solvation of the protein affects the affinity order between NtMGAM and ligands.

1. Introduction

Type 2 diabetes mellitus has increased all over the world. This sickness is the result of the interaction between a genetic predisposition, and behavioral and environmental risk factors [1]. This disease is treated with different drugs, acarbose (ACA) being one of them. ACA is a pseudotetrasaccharide and inhibitor of α-glucosidase [2], which is attached to α-glucosidases associated with the brush-border membrane of the small intestine which is responsible for the digestion of complex polysaccharides and sucrose [3,4]. In addition to its side effects as flatulence and diarrhea [5], another disadvantage of the ACA is the high cost in the market. According to the World Health Organization, the ACA has a price between 81 to 302 USD per patient [6]. Moreover, the maysin (MAY) is a glycosylated flavonoid characteristic of female corn inflorescences [7]. MAY contains a luteolin molecule (LUT) attached to a disaccharide moiety, and it is known as a flavonoid compound containing a structure of the C-5 and C-7 hydroxyl groups in A ring [8]. Moreover, it has been reported that the LUT molecule by itself acts as an inhibitor of α-glucosidases [9,10]. See Scheme 1.
Some experimental works reported the effects of phenolic compounds extracted from corn silk in combination with acarbose. They showed additive inhibition of α-amylase at lower concentrations and antagonistic inhibition at a higher concentration of these compounds [11]. Tadera et al. showed that luteolin, myricetin, and quercetin were potent inhibitors against porcine pancreatic α-amylase and that the strength of inhibition was correlated with the number of hydroxyl groups on the B ring of the flavonoid scaffold [12]. Furthermore, Jia et al. characterized and studied the antioxidant activity, as well as the α-glucosidase inhibition activity of corn silk polysaccharides obtained by different extraction methods [13]. In the same vein, Alvarado-Díaz et al. determined the composition of phenolic extracts from maize silks by thin-layer chromatography (TLC) [14]. After this characterization, it was possible to define the main phenolic compounds and the concentration required to decrease the specific activity of α-glucosidases by 50% (IC50). The concentration of total polyphenols was similar in all the maize silk extracts analyzed. Flavonoids and anthocyanins concentration was higher in the extracts from color pink-red, dark-red, and light brown maize silks. TLC analysis revealed the presence of phenolic acids such as caffeic, ferulic, and sinapic acids, and also several flavonoid glycosides such as quercetin, kaempferol, isorhamnetin, apigenin, and luteolin were found [14].
On the other hand, it is well known that theoretical studies are essential to provide information about the molecular structure [15], chemical reactivity [16,17], electronic properties [18], and structure-activity relationships [19,20], among other interesting molecular properties. This information allows us to determine possible interactions between the molecules under study with other chemical species [21]. In this direction, molecular docking is used for the prediction of the union affinity between the macromolecule (enzyme) and small molecules (ligands) [22], and it serves as a guide to identifying the preferred orientation of one molecule relative to another [23]. In addition, since molecular recognition plays a crucial role in promoting fundamental biomolecular events, such as enzyme–substrate, drug–protein, and drug–nucleic acid interactions, molecular docking calculations are widely used in drug design [24]. Complementary, molecular dynamics (MD) simulations have been used in the modeling of ACA-amylomaltase interactions, where the complex reveals the influence of several amino acids in the enzymatic synthesis of cicloamyloses [25]. In this sense, MD simulations give insight into the mechanism of action of new ligands and can provide a new direction for future designs of more effective inhibitors [26,27,28]. Furthermore, theoretical studies using the Density Functional Theory (DFT) have reported the antibacterial activity of the hydrozone and acarbose ligand [29] based on molecular structure, electronic properties, and spectral analysis of the acarbose and malonamide derivatives [30].
The aim of this work is to determine by DFT calculations, molecular docking, and molecular dynamics, all those molecular properties that allow us to predict the binding activity of the human intestinal maltase-glucoamylase N-terminal (NtMGAM) with the new ligands. One of the most important contributions of this work is the proposed sequence of theoretical calculations for future research with similar systems. This sequence involves the next steps:
(1)
DFT calculations, which provide useful information about the chemical reactivity of the molecules and the most suitable areas for nucleophilic and electrophilic attacks;
(2)
Molinspiration Cheminformatics for the calculations of the polar surface area and the octanol-water partition coefficient (logP) values;
(3)
Molecular docking calculations, which determine the most favorable position of interaction between a ligand and a macromolecule by the binding energy;
(4)
Molecular dynamics calculations, for measuring the stability of the binding between these molecules, considering several contributions such as solvents, electrostatic energy, and temperature.
The results obtained with this sequence allowed for defining the oxidative damage between the amino acids of the active site and the new alternatives of treatment (maysin and luteolin) and comparing these to acarbose. Another important property determined in this work was the molecular polar surface area (PSA) and logP values, which quantifies the permeability in cells, thus, it could be taken as a measure of intestinal absorption of the maysin and luteolin. Besides, the Lipinski rule was used for the determination of the highest absorption and permeability in the active site of maltase-glucoamylase (MGA) in the presence of maysin and luteolin. This theoretical study could be a reference in the interpretation of the experimental results as those obtained by our research group in the work about the inhibitory effect of saccharides and phenolic compounds from maize silks on intestinal alpha-glucosidases [14], and a study comparative of different naturals compounds, such as quercitin, tetroconasol, and acarbose. These molecules showed high binding ability towards α-amylase and α-glucosidase [31]. Finally, a comparative binding site analysis of two proteins (human neutral alpha-glucosidase and maltase-glucoamylase) indicated that the active site residues are more or less conserved, based on the docked ACA [32].

2. Computational Details

2.1. Quantum-Chemical Calculations

The optimized structures of MAY, LUT, and ACA were calculated with the hybrid meta-GGA M06 density functional [33,34] combined with the 6-31G(d) basis set [35]. The solvation method of the conductor-like polarizable continuum model (CPCM) [36] was used for calculations in the aqueous phase. All calculations were performed in Gaussian09 [37]. The charge distribution of the amino acids and the new alternatives of treatments were obtained with the population analysis of Hirshfeld [38].
Density functional methodology was used to obtain the frontier molecular orbitals: the Highest Occupied Molecular Orbital (HOMO) and the Lower Unoccupied Molecular Orbital (LUMO), of each ligand (ACA, MAY, and LUT). This methodology provides an excellent framework to define a set of known chemical concepts, in particular, ionization potential (IP) [39,40] and electron affinity (EA) [39,40], which were calculated by the energy difference E(N)-E(N−1) and E(N)-E(N+1), respectively, where N indicates the neutral molecule and N−1 and N+1 correspond to the cation and anion radicals generated after electron transfer. Once the IP and EA were obtained, additional reactivity parameters were calculated, such as chemical hardness (η) [41,42], electronegativity (χ) [40,41], electrophilicity (ω) [43], and chemical potential (μ) [44]. These reactivity parameters are defined as:
η = 1 2 I P E A
χ = μ = 1 2 I P + E A
ω = μ 2 2 η
The overall interactions between the ACA, MAY, and LUT with the amino acids involved in the active site of maltase-glucoamylase (NtMGAM) were quantified through the charge transfer between the chemical species. This parameter determines the behavior of different molecular systems as an electron donor or acceptor. In this case, it is referred to as the electron transfer from the ligands to the amino acids of the active site of NtMGAM or vice versa. The global interactions between ligands and protein were estimated using the charge transfer parameter (ΔN) [45,46], which is given by:
Δ N = μ B μ A 2   η B η A
The molecular polar surface area (PSA) and octanol-water partition coefficient (logP) were obtained through Molinspiration, a free software readily available on the Web [47]. SMILES (Simplified Molecular Input Line System) was used for the PSA and logP prediction in the ACA, MAY, and LUT. This software is a chemical notation system designed for modern chemical information processing [48].

2.2. Molecular Docking Calculations

The crystal structure of NtMGAM was obtained from the Protein Data Bank (http://www.rcsb.org, accessed on 28 April 2021) PDB: 2QMJ. The molecular docking was calculated with the AutoDock Vina software with the Genetic Algorithm [28]. This analysis was used to explore the molecular interactions between MGA with the ligands ACA, MAY, and LUT. The water molecules in the protein were eliminated and only the H-atoms polar were added. The docking area is a cubic box of 26 Å of length centered at the active site.

2.3. Molecular Dynamics

Molecular dynamics were used to study the stability of the protein-ligand complexes. Molecular docking results were taken as the input structures for the simulations. Molecular dynamics simulations were performed using the CHARMM36 force field [49] and the NAMD software [50]. The resulting structures from the docking process were taken as the starting point for the simulation. Missing residues of the PDB: 2QMJ file were added using MODELLER [51]. Only these residues were relaxed while the rest of the atomic positions remained intact. The force field parameters for the ligands were built with the ACPYPE program, this is a tool based on Python to use ANTECHAMBER, in order to generate topologies for chemical compounds for a variety of molecular dynamics programs, including CHARMM [52,53]. Geometry optimization and charges were obtained using SQM (part of the AmberTools [54]) with the SCC-DFTB Hamiltonian [55].
The protein-ligand systems were solvated (TIP3P water model) in a box with periodic boundary conditions extended to 20 Angstrom in each direction. Appropriate amounts of Na+ and Cl− ions were added to neutralize the charge using VMD [56]. Energy minimization was then carried out using the conjugate gradient algorithm during 20,000 steps. After minimization, the systems were heated to 300 K during 500 ps in the NVT ensemble. Finally, the systems were maintained at 300 K and 1 atm during 150 ns using the Langevin piston Nose-Hoover method [57,58]. Smooth Particle Mesh Ewald (PME) protocol was used for the long-range electrostatic interactions [59]. All the MD simulations were carried out using a 1 femtosecond time step, a 10 Å cutoff for non-bonded interactions, and the SHAKE algorithm turned off. Visualization and analysis were performed using VMD. The evaluation of the root-mean-squared deviation (RMSD), distribution of distances from some protein residues to the ligands, and the hydrogen bond analysis during the simulation, were carried out also using VMD. In order to evaluate all the molecular properties of interest over a representative statistical sample, coordinates and velocities were recorded every 4000 configurations, corresponding to 4 ps. Then, averages and time evolution of properties reported here were calculated in the aforementioned snapshots.

2.4. Binding Free Energy Calculations

In the present work, the binding free energy was calculated employing the Molecular Mechanics-Poisson Boltzmann Surface Area (MM-PBSA) method, originally developed by Kollman [58]. In this method, the binding free energy between a protein and a ligand is estimated from the following contributions,
G b i n d = G P L G P G L
where GPL, GP, and GL referred to the protein-ligand, protein, and ligand-free energies, respectively. The free energy of each contribution is estimated by the following sum:
G = E M M + G s o l v + G n p T S M M
In this expression, E M M is the standard Molecular Mechanics energy, namely, the sum of all the contributions to the internal energy of the molecule (bonded terms, electrostatic and Van der Waals interactions); G s o l v is the polar solvation energy of the molecule, obtained from the solution of the Poisson−Boltzmann (PB) equation (in this work, calculated using the APBS [60] package); G n p is the nonpolar solvation energy, estimated from the solvent-accessible surface area of the molecule (calculated using VMD), and, the last term is composed by the temperature T times the entropy contribution (normally obtained from a normal-mode calculation of the harmonic frequencies at the MM level). The last term was ignored in this study due to the well-known fact that normal mode analysis calculations are computationally expensive, and it tends to introduce significant uncertainty in the final results [61]. The brackets in Equation (6) represent the ensemble averages, which are obtained from a given number of molecular dynamics snapshots (200 in this study).
For practical reasons, all the terms were calculated from a single MD simulation corresponding to the protein-ligand complex, where the same geometry was used for all three systems (complex, ligand, and receptor). In this study, the total binding free energy was calculated using the CaFE [62] VMD plugin. For the PB part, CaFE used the APBS program with the following parameters: 1.0 and 80.0 for the internal and external dielectric constants, respectively, mdh (multiple Debye-Hückel model) for the boundary conditions, and the spl2 (cubic B-spline) method to map atomic partial charges onto grid points.

3. Results and Discussion

3.1. Geometry Optimization

Geometry optimization and frequency calculation for ACA, MAY, and LUT were performed in order to analyze their properties at the lowest energy configuration. The optimized geometries shown in Figure 1 were obtained by the M06/6-31G(d) methodology. Along with the properties regarding molecular geometry, the Fukui functions (FF) have been successfully used in studies on site selectivity in molecules [29]. The susceptibility to an electrophilic and nucleophilic attack in the atoms can be explained by these entities (FF). This information could be used in future work for the application of carrier vehicles with the studied molecules. The analysis of the FF values must be complemented with the examination of the torsion angles of each ligand. These dihedral angles can exhibit possible steric impediments that ligands could have within the active site of the maltase-glucoamylase (NtMGAM). Furthermore, the lowest unoccupied molecular orbital (LUMO) and the highest occupied molecular orbital (HOMO) were used to identify the pharmacophore of the ACA, MAY, and LUT.
As can be observed in Figure 1A, the ACA geometry is non-planar due to the four torsion angles present in the structure, which are C23-N26-C1-C6 with −107.06°, H78-N26-C1-C44 with −5.93°, and C2-O28-C24-C16 with 105.64°. Additionally, in the opposite extreme of the molecule, the dihedral angle is formed among O29-C3-C25-C17 with a value of 105.49°. These dihedral angles are related to the steric impediment of the cyclohexane and saccharide moieties present in the ACA ligand, affecting the binding energy with the active site of the NtMGAM. Likewise, the electrophilic and nucleophilic attack sites were determined through the FF, which were calculated in a minimum energy state of the ACA. According to FF, the most susceptible site for an electrophilic attack is located on the N26 atom that corresponds to the secondary amine of the ACA, and the nucleophilic attack site is on the C22 atom of the cyclohexane unit (Figure 1A).
A non-planar geometry was obtained for the MAY molecule, mainly in the ketofucosyl moiety, which showed a dihedral angle of 92.80° for O57-C51-C5-C3. While for the L-rhamnosyl, the torsion angle regarding C52-O67-C31-C32 registered 58.79°. Moreover, in the opposite extreme of the structure, a dihedral angle is formed between O8-C15-C16-C21 atoms with a value of −178.98°. The dihedral angles obtained in ketofucosyl and L-rhamnosyl groups increased the rotational degrees of the MAY molecule. According to FF the most susceptible site for an electrophilic attack is the C17 atom which is located in the B ring, and the nucleophilic attack is for the C13 atom of the C ring (Figure 1B).
The LUT molecule exhibited a planar geometry with dihedral angles very close to +/−180°, except the O8-C15-C16-C21 angle which is equal to −8.87°. For this molecule, only the B ring presented rotational degrees relative to the A–C rings. Additionally, FF values determined the most susceptible site for an electrophilic attack, which is the C14 atom which corresponds to the double bond C=C in the C ring, while the nucleophilic attack is in the O6 atom which belongs to the oxo group located in the same ring (Figure 1C).

3.2. Frontier Molecular Orbitals and Electrostatic Potential Surface (EPS)

Molecular orbital analysis of HOMO and LUMO of the ACA, MAY, and LUT were carried out to identify regions of high electron density. These regions are known as pharmacophores, which interact with the active site in a macromolecule. Figure 2 shows the HOMO and LUMO orbitals for the ACA, MAY, and LUT. In the ACA molecule, it was observed that the electronic density of both HOMO and LUMO orbitals were located in the same functional groups (cyclohexane and amino), defining this zone as the pharmacophore of the ACA ligand, which could interact in the active site of the NtMGAM. In the MAY ligand (Figure 2B), the most electron-saturated zone was the HOMO orbital which is located in the ketofucosyl moiety, while the LUMO orbital was located in both groups, the ketofucosyl and throughout the flavonoid luteolin. For this reason, the ketofucosyl moiety was considered as the pharmacophore of the MAY. In addition, in the LUT ligand, the HOMO and LUMO orbitals are distributed throughout all the structures due to the aromatic rings of the molecule, the latter indicates that the whole structure of LUT could interact with the active site of the NtMGAM. This study was also used to explain which zone of the ligands has the recognition ability in the NtMGAM.
In addition, a critical parameter for drug design is the electrostatic potential surface (EPS) [63]. EPS maps can be employed in the binding sites analysis, focused on the mechanism of recognition of one molecule by another. EPS maps in Figure 3 show the distribution of the electron density in the ligands, which allows the analysis of molecular interactions between ligands and the amino acids present in the active site of the NtMGAM. The electron density surface is colored according to the values of the electrostatic potential in the ligands. Therefore, areas where the molecules can act as an acceptor or donor of hydrogen are plotted in red and blue, respectively.
As can be observed, the regions with hydrogen donor behavior (blue) are the oligosaccharide and the cyclohexane units of the ACA, as well as the hydroxyl groups. Similarly, in the MAY molecule, the hydroxyl groups are the hydrogen donor zones (blue), while the hydrogen acceptor zone (red) is mainly located at the oxo group of the luteolin ring. The hydroxyl groups along the structure of the LUT presented a hydrogen donor behavior; whereas the oxo group of the C ring can be identified as a hydrogen acceptor.

3.3. Polar Surface Area (PSA) and LogP

Polar surface area (PSA) and octanol-water partition coefficient (logP) are essential parameters used in the prediction of ligands bioavailability. PSA is a useful parameter that has been shown to provide excellent correlation with intestinal absorption, blood-brain barrier penetration, and several other drug transport properties [64]. The PSA is obtained with the sum of the surface corresponding to all the polar atoms, specifically oxygen, nitrogen, and hydrogen attached to the molecules [64]. Molecules with PSA values greater than 140 Å2 are poorly absorbed in cell membranes, while those with values less than 90 Å2 are completely absorbed [64]. The SMILE codes for each ligands are ACA: C1OC(OC2C(O)C(O)C(OC2CO)OC3C(O)C(O)C(O)OC3CO)C(O)C(O)C1NC4, MAY: CC1OC(OC2C(O)C(=O) C(C)OC2C3C(O)CC4=C(C3O) C(=O) C=C(O4) C5CCC(O)C(=C5) O) C(O)C(O)C1O and LUT: OC1=CC(=C2C(=O) C=C(OC2=C1) C3=CC(=C(O)C=C3) O) O. PSA value for the studied ligands were 321.16 Å2 for ACA, 236.81 Å2 for MAY, and 111.12 Å2 for LUT. The analysis of PSA values allows us to predict good intestinal absorption for the LUT, on the opposite, for ACA and MAY, we can suggest that intestinal absorption could be limited according to the PSA values obtained.
Additionally, theoretically predicted values of octanol/water partition coefficient (logP) have been used for the estimation of molecular transport properties, molecular hydrophobicity, intestinal absorption, and blood-brain barrier penetration. The logP is one of the key factors that accelerates the process of drug discovery and development [65,66]. It has been reported that molecules with logP values between −2 < logP < 5 have proper intestinal absorption, bioavailability, and hydrophobicity [67]. The results of logP for ACA, MAY, and LUT were −5.51, −2.84, and 1.97, respectively. Based on these results, only LUT presented a logP value within the established range; which indicates that this molecule could present a major intestinal absorption when compared with ACA and MAY.

3.4. Molecular Docking Analysis between Ligands (ACA, MAY, and LUT) with Maltase-Glucoamylase (MGA)

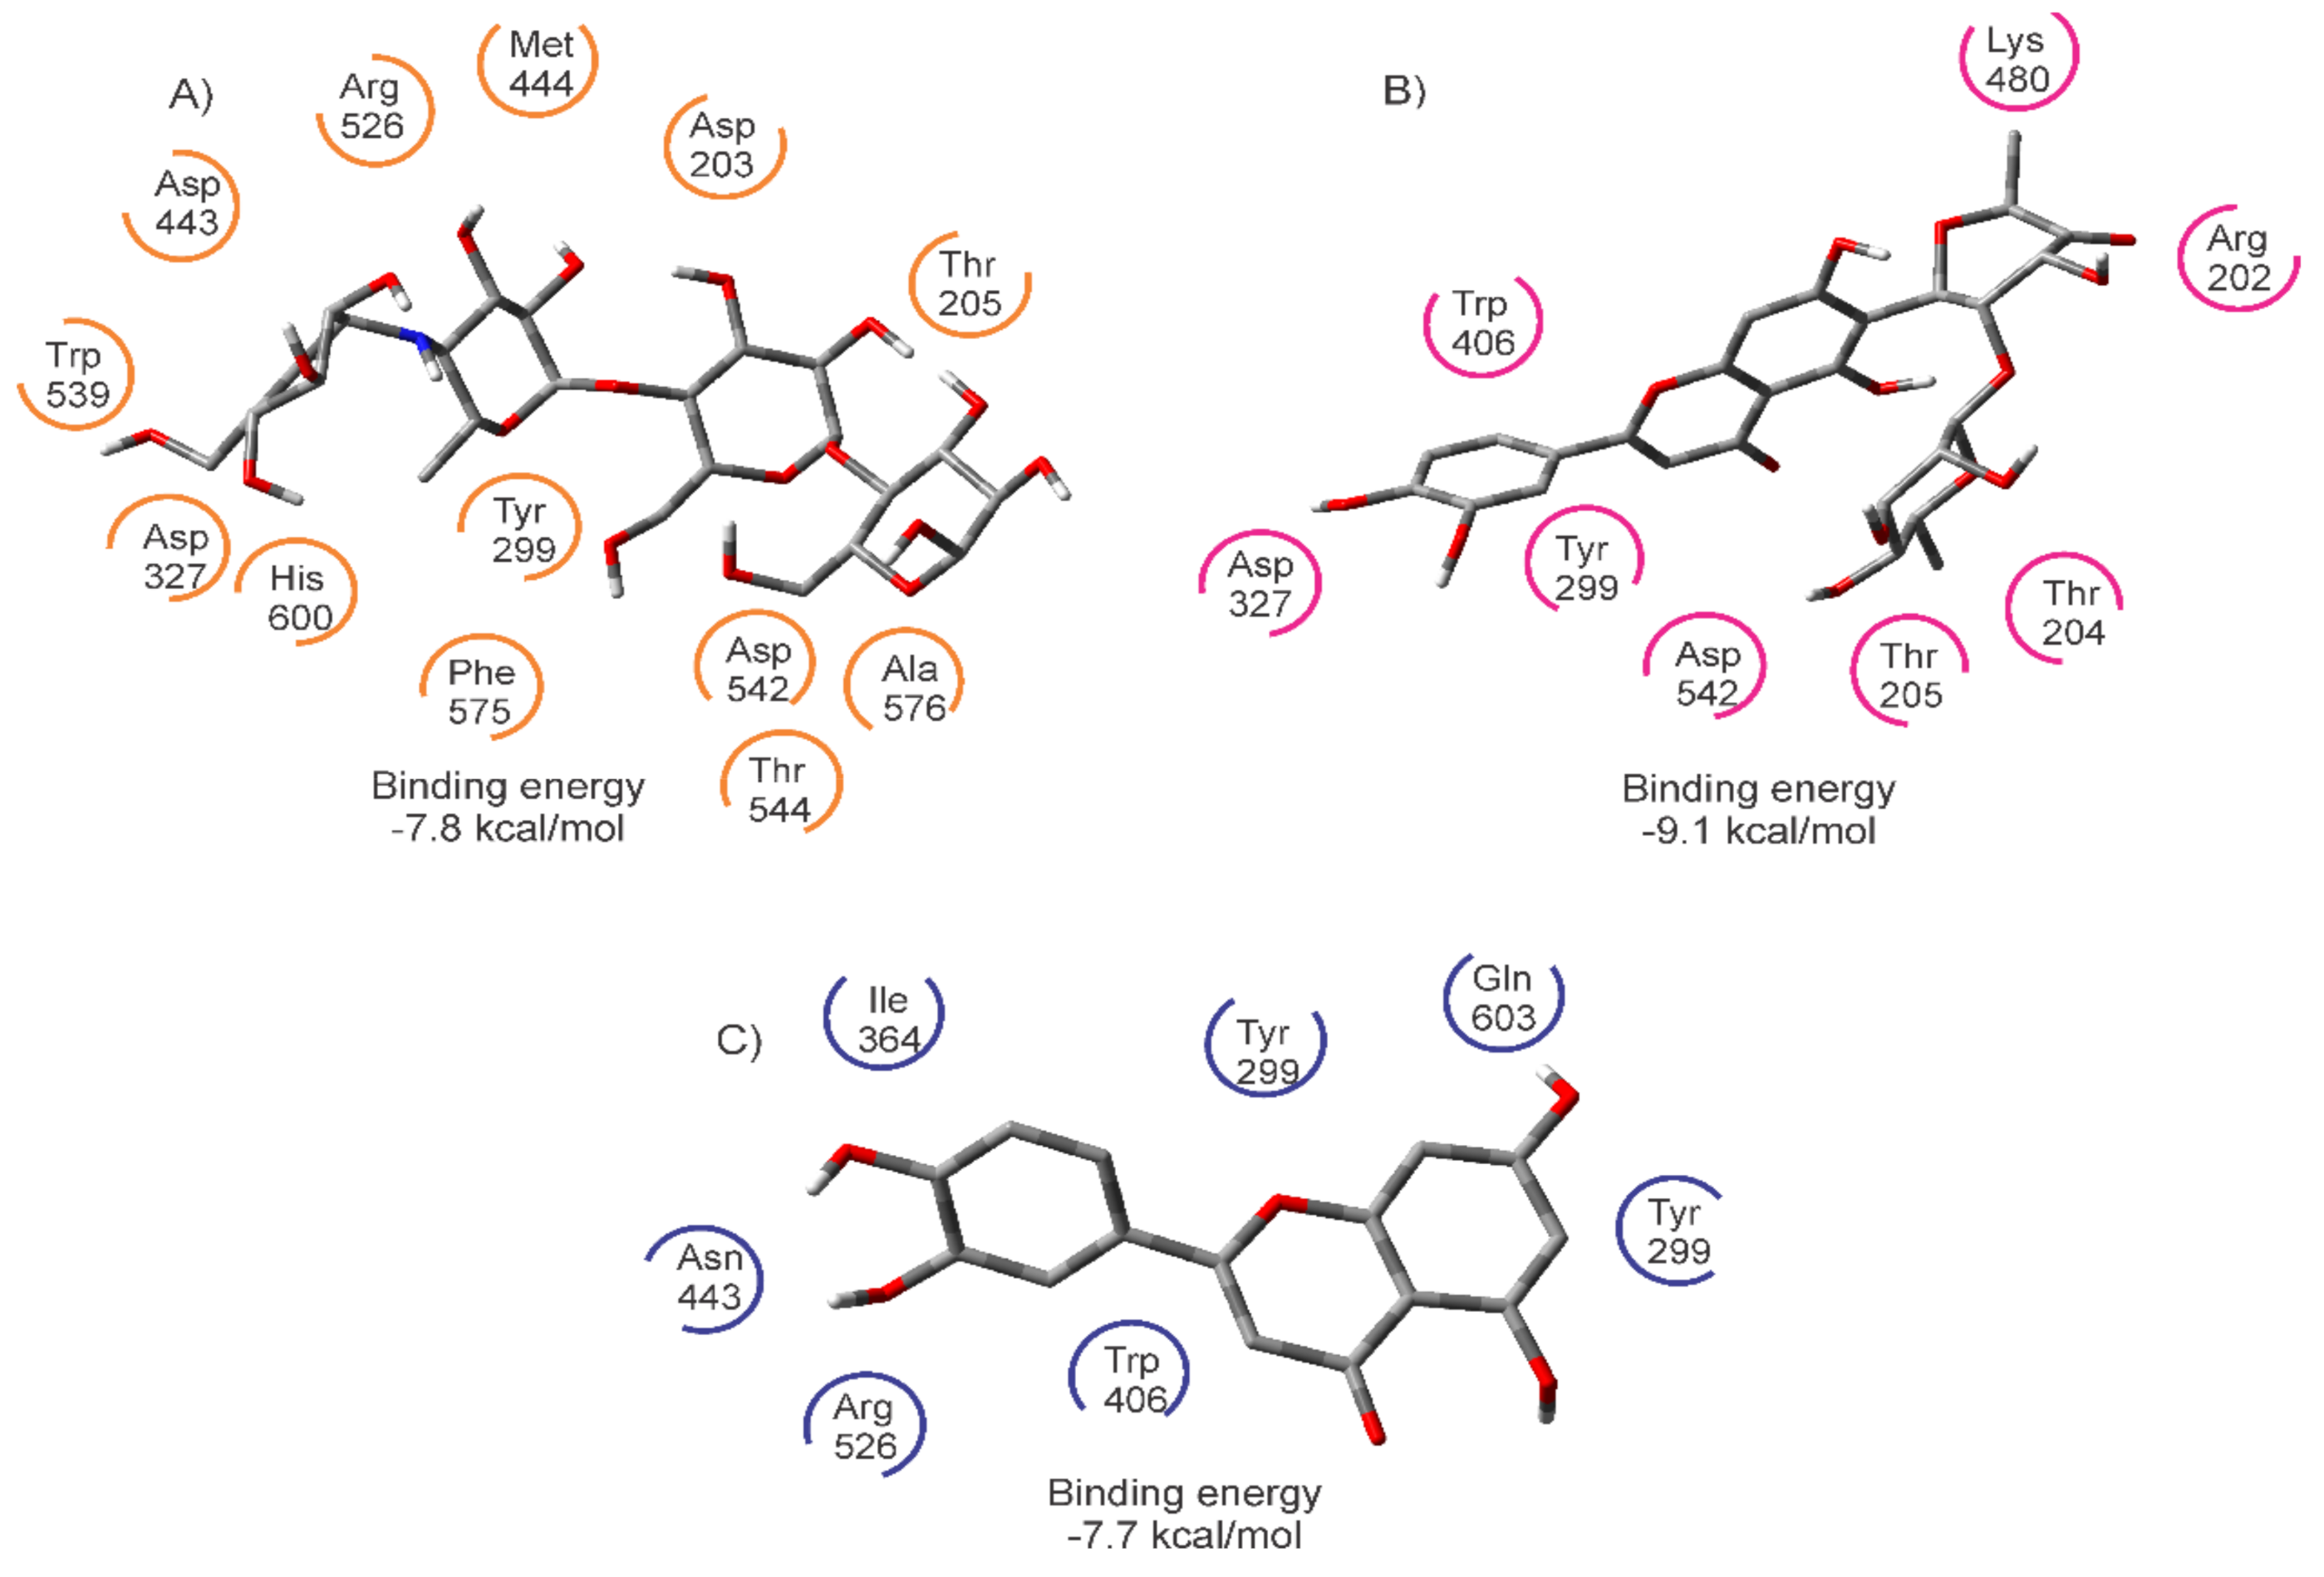
The binding energy of the ACA, MAY, and LUT with NtMGAM were obtained through molecular docking analysis. A negative value of the binding energy in the coupling indicates that the systems are stable and that there is a favorable interaction between the protein and ligands in the active site. The obtained values for the binding energy were −7.8 kcal/mol for ACA, −9.1 kcal/mol for MAY, and −7.7 kcal/mol for LUT. As can be observed, all the binding affinity values are negatives, which is a characteristic of stable complexes. Of the new alternatives for diabetes proposed in this work (MAY or LUT), the MAY presented the greatest binding energy absolute value with the active site, even greater than the obtained value for the acarbose (ACA), which is the most used treatment for diabetes. As is well known, the greater the affinity of the ligand for the protein, the easier the binding between them. This is important because the drug binding to a protein stimulates the physiological response that characterizes the action of the drug, which means that a series of biochemical events promote a biological or pharmacological effect [68].
When the ACA molecule is in contact with the active site of NtMGAM, the coupling study showed thirteen amino acids involved in the molecular interactions, where only four of them are connected in the protein sequence (Asp443-Met444 and Phe575-Ala576). With high hydrophilic character are aspartic acid (Asp203, Asp327, and Asp542), threonine (Thr205 and Thr544), tyrosine (Tyr299), Arg526, and histidine (His600), and with hydrophobic character is tryptophan (Trp539). While for the MAY ligand, the active site of the NtMGAM is formed by the following residues: Arg202, Thr204-Thr205, Tyr299, Asp327, Lys480, and Asp542 presented a hydrophilic character, and the residue Trp406 registered a hydrophobic character. Once the NtMGAM interacts with the LUT ligand, the active site is formed by the following residues: Ile364, Trp406, and Phe575 (hydrophobic), Tyr299, Asp443, Arg526, and Gln603 (hydrophilic).
The amino acids identified in the interaction site for ACA ligand with the NtMGAM, coincide with some of the amino acids of the active site obtained by X-ray diffraction reported by Sim, et al. [69] (See Table 1). These amino acids are indicated in bold). In these couplings, the amino acid Asp203 is present, which is of great importance for the binding of the ligands in the protein. The schematic structure of the active site and the binding energies are shown in Figure 4.
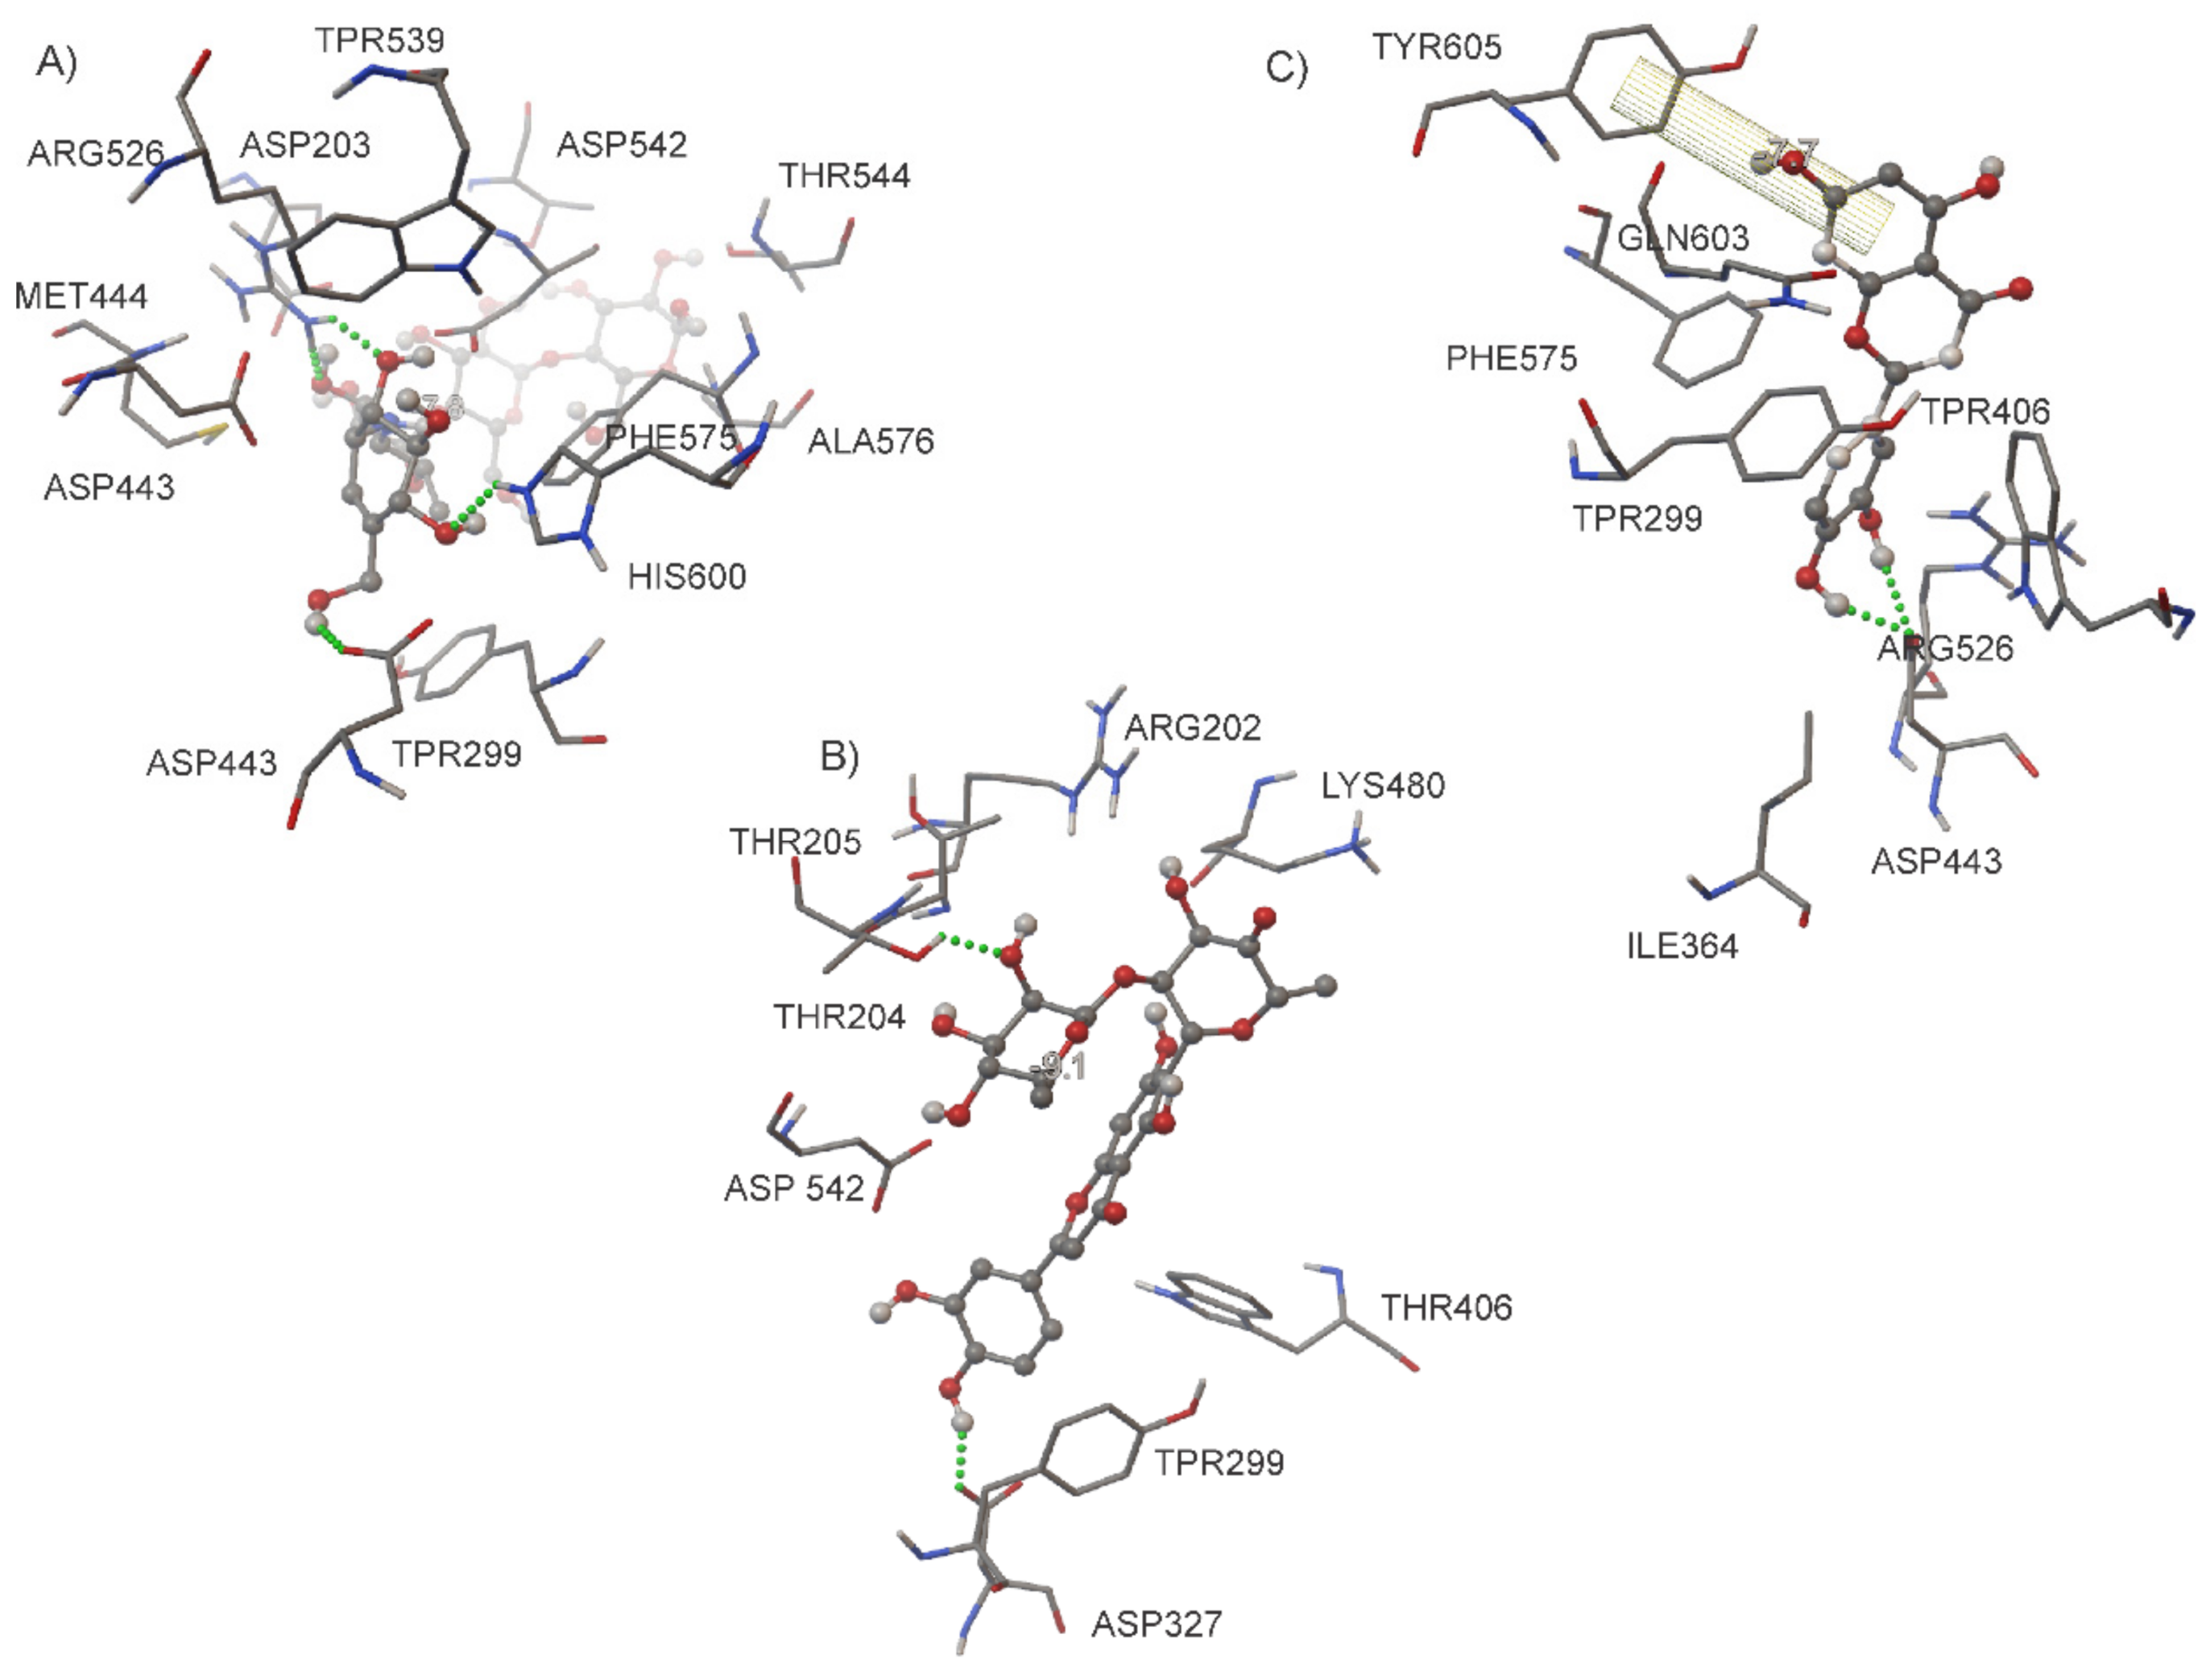
In addition, an analysis of the formation of hydrogen bonds between the active site of the NtMGAM and the ligands were carried out. In the case of the ACA, four hydrogen bonds were formed with Asp203, Asp443, and His600. In the interaction between MAY and NtMGAM, two hydrogen bonds were observed with the Asp327 and Thr205. Finally, the LUT ligand generated two hydrogen bonds with the residue Asp443, and a π-π interaction with the Tyr605 was obtained (Figure 5). In general, all the ligands are fully compliant with the Lipinski rule [70,71], which states that if five or fewer hydrogen bonds are present, the ligands could have good absorption and permeability.
The binding energy analysis performed in this section for each coupling between the ligands (ACA, MAY, and LUT) and the macromolecule (NtMGAM) gives valuable information for predicting the affinity with the protein. This analysis also identifies which amino acid of the NtMGAM is in contact with the docked ligands in the active site. Moreover, the interaction between the docked ligands and the amino acids of the active site of the NtMGAM can be predicted by the charge transfer descriptor, and finally, the analysis of the hydrogen bonds allows for determining which of the studied ligands present the best absorption and permeability properties with the NtMGAM. The behavior of the hydrogen bonds predicted here was further analyzed with MD simulations.

3.5. Chemical Reactivity Parameters and Charge Transfer Descriptor

Once the most stable conformation and the schematic structure of the active site between NtMGAM and ligands (ACA, MAY, and LUT) were defined, an analysis of reactivity in each ligand was carried out by means of the chemical reactivity descriptors, namely, the ionization potential (IP), electron affinity (EA), chemical hardness (η), electronegativity (χ), electrophilicity (ω) and chemical potential (µ). The values of these properties are shown in Table 2. As can be seen, the highest value of EA is 1.80 eV corresponding to the MAY ligand, which means that it forms an anion easier than the other ligands. On the opposite, according to the IP values reported, the ligand most prone to lose electrons was LUT with 6.35 eV. According to the η value of 2.27 eV, the MAY molecule could interact stronger with NtMGAM than the other compounds studied here. The chemical potential (µ = −χ) represents the tendency of a molecule to attract or transfer electrons. This is an important parameter in the calculation of the charge transfer descriptor. Electronegativity values were reported suggesting that MAY (χ = 4.07 eV) has the highest tendency to attract electrons. Electrophilicity (ω) represents the stabilization energy when a system is saturated by the surrounding electrons. According to our results, MAY has the highest electrophilicity, which is in accordance with the highest binding energy for the MAY-NtMGAM coupling obtained by molecular docking.
The µ and η were calculated in all the residues involved in the active site of the analyzed protein. In the same way, the charge transfer between the ligands and the amino acids was determined with the charge transfer parameter (ΔN) (see Equation (4)). The values of µ, η, and ΔN are shown in Table 3. According to the notation employed in Equation (4), μA is the chemical potential of the ligands ACA, MAY, and LUT; and μB is the chemical potential for the amino acids of the active site. Similarly, ηA and ηB, represent the chemical hardness values for ligands and amino acids of the active site, respectively [46]. ΔN represents the fraction of the transferred electron from one system to another [46]. These kinds of interactions are primary indicators of specificity, rate control, and reversibility in many biochemical reactions [72]. Additionally, this is a first step to understand the oxidative damage process in the active site produced by the ACA, MAY, and LUT ligands, allowing for identifying their behavior and biological activity with the NtMGAM. The characterization of oxidative damage by the charge transfer values had been previously used by some authors, in order to describe the oxidative and reductive reactions in other molecular systems as DNA bases [45,46].
A positive value of ΔN indicates that the ligand acts as an electron acceptor, while a negative value of ΔN indicates that the ligand acts as an electron donor. Therefore, the ACA in the presence of the amino acids Asp203, Thr205, Asp327, Asp443-Met44, and Asp542, acted as an electron acceptor, while with the rest of the amino acids, it worked as an electron donor. Furthermore, the MAY molecule in presence of all amino acids behaved as an electron donor. Finally, the LUT ligand in the presence of all amino acids acted as an electron acceptor. Hence, the oxidative damage in the active site decreases in the order LUT > MAY > ACA.

3.6. Molecular Dynamics Simulation Analysis

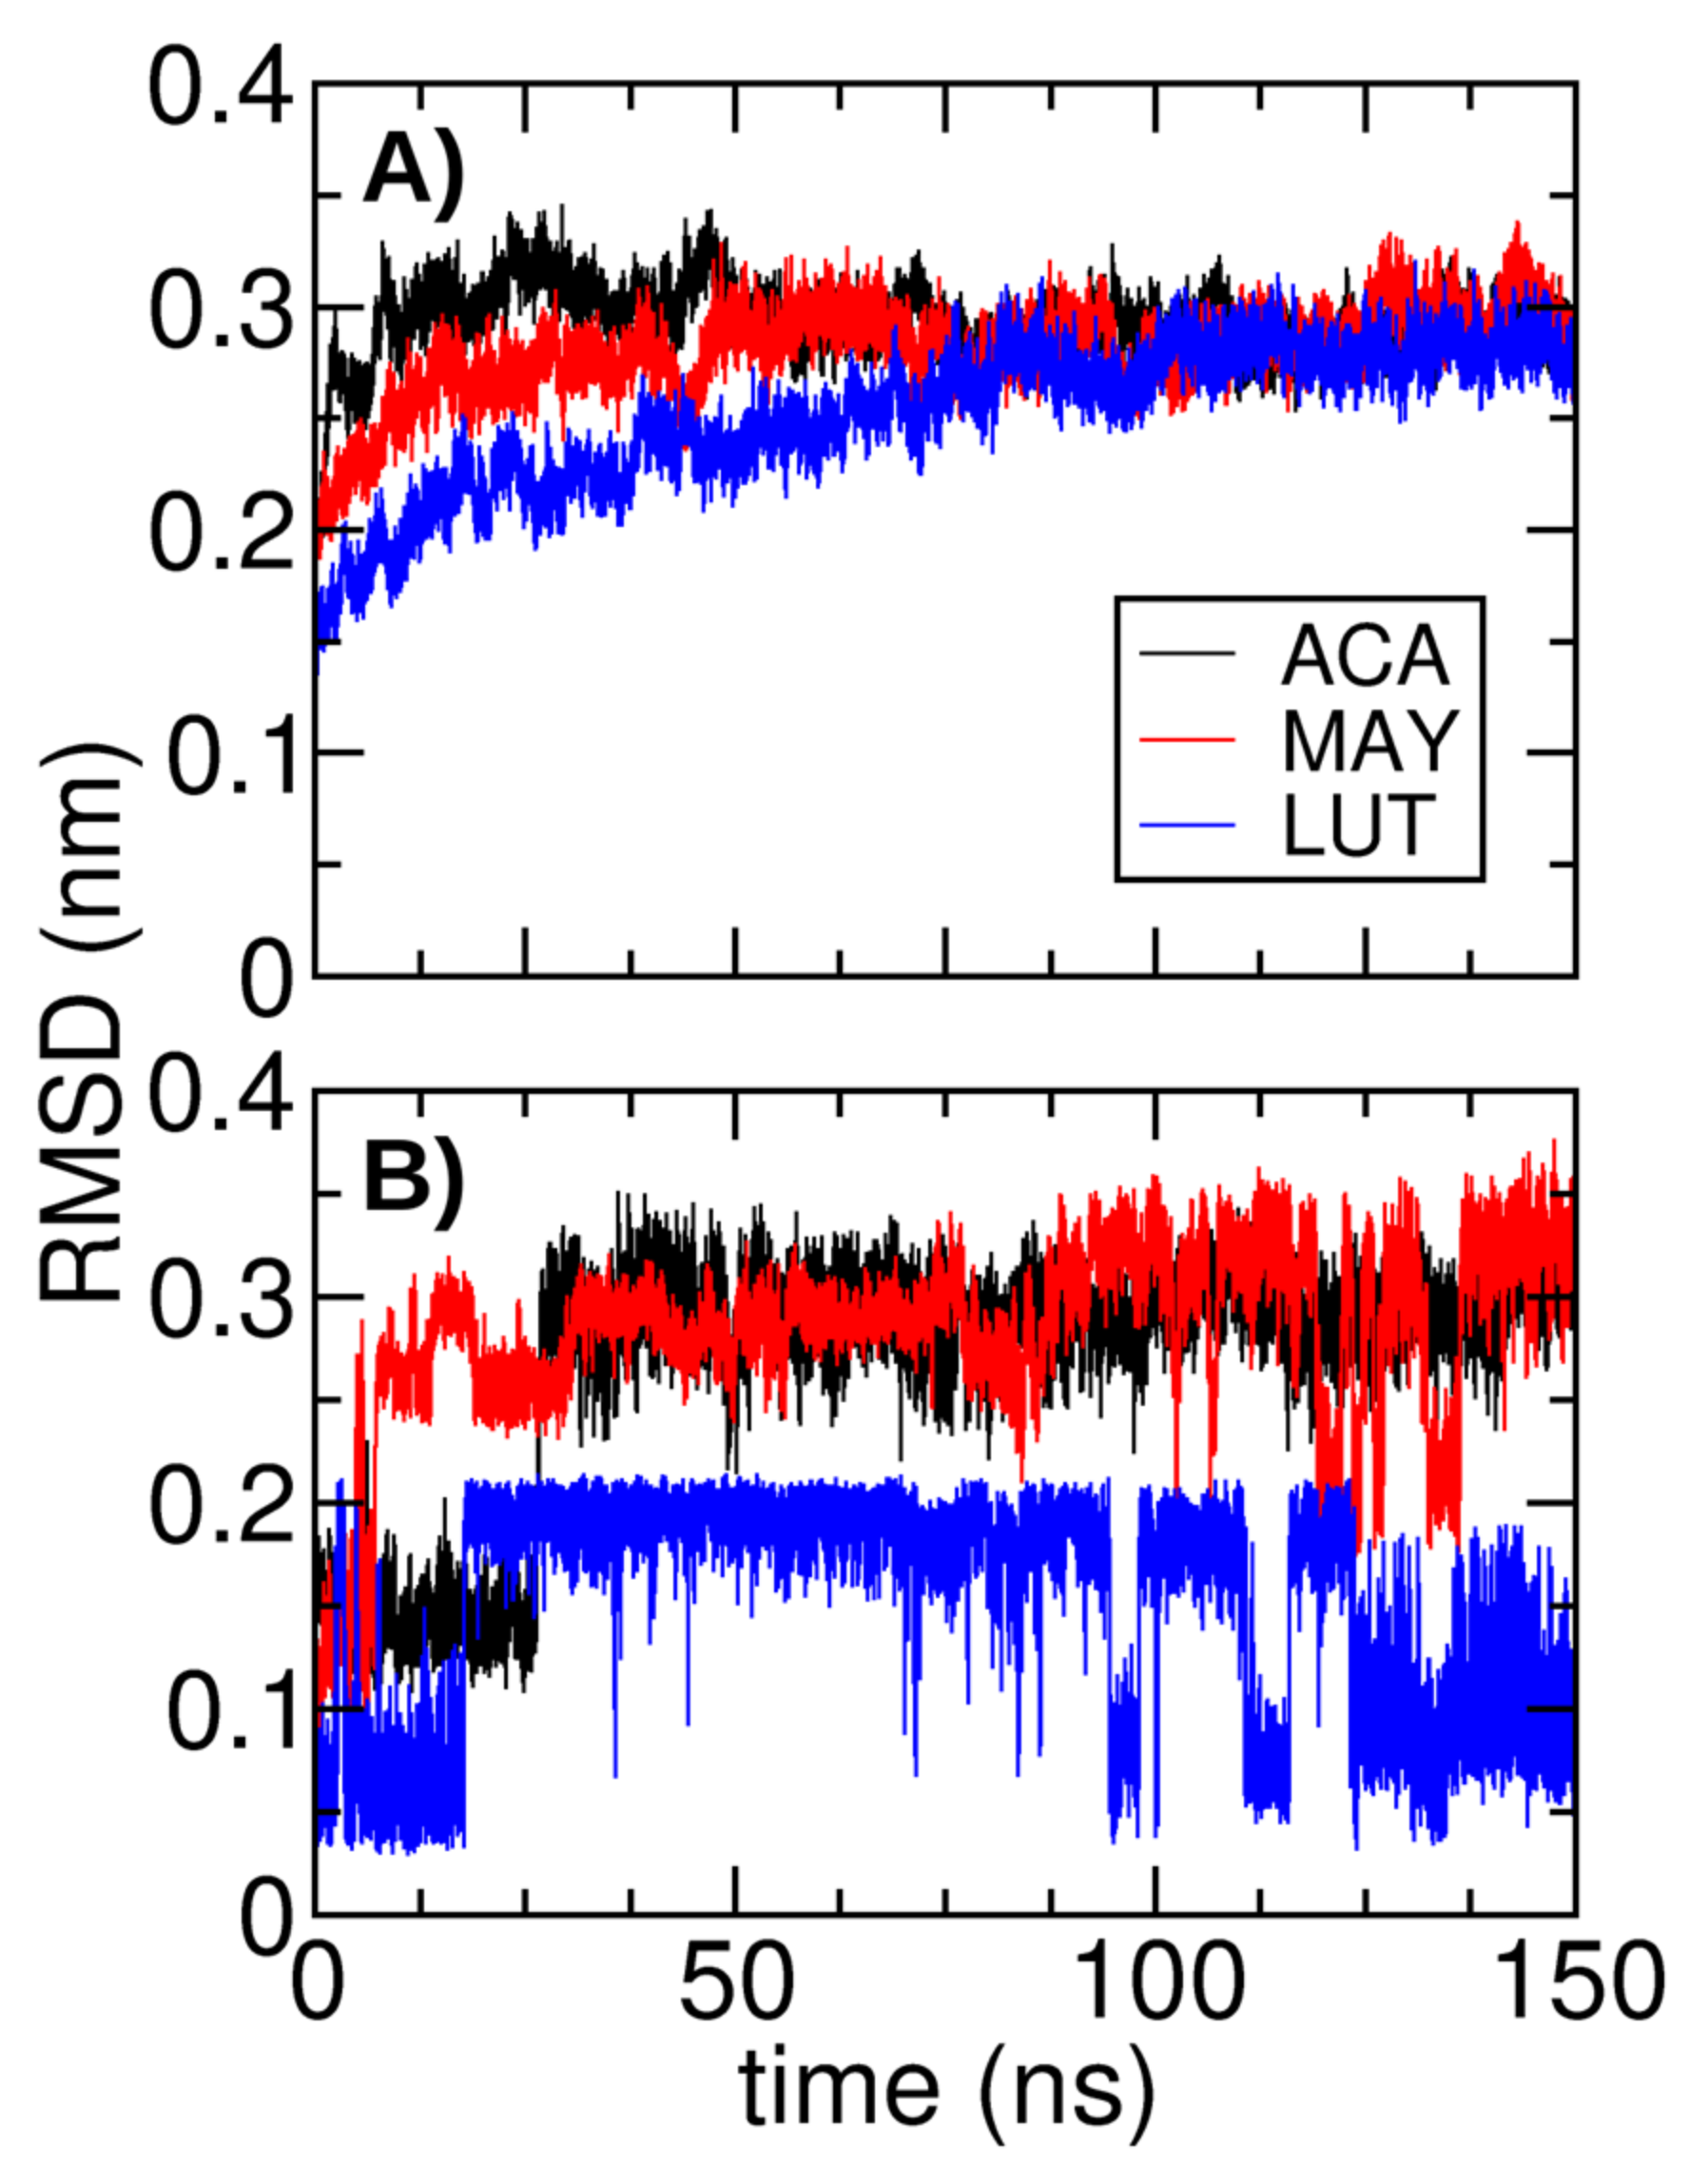
Figure 6 shows the root-mean-square deviation (RMSD) for the three studied complexes (Figure 6A) and for every ligand (Figure 6B). For all the systems, the RMSD reached a stable point after 75 ns, however, amongst the three curves; the one corresponding to MAY presented the highest variations, showing even a slight tendency to increase with time, (red curve in Figure 6A). This could be understood by observing the RMSD calculated only for the atoms of the MAY structure (red curve, Figure 6B). The time evolution of the RMSD suggests that MAY has not found a stable point inside the active site pocket of the protein; probably, the MAY molecule is “trying to leave” the hydrophilic zone.
Figure 6 also shows that the NtMGAM-ACA complex achieved a more stable conformation (black curve) earlier. After 25 ns, the RMSD corresponding to the ACA ligand oscillates around a constant value (~0.3 nm). Hence, it could be assumed that ACA bonding to the protein is stronger than the MAY interaction. In the case of the NtMGAM-LUT complex, the RMSD curve (blue in Figure 6B) showed that the ligand is oscillating between two different binding conformations inside the active site pocket. The fact that the RMSD value of LUT is smaller (~0.2 nm) than the one corresponding to ACA, could be related to the geometry of Luteolin, because this molecule presents fewer torsion angles in the structure, while the acarbose exhibits a non-planar geometry with several dihedral angles. So, from the RMSD analysis, the order in stability for the studied complexes is ACA > LUT > MAY.
Now, to understand better the behavior of RMSD values, the interaction between each ligand and the amino acids inside the active site pocket was analyzed. Hydrogen bond occupancies, shown in Table 4, were calculated from the MD trajectories. In the case of ACA, the occupancies were 98.3% and 81.09% with the residues Asp443 and Asp327, respectively, showing that ACA remained close to these residues during almost the whole simulation. Nevertheless, there is evidence of a rearrangement of the complex. As can be seen, the hydrogen bonds to Asp203 and His600 (see Figure 4A) were broken, while the hydrogen bond with Asp327 was formed again after a momentary break, and remained stable during the whole simulation. This rearrangement could explain the shift in the RMSD of ACA (black curve, Figure 6B). In the case of LUT, the highest occupancy with Asp443 (99.24%) showed that it stayed bonded to this residue during the whole MD simulation, and the occupancies corresponding to residues Asp542 and Glu300 (21.12% and 11.80%, respectively) explain why the RMSD of LUT was shifting between two different values (blue curve, Figure 6B). In particular, LUT was forming and breaking hydrogen bonds with these residues intermittently. MAY ligand showed a more varied behavior. The hydrogen bond with Thr205 predicted by molecular docking disappeared during the MD simulation. Moreover, the one with Asp327 (89.11%) remained during almost the whole simulation. Furthermore, MAY seems to intermittently form and break hydrogen bonds with the rest of the Asp residues present in the active site. The occupancies are 60.08%, 17.48%, and 4.07% with Asp203, Asp542, and Asp443, respectively. Additionally, MAY forms a hydrogen bond with Glu300 (24.59%), similar to that observed for LUT with 11.80%.
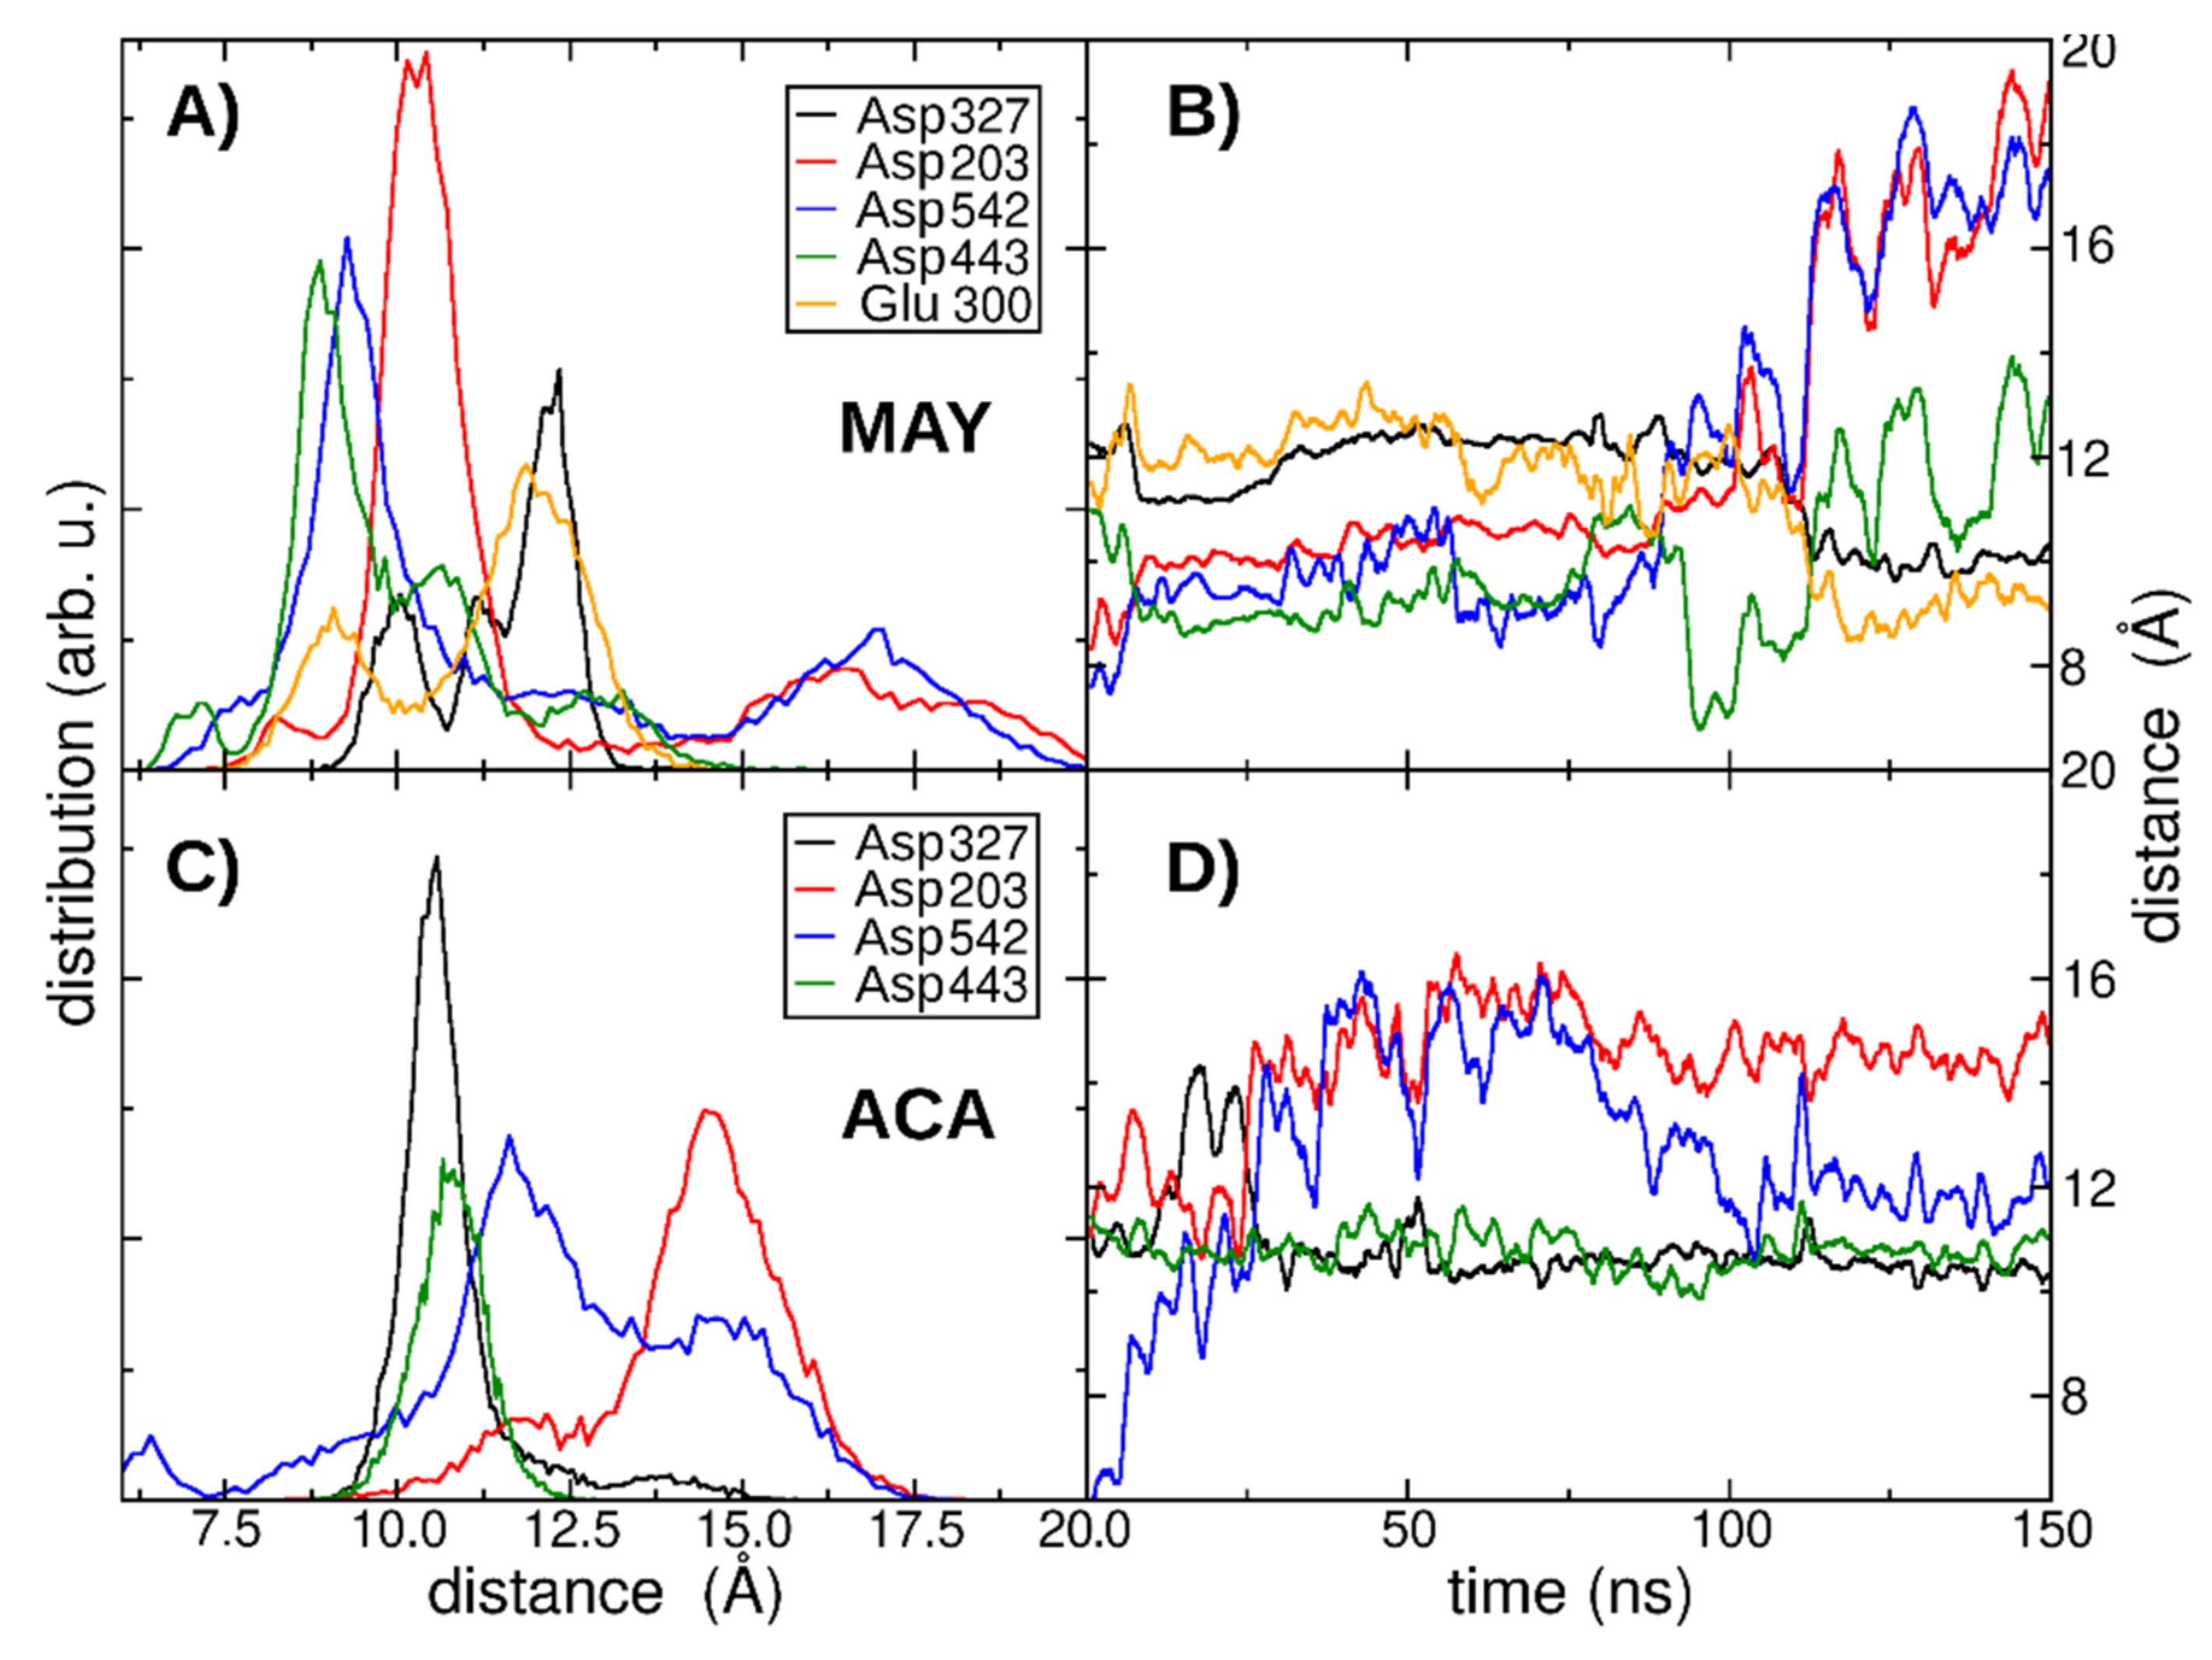
The distance distributions and the distance versus time (from residue to ligand) are plotted in Figure 7, in order to explain the MAY occupancies, which present more variations compared to ACA occupancies. Distance distributions (Figure 7A,C) for MAY showed more peaks, which means that MAY was oscillating between these residues (forming and breaking its hydrogen bonds). However, when the distance versus time is analyzed (Figure 7B,D), a better understanding of the involved dynamics is observed, specifically, if the ligands remained in the same place inside the active site or if they were moving away. In the case of MAY, it is clear that MAY was moving away from residues Asp443, Asp203, and Asp542, which are the Asp residues more internal in the active site. In addition, it was getting closer to Asp327 and Glu300, which are the residues located at the outermost part of the active site, contrary to ACA whose distances to the residues remained very stable.
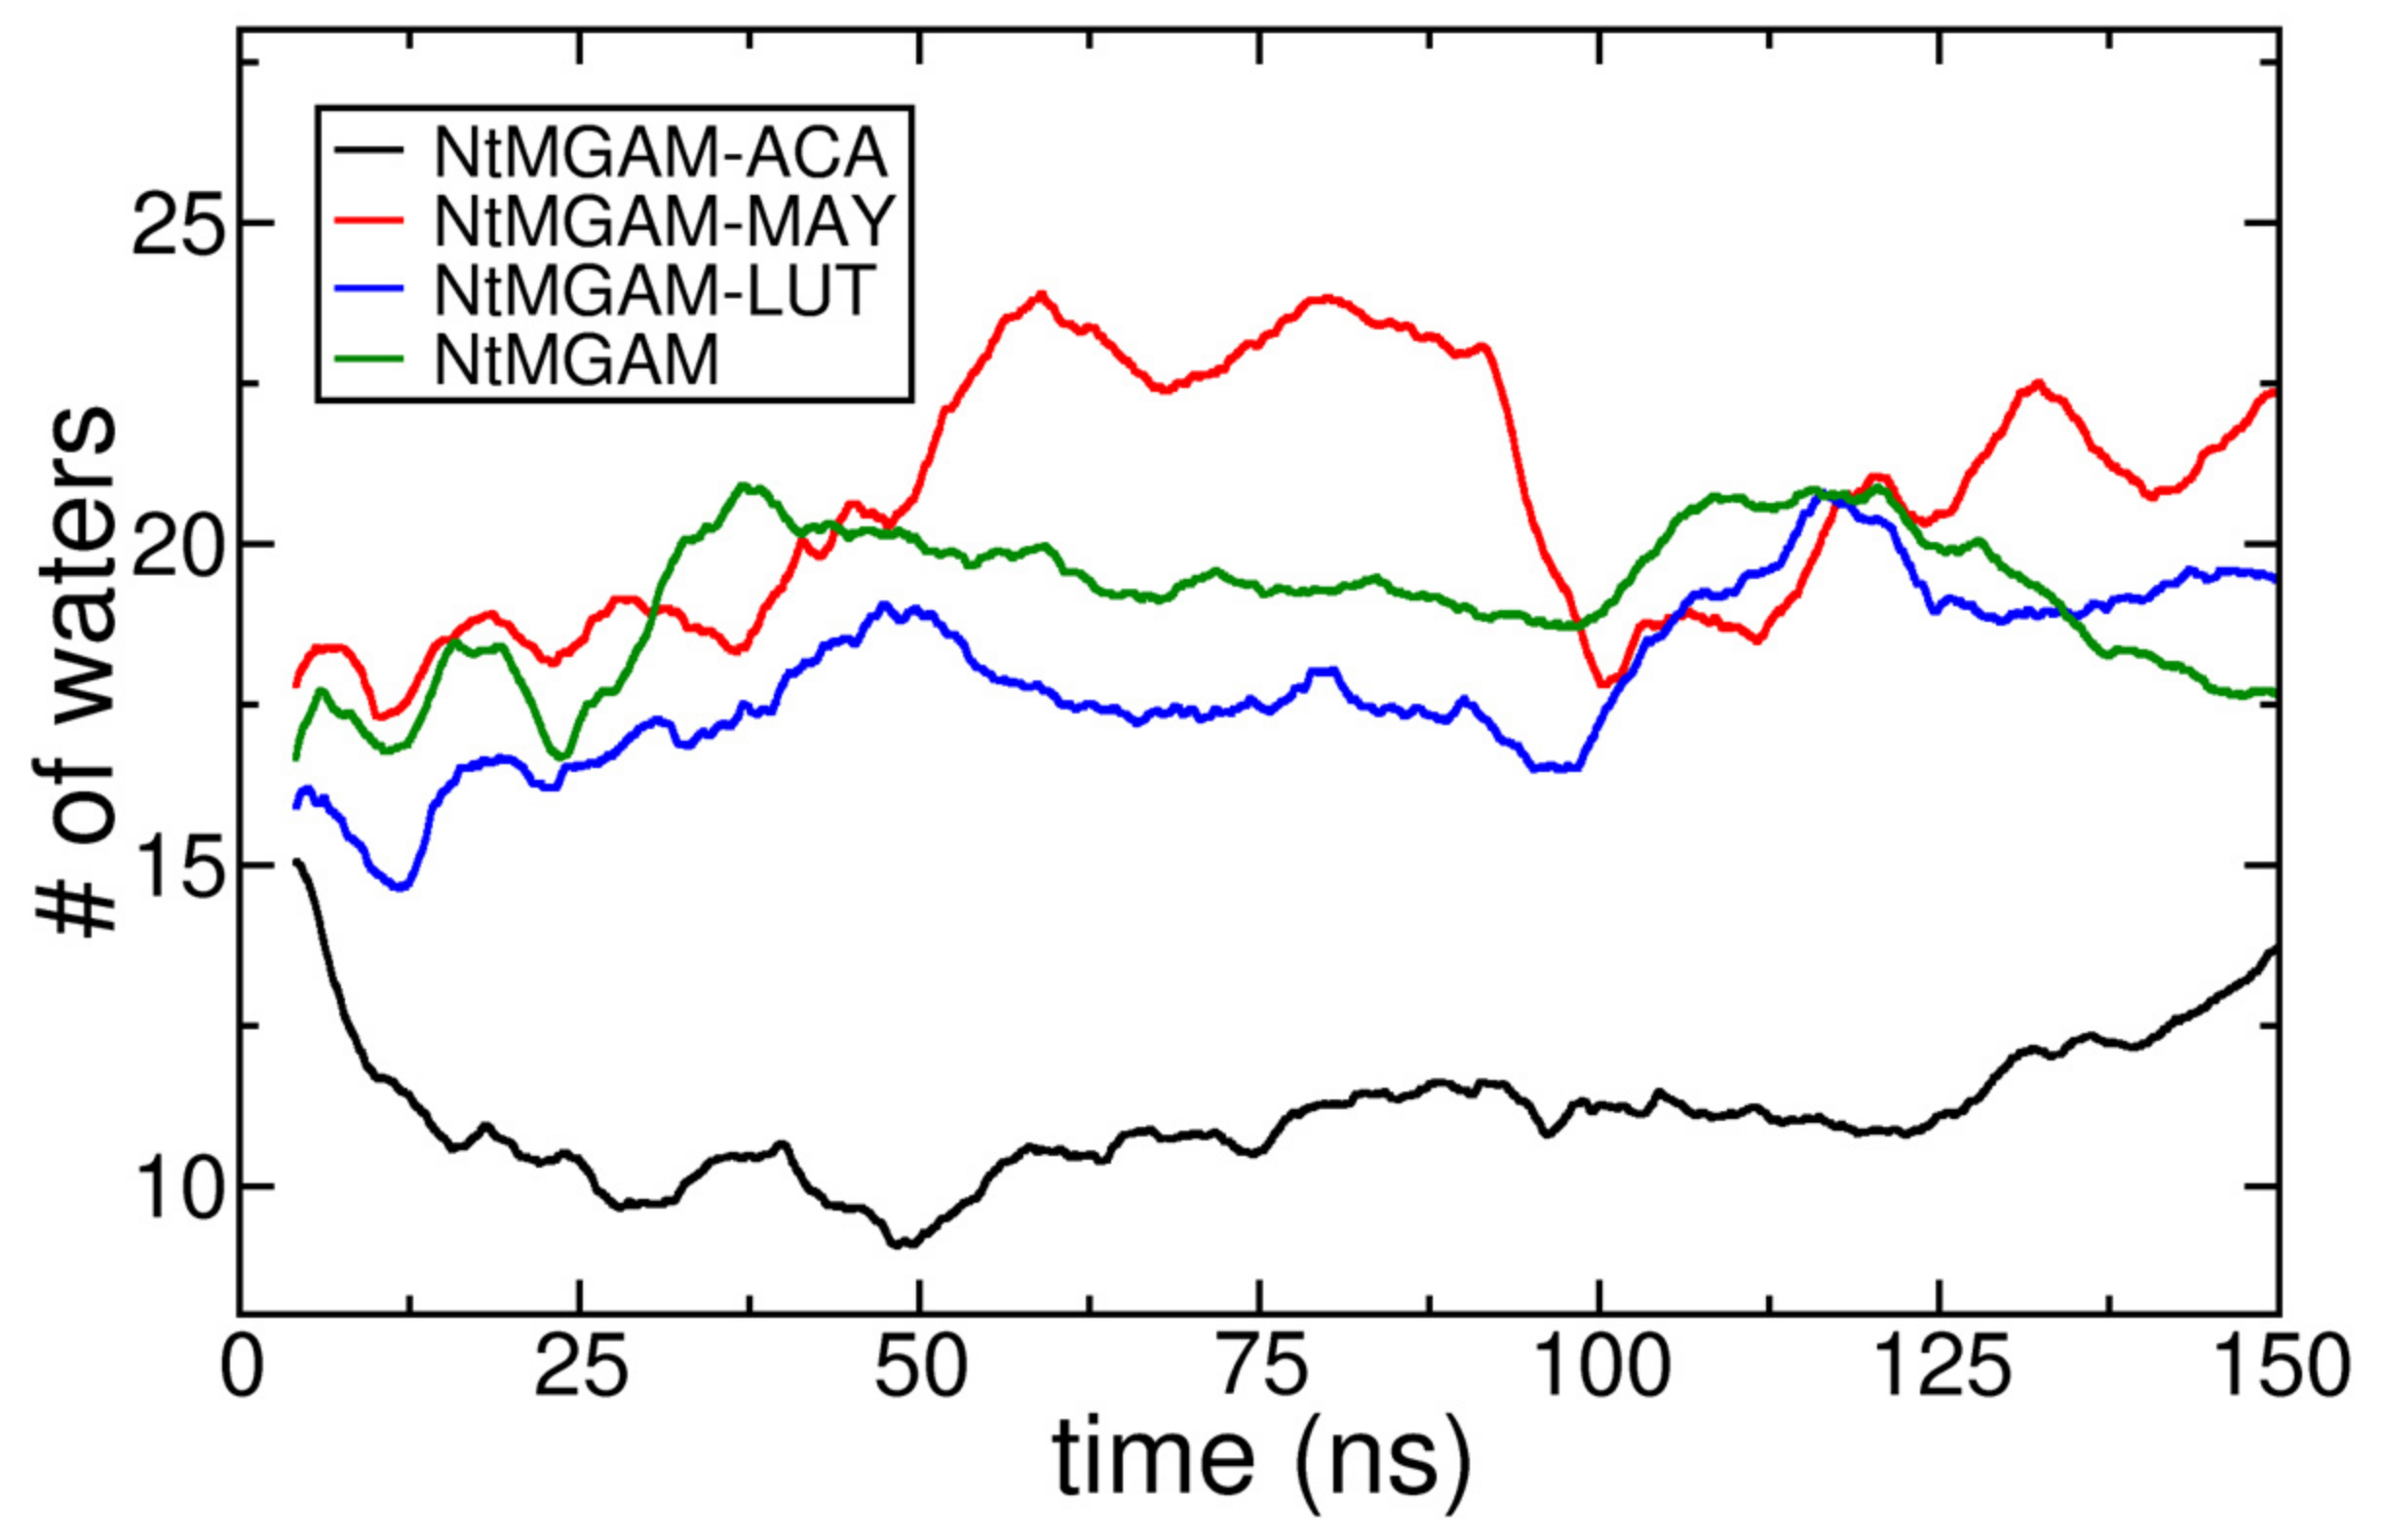
The lower stability of the NtMGAM-MAY complex can be understood with an analysis of the water behavior inside the active site pocket. Figure 8 shows the number of water molecules within a distance of 6 Å to the residue Asp443, which is located at the bottom of the active site pocket. For the NtMGAM-LUT complex, the amount of water inside the pocket was very close to that of the protein alone (without a ligand). In the case of MAY, the amount of water increased considerably around 50 ns of the simulation. The inclusion of a larger amount of water in the active site decreased the hydrophobicity, affecting the protein-ligand complex stability. Thus, the variations of the RMSD around 50 ns of the NtMGAM-MAY complex (red curve, Figure 6A) could be explained for the hydrophilic character of MAY. For ACA, the amount of water in the complex compared to that in the protein alone decreased considerably along the simulated time. This means that there is a hydrophobic interaction between the active site of the NtMGAM and the ACA, which is well known for being a good sign of protein-ligand complexes stability [73].

3.7. Binding Free Energy Calculation

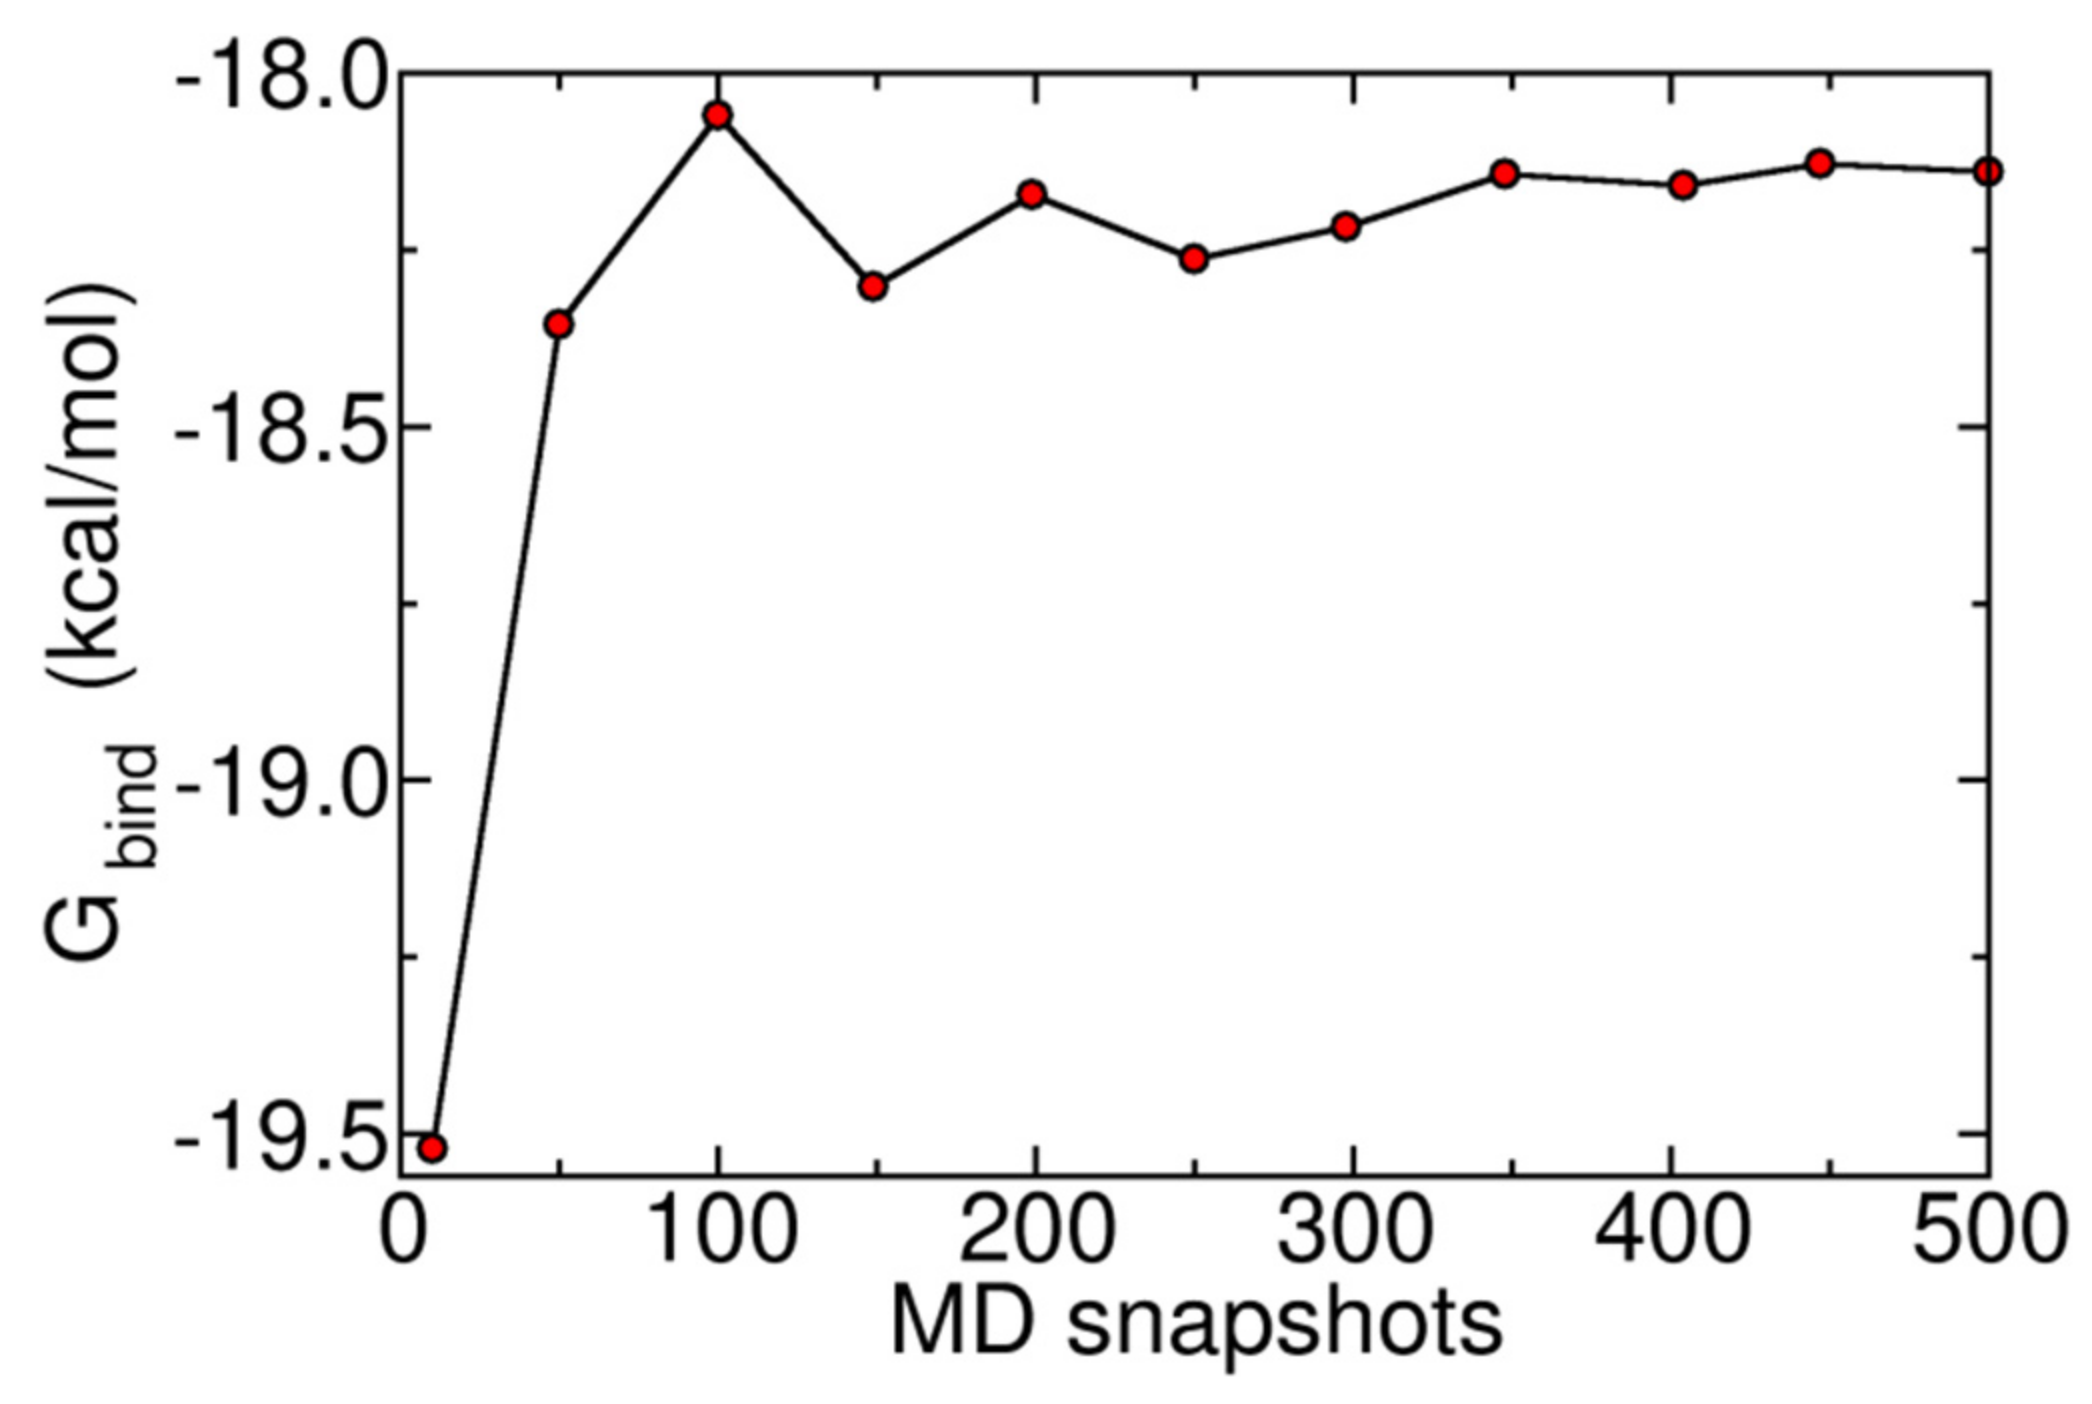
The MM-PBSA method has been successfully applied to various protein-ligand complexes [74,75,76]. This method is sensitive to simulation protocols, such as the sampling strategy of generating snapshots [65]. Hence, in order to obtain a reliable calculation of the binding free energy, a convergence analysis was performed. A correct Gbind calculation implies the evaluation over many MD snapshots. For the sampling, the last 50 ns were considered. Figure 9 shows the resulting Gbind for the case of Luteolin. As can be seen, the variation in energy values was very small (0.012 kcal/mol) from 450 to 500 MD snapshots. Therefore, unlike the rest of the properties, 500 MD snapshots—saved every 100 ps—were considered statistically representative for the calculation of Gbind.
Once the calculation parameters were defined, the binding free energy was calculated for the three studied systems, giving values of −18.8903, −5.4931, and −18.1401 kcal/mol, for ACA, MAY, and LUT, respectively. These values confirm the order of stability of the complexes deduced from the MD analysis presented above: ACA > LUT > MAY.
As mentioned in Section 2.4, the total binding free energy (Gbind) is the sum of the following terms:
(1)
Solvent contribution is the sum of electrostatic solvation energy (polar contribution or PB) and non-electrostatic solvation component (non-polar contribution SA);
(2)
Gas-phase contribution is the sum of electrostatic (elec) and Van der Waals interaction energies (vdW).
The gas-phase binding energies are strongly favorable, while the solvation contribution is considered repulsive, as it includes the energetic cost of desolvating the ligand [77]. Table 5 shows the different contributions to the total binding free energy. The Ggas is given by the sum of elec and vdW contributions, and Gsolv is composed of the sum of PB and SA energies. As can be seen, the Gsolv and Ggas contribution for the MAY molecule presented almost the same absolute value (67.9480 kcal/mol for Gsolv and −73.4411 kcal/mol Ggas), giving a small total Gbind. This gives a hint that MAY is more attracted to the outside of the active site than LUT and ACA. The reader may now notice that this explains the behavior of the MAY RMSD (Red curve, Figure 6B) and the difference between the order of stability predicted by MD (ACA > LUT > MAY) and molecular docking (MAY > ACA > LUT), respectively. The change in this order is due to the fact that in molecular docking the solvation contributions are not considered, as is correctly done in MD. The latter, far from indicating that molecular docking calculations are useless, confirms the route proposed here, where molecular docking binding energies give an insight into the stability of the complexes. The evolution from a metastable point found with molecular docking to a lower energy state reached in MD is common in macromolecular studies [26]. Furthermore, molecular docking provides initial configurations for MD simulations. Otherwise, performing MD from an arbitrary initial configuration of the systems under study would be computationally much more demanding.
Regarding the inhibition of the α-glucosidases, the phenolic extracts obtained from maize silks presented similar values of IC50, however, these values were lower than those obtained for the acarbose [14]. This coincides with the MD studies where it is shown that the stability of the analyzed ligands starts with acarbose, followed by luteolin, and ends with maysin.
In summary, the strategy followed in this work defined a route for the prediction of molecular properties relevant to the biological activity of molecules. In this case, the quantum-chemical analysis provided useful information about the molecular geometry, as well as, the determination of the most susceptible zones for the hydrogen bond formation, which was crucial for a comprehensive study of the interaction within the active site of the macromolecule. Additionally, the regions of high electron density, called pharmacophores, were identified by the determination of HOMO and LUMO orbitals in the three ligands. These regions along with electrostatic potential surface (EPS) were employed in the binding sites analysis. The intestinal absorption of the ligands was predicted by cheminformatics calculations, using the molecular polar surface (PSA) and logP values. Once these properties regarding the molecules under study (ACA, MAY, and LUT) were determined, it was possible to analyze the interactions with the active site of NtMGAM. The best position of the ligand inside the active site and the binding affinity were identified by molecular docking analysis. These results were determinant to define a starting point for molecular dynamics simulations. The stability of the coupling between ligand and macromolecule was analyzed by these simulations where the effects of the solvent and temperature were incorporated, showing that the hydrophobicity of the ligand is determinant to the affinity with the active site. On the other hand, the determination of oxidative damage in the amino acids of the active site was predicted by the charge transfer values, which were calculated with the chemical reactivity parameters and the molecular docking results.

4. Conclusions

In this work, we have presented a study that covers theoretical predictions from quantum chemistry to the molecular dynamics level, including molecular docking. The results presented here help to understand the interactions between acarbose and the new alternatives of treatment for diabetes, maysin and luteolin, with human maltase-glucoamylase (NtMGAM), as well as the oxidative damage in the maltase-glucoamylase. These predictions can also help to interpret existing results or to predict future experimental results.
The dihedral angles present in the molecular structure of ACA, MAY, and LUT, as well as the possible steric impediments inside of the active site, were analyzed by geometry optimization calculations. Chemical reactivity parameters were necessary to determine the charge transfer distribution between ligands and amino acids of the active site in the maltase-glucoamylase. Moreover, the three couplings presented oxidative damage, being 45.4% for ACA and 100% for MAY and LUT. According to Reverri, et al. [78], flavonoids are able to inhibit alpha-amylase enzymes by reducing postprandial glucose levels, which coincides with the theoretical values obtained for the oxidative damage in the LUT-NtMGAM coupling.
According to values for the binding energy obtained from molecular docking analysis, MAY ligand presented the greatest facility to interact with NtMGAM. Additionally, the chemical reactivity for MAY ligand, suggested greater stability when this molecule accepts electrons from the amino acids, as well as a greater facility to modify its electronic configuration in the presence of the active site. However, it is well known that the acarbose drug (ACA) is the best strategy to decrease the postprandial rise in blood glucose and to prevent diabetes complications [79]. Therefore, an analysis that considers only direct interactions between ligands and the active site seems to be insufficient. In this sense, molecular dynamics simulations provided a complementary methodology that incorporates solvent and temperature effects not considered in molecular docking. Indeed, molecular dynamics showed that ACA is the molecule that displaces a bigger amount of water compared to LUT and MAY, which indicates the greater affinity of this ligand to the active site of NtMGAM. The obtained results for MAY and LUT coincided with reported experimental results, where was confirmed that phenolic compounds from maize silks can inhibit the activity of carbohydrate-hydrolyzing enzymes such as the intestinal α-glucosidases, with similar or lower values of IC50 than acarbose. Since any ligand-binding process can displace water molecules from the binding site [78], it is recommended for future research to analyze ACA-like ligands that are not very hydrophilic.

Author Contributions

Formal analysis, L.-L.L.-M. and L.-M.R.-V.; investigation, L.-L.L.-M.; methodology, L.-L.L.-M. and J.P.P.-B.; writing—original draft, L.-L.L.-M., J.P.P.-B. and L.-M.R.-V.; writing—review and editing, L.-L.L.-M., N.G.-M., J.P.P.-B., N.-A.S.-B., H.A.P.-C., M.A.C.-R., J.P.F.-D.l.R. and L.-M.R.-V. All authors have read and agreed to the published version of the manuscript.

Funding

This research was funded by Programa para el Desarrollo Profesional Docente (PRODEP) by grant 18-6897.

Institutional Review Board Statement

Not applicable.

Informed Consent Statement

Not applicable.

Data Availability Statement

The data presented in this study are available on request from the corresponding authors.

Acknowledgments

L.-L.L.-M. thanks Programa para el Desarrollo Profesional Docente for the grant. All the researchers are grateful to Universidad Autónoma de Chihuahua for the support and infrastructure provided.

Conflicts of Interest

The authors declare no conflict of interest. The founding sponsors had no role in the design of the study, in the collection, analyses or interpretation of data; in the writing of the manuscript; or in the decision to publish the results.

References

  1. Neel, J.V. Diabetes mellitus: A “thrifty” genotype rendered detrimental by “progress”? Am. J. Hum. Genet. 1962, 14, 353–362. [Google Scholar] [PubMed]
  2. Van De Laar, F.A. Alpha-glucosidase inhibitors in the early treatment of type 2 diabetes. Vasc. Health Risk Manag. 2008, 4, 1189–1195. [Google Scholar] [CrossRef] [PubMed] [Green Version]
  3. Lin, A.H.-M.; Lee, B.-H.; Chang, W.-J. Small intestine mucosal α-glucosidase: A missing feature of in vitro starch digestibility. Food Hydrocoll. 2016, 53, 163–171. [Google Scholar] [CrossRef]
  4. Nair, S.S.; Kavrekar, V.; Mishra, A. In vitro studies on alpha amylase and alpha glucosidase inhibitory activities of selected plant extracts. Eur. J. Exp. Biol. 2013, 3, 128–132. [Google Scholar]
  5. Chiasson, J.-L.; Josse, R.G.; Gomis, R.; Hanefeld, M.; Karasik, A.; Laakso, M. Acarbose for prevention of type 2 diabetes mellitus: The STOP-NIDDM randomised trial. Lancet 2002, 359, 2072–2077. [Google Scholar] [CrossRef]
  6. Chahal, H. Comparative Review of Oral Hypoglycemic Agents in Adults; World Health Organization, 19th Expert Committee on the Selection and Use of Essential Medicines; World Health Organization: Geneva, Switzerland, 2013; Volume 18, pp. 1–37. [Google Scholar]
  7. Kim, S.L.; Jung, T.W. Maysin and other flavonoid contents in corn silks. Korean J. Breed 2001, 33, 338–343. [Google Scholar]
  8. Ando, C.; Takahashi, N.; Hirai, S.; Nishimura, K.; Lin, S.; Uemura, T.; Goto, T.; Yu, R.; Nakagami, J.; Murakami, S.; et al. Luteolin, a food-derived flavonoid, suppresses adipocyte-dependent activation of macrophages by inhibiting JNK activation. FEBS Lett. 2009, 583, 3649–3654. [Google Scholar] [CrossRef] [Green Version]
  9. Matsui, T.; Kobayashi, M.; Hayashida, S.; Matsumoto, K. Luteolin, a Flavone, Does Not Suppress Postprandial Glucose Absorption through an Inhibition of α-Glucosidase Action. Biosci. Biotechnol. Biochem. 2002, 66, 689–692. [Google Scholar] [CrossRef]
  10. Yan, J.; Zhang, G.; Pan, J.; Wang, Y. α-Glucosidase inhibition by luteolin: Kinetics, interaction and molecular docking. Int. J. Biol. Macromol. 2014, 64, 213–223. [Google Scholar] [CrossRef]
  11. Zhang, B.-W.; Li, X.; Sun, W.-L.; Xing, Y.; Xiu, Z.-L.; Zhuang, C.-L.; Dong, Y.-S. Dietary Flavonoids and Acarbose Synergistically Inhibit α-Glucosidase and Lower Postprandial Blood Glucose. J. Agric. Food Chem. 2017, 65, 8319–8330. [Google Scholar] [CrossRef]
  12. Tadera, K.; Minami, Y.; Takamatsu, K.; Matsuoka, T. Inhibition of α-glucosidase and α-amylase by flavonoids. J. Nutr. Sci. Vitaminol. 2006, 52, 149–153. [Google Scholar] [CrossRef] [Green Version]
  13. Jia, Y.; Gao, X.; Xue, Z.; Wang, Y.; Lu, Y.; Zhang, M.; Panichayupakaranant, P.; Chen, H. Characterization, antioxidant activities, and inhibition on α-glucosidase activity of corn silk polysaccharides obtained by different extraction methods. Int. J. Biol. Macromol. 2020, 163, 1640–1648. [Google Scholar] [CrossRef]
  14. Alvarado-Díaz, C.S.; Gutiérrez-Méndez, N.; Mendoza-López, M.L.; Rodríguez-Rodríguez, M.Z.; Quintero-Ramos, A.; Landeros-Martínez, L.L.; Rodríguez-Valdez, L.M.; Rodríguez-Figueroa, J.C.; Pérez-Vega, S.; Salmeron-Ochoa, I.; et al. Inhibitory effect of saccharides and phenolic compounds from maize silks on intestinal α-glucosidases. J. Food Biochem. 2019, 43, e12896. [Google Scholar] [CrossRef]
  15. Remko, M. Theoretical study of molecular structure, pKa, lipophilicity, solubility, absorption, and polar surface area of some hypoglycemic agents. J. Mol. Struct. THEOCHEM 2009, 897, 73–82. [Google Scholar] [CrossRef]
  16. Flores-Holguin, N.; Landeros-Martinez, D.G.-M.L.-L.; Orrantia-Borunda, N.F.-H.E. Theoretical Calculation of UV-Vis, IR Spectra and Reactivity Properties of Tamoxifen Drug: A Methodology Comparison. MOJ Bioorganic Org. Chem. 2017, 1, 1–9. [Google Scholar] [CrossRef] [Green Version]
  17. Landeros-Martinez, E.O.-B.L.-L.; Borunda, E.O. DFT Chemical Reactivity Analysis of Biological Molecules in the Presence of Silver Ion. Org. Chem. Curr. Res. 2016, 4, 1–6. [Google Scholar] [CrossRef]
  18. Maltarollo, V.G.; Homem-De-Mello, P.; Honório, K.M. Theoretical study on the molecular and electronic properties of some substances used for diabetes mellitus treatment. J. Mol. Model. 2009, 16, 799–804. [Google Scholar] [CrossRef]
  19. De Benedetti, P.G.; Quartieri, S.; Rastelli, A. A theoretical study of the structure-activity relationship in sulpha drugs. J. Mol. Struct. THEOCHEM 1981, 85, 45–51. [Google Scholar] [CrossRef]
  20. Luzhkov, V. Electronic parameters and molecular mechanisms of biological action of nitroxyl radicals. J. Mol. Struct. THEOCHEM 1985, 121, 165–172. [Google Scholar] [CrossRef]
  21. Rao, Y.S.; Prasad, M.; Sri, N.U.; Veeraiah, V. Vibrational (FT-IR, FT-Raman) and UV–Visible spectroscopic studies, HOMO–LUMO, NBO, NLO and MEP analysis of Benzyl (imino (1H-pyrazol-1-yl) methyl) carbamate using DFT calculaions. J. Mol. Struct. 2016, 1108, 567–582. [Google Scholar] [CrossRef]
  22. Trott, O.; Olson, A.J. AutoDock Vina: Improving the speed and accuracy of docking with a new scoring function, efficient optimization, and multithreading. J. Comput. Chem. 2010, 31, 455–461. [Google Scholar] [CrossRef] [PubMed] [Green Version]
  23. Bultinck, P.; De Winter, H.; Langenaeker, W.; Tollenare, J.P. Computational Medicinal Chemistry for Drug Discovery; Apple Academic Press: Palm Bay, FL, USA, 2003; ISBN 0203913396. [Google Scholar] [CrossRef] [Green Version]
  24. Kitchen, D.B.; Decornez, H.; Furr, J.R.; Bajorath, J. Docking and scoring in virtual screening for drug discovery: Methods and applications. Nat. Rev. Drug Discov. 2004, 3, 935–949. [Google Scholar] [CrossRef] [PubMed]
  25. Przylas, I.; Terada, Y.; Fujii, K.; Takaha, T.; Saenger, W.; Sträter, N. X-ray structure of acarbose bound to amylomaltase from Thermus aquaticus. JBIC J. Biol. Inorg. Chem. 2000, 267, 6903–6913. [Google Scholar] [CrossRef] [PubMed] [Green Version]
  26. Huang, L.-L.; Han, J.; Ran, J.-X.; Chen, X.-P.; Wang, Z.-H.; Wu, F.-H. 3D-QSAR, molecular docking and molecular dynamics simulations of oxazepane amidoacetonitrile derivatives as novel DPPI inhibitors. J. Mol. Struct. 2018, 1168, 223–233. [Google Scholar] [CrossRef]
  27. Safarizadeh, H.; Garkani-Nejad, Z. Investigation of MI-2 analogues as MALT1 inhibitors to treat of diffuse large B-Cell lymphoma through combined molecular dynamics simulation, molecular docking and QSAR techniques and design of new inhibitors. J. Mol. Struct. 2019, 1180, 708–722. [Google Scholar] [CrossRef]
  28. Wang, Z.-Z.; Ma, C.-Y.; Yang, J.; Gao, Q.-B.; Sun, X.-D.; Ding, L.; Liu, H.-M. Investigating the binding mechanism of (4-Cyanophenyl)glycine derivatives as reversible LSD1 by 3D-QSAR, molecular docking and molecular dynamics simulations. J. Mol. Struct. 2019, 1175, 698–707. [Google Scholar] [CrossRef]
  29. Naseem, S.; Khalid, M.; Tahir, M.N.; Halim, M.A.; Braga, A.A.; Naseer, M.M.; Shafiq, Z. Synthesis, structural, DFT studies, docking and antibacterial activity of a xanthene based hydrazone ligand. J. Mol. Struct. 2017, 1143, 235–244. [Google Scholar] [CrossRef]
  30. Barakat, A.; Islam, M.S.; Al-Majid, A.M.; Soliman, S.M.; Ghabbour, H.A.; Yousuf, S.; Choudhary, M.I.; Ul-Haq, Z. Synthesis, molecular structure, spectral analysis, and biological activity of new malonamide derivatives as α-glucosidase inhibitors. J. Mol. Struct. 2017, 1134, 253–264. [Google Scholar] [CrossRef]
  31. Jhong, C.-H.; Riyaphan, J.; Lin, S.-H.; Chia, Y.-C.; Weng, C.-F. Screening alpha-glucosidase and alpha-amylase inhibitors from natural compounds by molecular dockingin silico. BioFactors 2015, 41, 242–251. [Google Scholar] [CrossRef]
  32. Saqib, U.; Siddiqi, M.I. Probing ligand binding interactions of human alpha glucosidase by homology modeling and molecular docking. Intern. J. Integr. Biol. 2008, 2, 116–121. [Google Scholar]
  33. Zhao, Y.; Truhlar, D.G. Density Functionals with Broad Applicability in Chemistry. Acc. Chem. Res. 2008, 41, 157–167. [Google Scholar] [CrossRef]
  34. Zhao, Y.; Truhlar, D.G. The M06 suite of density functionals for main group thermochemistry, thermochemical kinetics, noncovalent interactions, excited states, and transition elements: Two new functionals and systematic testing of four M06-class functionals and 12 other functionals. Theor. Chem. Acc. 2008, 120, 215–241. [Google Scholar] [CrossRef] [Green Version]
  35. Curtiss, L.A.; Raghavachari, K.; Redfern, P.C.; Rassolov, V.A.; Pople, J.A. Gaussian-3 (G3) theory for molecules containing first and second-row atoms. J. Chem. Phys. 1998, 109, 7764–7776. [Google Scholar] [CrossRef]
  36. Tomasi, J.; Persico, M. Molecular Interactions in Solution: An Overview of Methods Based on Continuous Distributions of the Solvent. Chem. Rev. 1994, 94, 2027–2094. [Google Scholar] [CrossRef]
  37. Stephens, P.J.; Devlin, F.J.; Chabalowski, C.F.; Frisch, M.J. Ab Initio Calculation of Vibrational Absorption and Circular Dichroism Spectra Using Density Functional Force Fields. J. Phys. Chem. 1994, 98, 11623–11627. [Google Scholar] [CrossRef]
  38. Hirshfeld, F.L. Bonded-atom fragments for describing molecular charge densities. Theor. Chem. Acc. 1977, 44, 129–138. [Google Scholar] [CrossRef]
  39. Foresman, J.B.; Frisch, A.E. Exploring Chemistry with Electronic Structure Methods; Gaussian, Inc.: Pittsburgh, PA, USA, 1996. [Google Scholar]
  40. Lewars, E.G. Computational Chemistry: Introduction to the Theory and Applications of Molecular and Quantum Mechanics; Springer Science & Business Media: New York, NY, USA, 2010; ISBN 9048138620. [Google Scholar]
  41. Parr, R.G.; Pearson, R.G. Absolute hardness: Companion parameter to absolute electronegativity. J. Am. Chem. Soc. 1983, 105, 7512–7516. [Google Scholar] [CrossRef]
  42. Parr, R.G.; Yang, W. Density functional approach to the frontier-electron theory of chemical reactivity. J. Am. Chem. Soc. 1984, 106, 4049–4050. [Google Scholar] [CrossRef]
  43. Parr, R.G.; Szentpály, L.V.; Liu, S. Electrophilicity Index. J. Am. Chem. Soc. 1999, 121, 1922–1924. [Google Scholar] [CrossRef]
  44. Parr, R.G.; Yang, W. Density Functional Theory of Atoms and Molecules, 1st ed.; Oxford University Press: Oxford, UK, 1989. [Google Scholar]
  45. Wang, X.; Song, L.; Tian, C.; He, J.; Wang, S.; Wang, J.; Li, C. DFT Investigation of the Effects of Coexisting Cations and Complexing Reagents on Ni(II) Adsorption by a Polyvinylidene Fluoride-Type Chelating Membrane Bearing Poly(Amino Phosphonic Acid) Groups. Metals 2017, 7, 61. [Google Scholar] [CrossRef] [Green Version]
  46. Padmanabhan, J.; Parthasarathi, R.; Subramanian, V.; Chattaraj, P.K. Electrophilicity-Based Charge Transfer Descriptor. J. Phys. Chem. A 2007, 111, 1358–1361. [Google Scholar] [CrossRef] [PubMed]
  47. Molinspiration Molinspiration-Chemoinformatics on the Web. Available online: http://www.molinspiration.com/ (accessed on 28 April 2021).
  48. Weininger, D. Smiles, a chemical language and information system. 1. Introduction to methodology and encoding rules. J. Chem. Inf. Model. 1988, 28, 31–36. [Google Scholar] [CrossRef]
  49. Vanommeslaeghe, K.; Hatcher, E.; Acharya, C.; Kundu, S.; Zhong, S.; Shim, J.; Darian, E.; Guvench, O.; Lopes, P.; Vorobyov, I.; et al. CHARMM general force field: A force field for drug-like molecules compatible with the CHARMM all-atom additive biological force fields. J. Comput. Chem. 2009, 31, 671–690. [Google Scholar] [CrossRef] [PubMed] [Green Version]
  50. Phillips, J.C.; Braun, R.; Wang, W.; Gumbart, J.; Tajkhorshid, E.; Villa, E.; Chipot, C.; Skeel, R.D.; Kalé, L.; Schulten, K. Scalable molecular dynamics with NAMD. J. Comput. Chem. 2005, 26, 1781–1802. [Google Scholar] [CrossRef] [Green Version]
  51. Šali, A.; Blundell, T.L. Comparative Protein Modelling by Satisfaction of Spatial Restraints. J. Mol. Biol. 1993, 234, 779–815. [Google Scholar] [CrossRef]
  52. Da Silva, A.W.S.; Vranken, W.F. ACPYPE-AnteChamber PYthon Parser interfacE. BMC Res. Notes 2012, 5, 367. [Google Scholar] [CrossRef] [Green Version]
  53. Wang, J.; Wang, W.; Kollman, P.A.; Case, D.A. Antechamber: An accessory software package for molecular mechanical calculations. J. Am. Chem. Soc. 2001, 222, U403. [Google Scholar]
  54. Case, D.A.; Ben-Shalom, I.Y.; Brozell, S.R.; Cerutti, D.S.; Cheatham, T.E., III; Cruzeiro, V.W.D.; Darden, T.A.; Duke, R.E.; Ghoreishi, D.; Gilson, M.K. AMBER 2018; University of California: San Francisco, CA, USA, 2018. [Google Scholar]
  55. Elstner, M.; Porezag, D.; Jungnickel, G.; Elsner, J.; Haugk, M.; Frauenheim, T.; Suhai, S.; Seifert, G. Self-consistent-charge density-functional tight-binding method for simulations of complex materials properties. Phys. Rev. B 1998, 58, 7260–7268. [Google Scholar] [CrossRef]
  56. Humphrey, W.; Dalke, A.; Schulten, K. VMD: Visual molecular dynamics. J. Mol. Graph. 1996, 14, 33–38. [Google Scholar] [CrossRef]
  57. Martyna, G.J.; Tobias, D.J.; Klein, M.L. Constant pressure molecular dynamics algorithms. J. Chem. Phys. 1994, 101, 4177–4189. [Google Scholar] [CrossRef]
  58. Feller, S.E.; Zhang, Y.; Pastor, R.W.; Brooks, B.R. Constant pressure molecular dynamics simulation: The Langevin piston method. J. Chem. Phys. 1995, 103, 4613–4621. [Google Scholar] [CrossRef]
  59. Deniz, U.; Ozkirimli, E.; Ulgen, K.O. A systematic methodology for large scale compound screening: A case study on the discovery of novel S1PL inhibitors. J. Mol. Graph. Model. 2016, 63, 110–124. [Google Scholar] [CrossRef] [PubMed]
  60. Baker, N.A.; Sept, D.; Joseph, S.; Holst, M.J.; McCammon, J.A. Electrostatics of nanosystems: Application to microtubules and the ribosome. Proc. Natl. Acad. Sci. USA 2001, 98, 10037–10041. [Google Scholar] [CrossRef] [PubMed] [Green Version]
  61. Hou, T.; Wang, J.; Li, Y.; Wang, W. Assessing the Performance of the MM/PBSA and MM/GBSA Methods. 1. The Accuracy of Binding Free Energy Calculations Based on Molecular Dynamics Simulations. J. Chem. Inf. Model. 2010, 51, 69–82. [Google Scholar] [CrossRef]
  62. Liu, H.; Hou, T. CaFE: A tool for binding affinity prediction using end-point free energy methods. Bioinformatics 2016, 32, 2216–2218. [Google Scholar] [CrossRef] [Green Version]
  63. Li, Y.; Liu, Y.; Wang, H.; Xiong, X.; Wei, P.; Li, F. Synthesis, Crystal Structure, Vibration Spectral, and DFT Studies of 4-Aminoantipyrine and Its Derivatives. Molecules 2013, 18, 877–893. [Google Scholar] [CrossRef]
  64. Ertl, P. Polar Surface Area; Wiley-VCH Verlag GmbH & Co. KGaA: Weinheim, Germany, 2008. [Google Scholar]
  65. Blake, J.F. Chemoinformatics–predicting the physicochemical properties of ’drug-like’ molecules. Curr. Opin. Biotechnol. 2000, 11, 104–107. [Google Scholar] [CrossRef]
  66. Clark, D.E.; Pickett, S.D. Computational methods for the prediction of ‘drug-likeness’. Drug Discov. Today 2000, 5, 49–58. [Google Scholar] [CrossRef]
  67. Bickerton, G.R.; Paolini, G.V.; Besnard, J.; Muresan, S.; Hopkins, A.L. Quantifying the chemical beauty of drugs. Nat. Chem. 2012, 4, 90–98. [Google Scholar] [CrossRef] [Green Version]
  68. Thomas, G. Fundamentals of Medicinal Chemistry; John Wiley & Sons: Hoboken, NJ, USA, 2004; ISBN 0470871695. [Google Scholar]
  69. Sim, L.; Quezada-Calvillo, R.; Sterchi, E.E.; Nichols, B.L.; Rose, D.R. Human Intestinal Maltase–Glucoamylase: Crystal Structure of the N-Terminal Catalytic Subunit and Basis of Inhibition and Substrate Specificity. J. Mol. Biol. 2008, 375, 782–792. [Google Scholar] [CrossRef]
  70. Lipinski, C.A.; Lombardo, F.; Dominy, B.W.; Feeney, P.J. Experimental and computational approaches to estimate solubility and permeability in drug discovery and development settings. Adv. Drug Deliv. Rev. 1997, 23, 3–25. [Google Scholar] [CrossRef]
  71. Lipinski, C.A.; Lombardo, F.; Dominy, B.W.; Feeney, P.J. Experimental and computational approaches to estimate solubility and permeability in drug discovery and development settings. Adv. Drug Deliv. Rev. 2012, 64, 4–17. [Google Scholar] [CrossRef]
  72. Landeros-Martinez, L.-L.; Glossman-Mitnik, D.; Orrantia-Borunda, E.; Flores-Holguin, N. Molecular Docking; IntechOpen: London, UK, 2018. [Google Scholar]
  73. Snyder, P.W.; Mecinović, J.; Moustakas, D.T.; Thomas, S.W.; Harder, M.; Mack, E.T.; Lockett, M.R.; Héroux, A.; Sherman, W.; Whitesides, G.M. Mechanism of the hydrophobic effect in the biomolecular recognition of arylsulfonamides by carbonic anhydrase. Proc. Natl. Acad. Sci. USA 2011, 108, 17889–17894. [Google Scholar] [CrossRef] [Green Version]
  74. Hou, T.; Guo, S.; Xu, X. Predictions of Binding of a Diverse Set of Ligands to Gelatinase-A by a Combination of Molecular Dynamics and Continuum Solvent Models. J. Phys. Chem. B 2002, 106, 5527–5535. [Google Scholar] [CrossRef] [Green Version]
  75. Wang, W.; Kollman, P.A. Computational study of protein specificity: The molecular basis of HIV-1 protease drug resistance. Proc. Natl. Acad. Sci. USA 2001, 98, 14937–14942. [Google Scholar] [CrossRef] [Green Version]
  76. Kuhn, B.; Kollman, P.A. Binding of a Diverse Set of Ligands to Avidin and Streptavidin: An Accurate Quantitative Prediction of Their Relative Affinities by a Combination of Molecular Mechanics and Continuum Solvent Models. J. Med. Chem. 2000, 43, 3786–3791. [Google Scholar] [CrossRef]
  77. Patra, N.; Ioannidis, E.I.; Kulik, H.J. Computational Investigation of the Interplay of Substrate Positioning and Reactivity in Catechol O-Methyltransferase. PLoS ONE 2016, 11, e0161868. [Google Scholar] [CrossRef]
  78. Reverri, E.J.; Randolph, J.M.; Kappagoda, C.T.; Park, E.; Edirisinghe, I.; Burton-Freeman, B.M. Assessing beans as a source of intrinsic fiber on satiety in men and women with metabolic syndrome. Appetite 2017, 118, 75–81. [Google Scholar] [CrossRef]
  79. Baig, I. Phytochemical Studies on Ferula Mongolica and Other Mongolian Medicinal Plants. Ph.D. Thesis, University of Karachi, Karachi, Pakistan, 2002. [Google Scholar]
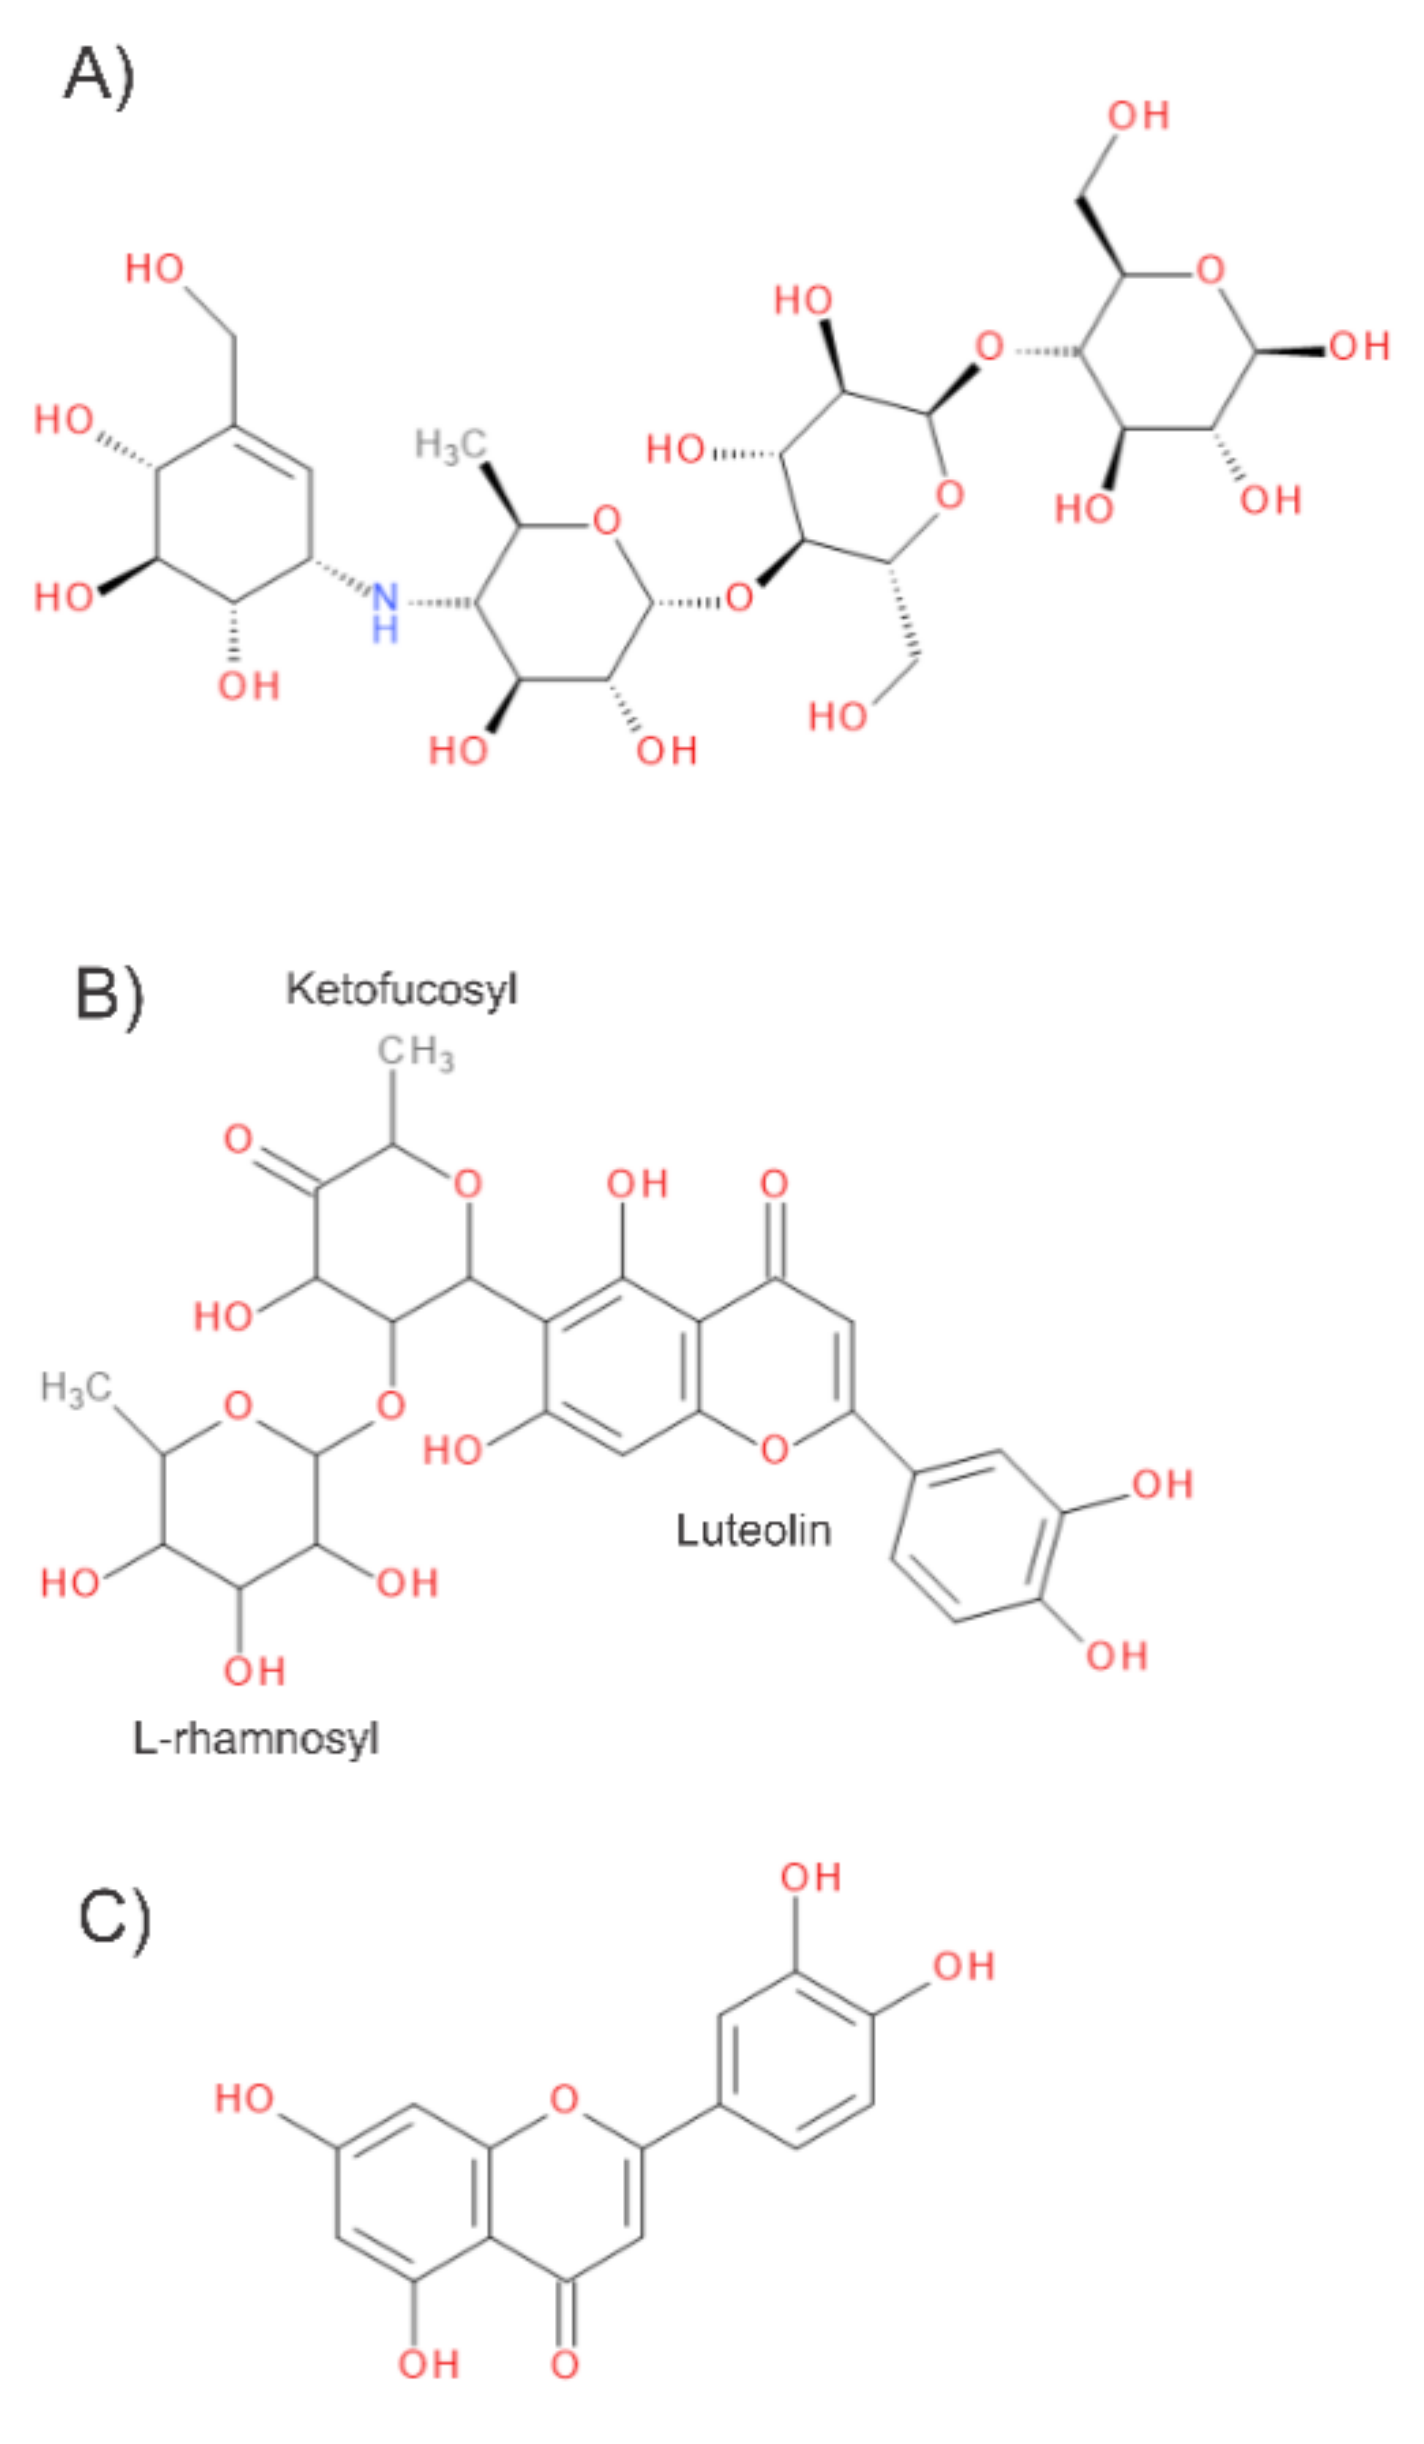
Scheme 1. Molecular structure of (A) acarbose (ACA), (B) maysin (MAY), and (C) luteolin (LUT).
Applsci 11 04067 sch001
Figure 1. Optimized molecular structure of the ligands at the M06/6-31G(d) level of theory: (A) acarbose (ACA), (B) maysin (MAY), and (C) luteolin (LUT).
Applsci 11 04067 g001
Figure 2. Frontier Molecular Orbitals for (A) acarbose (ACA), (B) maysin (MAY), and (C) luteolin (LUT) calculated with the M06/6-31G (d) level of theory.
Applsci 11 04067 g002
Figure 3. Electrostatic potential mapped on the electron density surface for (A) acarbose (ACA), (B) maysin (MAY) and (C) luteolin (LUT) calculated at the M06/6-31G(d) level of theory. The color range represents values from −4.000 × 10⁻² to 5.000 × 10⁻²: blue = hydrogen donor zones and red = hydrogen acceptor zones.
Applsci 11 04067 g003
Figure 4. Amino acids of the active site of the maltase-glucoamylase (NtMGAM), with (A) acarbose (ACA), (B) maysin (MAY), and (C) luteolin (LUT), and the calculated binding energy values.
Applsci 11 04067 g004
Figure 5. Hydrogen bonds and π-π interaction between the active site of maltase-glucoamylase and (A) acarbose (ACA), (B) maysin (MAY), and (C) luteolin (LUT).
Applsci 11 04067 g005
Figure 6. RMSD values of MD simulations (A) for the atoms of the complexes of acarbose (ACA), maysin (MAY), and luteolin (LUT) with maltase-glucoamylase (NtMGAM) (B) RMSD variations after 125 ns calculated over the atoms of the ligands.
Applsci 11 04067 g006
Figure 7. Distribution of residues-ligand distances in (A) MAY and (C) ACA and distance versus simulation time of (B) MAY and (D) ACA.
Applsci 11 04067 g007
Figure 8. Number of water molecules within a distance of 6 Amstrongs from the Asp443 residue, this graph shows how the number of waters decreases in ACA compared to the control protein, unlike MAY which increases the number of waters.
Applsci 11 04067 g008
Figure 9. Convergence analysis for the Gbind calculation. Gbind value versus MD snapshots evaluated for the case of luteolin.
Applsci 11 04067 g009
Table 1. Analysis of molecular interactions between the maltase-glucoamylase (NtMGAM PDB ID: 2MQJ) and acarbose (ACA), maysin (MAY), and luteolin (LUT) provided by molecular docking simulations.
LigandBinding Energy (kcal/mol)Active Site* Experimental
ACA−7.8Asp203, Thr205, Tyr299, Asp327, Asp443, Met444, Arg526, Asp542, Trp539, Th544, Phe575, Ala576, His600Asp203, Tyr299, Asp327, Trp441, Asp443, Arg526, Asp542, Asp571, Phe575, His600, Tyr 605
MAY−9.1Arg202, Thr204, Thr205, Tyr299, Asp327, Trp406, Lys480, Asp542
LUT−7.7Tyr299, Ile364, Trp406, Asp443, Arg526, Phe575, Gln603
* Sim, L.; Quezada-Calvillo, R.; Sterchi, E.E.; Nichols, B.L.; Rose, D.R. J Mol Biol. 2008, 375, 782–792.
Table 2. Reactivity parameters of docked ligands at M06/6-31G(d) level theory. Electron affinity (EA), ionization potential (IP), chemical hardness (η), electronegativity (χ), electrophilicity (ω), and chemical potential (µ). All values are presented in eV.
LigandEAIPηχωμ
ACA0.216.142.973.171.70−3.17
MAY1.806.342.274.073.65−4.04
LUT1.706.352.324.033.49−4.03
Table 3. Reactivity parameters and charge transfer descriptor calculated for amino acids of the maltase-glucoamylase (NtMGAM) interacting with acarbose (ACA), maysin (MAY), and luteolin (LUT). Chemical hardness (η), chemical potential (µ), and charge transfer (ΔN). The values of η and µ are presented in eV.
LigandActive SiteημΔN
ACAAsp2032.90−2.780.033
Thr2052.36−3.110.006
Tyr2992.67−3.61−0.039
Asp3272.71−2.810.032
Asp443-Met4442.85−2.850.027
Arg5263.43−3.82−0.051
Trp5392.58−3.19−0.002
Asp5422.71−2.990.016
Thr5443.27−3.81−0.051
Phe575-Ala5762.89−3.50−0.028
His6002.90−3.60−0.037
MAY
-3.85
Arg202-Asp2032.51−3.430.067
Thr204-Thr2052.33−3.240.090
Tyr2992.67−3.610.047
Asp3272.71−2.810.127
Trp4062.56−3.370.072
Asp4432.84−2.840.123
Lys4802.97−3.630.042
Asp5422.71−2.940.113
LUTTyr2992.67−3.610.047
Ile3643.33−3.620.036
Trp4062.56−3.370.068
Asp4432.77−2.740.127
Ser4483.31−3.960.006
Arg5263.43−3.820.018
Phe5752.91−3.700.032
Gln6033.20−3.950.007
Table 4. Hydrogen bond occupancies of the MD trajectories in ACA, MAY, and LUT with amino acids of the active site.
Occupancy (%)
Amino acidsACALUTMAY
Asp44398.3099.244.07
Asp32781.090.0089.11
Asp2030.000.1860.08
Asp5423.5621.1217.48
Glu3000.0011.8024.59
His6000.000.000.00
Table 5. Binding free energy contributions for ACA, LUT, and MAY complexes. All energies are in kcal/mol.
LigandvdWelecPBSAGgasGsolvGbind
ACA−20.6092−106.5299113.4123−5.1635−127.1391108.2488−18.8903
LUT−1.6924−106.797693.7014−3.3515−108.490090.3499−18.1401
MAY−22.3635−51.077672.2392−4.2913−73.441167.9480−5.0346
Publisher’s Note: MDPI stays neutral with regard to jurisdictional claims in published maps and institutional affiliations.