3.1. Results of Comparison among EMD, EEMD, CEEMD and N-A MEMD
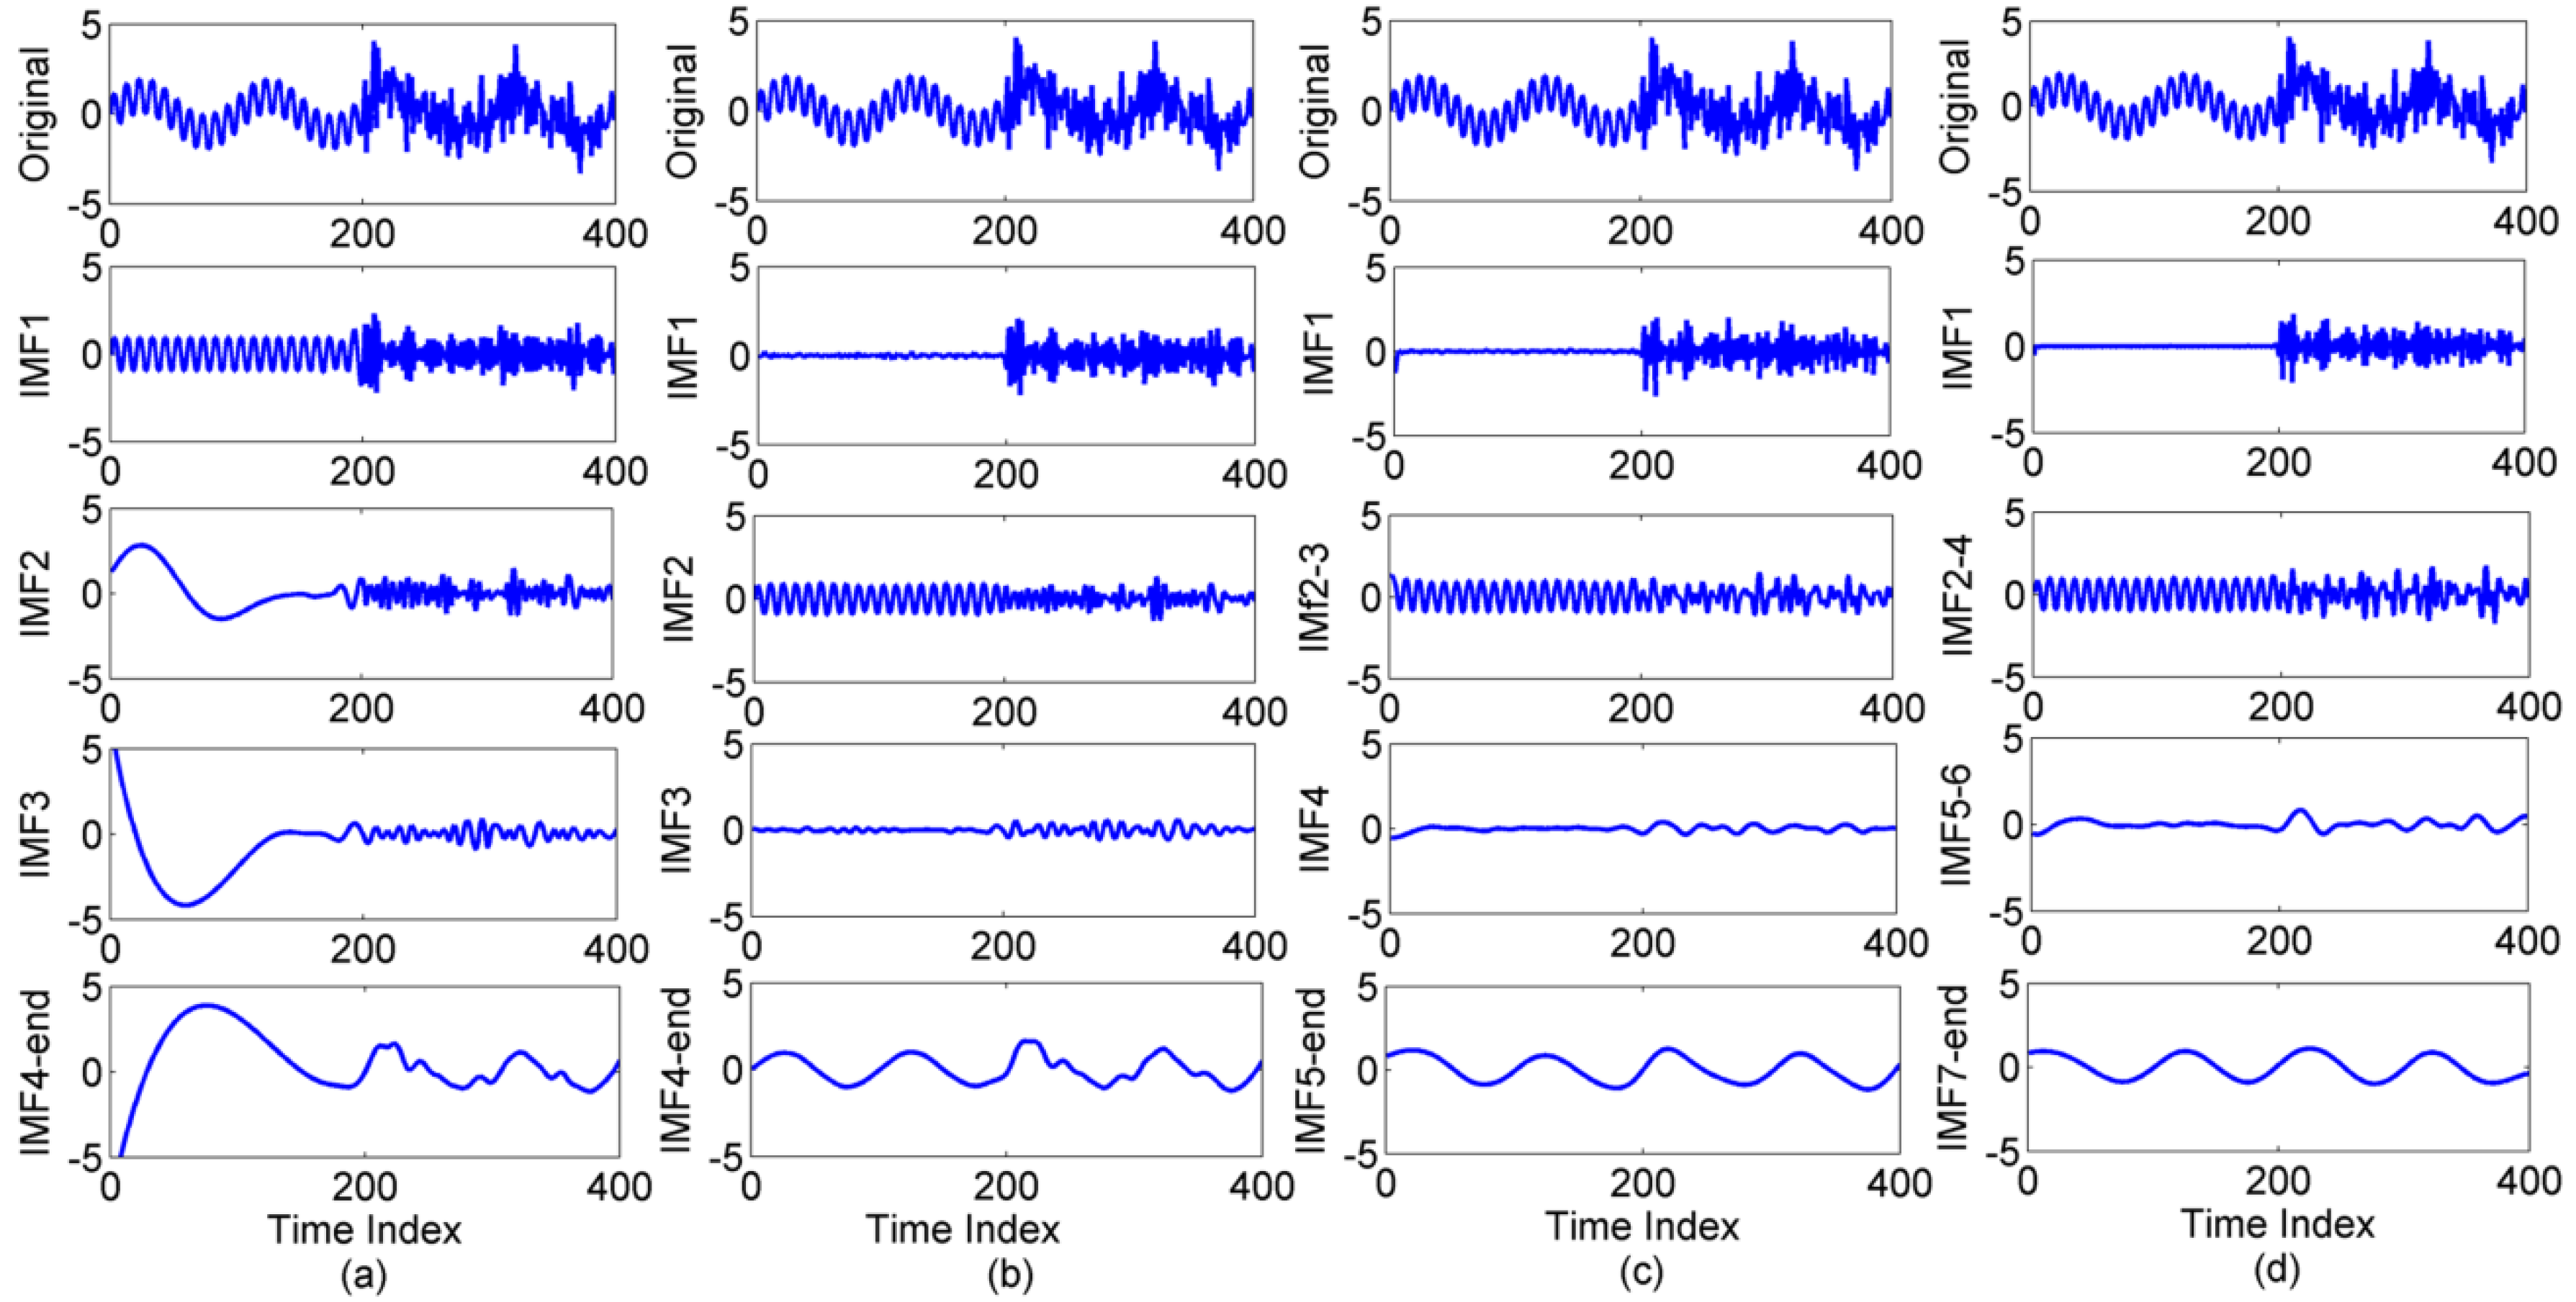
Since extended EMD methods have been applied to the analysis and processing of various human physiological signals, it is important to figure out the performances and advantages of these extended EMD methods in the analysis of signals disturbed by noise. Thus, a comparison among them is essential. First of all, a comparison of performance in extracting simulated complex signal is presented among EMD, EEMD, CEEMD and N-A MEMD. The complex signal consists of three kinds of signals, which are sine waves with frequency 2 Hz and 20 Hz, and a white Gaussian noise, with which the first half part is composed by the two different frequency sine waves, and the latter half part is constituted by the sine wave with 2 Hz and the white Gaussian noise. This is shown in the first row of each column in
Figure 1. To decompose and reconstruct the two sine waves, the EMD, EEMD, CEEMD and N-A MEMD are employed on the complex signal. On the basis of the frequency and amplitude of IMFs, the reconstructed results are shown in
Figure 1. It is evident that EMD is useful for the sine waves of high frequency because the 20 Hz signal appears in the IMF1 immediately. Nevertheless, the 2 Hz sine wave as the background signal obtained by EMD is not detectable as shown in IMF2, 3, 4 of
Figure 1(a). IMF1s in EEMD, CEEMD and N-A MEMD have clear white Gaussian noise results in the last half part, and the N-A MEMD has the best IMF1 in the first half part which is almost equal to zero. In
Figure 1 (b)(c), the first half parts in IMF1s of the EEMD and CEEMD still retain the noise interferences, but this situation is eliminated by N-A MEMD, as shown in IMF1 of
Figure 1(d). It is obvious that the two distinct sine waves are reconstructed by the combination of the different IMFs generated from EEMD (
i.e., IMF2 and IMF4-end), CEEMD (
i.e., IMF2-3 and IMF5-end) and N-A MEMD (
i.e., IMF2-4 and IMF7-end), which are depicted in the third and fifth row of
Figure 1(b–d). IMFs separated by the extended EMD are ensembles of many EMD decompositions into mixtures of the signal and different added white noises. The complicated signals, which may contain many intrinsic mode functions and are coupled with different added white noises, generate distinctive combinations of IMFs in extended EMD. Therefore, an intrinsic component of the original signal may appear in different orders through different EMD decompositions because of the coupling with different added noises. Two IMFs sharing the same frequency give good results when an intrinsic component is decomposed into two or three IMFs. In
Figure 1, IMF2-3 in CEEMD and IMF2-4 in N-A MEMD sharing the same frequency are obvious examples of this phenomenon. This is not a big problem to deal with. The two or three IMFs sharing the same frequency can be merged together as a single IMF. Moreover, according to the difference between the two sine waves in frequency domain and the feature of acting as a dyadic filter bank in these extended EMD methods [
13], the sine waves with 20 Hz and 2 Hz are involved in the front and back of IMFs respectively. In
Figure 1(b–d), it is evident that there are IMFs with the low amplitude and the frequency between 20 Hz and 2 Hz in the middle of the two reconstructed sine waves, by which a specific division appears in the amplitude and frequency domains.
Figure 1.
Comparison among extended EMD methods: (a) EMD, (b) EEMD, (c) CEEMD and (d) N-A MEMD used for decomposing and reconstructing two different sine waves of 2 Hz and 20 Hz, respectively, from a complex original signal which has the first half part consisting of two different sine waves, and the last half part is the 2 Hz sine wave disturbed by a white Gaussian noise.
To estimate the effectiveness of these methods, the statistical similarities between original sine waves and results reconstructed by the extended EMD methods are calculated as shown in
Table 1. Aside from the fact that the EMD has no result for the sine wave with 2 Hz in
Figure 1(a), the correlation between original signals and reconstructed sine waves represents the performance of each extended EMD method in filtering noise and reconstructing signals. In summary, the N-A MEMD has the optimal performance in extracting the two sine waves with the different frequencies from the complex signals, and the sine wave with low frequency reconstructed by the CEEMD is better than the EEMD one, nevertheless, the order from best to worst performance in reconstructing the sine wave with the high frequency is the following sequence: CEEMD, EMD and EEMD.
Table 1.
Correlation coefficient of oEEG vs. rEEG signals within 2 Hz and 20Hz.
Table 1.
Correlation coefficient of oEEG vs. rEEG signals within 2 Hz and 20Hz.
| Methods | 2 Hz | 20 Hz |
|---|
| EMD | N/A | 0.9846 |
| EEMD | 0.9449 | 0.9907 |
| CEEMD | 0.9627 | 0.9826 |
| N-A MEMD | 0.9674 | 0.9943 |
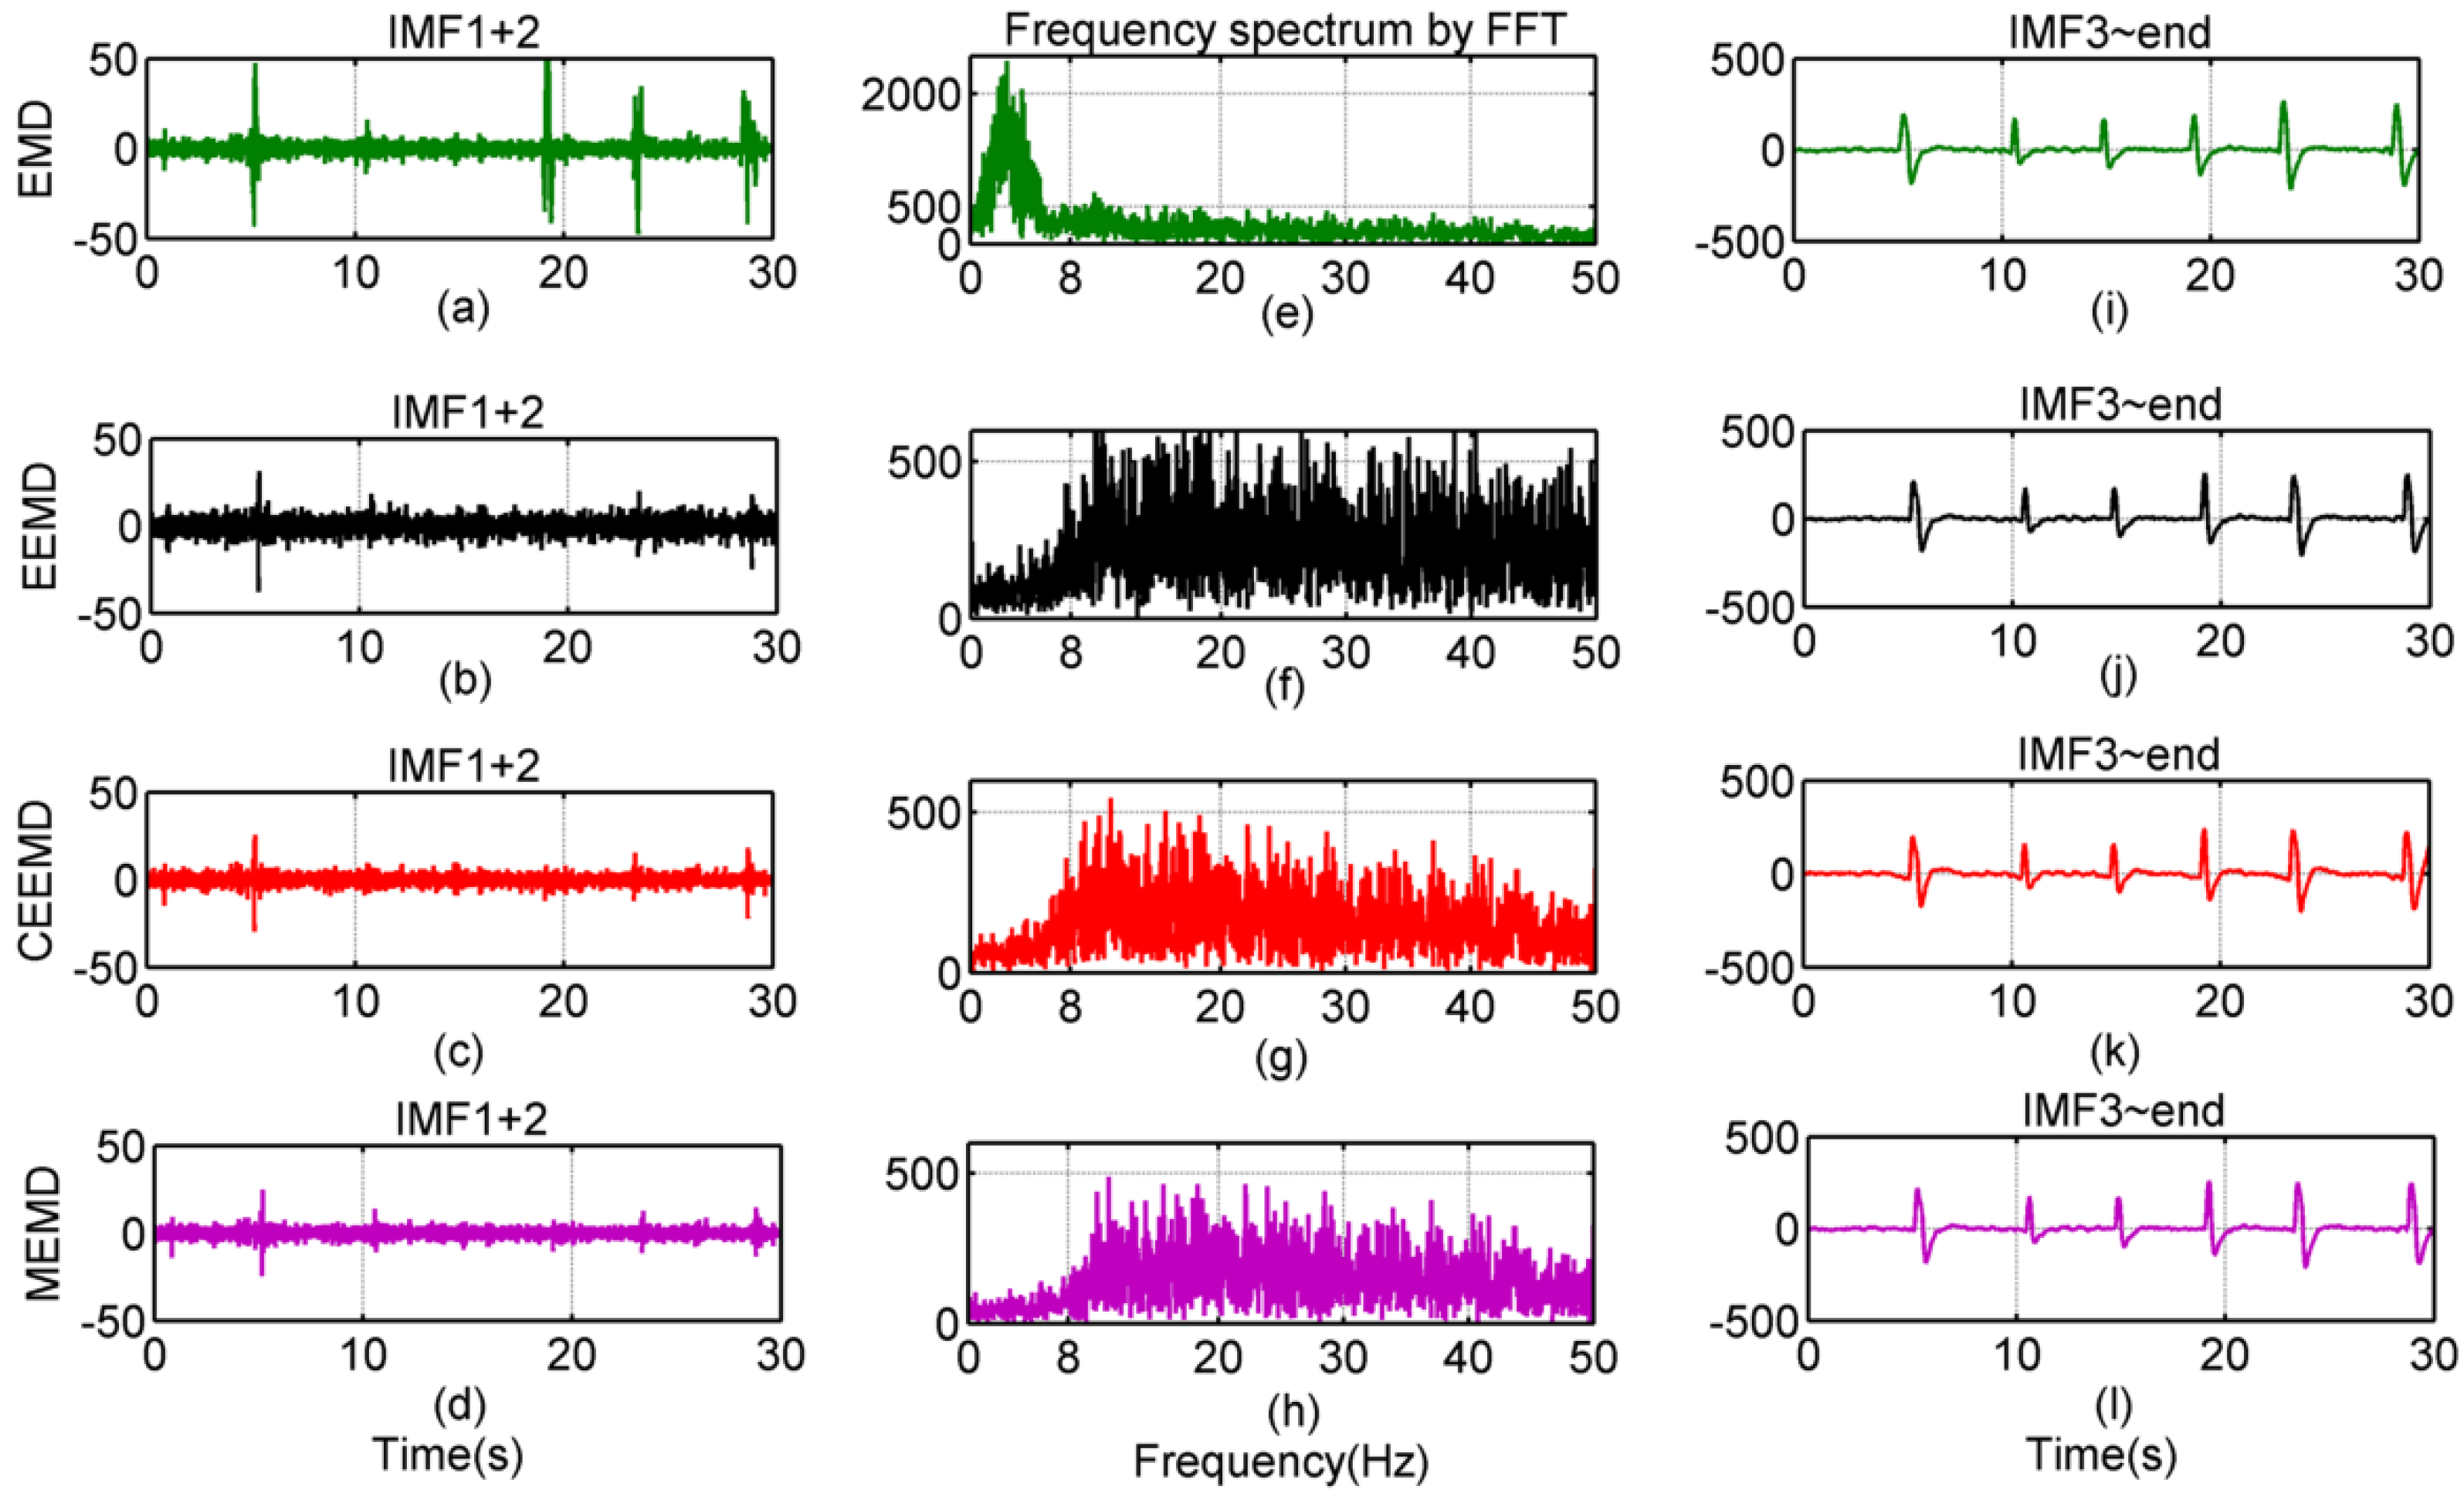
After the simulation with normal signals, the extended EMD methods were applied to the analysis of real EEG signals. Twenty cases of 30 s oEEG signals were collected before the surgery when the patients had consciousness and closed eyes. Then a 30s EOG while eyes were blinking was filtered by a low-pass FIR filter with a 50 Hz cutoff frequency so as to filter out the high frequency noises. According to the amplitude and frequency band of the results analyzed using the EMD and its extended methods, the rEEG and EOG are composed of the combination of IMFs decomposed using EMD, EEMD, CEEMD and N-A MEMD (
i.e., IMF1-2 and IMF3-end), which are displayed in the first and third columns of
Figure 2. The frequency spectrum of the EEG reconstructed using each method in the first column is shown in the middle column of
Figure 2, respectively. Compared to the oEEG, the spectrum in
Figure 2(e) loses the high magnitude signals at 8~13 Hz; in
Figure 2(f), there exists an intensive disturbance of added white noises; only the results in
Figure 2(g)(h) include the high magnitude signals ranging from 8 to 20 Hz. Despite the oEEG and rEEG passed the test of normal distribution in a one-sample Kolmogorov-Smirnov test, the Wilcoxon non-parametric test is still employed to figure out the differences between oEEG and rEEG. The distributions of SampEn of oEEG and rEEG by EMD, EEMD, CEEMD and N-A MEMD in the twenty cases are shown in
Figure 3a. Consequently, through the Wilcoxon non-parametric test, it illustrates that EMD and N-A MEMD (
P = 0.065 and
P = 0.212, respectively) are better than EEMD and CEEMD (
P = 0.001 and
P = 0.008 respectively) in reconstructing EEGs. Even though, it is apparent that the deviation in EMD is the biggest in all of them, and the coefficients of variance in the distribution of
Figure 3(a) are 0.06, 0.25, 0.02, 0.05 and 0.06 in that order. Moreover, both EEMD and CEEMD have added white noises in the decomposition stage, so there is an increase in the averaged SampEn of rEEG. Furthermore, sometimes IMF1 decomposed by EMD consists of the intrinsic high frequency components, which are disabled to express the rhythmic activities in the frequency range of 8~13Hz. Therefore, only SampEn of the rEEG using N-A MEMD has effectively and significantly no difference with that of oEEG. So that the EOG reconstructed using N-A MEMD also has the better correlation coefficient with the added EOG compared to EMD and CEEMD as shown in
Figure 3(b). To conclude, the N-A MEMD is more effective for reconstructing the EEG and EOG signals than the other extended EMD methods.
Figure 2.
The rEEG and EOG analyzed by EMD, EEMD, CEEMD and N-A MEMD, respectively.
Figure 2.
The rEEG and EOG analyzed by EMD, EEMD, CEEMD and N-A MEMD, respectively.
Figure 3.
Comparison of the performance among EMD, EEMD, CEEMD and N-A MEMD in extracting EEG and EOG. (a) The distribution of sample entropy of the oEEG and rEEG, and (b) the correlation between original and reconstructed EOG by EMD, EEMD, CEEMD and N-A MEMD in twenty cases.
Figure 3.
Comparison of the performance among EMD, EEMD, CEEMD and N-A MEMD in extracting EEG and EOG. (a) The distribution of sample entropy of the oEEG and rEEG, and (b) the correlation between original and reconstructed EOG by EMD, EEMD, CEEMD and N-A MEMD in twenty cases.
3.2. Results of the Application in Clinical EEG Recordings
This study was approved by the Research Ethics Review Committee of the Far Eastern Memorial Hospital (No. 099035-F). Participants and parents of minor participants were given adequate information before participating and freely signed a consent form approved by the ethics committee. After obtaining the written informed consent, EEG signals were collected from twenty patients, whose ages ranged from 15 to 60, undergoing urological surgery with general anesthesia. The EEG monitoring device is the Datex-Ohmeda S/5
TM Compact Anesthesia Monitor, which has an EEG sampling rate of 100 Hz. The anesthetic used in the operations is propofol. According to the standard operation procedure, the process is divided into four stages: the pre-operation, induction, maintenance and recovery. During the pre-operation stage, patients always answered some questions during consciousness, thus the EEG signals were disturbed by the EOG and EMG at that time. During the induction stage and at the beginning of maintenance stage, movement of the patients’ head caused by the intubation also disturbs the EEG signals badly. Finally, during the recovery stage, the EEG signals are clearer than other stages because of the closure of the operation. In this paper, one EEG recording case was considered for a female patient, aged 52.
Figure 4(a) displays the oEEG signals and the responses of the interferences occurring during the surgery. The results show that the rEEG signals are almost clean from EOG interferences, except for the movement caused by intubation during the induction and maintenance, shown in
Figure 4(b). Moreover, the spectrum of EEG before and after analysis by N-A MEMD is shown in
Figure 4(c), clearly most of the rEEG magnitudes have decreased over whole frequency range, in particular, in high frequency.
Figure 4.
An EEG recording of a female patient, age 52 undergoing the urological surgery. (a) oEEG signals. (b) rEEG signals processed by N-A MEMD. (c) spectrum of (a) and (b).
Figure 4.
An EEG recording of a female patient, age 52 undergoing the urological surgery. (a) oEEG signals. (b) rEEG signals processed by N-A MEMD. (c) spectrum of (a) and (b).
Consequently, the SampEn method is employed to analyze the DOA based on the rEEG signals. In [
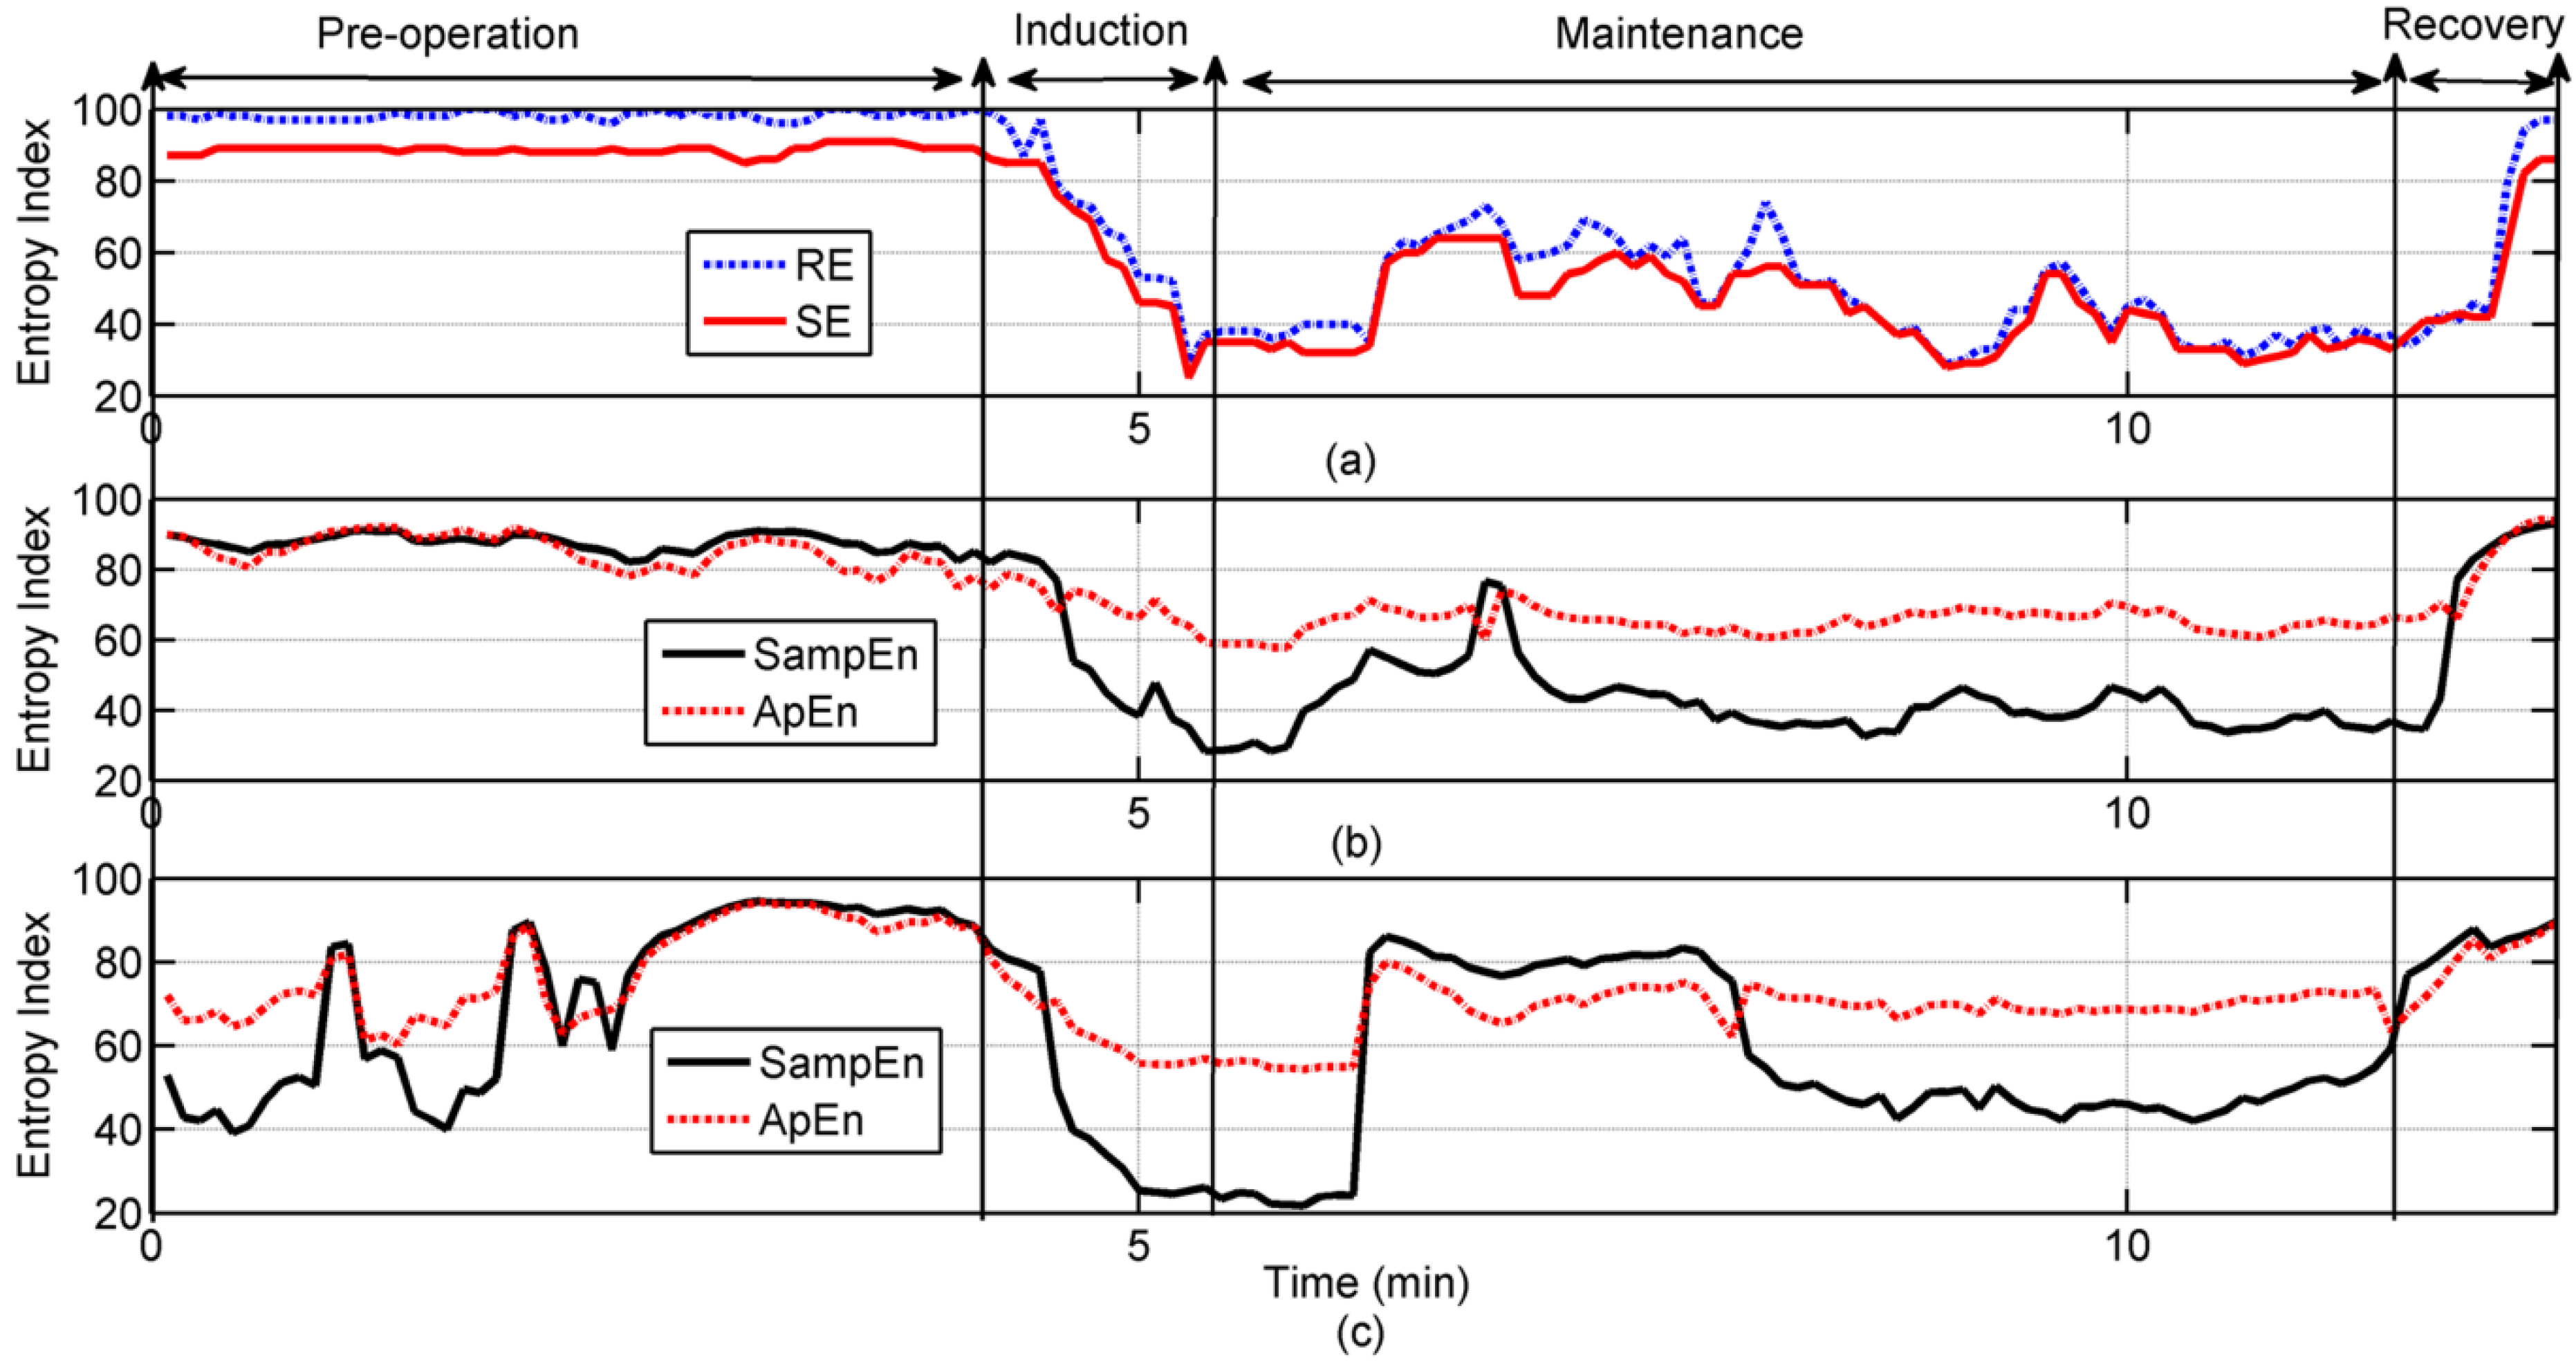
14], a system has been designed to monitor the EEG and DOA through SampEn in real time. The results have the same trend as RE and SE recorded every five seconds recorded by the system, however, the impacts of EMG and EOG still exist, even if a low-pass filter is used offline. Therefore, the extended EMD methods are useful to resolve this problem. In this study, the ApEn is also utilized to compare with SampEn in monitoring DOA of reconstructed and oEEG signals, in which the parameter r is set to 0.15 and m is 2. In order to be consistent with the RE and SE recordings and meet the requirement of ApEn with respect to the length of data, a time window of 30 seconds including 3,000 points of EEG signals is established for calculation, and it moves once every five seconds for real time analysis. In
Figure 5, the real time RE and SE recordings of the same female patient mentioned above are depicted in the blue dashed line and red solid line, respectively, in
Figure 5(a); while the SampEn and ApEn of the corresponding oEEG and rEEG signals are expressed in the black solid line and red dashed line in
Figure 5(b)(c). Comparing
Figure 5(b) to
Figure 5(c), the impacts of disturbances in the pre-operation and maintenance are dismissed basically, both SampEn and ApEn have the same trend with the RE and SE. Even so, the SampEn has better performance than the ApEn in sensitivity to the consciousness of the patients and DOA, as shown in
Figure 5(b).
Figure 5.
Comparison of the SampEn and ApEn in the oEEG and rEEG. (a) The real time RE and SE recording from the device Datex-Ohmeda S/5. (b) SampEn and ApEn of the rEEG; (c) SampEn and ApEn of the oEEG.
Figure 5.
Comparison of the SampEn and ApEn in the oEEG and rEEG. (a) The real time RE and SE recording from the device Datex-Ohmeda S/5. (b) SampEn and ApEn of the rEEG; (c) SampEn and ApEn of the oEEG.
In order to figure out the relationship among RE/SE, SampEn and ApEn in monitoring DOA, the results of twenty patients in the pre-operation and maintenance stages were calculated statistically, because the time of intubation and recovery are very short and the other two processes of operation are relatively stable for all patients during surgeries. The outcome of the test of Pearson’s correlation among RE/SE, SampEn and ApEn of the oEEG and rEEG in the two processes of operation are shown in
Table 2 and
Table 3. It is evident that both the SampEn and ApEn of the rEEG signals have a linear relationship with the RE/ SE during the pre-operation of surgery (r > 0.7; α = 0.01 and r > 0.3; α = 0.01, respectively), which indicates the importance of reconstructing EEG using N-A MEMD in the pre-operation process. Besides, only SampEn is linearly related to RE/SE during the maintenance of surgery (α = 0.01), though the oEEG (r > 0.7) has bigger correlation coefficient compared to the rEEG (r > 0.4) in this process. According to the statistical analysis results, not only are the EOG and the EMG interferences in the pre-operation eliminated by the N-A MEMD, but the SampEn is also a better entropy index than ApEn in monitoring the status of patients undergoing general anesthesia.
Table 2.
Statistical significance of RE/SE vs. SampEn/ApEn during the Pre-operation.
Table 2.
Statistical significance of RE/SE vs. SampEn/ApEn during the Pre-operation.
| | oEEG | rEEG |
|---|
| Entropy | SampEn | ApEn | SampEn | ApEn |
| Index | 71.7 ± 20.32 | 77.77 ± 11.0 | 86.53 ± 5.29 | 84.08 ± 5.7 |
| RE | 0.254b | 0.241b | 0.746a | 0.406a |
| 97.16 ± 4.46 |
| SE | 0.246b | 0.236b | 0.740a | 0.370a |
| 87.86 ± 3.09 |
Table 3.
Statistical significance of RE/SE vs. SampEn/ApEn during the Maintenance.
Table 3.
Statistical significance of RE/SE vs. SampEn/ApEn during the Maintenance.
| | oEEG | rEEG |
|---|
| Entropy | SampEn | ApEn | SampEn | ApEn |
| Index | 60. 24 ± 16.8 | 70.48 ± 3.14 | 43.065 ± 8.8 | 65.66 ± 3.14 |
| RE | 0.724a | 0.304b | 0.495a | 0.007c |
| 50.25 ± 13.1 |
| SE | 0.717a | 0.312b | 0.507a | 0.034c |
| 46.4 ± 11.21 |


 ,
, 


