Abstract
We propose a novel approach framed in terms of information theory and entropy to tackle the issue of the propagation of conspiracy theories. We represent the initial report of an event (such as the 9/11 terroristic attack) as a series of strings of information, each string classified by a two-state variable Ei = ±1, i = 1, …, N. If the values of the Ei are set to −1 for all strings, a state of minimum entropy is achieved. Comments on the report, focusing repeatedly on several strings Ek, might alternate their meaning (from −1 to +1). The representation of the event is turned fuzzy with an increased entropy value. Beyond some threshold value of entropy, chosen by simplicity to its maximum value, meaning N/2 variables with Ei = 1, the chance is created that a conspiracy theory might be initiated/propagated. Therefore, the evolution of the associated entropy is a way to measure the degree of penetration of a conspiracy theory. Our general framework relies on online content made voluntarily available by crowds of people, in response to some news or blog articles published by official news agencies. We apply different aggregation levels (comment, person, discussion thread) and discuss the associated patterns of entropy change.
PACS Codes:
9.75.-k; 89.75.Da; 89.75.Fb; 89.75.Hc; 89.75.Kd
1. Introduction
While conspiracy theories have existed for centuries, the phenomena were limited to small groups of people due to the slow process of spreading based mainly on word-of-mouth propagation. However, the recent use of the Internet by conspiracy theorists has increased the speed of propagation and the number of people exposed to a rumor. Moreover, in the new context of global terrorism, the existence of conspiracy theories disseminated in the population became a problem for democratic societies in their fight against terrorism.
The propagation of conspiratorial beliefs has been previously investigated in [1,2] in terms of the spread of a minority opinion. Conspiracy formation and spread is of strategic importance at different levels of our globalized society. Of special interest is the shift in public opinion that the presence of conspiracy theories can initiate [3]. Therefore, we are searching for a robust and generic technique to distinguish between opinions for and against each such theory. There are a number of polls and barometers which are querying the public, not only about conspiracy theories, but also about the usage of violence in political and social conflicts; there are also many other indicators of political attitudes. An original research by Bessi et al. [4] showed how information related to conspiratorial news is consumed on Facebook. However, it is difficult to find a way to combine these sources of information.
We propose a novel approach, framed in terms of information theory and entropy, to describe the propagation of conspiracy theories. Our approach starts with the published report of a terroristic event (such as the 9/11 terroristic attack in the USA) represented as a series of individual strings of information, each classified by a two-state variable Ei = ±1 with i = 1, …, N. An official report would be characterized by value Ei= −1 assigned to all strings, resulting in the average order parameter E = <Ei> = −1, i.e., a fully ordered state, with minimum entropy. This would result in a clear and unambiguous reading and understanding of the event. However, conspiracy theorists might seize this initial presentation, focusing on a series of information strings Ei = −1 to question their content and change their classification (i.e., from −1 to +1).
A number of articles would then appear propagating different levels of conspiratorial beliefs and accompanied by the comments of the readers who argue in favor or against the new content. The entropy of such a textual corpus is no longer of minimum value. Beyond some threshold value, which for simplicity we choose to be zero, meaning half the variables having been changed to +1, total doubt prevails in the reading of the event. The evolution of the associated entropy offers a way to measure the degree of penetration of a conspiracy theory.
Our general framework relies on online content made voluntarily available by crowds of people, in response to some news or blog articles published by official news agencies. We apply different aggregation levels (comment, person, discussion thread) when analyzing the change of entropy of the entire corpus.
As opposed to studies where the interactions between agents are more or less complex versions of contagion, the opinion dynamics uncovered by our study displays a variety of interactions that differ by the number of participants, their attitudes and the nature of their arguments. In particular, some of the arguments have a more informational character while others originate in, or address, subjective states and experiences. Thus, the modeling of the interaction process and its outcome will have to transcend the mechanical models of direct percolation and yet include elements precise enough to allow quantitative evaluations and predictions.
An interesting model that applies the minimax entropy model to improve the quality of the noisy labels obtained during crowdsourcing acquisition has been recently reported in [5]. They have assumed a probability distribution over workers, items and labels. The minimax entropy approach assumes establishment of the ground truth at minimum entropy and generation of the entire probability distribution of the worker-item label models from the maximum entropy. To make a remote parallel with such a model, we could exchange workers with on-line commentators, items with the comments under discussions, and labels with rating/likes that the commentators give to the comments. We intend to work on this formalization in the future.
In the current paper, we develop the concept of entropy as a measure of penetration of conspiratorial beliefs, and we empirically validate many aspects of the procedure. However, a full integration of those basic steps in a coherent and feasible procedure has yet to be developed.
The content of the paper is as follows. In order to build up the empirical base of the model, we chose to concentrate on the case of 9/11 conspiracy theories. In Section 2, we discuss background information about 9/11 conspiratorial beliefs coming from public opinion polls which, unfortunately, turn out to be very scarce. This lack of official indicators about the level of penetration and dynamics of propagation of conspiracy theories is indeed one of the reasons to propose an alternative opinion mining method. In Section 3, we present the data used to construct the model. We analyzed two news articles about 9/11 conspiracies and the commentaries upon those articles as described in Section 3.1 and Section 3.2. In Section 3.3 we summarize the outcome of the data analysis, which is taken as qualitative information to construct the model presented in Section 4. We define and describe the first steps towards a formalism that parallels the Shannon entropy for communication in order to encode the amount of congeniality of the commentaries with conspiracy theories. We apply different aggregation levels (calculating <Ei> per set of 20 consecutive comments, set of comments of one person, set of comments that belong to one discussion thread) and discuss the associated patterns of entropy change in Section 4.1, Section 4.2 and Section 4.3. In Section 5, we discuss the results and outline future work. We also recognize that while the proposed model looks very promising, much more empirical evidence is needed to show the feasibility of the proposed model. Once more data has been gathered, and the proposed model has been developed to the level of an application, we hope to obtain more quantitative results.
2. Opinion Polls about 9/11 Conspiracy Theories
The conspiracy theories that we analyze in this paper concern the September 11 attack, when Al-Qaeda terrorists killed 2996 people and caused at least $10 billion in property and infrastructural damage in the United States. It is rather well known that there was a vast number of conspiracy theories which developed after this attack [6].
There was no consistent polling about the support for these theories. However, we analyze the data available from scarce official opinion polls. In addition, we use opinion mining tools to study two cases on data extracted from the Internet.
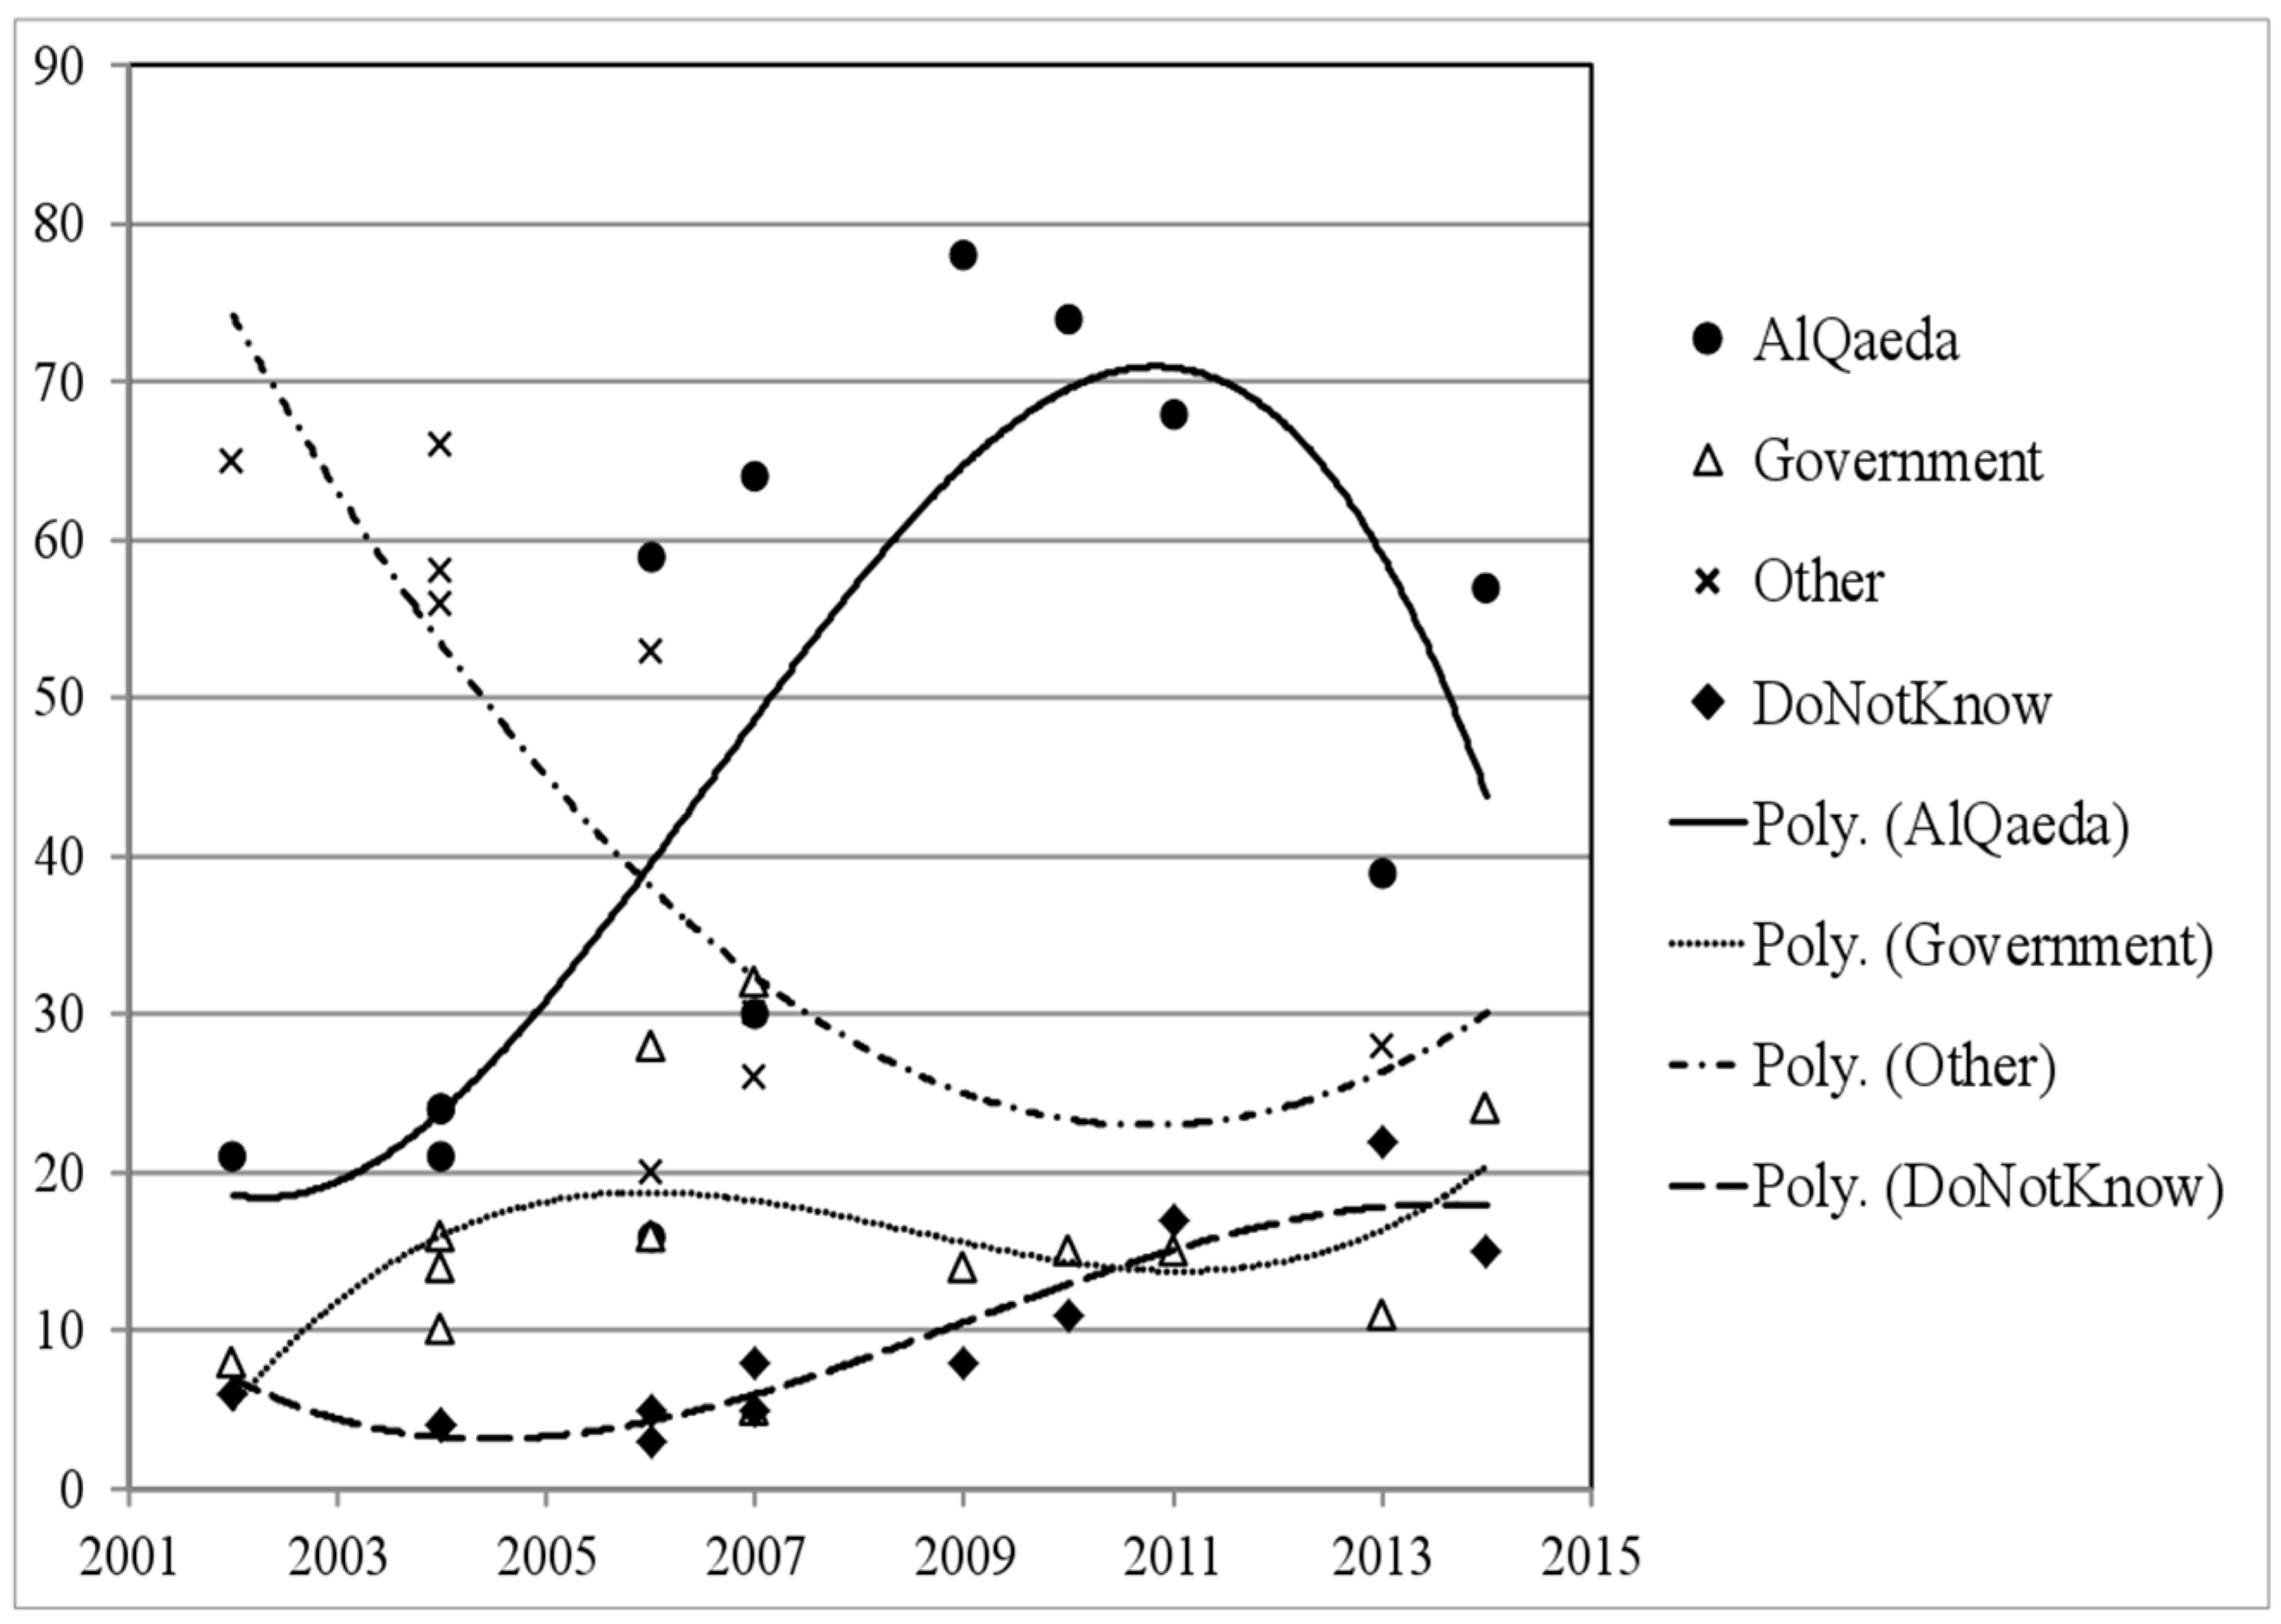
An example of the dynamics of the polled opinion about 9/11 conspiracy in the United States over the period 2001–2014 is given in Figure 1 [7]. The graph shows that in the first years after the attack, the majority of the sample was not convinced that Al-Qaeda was responsible for the attack. This however changed later, and the confidence peaked in 2009. Since then, it started dropping, while at the same time, an increased number of people declare that they do not know “Who did it”.

Figure 1.
The illustrative fitting lines (2nd and 3rd order polynomial) show dynamics of opinion polls concerning the question “Who did the 9/11 terrorist attacks?” in the US. In the first years after the attack, the majority was not convinced that Al-Qaeda was responsible for the attack. This, however, has changed and the confidence peaked in 2009; since then it started dropping while at the same time more and more people declare that they do not know who did it.
In France, one of the first spreaders of a 9/11 conspiracy theory was Thierry Meyssan [8]. His book was criticized by centre- and left-oriented publishers such as Libération and Le Nouvel Observateur. However, a similar conspiracy theory was also held in the US. Unfortunately, in France, there are far fewer official polls about this conspiracy [9,10,11,12]. The WorldPublicOpinion.org poll [10] conducted during the summer of 2008 revealed that about 63% of the polled French citizens considered that “Al Qaeda” was behind the 9/11 attack, but 8% believed in the conspiracy theory that the US government official polls about this conspiracy [nine started dropping while at the same time more of the same poll found that in nine of the 17 countries in which the poll was conducted, the majority kept Al-Qaeda responsible for the attacks; but in the remaining eight countries they did not.
Unfortunately, we were not able to collect a sufficient number of polls to create valid statistics about public opinion neither in France nor in the rest of the world. However, even from the limited data that we have, we concluded that the spreading of the conspiracy theories was a slow process which took at least a couple of years before it became more or less stable. It would have required frequent and prolonged monitoring to fully understand the changes over time of the conspiracy theories associated with this event.
Therefore, we have chosen an alternative way to search for opinions about this particular conspiracy with the Internet being a convenient medium for supporters of conspiracy theories. It enables them to find proof of their conspiracy theory and also to inform and convince others of its validity. For this reason, we believe that supporters of conspiracy theories are more likely to have left a trace of their stands through on-line tools rather than in conventional opinion polls.
3. Analysis of the Web-Based Comments about Possible 9/11 Conspiracy
3.1. Example No. 1, BBC News Article
On 29 August 2011, the BBC published an article with arguments for and against some of the conspiracy theories of the 9/11 event [13]. There were 755 comments by readers to this article. We represent the content of the article and all the comments in two semantic clouds constructed using the program Iramuteq [14], shown in Figure 2a,b, respectively. The program selects active words (i.e., nouns, verbs, and adjectives) and creates a graph based on the co-occurrences of these words. Comparing the two clouds, one can see that readers more frequently commented on two subjects: “collapse” (of the building next to the Twin towers that were hit by the terrorists) and “person” (who might believe in a conspiracy theory). These two clusters of words create two sides of a conspiracy theory. The “person” cluster implies that the political interests and “human nature” (fear, prior beliefs) are some of the possible incentives for the conception/propagation of a conspiracy theory. The second cluster of words reflects on the conspiracy theories listed in the BBC article and discussions about the 9/11 “facts” assessing whether they match with reality.
We further retrieved the connections between comments that refer one to the other. The longest thread of comments in our sample is shown in Figure 3. We look further at the interactions in this thread of messages to find out whether these messages are supporting or opposing a conspiracy theory. This information is required to determine the possible interaction patterns of a person who propagates a conspiracy theory.
The selected network of comments shown in Figure 3 starts with the comment No. 42: “In the 50s, the CIA did a lot more questionable things and had more power than they do now, and they got ‘outed’ for much of it. Nixon couldn’t even keep a break-in to an office a secret, I’m supposed to believe a massive cover-up with thousands of conspirators and nobody’s said *anything*? Soldiers were leaking secrets on Lady Gaga CDs! The government isn’t made up of mind-controlled zombies.” We classify this comment as −1, as the comment is opposing conspiracy theory, suggesting that a conspiracy of the 9/11 order of magnitude could not be kept secret from the employees of the government.
The community defending conspiracy theories is giving some reasonable and highly rated/liked arguments. One such example is comment No. 130: “I have no agenda other than to find the truth. Not all CTs, as you are calling them, are lunatics. Many people wouldn’t call themselves CTs but are still not sure we have heard the whole truth. Building 7’s collapse is very strange and unique and there do seem to be many unanswered questions throughout. Stop attacking people asking questions. Being closed minded is not a virtue.” We assign a value Ei = 1 to this comment as it is defending conspiracy theorists.
Another network of comments that we selected (can be found in the Appendix, the star-shaped, second largest one), starts with the comment No. 436: “The one thing that made me sit up and wonder, were the pictures of the Pentagon before it collapsed. The hole (allegedly made by the plane) was just not big enough, and after all these years I still haven’t seen a good enough explanation for that anomaly.”
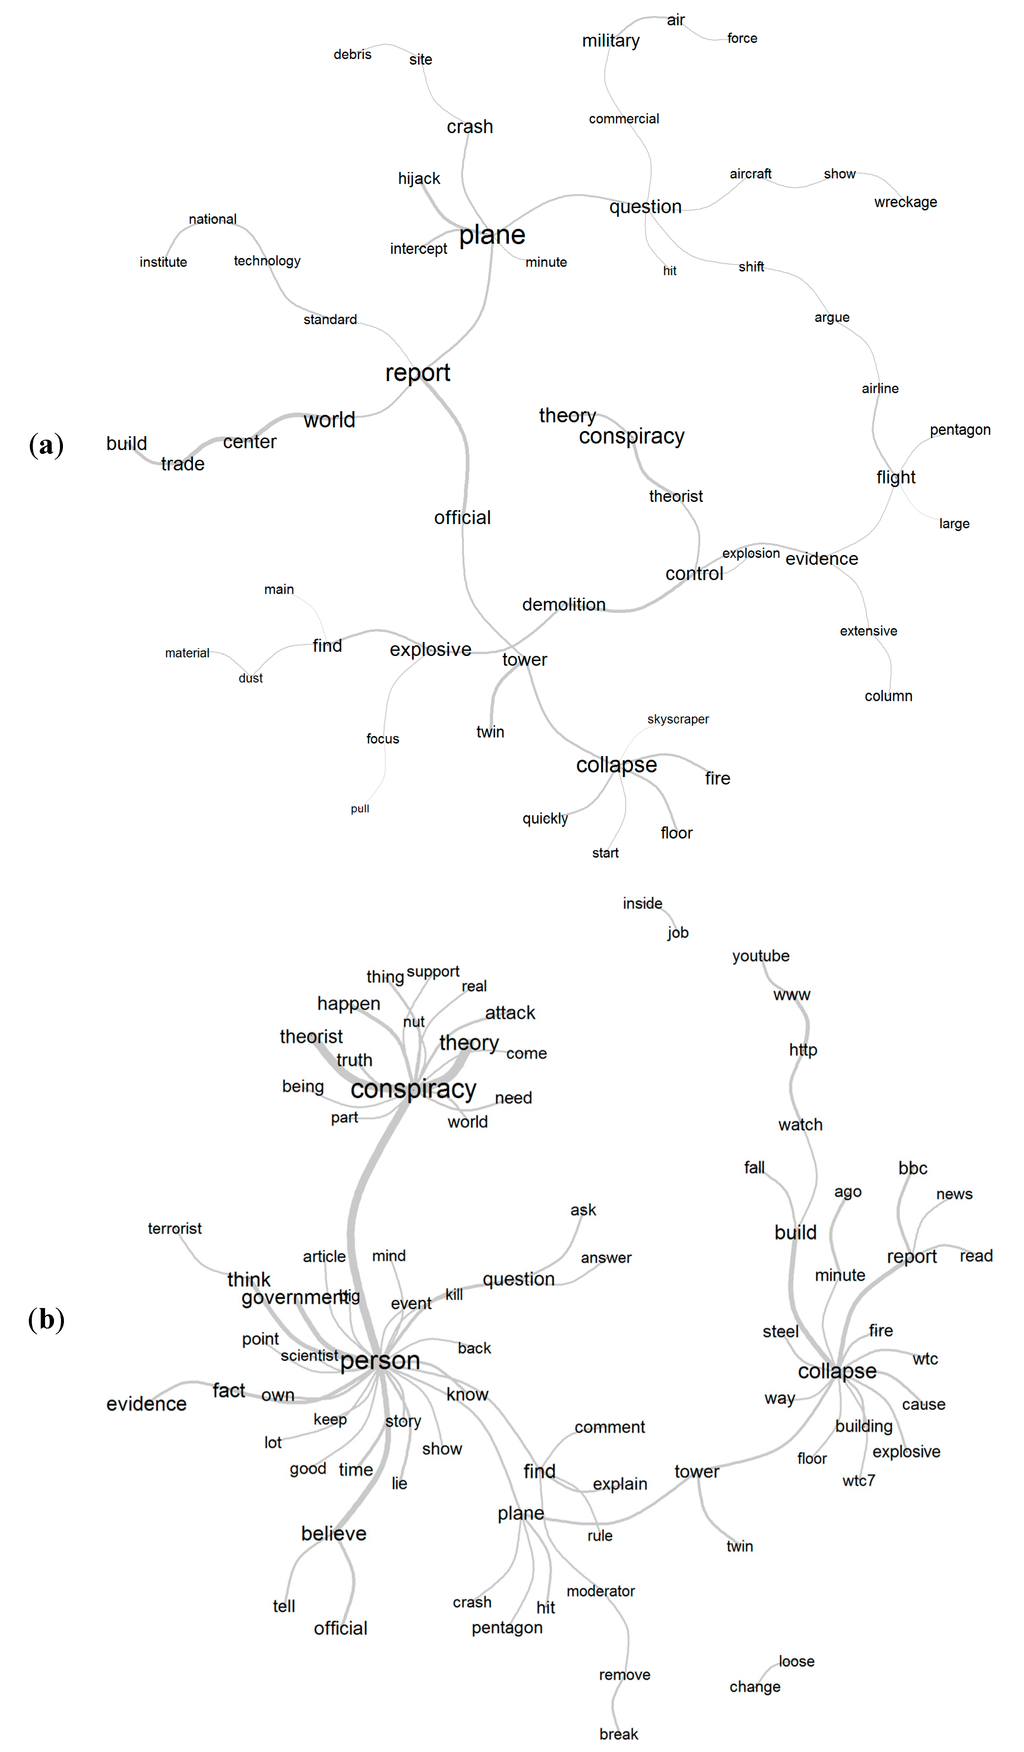
Figure 2.
(a) Semantic cloud showing the subjects that are discussed in the BBC article: conspiracy, plane, collapse, etc. (b) Semantic cloud showing the subjects that are discussed in the commentary on the BBC article: conspiracy, person, collapse, etc. The edges are constructed upon the minimum number of ten co-occurrences.

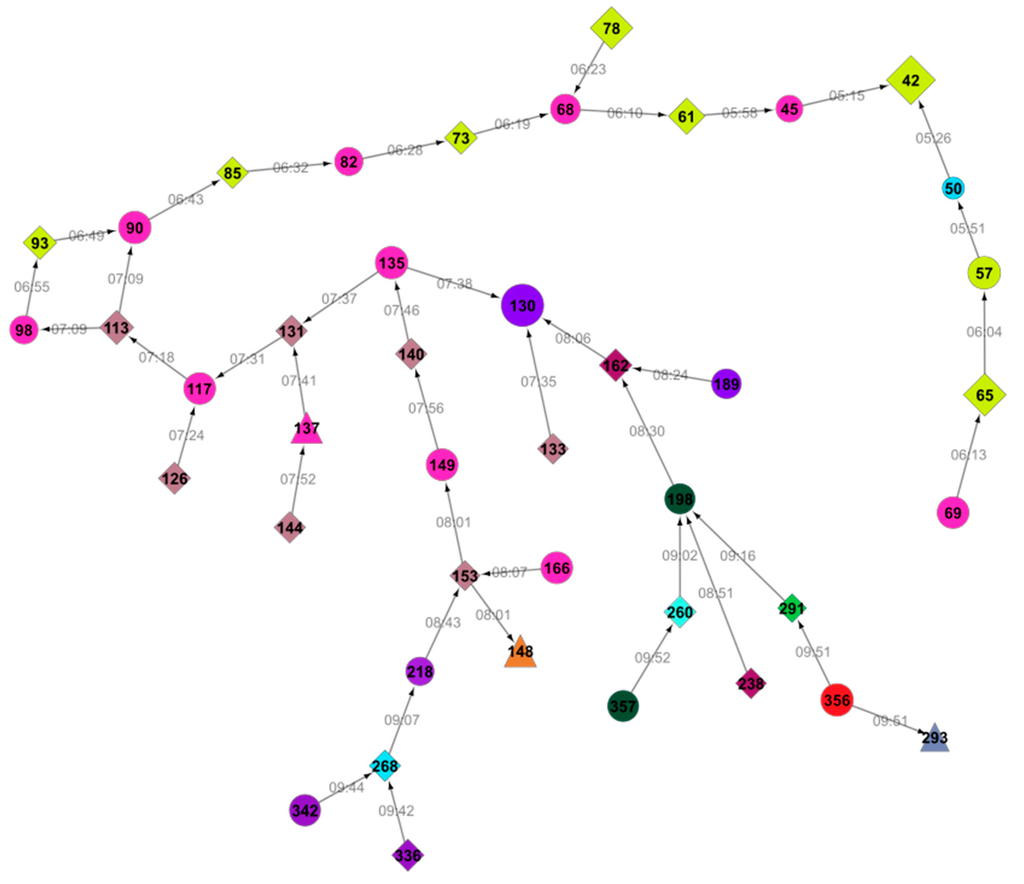
Figure 3.
Thread of comments that mention one to the other (establishing the possibility that they share/develop a common ideology) from the BBC article. Comments in the same color were posted under the same pseudo name. The size of the nodes reflects the rating (number of “likes”) by the readers (Figure 6); the larger node, the better its rating. The numbers on the edges give the time when a comment was posted. The shape gives their position: a circle for the ones supporting conspiracy, diamonds for the ones opposing it and a triangle for some comments that are vague or undecided. (Note: the sub-networks of all of the comments from the BBC site are in the Appendix).

These two comments illustrate two (possibly main) positions in discussions of a conspiracy theory. The first is in the area of personal perceptions and views. Namely, when confronted with conspiratorial or inconclusive interpretations of a terroristic event, people need to intuitively distinguish what is “truthful” from what constitutes a conspiracy. However, when dealing with fear, doubt and uncertainty related with a terroristic attack, there is an effect of subjectivity that can be a very powerful factor that leads to adoption of conspiratorial beliefs. This is partly addressed by the comment No. 130, which points out the “human nature” and a desire to increase one’s resilience by being open-minded. The doubt appears for different reasons and therefore a certain number of people prefer to remain partly open to discussing any issue, including conspiracy theory, before rejecting it. The second chosen comment, No. 436, is more concerned about the “real facts” and whether they match with the expectations. This type of commentator turns out to be more stubborn in defending their opinion or repeatedly questioning a specific (false) argument, even when confronted with several counter-arguments and real evidence by a number of other participants.
In order to understand how far commentaries reflect the opinion of an average reader of the BBC site, we need to have some information about activity patterns of the commentators themselves. For this reason, we retrieved the emergent social network of the 341 unique pseudo names that took part in the discussion on this BBC article as shown in Figure 4.

Figure 4.
Network of people who commented on the BBC article for the 9/11 conspiracy. The size of the nodes marks the Out-degree, while the colors correspond to In-degree. It shows that the In- and the Out-degree are fairly symmetric. The nodes that are largest (Out-degree/the number of posted comments) are characterized by the strong red color (highest In-degree, the number of comments that a person received).
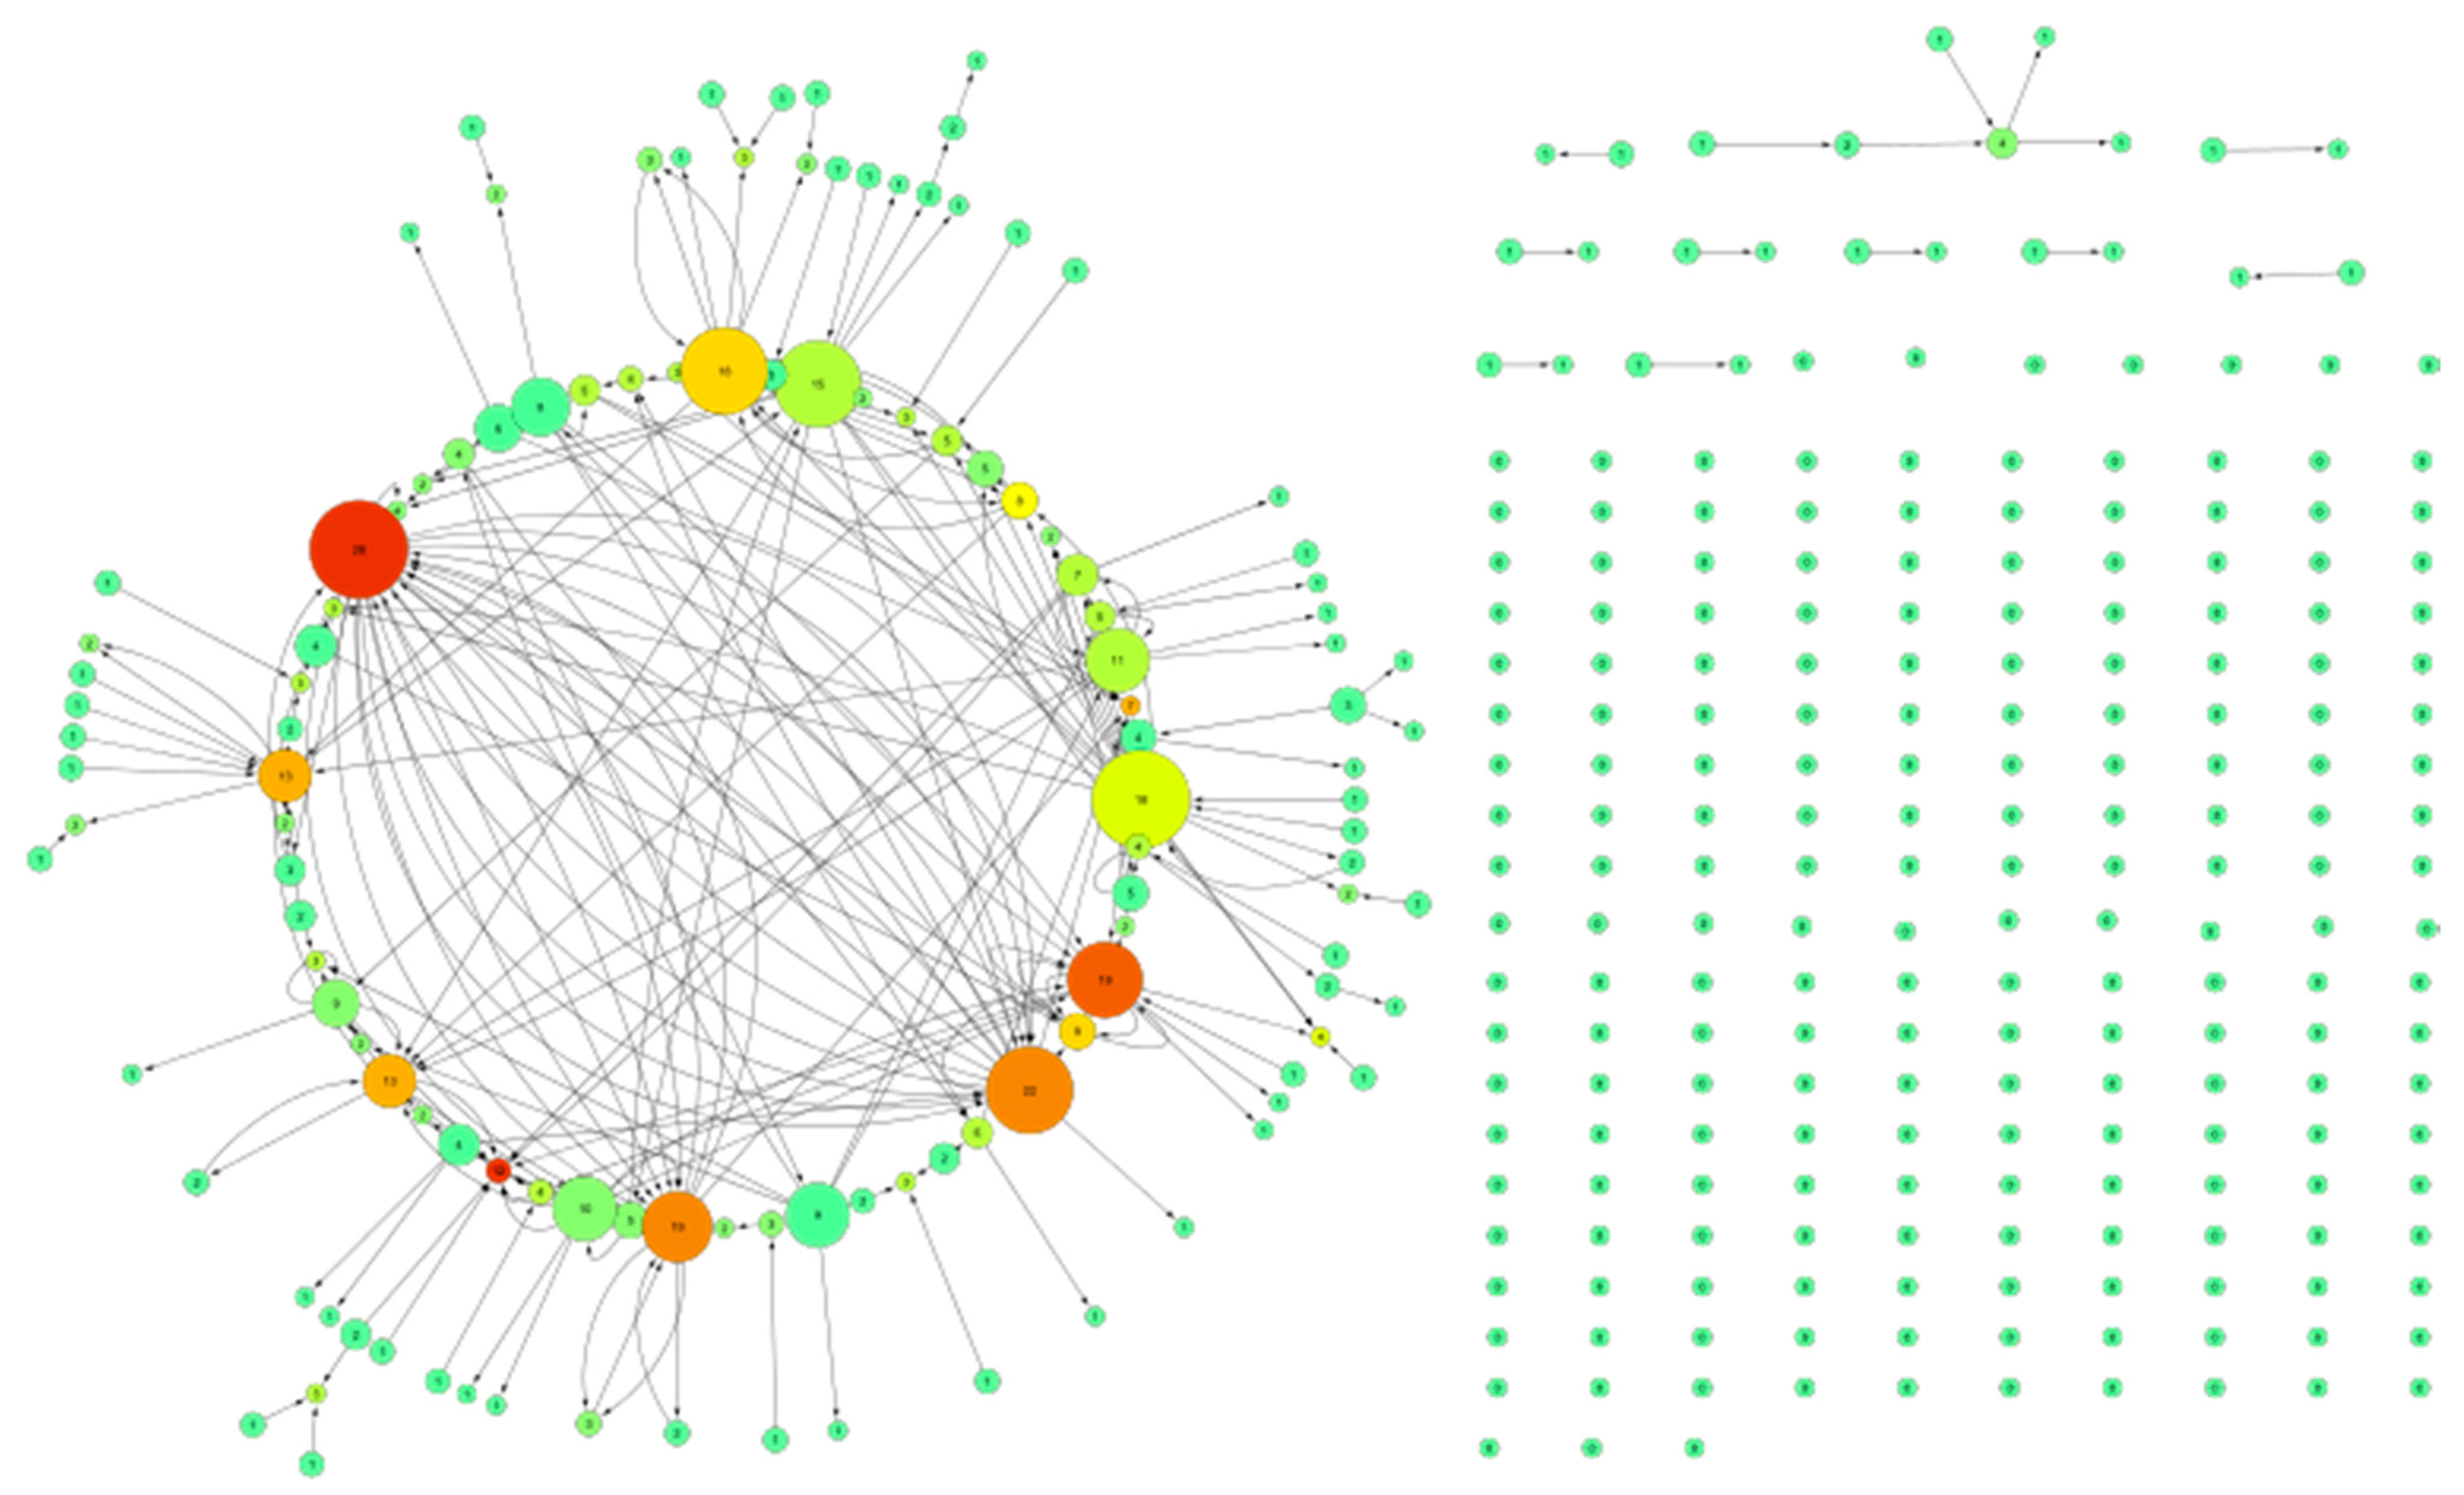
The network structure in Figure 4 shows that a small-world network was quickly created (all the comments were posted during a single day). The size of the nodes marks the Out-degree of the commentators, i.e., the number of comments that a person posted (the smallest size corresponds to the minimal value of one), while the colors correspond to the In-degree, i.e., the number of comments that a person received (the green color corresponds to the minimal value of In-degree, equal to zero). We can observe from Figure 4 that large nodes are also characterized by strong red color. The isolated network nodes at the bottom part of Figure 4 are due to the presence of persons who posted only one comment to the main article. Obviously, these smallest nodes are also at the same time green in color. In general, there is a strong correlation between the In- and Out-degree of each person. The degrees distribution follow a power law, which in the case of the Out-degree very accurately follows a slope of −1.3, while the In-degree has a slope of −1.65.
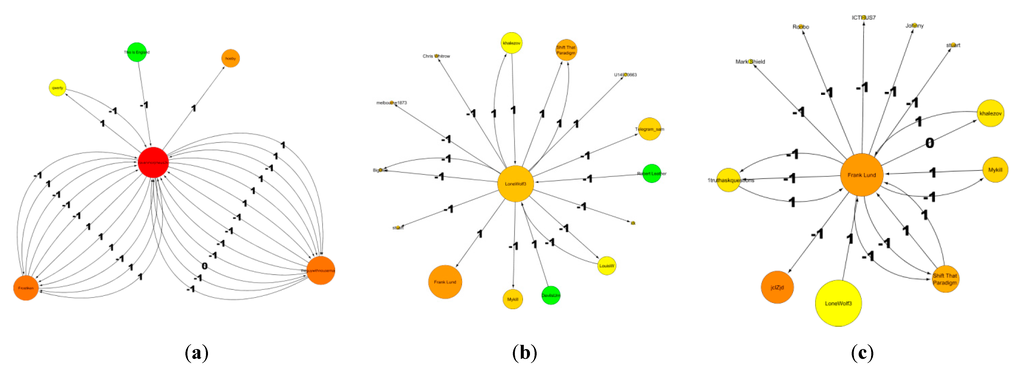
Figure 5.
Social sub-networks of three most active commentators. (a) The first on the left has the largest degree. Most of its comments are supporting conspiracy theories (value 1); the comments that he/she receives are opposing them. (b) The middle panel shows the second most engaged person; the comments he/she is posting are equally labeled −1 or 1, meaning that he/she has no strong opinion about conspiracy theories. This person comments often on the people otherwise isolated (small nodes). (c) The third person is against conspiracy theories and comments always against them (value −1).

Figure 5 shows the details of the activity of the three persons who discussed most frequently. Their patterns of activity are different: the person in Figure 5a was mostly engaged with two other persons, while the commentators in Figure 5b and c had an interaction with a large number of persons.
Participants in the discussion are also allowed to give a positive or negative vote to each comment, which results in the final ratings, available for each comment on the web site. Unfortunately, we do not have access to the exact procedure used for the generation of a rating. An analytical approach of dealing with this problem in the context of crowdsourcing has been discussed in [15] where a crowdsourcing system consisting of a set of users and a set of binary choice questions is analyzed, under the assumption that each user has an unknown but fixed reliability that determines its error rate in answering questions. However, as we were more interested in the analysis of rating per discussion thread than per an individual comment, we have analyzed the total rating (sum of ratings of all comments in a discussion thread). Somewhat surprisingly, comments with the highest (+34) and the lowest (−32) ratings did not result in long discussions but remained as individual comments. We also found that as a thread becomes longer, the probability is higher that the total rating for that thread will be positive. It happens that the longest discussion thread (shown in Figure 4) has also the largest total rating (+101). As we can see in Figure 4, where the rating is visualized as the size of the nodes, there are three comments (numbers 42, 78, 130) with large positive ratings. These comments might be against or for conspiracy theories as the shape of the comments in Figure 4 implies. Since the number of participants in the discussion is 12, we conclude that the discussion was interesting to many other readers and is not a product of mutual support of a few discussion participants.
Finally, in order to answer the question, “Does the discussion impact the opinion of the participants regarding conspiracy theories around 9/11?” We analyzed the dynamics and the alternation of opinions in the discussion threads. The most important empirical take away is twofold:
- The dynamics of the interchange is very fast. All discussions happen on the same day with very few post-reactions after that. The longest discussion thread takes only three hours.
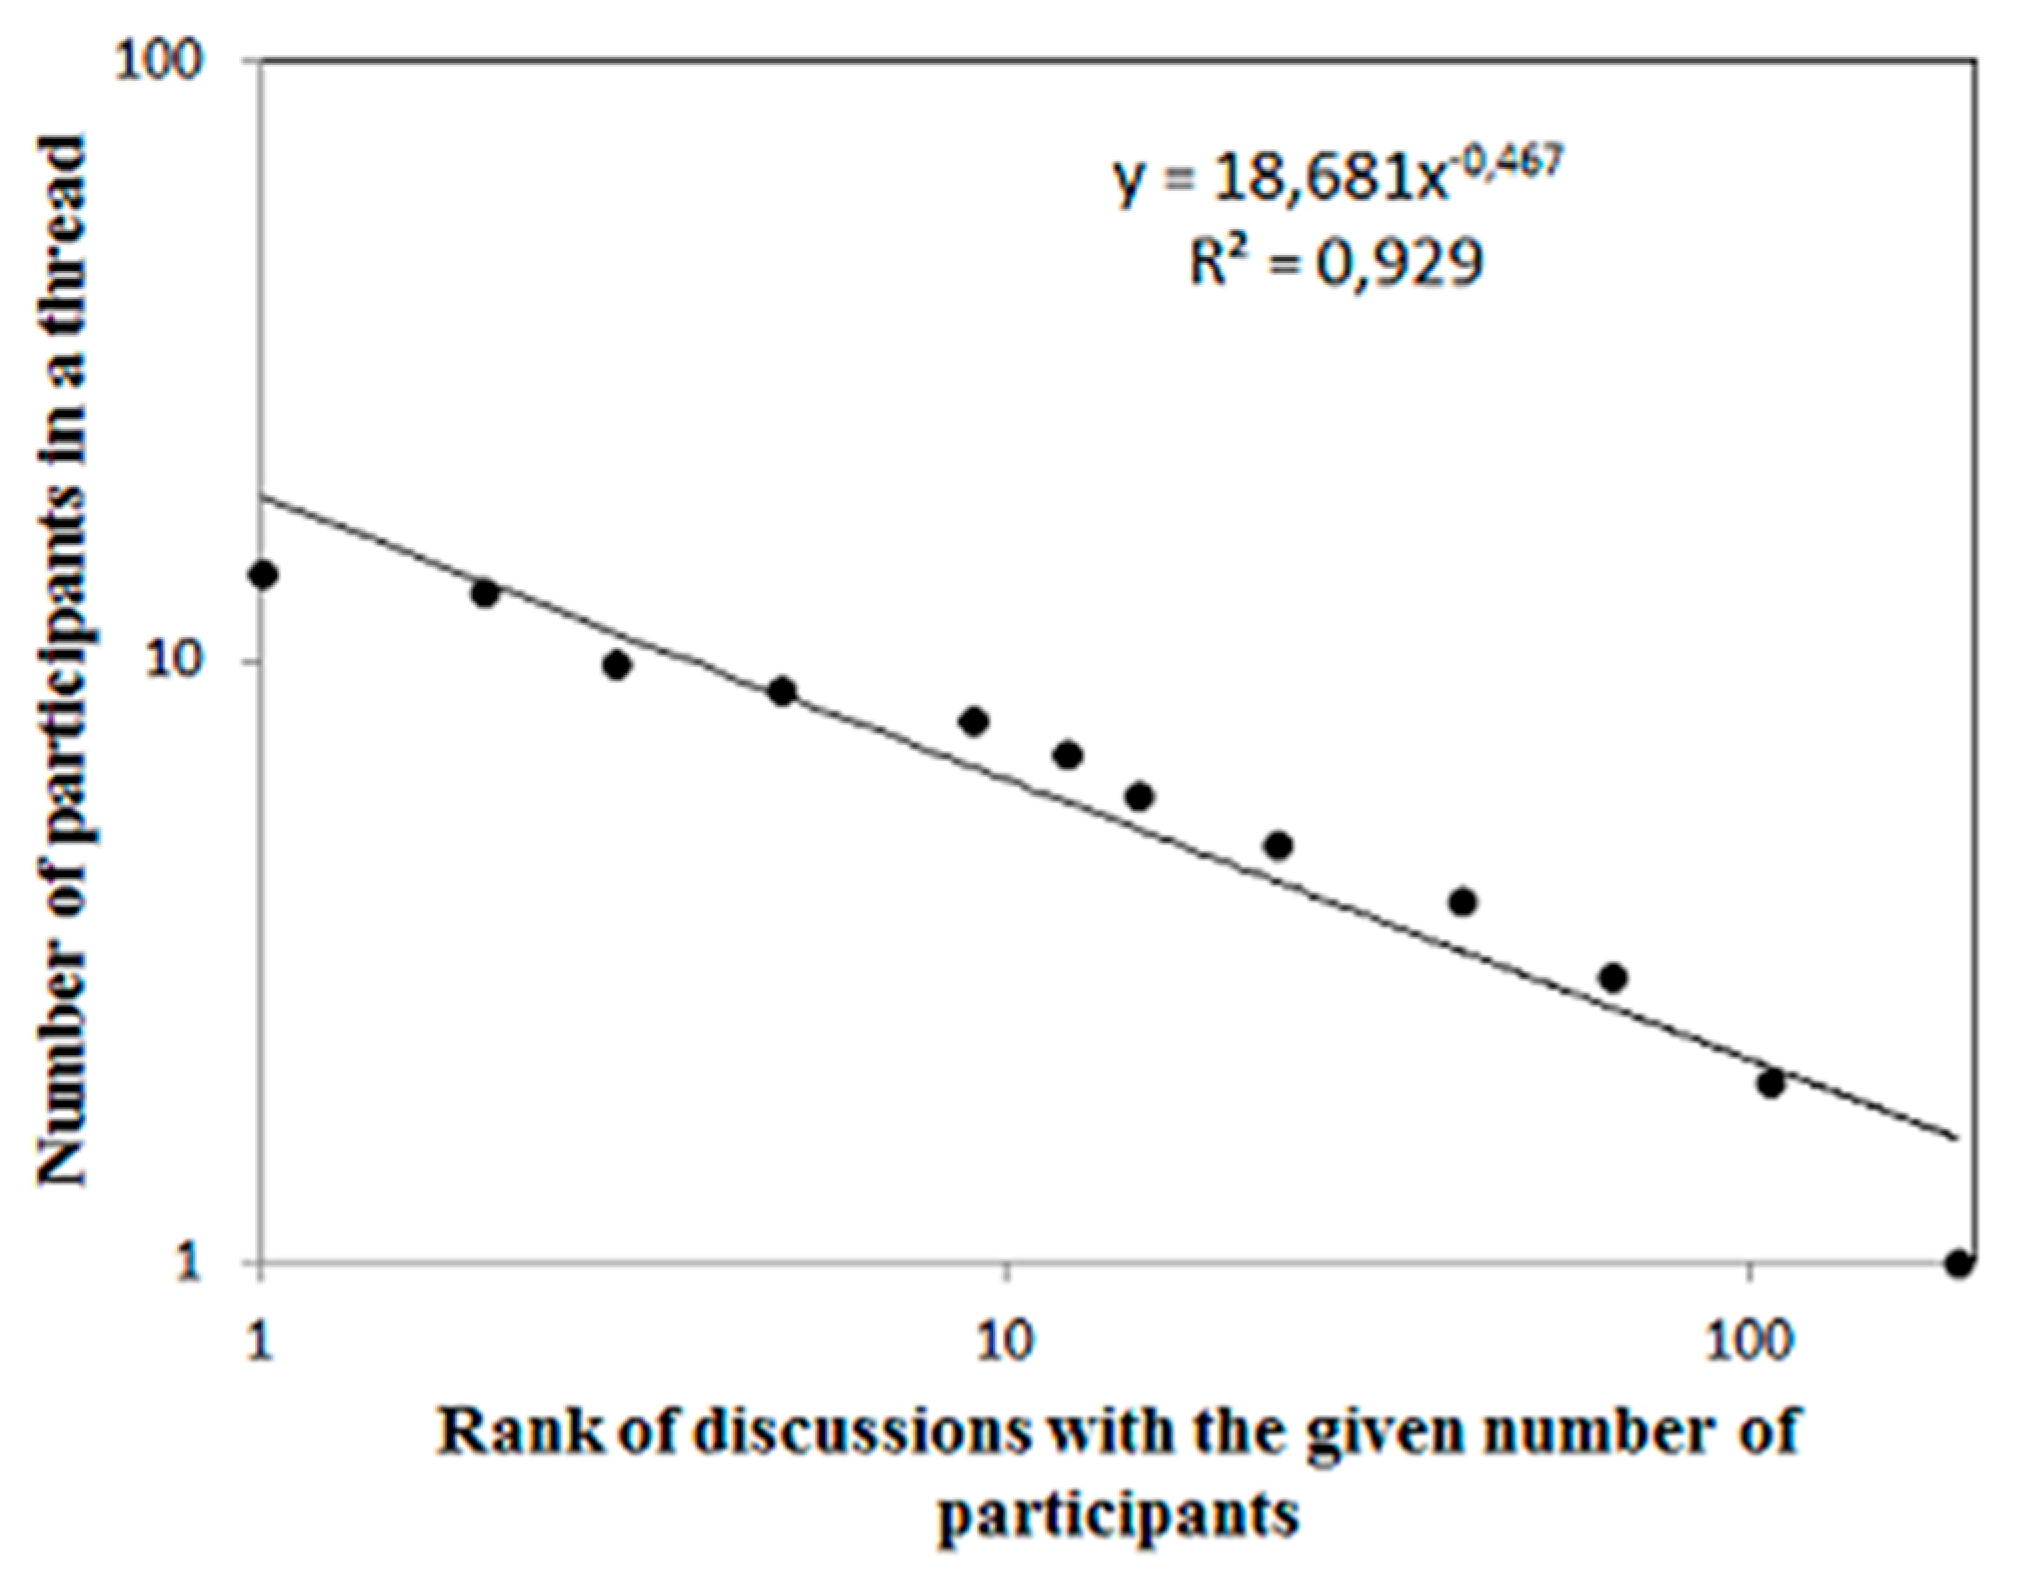
- The size of the groups that take part in each discussion thread is very small. It is distributed by power law, as shown in Figure 6. Therefore, it is reasonable to assume that all participants in the online discussions had an equal chance to present their opinion to the other participants in that discussion.
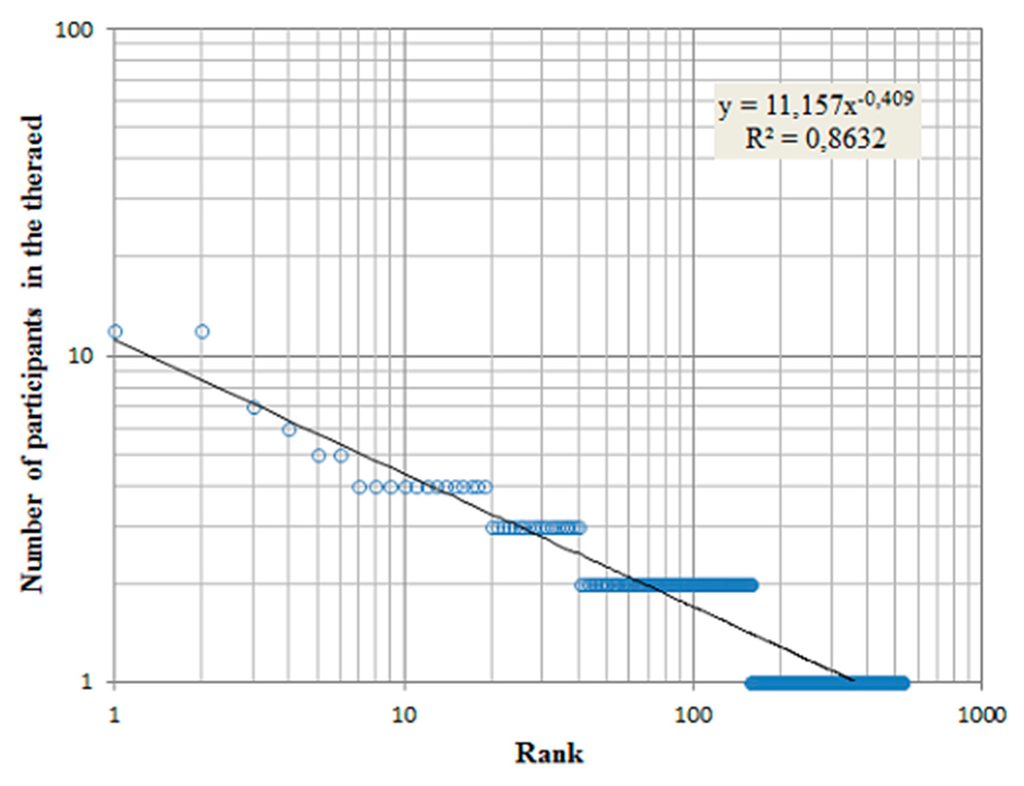
Figure 6.
Rank of the size of groups in which people held discussions. It follows a Zipf law of −0.4, which is equivalent to a power law of −2.25.
Figure 6.
Rank of the size of groups in which people held discussions. It follows a Zipf law of −0.4, which is equivalent to a power law of −2.25.

As opposed to studies where interactions between agents are more or less complex versions of contagion, the opinion dynamics uncovered by our study displays a variety of interactions that differ by the number of participants, their attitudes and the nature of their arguments. In particular, some of the arguments have a more information-like logical character while others originate in or address subjective states and experiences. Thus, the modeling of the discussion process and its outcome will have to transcend mechanical models and yet include precisely enough elements to allow quantitative evaluations and predictions.
3.2. Example No. 2, the Telegraph Blog
For our second example, we examine an article by a historian/writer Tim Stanley published on The Telegraph Blogs on the 10th anniversary of the 9/11 attack, and the 858 comments thereon. Stanley defended the existence of conspiracy theorists by claiming that “conspiracy thinking is a natural part of political discourse”.
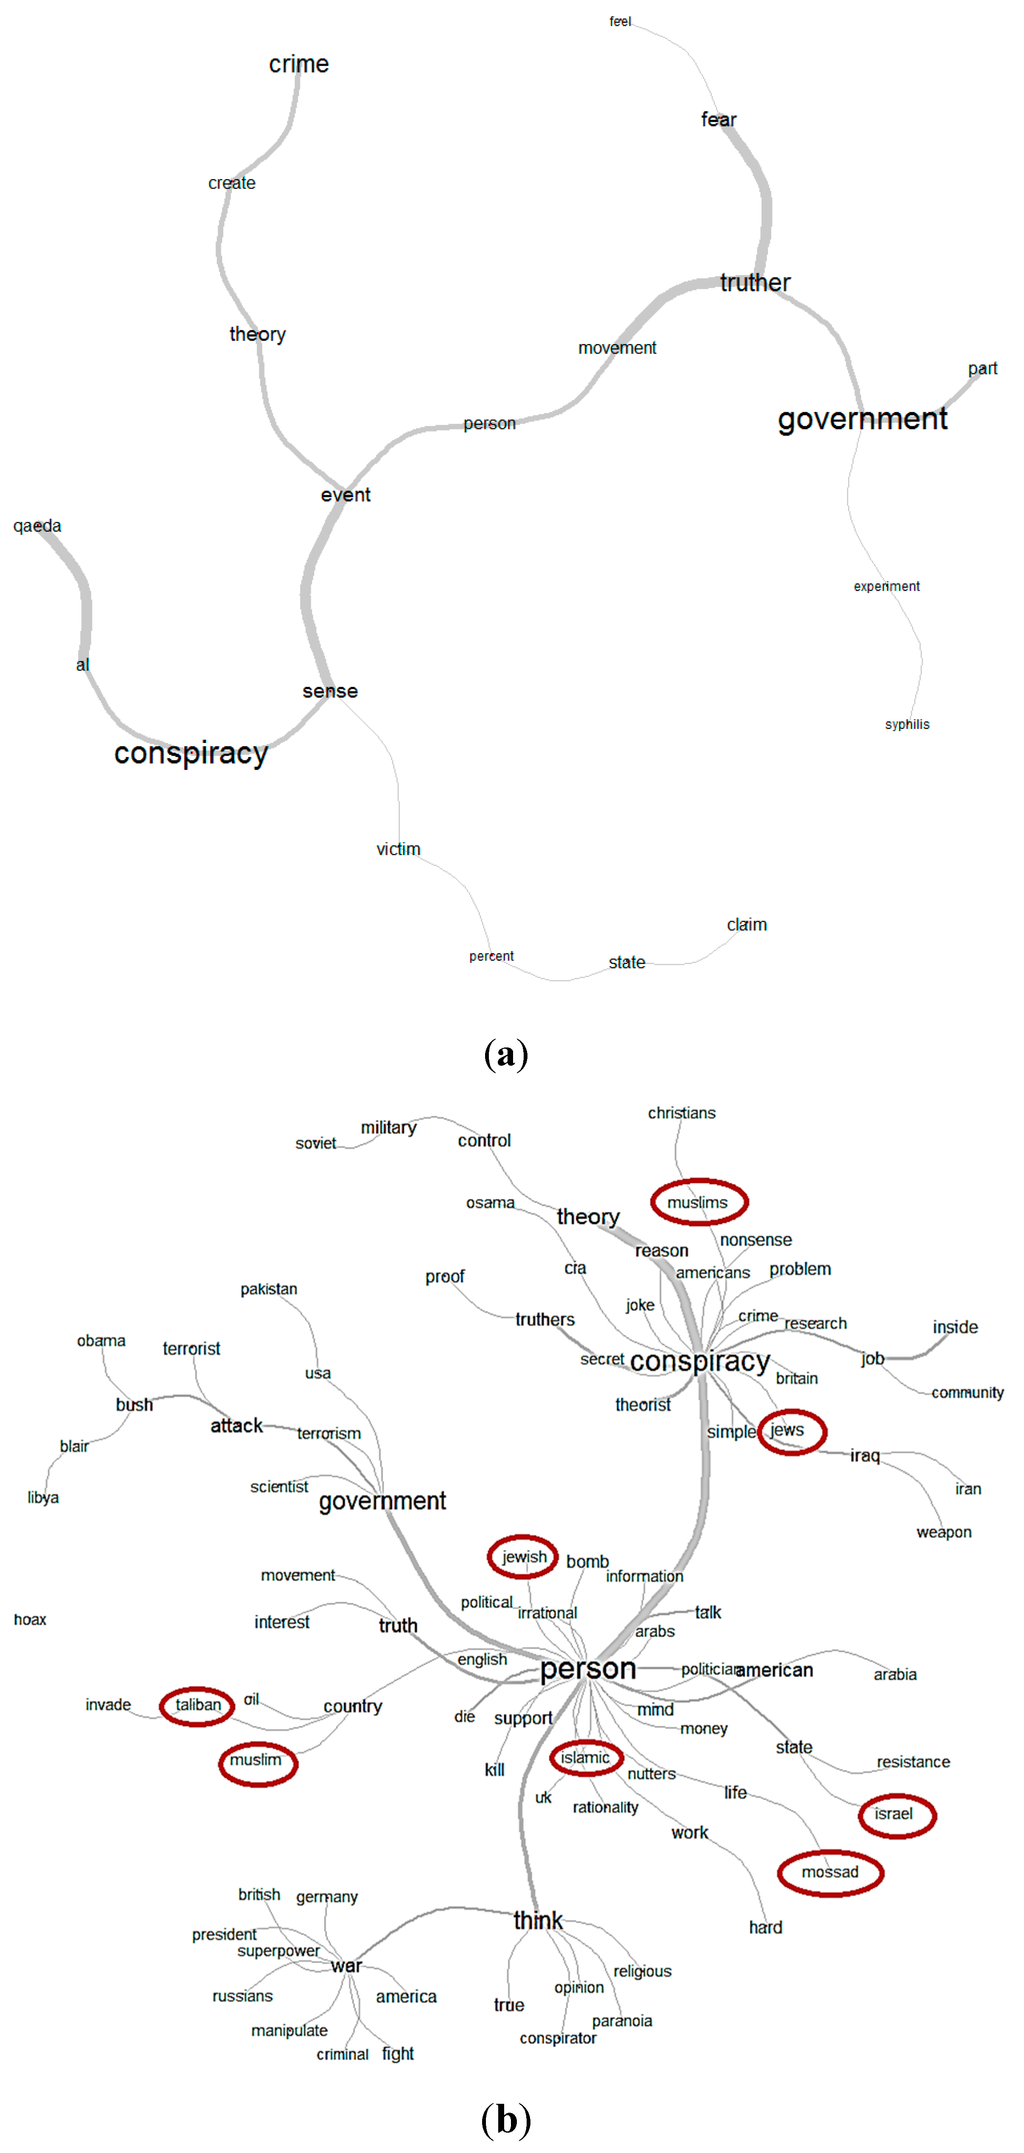
Figure 7.
(a) Semantic cloud showing the subjects that are discussed in the Telegraph blog. (b) Semantic cloud showing the subjects that are discussed in the comments on the Telegraph blog: conspiracy, fact, person, etc. Edges represent word co-occurrences. The cloud demonstrates the symmetry of arguments used in the comments: Muslims, Christians and Jews and other similar words branch out from the main nodes in a very symmetrical way.

The contents of the article and the comments are represented in the semantic clouds shown in Figure 7. The main tags in the commentaries (conspiracy, person) are similar to those in our first example (see Figure 3). Although the subject of the Telegraph article is similar with that of the BBC article, the tone is different. It is more “philosophical”, looking for the human side of the conspiracy and less concerned about the facts analysis. As such, it is more general and endures a larger variety of opinions to be discussed in the comments.
The comments on the Telegraph article have a different structure then the comments in the previous example (BBC news site). For example, even though the number of comments is larger, the number of persons/commentators is smaller. In this thread of comments we identified 222 different pseudo names. One example of a thread of comments is shown in Figure 8.
The bloggers are more familiar with each other than the discussants of the BBC article, and their readers are perhaps also more used to taking part in discussions as evidenced for example in comment No. 145: “I've been rude about plenty of Tim's [author of the blog] blogs so I ought to say that this one is really quite illuminating. One thing I'd like to know though is whether Truthers favour one side of the political spectrum, or both, or none”.
Therefore, the discussions take a different flow then we saw in the BBC example; discussion threads are longer and isolated comments (without any reaction) are less frequent. One example of a thread of comments is given in Figure 8.
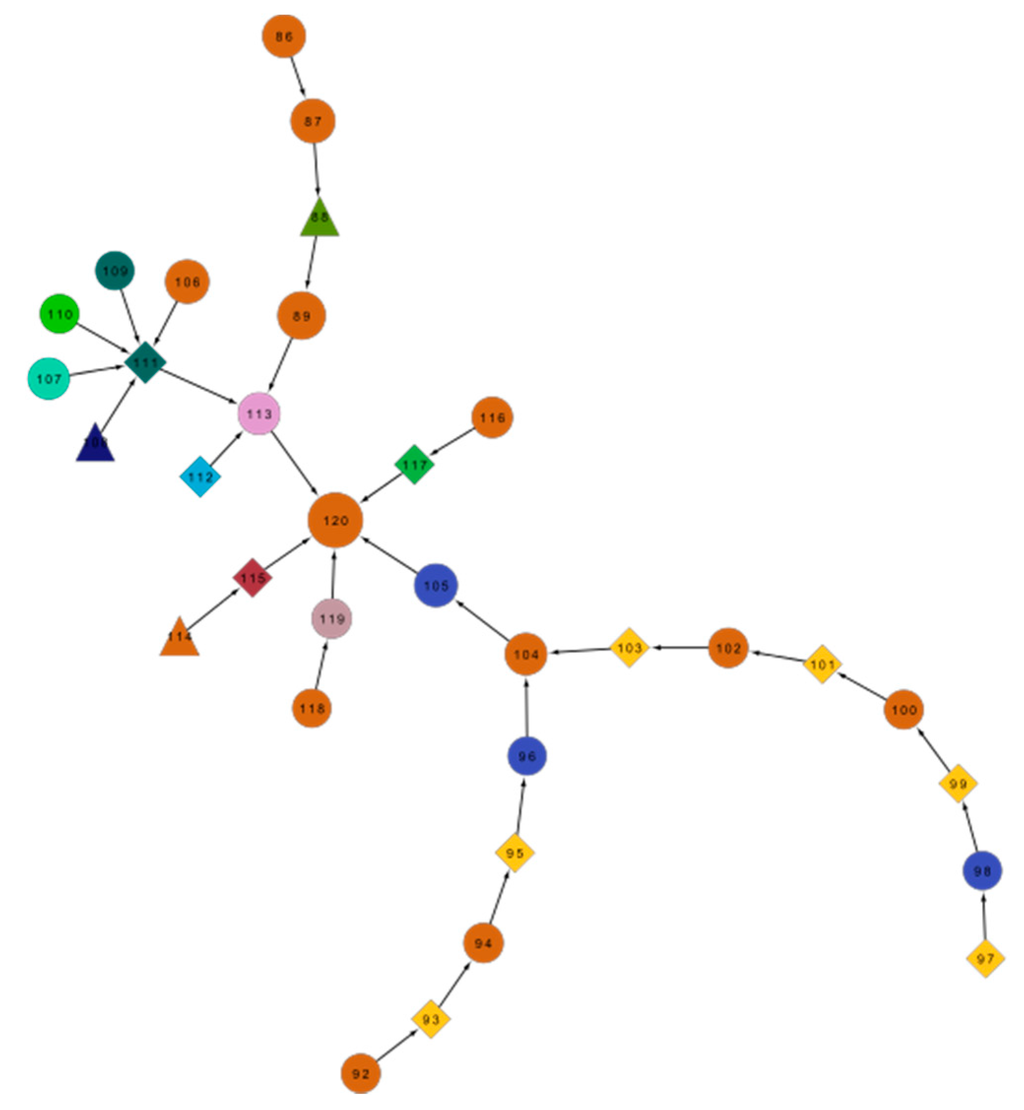
Figure 8.
One thread of comments from the Telegraph blog. Comments in the same color were posted under the same pseudo name. The size of the nodes reflects the rating (number of “likes”) by the readers; the larger node, the better its rating. The numbers on the edges give the time when a comment was posted. The shape gives their position: a circle for the ones supporting conspiracy, diamonds for the ones opposing it and a triangle for some comments that are vague or undecided. (Note: the sub-networks of all of the comments from the Telegraph site are in the Appendix).

The network of discussants (Figure 9) shows typical characteristics of a small-world network. The In- and Out-degrees are quite symmetrical and both follow a power law with a slope of approximately −1.1. Activity patterns of the three most active persons as given by their sub-networks, are shown in Figure 10.
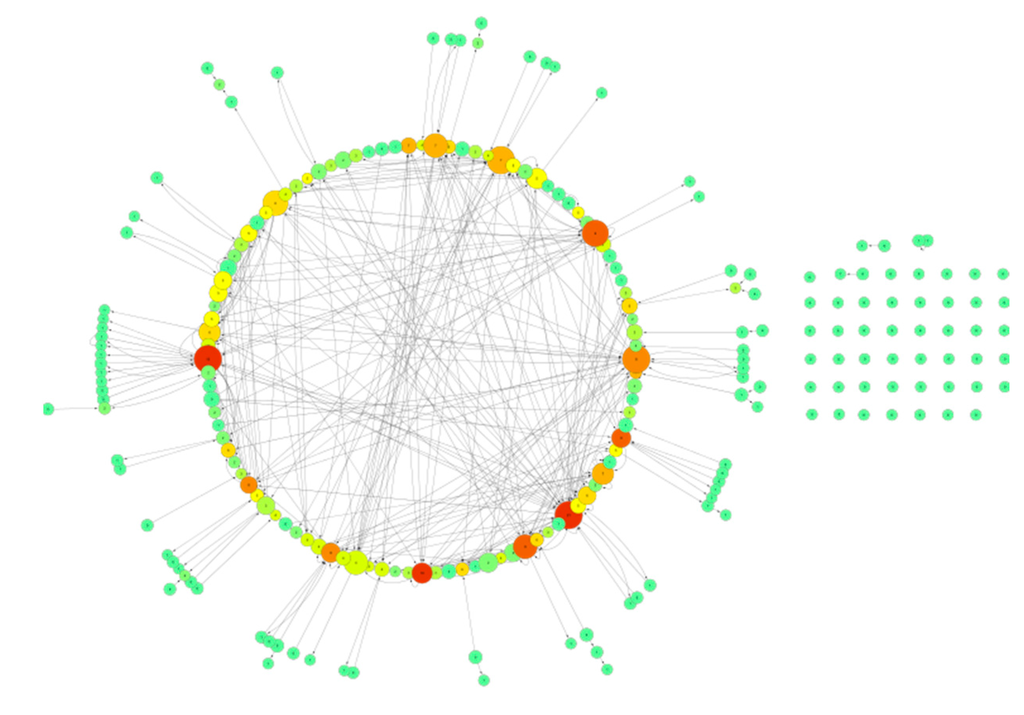
Figure 9.
Network of discussants who commented on the Telegraph blog about the 9/11 conspiracy. The size of the nodes marks the Out-degree (the number of posted comments) and the colors correspond to In-degree (the number of comments that a person received). It demonstrates that the In- and the Out-degree are correlated: red nodes, which have the largest In-degree are at the same time the ones that have the largest Out-degree (as the nodes are largest in size).

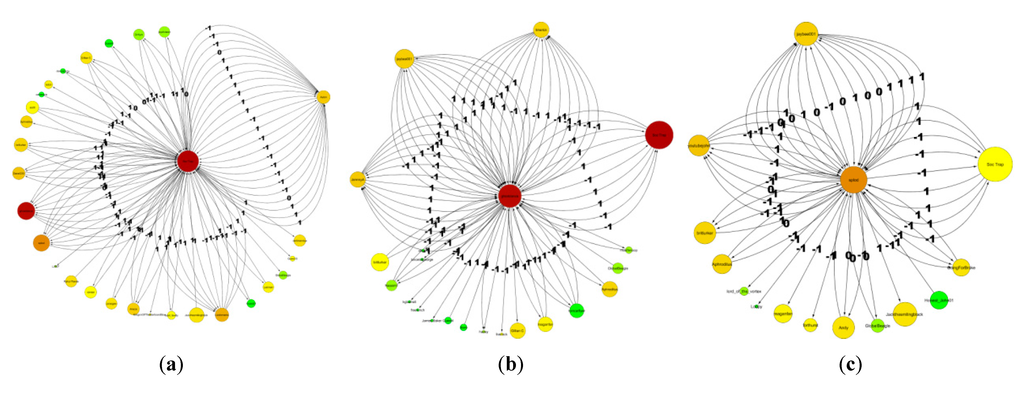
Figure 10.
Social sub-networks of three most frequently engaged commentators on The Telegraph blog. (a) The first on the left has the largest degree. Most of its comments are supporting conspiracy theories; the comments that he/she receives are opposing them. (b) The middle panel shows the second most active person; the comments he/she posted are mostly labeled −1, meaning that he/she is opposing conspiracy theories. (c) The third person, same as the second one, opposes the conspiracy theories.

Finally, we examine how many people participated in a discussion thread. Even when the length of the thread is very long, the number of participants in each discussion is very small (see Figure 11). The slope of the Zipf/Pareto law fitting line (~ 0.5) tells us that the probability that a discussion will engage more than x participants scales with x to the power of approximately −2 (p[x>X] ~ x−2).

Figure 11.
Rank of the size of groups in which people held discussions. It follows a Zipf law of −0.48, which is equivalent to a power law of −2.08.
Figure 11.
Rank of the size of groups in which people held discussions. It follows a Zipf law of −0.48, which is equivalent to a power law of −2.08.
3.3. Observations Common to Both Experiments and Their Relation with Existing Literature
Another study of on-line discussions of 9/11 conspiracy theories [16], a social-psychological one, brought out several observations at the level of the individual. It was found out that conspiracists are more likely to argue against an opposing interpretation and less likely to argue in favor of their own interpretation, while the opposite is true for conventional commenters (defenders of the official report). In addition, conspiracists are more likely to express mistrust and make more positive and fewer negative references to other conspiracy theories. They also found that conspiracists are largely unwilling to apply the “conspiracy theory” label to their own beliefs and object when others do so, lending support to the long-held suggestion that a conspiracy belief carries a social stigma. Finally, conventionalists tend to have a more hostile tone. These tendencies in persuasive communication can be understood as a reflection of an underlying conspiracist worldview in which the details of individual conspiracy theories are less important than a generalized rejection of official explanations.
Along this line, we also found that rationalist arguments tend to have a more hostile tone and that conspiracists do not change their view even after being exposed to very clear counter arguments, which confirms their generalized and unanimous rejection of official explanations.
When it comes to the analysis of ratings (the number of “Likes”), the analysis of Muchnik et al. in [17], discovered that prior ratings create significant bias in individual rating behaviors, and positive and negative social influences created asymmetric effects. In other words, voting is path dependent. We actually find out that comments with a negative rating have fewer responses than comments having a positive rating. The most popular comments (with a high probability those promoting conspiracy theories) are also those that are most frequently contradicted.
Further, our research brings out that on-line discussions about conspiracy theories are held in small groups of people who are exchanging opinions. The maximum size of the discussion group is 14 and usually discussion groups are much smaller, often concentrating on only a single opinion. The size of the groups follows a power law approximately, with the slope of −2.
The emergent social network of the commentators shows small-world network properties, characterized by a power law distribution of the commentators’ activity. The In- and Out-degrees, i.e., the number of the received and the number of the posted comments per person, are fairly balanced.
The data indicate that the dynamics of the collective opinion is determined not only by the informational content of the debate but also by the semantics (the way of expressing opinion) and the network connectivity of the messages (the size and dynamics of discussions). Once enough data is gathered, we will disentangle those aspects and evaluate further their effects.
4. Estimation of Entropy of Commentaries on the Articles Reporting Conspiracy
Entropy is a measure of the information content, or rather, its uncertainty. It can be assessed in various ways and here we propose a possible approach.
Let Ei stand for the state variable, Ei = −1 (no conspiracy) or 1 (conspiracy), i = 1, …, N. Assigning Ei = −1 to all strings, the resulting order parameter E = −1 marks a fully ordered state, with minimum entropy (H = 0).
Conspiracists comment on the report, focusing on one string Ek and changing its meaning (i.e., from −1 to +1). Entropy here characterizes uncertainty about the source of information, and increases by adding more comments of greater randomness. (The source is also characterized by the probability distribution of the strings drawn from it, but this is not part of the current model.) The idea behind the Shannon entropy is that the less likely an event is, the more information it provides when it occurs. The amount of information contained in a string Ei is not equally weighted in the formation of the opinion about conspiracy theory defined by the series of Ei’s. The expected value (average) of the information changes with each comment received. The entropy of the entire series Ei is therefore given by:
where pi are coefficients that define different significance of the information provided in the strings Ei and belong to a probability distribution which satisfies the condition:
It is far from trivial to realize the above ideas and provide an automatized procedure for the measure of entropy and the estimation of the discrete probabilities pi. Working with pi on the level of individual comments (pi = Ei) would be the common way to define entropy for a text based on the Markov model. However, this procedure would be not only cumbersome, but it could also result in an impractical and inconclusive result. A procedure with an intermediate aggregation would however lead to an accelerated process and to a result that could be of use in building and moderating discussion platforms. Our model indeed includes the relevant aspects that have to do with the properties of networks of comments and persons who are posting them.
We use data previously introduced in the BBC and The Telegraph blog examples in an attempt to estimate the pi distributions. The data might be organized in several ways, per person (rows in Table 1), per discussion (columns in Table 1), or according to the time they appeared on the website, as will be discussed in subsequent sub-sections.

Table 1.
Observed content of comments can be organized according to persons or discussions. Both rows and columns are expected to satisfy a preliminary distribution, which is a necessary simplification in order to counterbalance the large uncertainty of opinion mining. Symbol Li is used for the length of discussions. Estimates of preliminary distributions are proposed in Sub-section 4.2 and Sub-section 4.3 <…> = average.
| Discussion 1 | Discussion 2 | Discussion 3 | … | Discussion Z | pi per person | |
|---|---|---|---|---|---|---|
| Discussant 1 | {−1, 0, 1} | {−1, 0, 1} | {−1, 0, 1} | {−1, 0, 1} | <Ei> = f(IN-degree1) | |
| Discussant 2 | {−1, 0, 1} | {−1, 0, 1} | {−1, 0, 1} | {−1, 0, 1} | <Ei> = f(IN-degree2) | |
| Discussant 3 | {−1, 0, 1} | {−1, 0, 1} | {−1, 0, 1} | {−1, 0, 1} | <Ei> = f(IN-degree3) | |
| … | ||||||
| Discussant W | {−1, 0, 1} | {−1, 0, 1} | {−1, 0, 1} | {−1, 0, 1} | <Ei> = f(IN-degreeW) | |
| pi per discussion | <Ei> = f(L1) | <Ei> = f(L2) | <Ei> = f(L3) | <Ei> = f(LZ) | H = − sum(pilog2pi) |
The first method to define entropy is considered in 4.1, and it is based on the Markov (stochastic) model. In this approach, we calculate average value of Ei for each set of 20 consecutively (and randomly) posted comments. In Sub-section 4.2, we estimate the average value of Ei per discussion thread. In the third case, Sub-section 4.3, we monitor the average Ei value per person.
Combining these distributions of <Ei> measured as a function of discussion thread or a person IN/OUT-degree with the previously estimated distributions of the discussion size and the persons’ connectivity would make possible to estimate pi distributions and Shannon entropy associated with it.
Before we start with the analysis of the entropy for the commentary, the order variable value <Ei> of the original article/blog needs to be estimated. The BBC article is listing different 9/11 conspiracy theories in a factual style. This article is critical about conspiracy theorists, as the following sentence copied from this article implies: “Numerous official reports have been published since the Twin Towers fell, but just when a piece of evidence casts doubt on one theory, the focus then shifts to the next ‘unanswered question’”. Therefore the value of its order variable <Ei> is negative. The Telegraph article is also listing a number of conspiracy theories, but in a less judgmental style (“… in fact conspiracy thinking is a natural part of political discourse. It represents an effort to make sense of apparently senseless events. People conquer their fears by drawing connections between unconnected tragedies to create a unified theory that brings order out of chaos.”). Therefore, this article has a positive <Ei>. Starting from these two different initial conditions, we monitor the dynamics in <Ei> of the commentaries.

Figure 12.
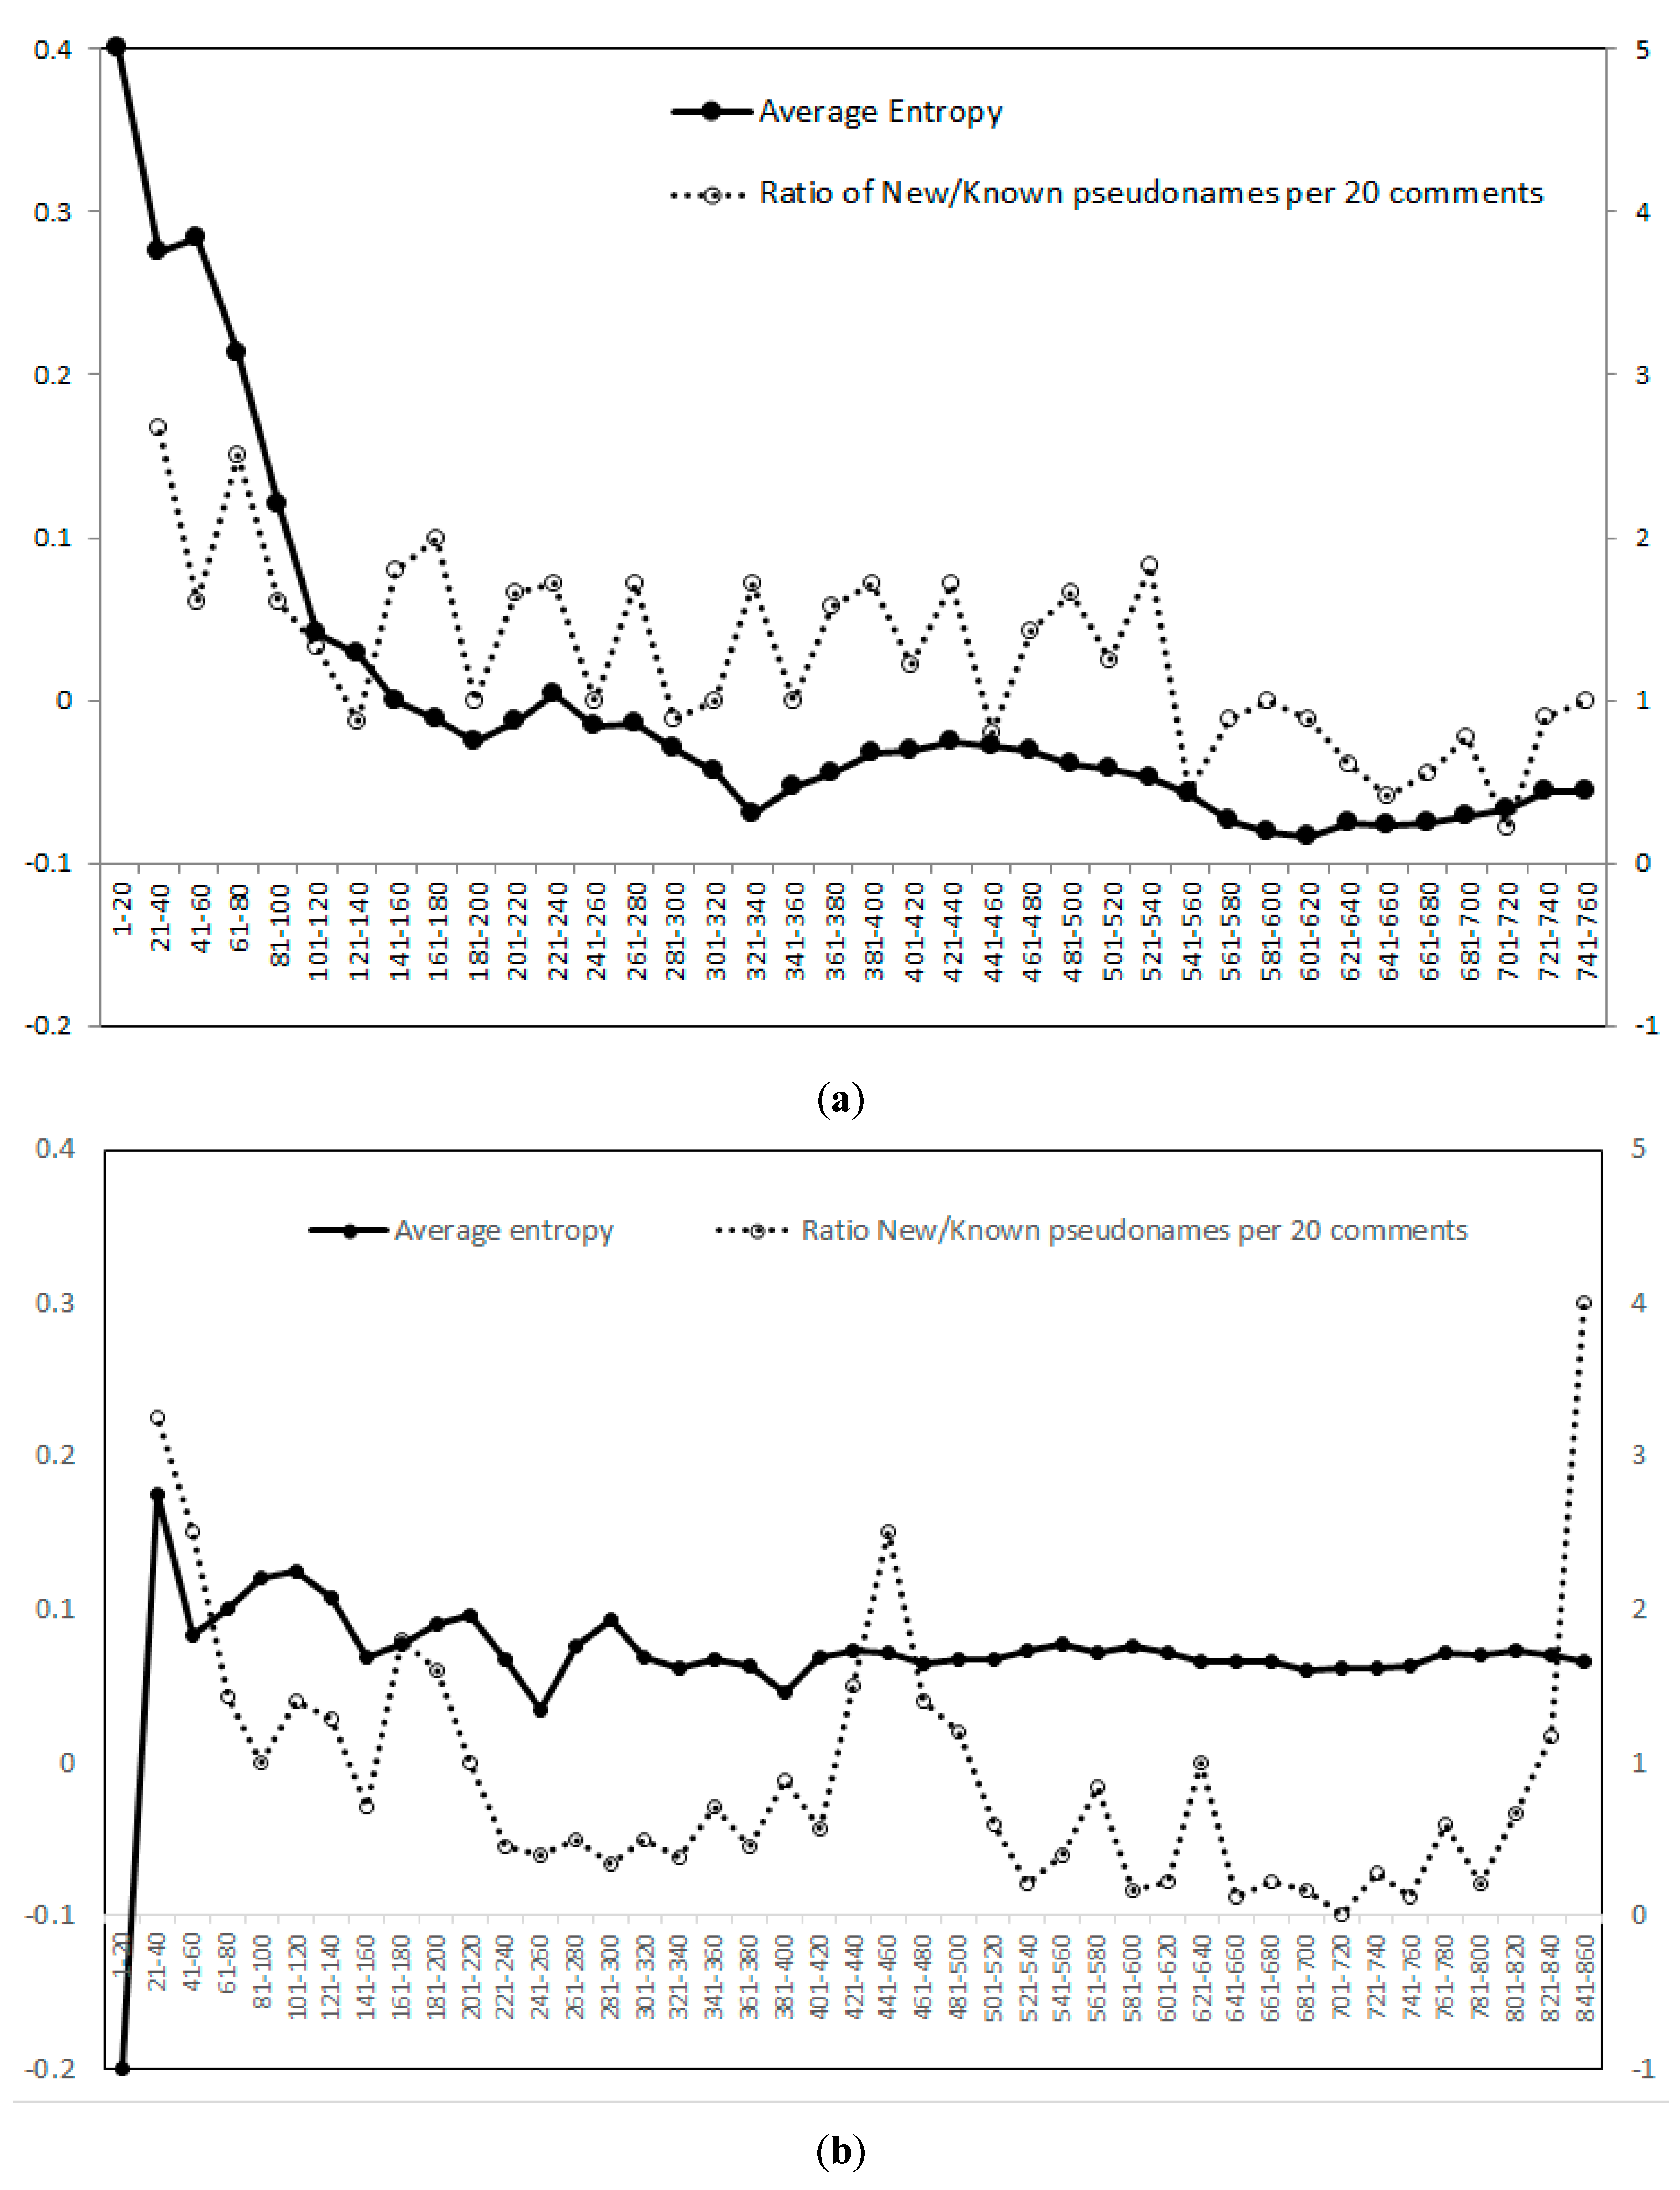
(a) The figure shows the <Ei> dynamics over the entire corpus of 775 comments on BBC article. Each black circle (full line, primary axis on the left) represents an incremental average value recalculated after the constant size window of 20 comments. The white circles (dashed line, secondary axis on the right) represent the ratio of the new over the previously involved commentators for each set of 20 comments. (b) The figure shows the dynamics of <Ei> over the entire set of 858 comments on The Telegraph article. Each black circle (full line, primary axis on the left side) represents the average incremental value recalculated after the constant size window of 20 comments. The white circles (dashed line, secondary axis on the right side) represent the ratio of the new and previously involved commentators, for each set of 20 comments.
Figure 12.
(a) The figure shows the <Ei> dynamics over the entire corpus of 775 comments on BBC article. Each black circle (full line, primary axis on the left) represents an incremental average value recalculated after the constant size window of 20 comments. The white circles (dashed line, secondary axis on the right) represent the ratio of the new over the previously involved commentators for each set of 20 comments. (b) The figure shows the dynamics of <Ei> over the entire set of 858 comments on The Telegraph article. Each black circle (full line, primary axis on the left side) represents the average incremental value recalculated after the constant size window of 20 comments. The white circles (dashed line, secondary axis on the right side) represent the ratio of the new and previously involved commentators, for each set of 20 comments.
4.1. Monitoring the State Variable of Sets of Comments as They Are Appearing in Time
Assigning to each comment a value −1 or +1 and linking it to one of the original Ei strings, to which the comment refers to, the value of the argument deteriorates. After a certain number of comments, the entropy of the system can be recalculated. This process can be continued by taking a measure of entropy after each X comment. To give an impression of the expected dynamics, we apply this procedure with a time step chosen to 20 (X = 20) in order to (approximately) match the size of the original blog/article. This is shown in Figure 12a for the BBC example and Figure 12b for The Telegraph example.Although those two examples show different behavior, they do show some similarities:
- -
- The first set of 20 comments is opposing/challenging the opinion promoted in the original article. In the BBC example, whose <Ei> < 0, the first set of comments has an <Ei> = 0.4. In the Telegraph example, <Ei> > 0, the first set of comments has an <Ei> = −0.2.
- -
- Increasing the number of comments, the order variable bounces back to the opinion/side that the original article has promoted.
- -
- After a number of fluctuations, the <Ei> saturates to a value of −0.07 for the BBC article and +0.07 for the Telegraph article.
- -
- The process of saturation of the order variable <Ei> is accompanied with the low level of interest of the readers (when the ratio New/Known pseudo names < 1).
The oscillatory dynamics of <Ei> as a function of time is significantly different in the two examples, and therefore we cannot approximate it by a mathematical function necessary for the estimation of pi. We might be able to find the indicators for the ‘jumps’ in the order parameter from the semantic similarity analysis applied to the level of the sets of comments. The string similarity measures such as Jaccard or Tversky distance as well as the Kullback-Leibler distance have already been tested for this purpose and their applicability seems to be feasible.
4.2. Monitoring the State Variable of Discussion Threads
The length and the balance of opinions of discussions could be proportional to the impact that the discussion has on the entropy of the system. Single comments would have much less impact then the comments given in a discussion engaging a number of persons. From the power law distribution of the discussion groups, the weight distribution can easily be recalculated and it will also be a power law function. The rating per discussion could be a parameter used for this purpose. To illustrate the shape of the statistics underlying the discussion thread structure, we use the BBC and Telegraph example data, as shown in Figure 13. The figure shows the order parameter <Ei> as a function of the discussion length Li. The data are very ‘promising,’ showing a tent-shaped distribution. Assuming that such a distribution exists would indeed shorten the entropy calculations significantly compared with the situation presented as case 1.
The red line in Figure 13 is an approximate border line and presented by an exponential function of the discussion length Li. It is expected that the value of <Ei> will fall between the border lines, described by Equation (3). In the given example, the upper and the lower part of the line are symmetrical, i.e., for any discussion length Li, the chance is equal that <Ei> will have a positive or a negative sign.
The constant is chosen such that Li = 1 returns Ei value of +/−1. This border line represents the maximal (absolute) expected value for the <Ei> of a discussion. Knowing this relation and knowing the distribution of the discussion thread lengths, the pi distribution could be recalculated. However, it would be necessary to apply some sort of normalization (providing ∑(pi) = 1).
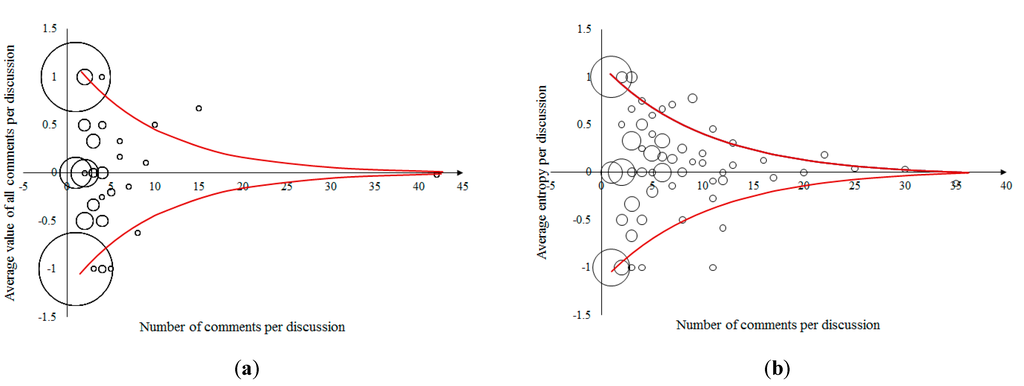
Figure 13.
(a) The figure shows the order parameter <Ei> as a function of the discussion length Li, measured for the discussions on the BBC site. Each circle of the minimum size represents only one discussion (such as the longest discussion of the length 42, which appears only once). The circle of the largest size represents 198 comments for which there was no reaction (−1, against conspiracy theories). The graph is rather symmetrical in the upper and the lower part. Clearly, there is a tendency to have stronger polarization of <Ei>, for the shorter discussions, while the longer ones are more “neutral”, the resulting order parameter being closer to zero. This tendency is visualized by the red line defined by Equation (3). (b) The figure shows the distribution of the <Ei> of the discussions on the Telegraph example. The circles of minimum size represent only one discussion (such as the longest discussion of the length 35). The circle of the largest size (1, pro conspiracy theories) represents 41 comments to which there was no reaction. The red line is following the exponential law from Equation (3).

4.3. Monitoring the Persons’ State Variable
Our intuition suggests that comments of the persons who are only involved in a single discussion would be weighted less than the comments of the persons who are very active and able to constantly provide strong opinions. From the power law distribution of the discussants activity, the weight distribution can easily be calculated. It will also be a power law function. In this case, a rating could be used to select the persons who are able to receive the support of the audience.
We have tested whether it would be useful to add additional weight coefficients to the comments of the persons more frequently involved in discussions by measuring the stability of the opinion of the discussants as presented in Figure 14. The weight factor could be estimated from the data distribution. The graph shows that discussants are typically very polarized (−1 or 1) for most of the persons. The change of entropy in these cases is almost ‘neutralized’ with opposite attitudes as long as the distribution that describes such persons is symmetric. However, there are also a number of persons whose opinion is not −1 or 1, but somewhere in between. Finally, there are also a number of ‘internet trolls’ who are posting off-topic messages. They are characterized with the Ei = 0 and the IN-degree = 0 and should not be taken into consideration when estimating the change of the order variable.
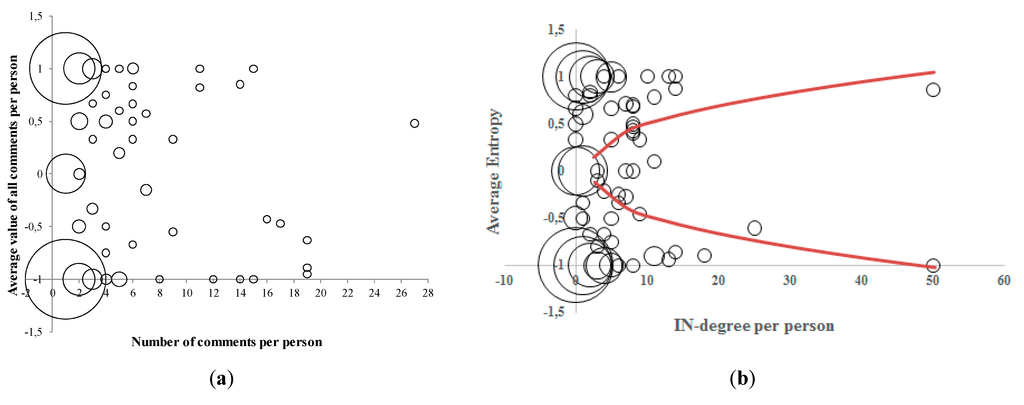
Figure 14.
(a) The figure shows the “stability” of discussants opinion, using the BBC example data. Each circle of minimum size represents the average opinion of only one person. The circle of the largest size represents the average opinions of 113 persons (those giving only one comment valued −1, i.e., against conspiracy theories). (b) The figure shows The Telegraph commentators’ opinion as a function of their IN-degree ratio.

The red borderline in Figure 14 is a power law function of the persons’ IN-degree (number of received comments).
The constant in Equation (4) equals to the maximum IN-degree of all persons. The red border line in Figure 14 represents the minimum absolute expected value <Ei> of a person. As a first approximation, and in combination with the distribution of the persons IN-degree estimated of Section 3, this simplified relation could also be used to determine pi (after applying some sort of normalization which would provide that ∑(pi) = 1).
An interesting side-observation from Figure 14 is that the persons with the largest IN-degree are at the same time the “stubborn” persons who are not changing their original view (and therefore have a highly polarized average Ei). It looks as if they get involved in discussions while trying to convince the others to change their opinion. This behavior in the on-line environment is, according to the recent work of Fisher and Keil [18], not surprising. Namely, they claim that the nature and context of argumentative exchange depends on the social context and distinguish two different modes of argumentation: arguing to win and arguing to learn. They experimentally proved that arguing in private prompts a mindset of arguing to learn, while arguing in public prompts a mindset of arguing to win. Further, they also show that the choice of the person with whom participants chose to argue varied as a function of either a public or private social setting. Namely, there is a preference to argue with the less knowledgeable person in public and with the more knowledgeable person in private. From this perspective, all on-line discussions, being placed in a public setting, although behind pseudo names, are accommodating “argue to win” discussion modus.
5. Conclusions
A society that has suffered a terroristic attack needs to interpret the associated message. When there is violent political conflict, the goals of terrorists extend beyond the victims that have been physically targeted to also affect the public at large. The broader the public is affected by such a violent disturbing event, the more active is the search for information and arguments to explain it, hoping that further attacks may be prevented. Once the official report of the attack is available, it frequently happens that conspiracy theories arise.
Two weeks after the recent terrorist attack on the French satirical weekly magazine Charlie Hebdo and the Kosher supermarket in Paris in January 2015, in which a total of 17 people were killed, public opinion polls [19] have shown that a significant number of French citizens held conspiratorial beliefs about these events (17%). The dynamics of the discussions of such rumors on the French news site Le Monde has been a subject of a recent research [20], which shows that the rumors there were short-lived.
Some terrorist groups realized that targeted attacks have a better chance to win support of possible followers, while blind violence usually hurts public support. Similarly, an inadequate official response could guide public opinion to their advantage. Conspiracy theories on their own can have an additional leveraging (self-fulfilling prophecy) effect. When they are successful in pointing out that the violence cannot be clearly attached to the terrorists, a part of peaceful political activists, whose political goals agree at least partially with those of the terrorists, may decide to align with the terrorists.
To tackle such questions, we have applied the concept of entropy as a measure of the penetration depth of a conspiracy theory (i.e., a measure for the information uncertainty that the conspiracy theorists introduce through various on-line content). Our basic model and the associated pioneering empirical studies point out the necessity to extend the common measures of information with some aspects of social network theory and some semantic string similarity measures in order to enable a qualitative analysis of a large data corpus. In this particular application, we deal with the information, which carries subjective and personal content rather than purely factual content and aspects of mental processing not governed by regular Boolean logics.
Working with such information at the level of individual comments would be the common way to define entropy for a text based on the Markov model. However, this procedure would be not only cumbersome, but it could also produce an impractical and inconclusive result. A procedure with an intermediate aggregation would however lead to an accelerated process, and to a result that could be of use in building and moderating discussion platforms. Applying our proposed model to the data gathered 10 years after the 9/11 attack, we have shown that the average order parameter <Ei> per set of 20 comments approaches a value very close to zero in both examples. This result shows that opinions are still divided around 9/11 conspiracies (the comments to the BBC article lead to a slightly negative value against conspiracy, while the comments to the Telegraph blog lead to a slightly positive value pro-conspiracy).
More precisely, one needs to employ the knowledge of interaction patterns in order to classify the content of messages and traces of conspiratorial beliefs. Our current model indeed includes the relevant aspects that have to do with the properties of networks of both comments and persons who are posting them. In an improved model, one should recognize and measure the common vocabulary that labels and singles out/separates certain semantic proximity, symmetry or idiomatic expressions (e.g., revolution vs. violence, jihad vs. terrorism, freedom of expression vs. blasphemy, multicultural vs. apostate, free thinker/nonbeliever, etc.). While the use of one word or another does not affect the information content, it does label and affect the emotional content and dynamics of the interactions.
Tagging the above signs could be used for machine learning training in order to classify the order parameter of the individual comments. The large training sets produced on the articles of similar content in different social or geographical environments, supported by the underlying assumptions of the predefined statistics based on the social and comments networks, can provide information theory measures, and employ entropy concepts in dealing with subjective/social/human dynamics. This is a long overdue move which may largely benefit both the exact sciences as well as the social/human sciences. We hope that our first stage calculations will trigger additional investigations towards developing a full integration of the various ideas discussed here towards a coherent and feasible procedure.
Supplementary Files
Supplementary File 1Acknowledgments
We acknowledge all participants of the Workshop “From Opinion Dynamics to Voting, Conflict and Terrorism” held 30/31 March in Paris for useful interactions. This work has been performed under the grant DGA-2012 60 0013 00470 75 0.
Author Contributions
Both authors contributed, conceiving the concept and developing it into the final presentation. Both author have read and approved the final manuscript.
Conflicts of Interest
The authors declare no conflict of interest.
References and Notes
- Galam, S; Mauger, A. On Reducing Terrorism Power: A Hint from Physics. Physica A 2003, 323, 695–704. [Google Scholar]
- Galam, S. The September 11 Attack: A Percolation of Individual Passive Support. Eur. Phys. J. B 2002, 26, 269–272. [Google Scholar] [CrossRef]
- Galam, S. Modelling Rumors: The no Plane Pentagon French Hoax Case. Physica A 2003, 320, 571–580. [Google Scholar] [CrossRef]
- Bessi, A.; Mauro, C.; George, A.D.; Antonio, S.; Guido, C.; Walter, Q. Science vs Conspiracy: Collective Narratives in the Age of Misinformation. PloS One 2015. [Google Scholar] [CrossRef] [PubMed]
- Zhou, D.; Basu, S.; Mao, Y.; Platt, J.C. Learning from the Wisdom of Crowds by Minimax Entropy. In Advances in Neural Information Processing Systems, Proceedings of 26th Annual Conference on Neural Information Processing Systems (NIPS), Lake Tahoe, NV, USA, 3–8 December 2012; Pereira, F., Burges, C.J.C., Bottou, L., Weinberger, K.Q., Eds.; pp. 2195–2203.
- Opinion Polls about 9/11 Conspiracy Theories. Available online: http://en.wikipedia.org/wiki/Opinion_polls_about_9/11_conspiracy_theories (accessed on 31 July 2015).
- Sondothèque du Centre de Recherches Politiques de Sciences Po. Available online: http://www.cevipof.com/fr/le-centre/le-centre-de-documentation/ (accessed on 3 August 2015).
- Meyssan, T. L’Effroyable Imposture; Editions Carnot: Chatou, France, 2002. [Google Scholar]
- International Poll: No Consensus on Who Was Behind 9/11. Available online: http://worldpublicopinion.org/pipa/articles/international_security_bt/535.php?lb=brglm&pnt=535&nid=&id (accessed on 31 July 2015).
- Attentats du 11 Septembre: Les Français et la Théorie du Complot. Available online: http://www.tns-sofres.com/etudes-et-points-de-vue/attentats-du-11-septembre-les-francais-et-la-theorie-du-complot (accessed on 31 July 2015).
- 11-Septembre: Non,58% des Français ne Croient Pas à la Théorie du Complot. Available online: http://leplus.nouvelobs.com/contribution/191255-11-septembre-non-58-des-francais-ne-croient-pas-a-la-theorie-du-complot.html (accessed on 31 July 2015).
- Les Commanditaires et Auteurs Perçus des Attentats de New York en 2001 et de Paris et Montrouge en 2015. Available online: http://www.ifop.com/media/poll/2914-1-study_file.pdf (accessed on 31 July 2015).
- 9/11 Conspiracy Theories: How They’ve Evolved. Available online: http://www.bbc.com/news/magazine-14665953 (accessed on 31 July 2015).
- Ratinaud, P. IRaMuTeQ: Interface de R pour les Analyses Multidimensionnelles de Textes et de Questionnaires. Available online: http://www.iramuteq.org/ (accessed on 31 July 2015).
- Nilesh, D.; Dasgupta, A.; Kumar, R.; Rastogi, V. Aggregating Crowdsourced Binary Ratings. In Proceedings of the 22nd International Conference on World Wide Web, Rio de Janeiro, Brazil, 13–17 May 2013; pp. 285–294.
- Wood, M.J.; Douglas, K.M. “What about Building 7?” A Social Psychological Study of Online Discussion of 9/11 Conspiracy Theories. Front. Psychol. 2013, 4, 1–9. [Google Scholar] [CrossRef] [PubMed]
- Muchnik, L.; Aral, S.; Taylor, S.J. Social Influence Bias: A Randomized Experiment. Science 2013, 341, 647–651. [Google Scholar] [CrossRef] [PubMed]
- Fisher, M.; Keil, F. Arguing to Win or to Learn: Situational Constraints Prompt Contrasting Mindsets. J. Exp. Psychol. Gen. 2015. submitted. [Google Scholar]
- Les Français et l’hypothèse d’un Complot lors des Attentats de Charlie Hebdo et de la Porte de Vincennes. Available online: http://www.csa.eu/multimedia/data/sondages/data2015/opi20150126 -csa-pour-atlantico-les-francais-et-lhypothese-dun-complot.pdf (accessed on 31 July 2015).
- Golo, N. A case study of conspiracy theories about Charlie Hebdo terrorist attack. 2015. in preparation. [Google Scholar]
© 2015 by the authors; licensee MDPI, Basel, Switzerland. This article is an open access article distributed under the terms and conditions of the Creative Commons Attribution license (http://creativecommons.org/licenses/by/4.0/).