Biological Aging and Life Span Based on Entropy Stress via Organ and Mitochondrial Metabolic Loading


Abstract
:1. Introduction and Rationale
- First and second Law and availability analyses of oxidation of nutrients: CH, F and P and their mixtures and the relation to life span of BS.
- Adiabatic temperature rise in combustion of fuels [12] vs. maximum temperature rise of blood leaving the organs either from basic principles of nutrient oxidation or from allometric laws.
- Oxidation of a single carbon particle and carbon particle temperature vs. oxidation of nutrients in cells and single cell temperature.
- Adoption of literature on SERR from oxygen deficient carbon cloud in engineering [7] to specific energy release rate SERRk (W/(kg of organ k)) or specific metabolic rate of organ k (SMRk) (k = Brain, heart, kidney, etc.), and bridging of gap between data on body mass independent SMRk data of Elia [8] (but still depends on type of organ or its enzyme) with those of body mass-dependent SMRk data of Wang [13] and Singer’s data [10] in biology. The SMRk will be a function of size of organ or mass of organ k when one of the following conditions are satisfied: (1) diffusion of oxygen dominates for large organ (i.e., there are a large number of cells within organ or abundant active enzymes are present in mitochondria); (2) the energy release rate is kinetically limited with first order (Michaelis Menten (MM)) kinetics (enzymes are limited or not active) SMRk is independent of organ mass under zero order kinetics or when organ size is small which leads to Elia constant in biology [13].
2. Literature Review and Background
2.1. Second Law, Irreversibility Rate () and Entropy Generation Rate ()
- Homogeneous where one considers whole body as homogeneous system and
- Heterogeneous where the metabolic rate of whole body is considered to be a sum of metabolic rates of internal organs with each organ serving as system.
2.2. Homogeneous Approach
2.3. Heterogeneous Approach
2.4. Allometric Laws-Organs
2.5. Biological and Chronological Aging
3. Objectives and Methodology
3.1. Objectives
3.2. Methodology
- Extend the 5 organ analysis (B-H-K-L-R5) to 7 organs/compartments (AT-B-H-K-L-R7-SM) and tissues (SM and AT) and residual mass (R7).
- Calculate the specific metabolic rate, (W/kg of organ k) and entropy generation rate within organ k, (W/(K kg of organ k)) (Equations (12) and (13) respectively, Section 2) as function of age(t).
- Using allometric laws for mitochondrial density (Equation (15)), estimate Mito volume-based specific entropy generation rate per unit volume of mitochondria (W/cm3 of Mito within organ k).
- Since body mass is not constant, then use body mass growth data with age and the SMRk relation in terms of body mass (Equation (8), Section 2) to estimate growth correction factor, GCF.
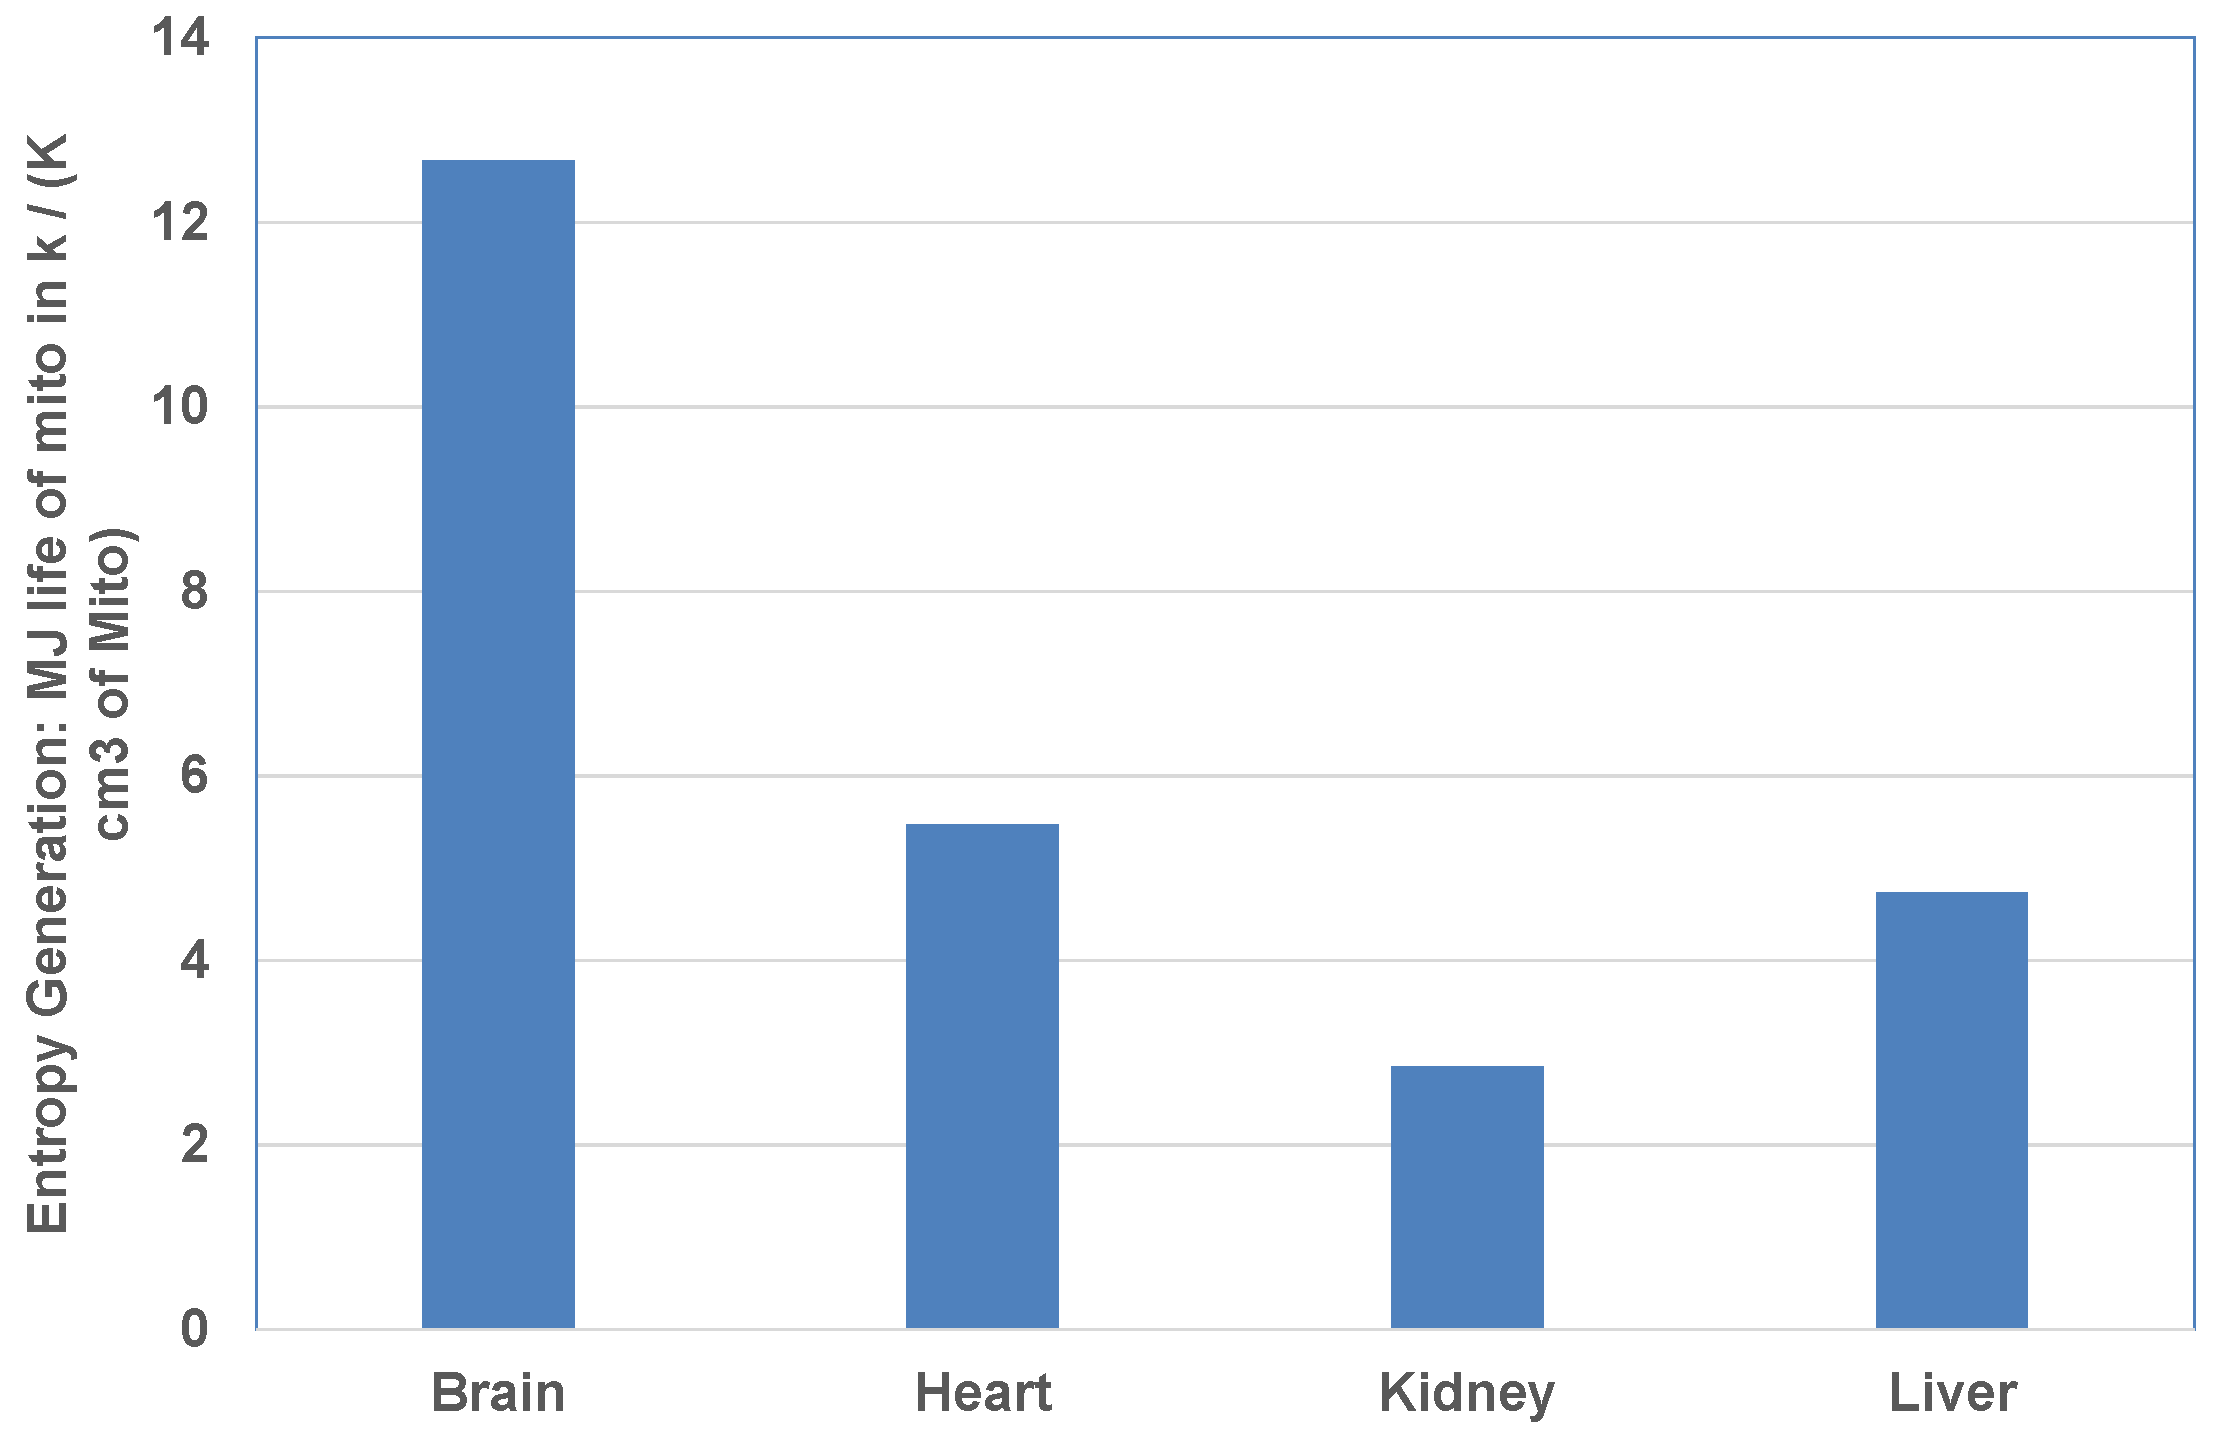
- Using GCF, rank the organs based on mitochondrial metabolic loading (MJ in organ k over life/cm3 of Mito) and entropy stress (MJ in organ k over life/(K cm3 of Mito)).
4. Modeling and Relations for Specific Energy Release and Entropy Generation of Organs
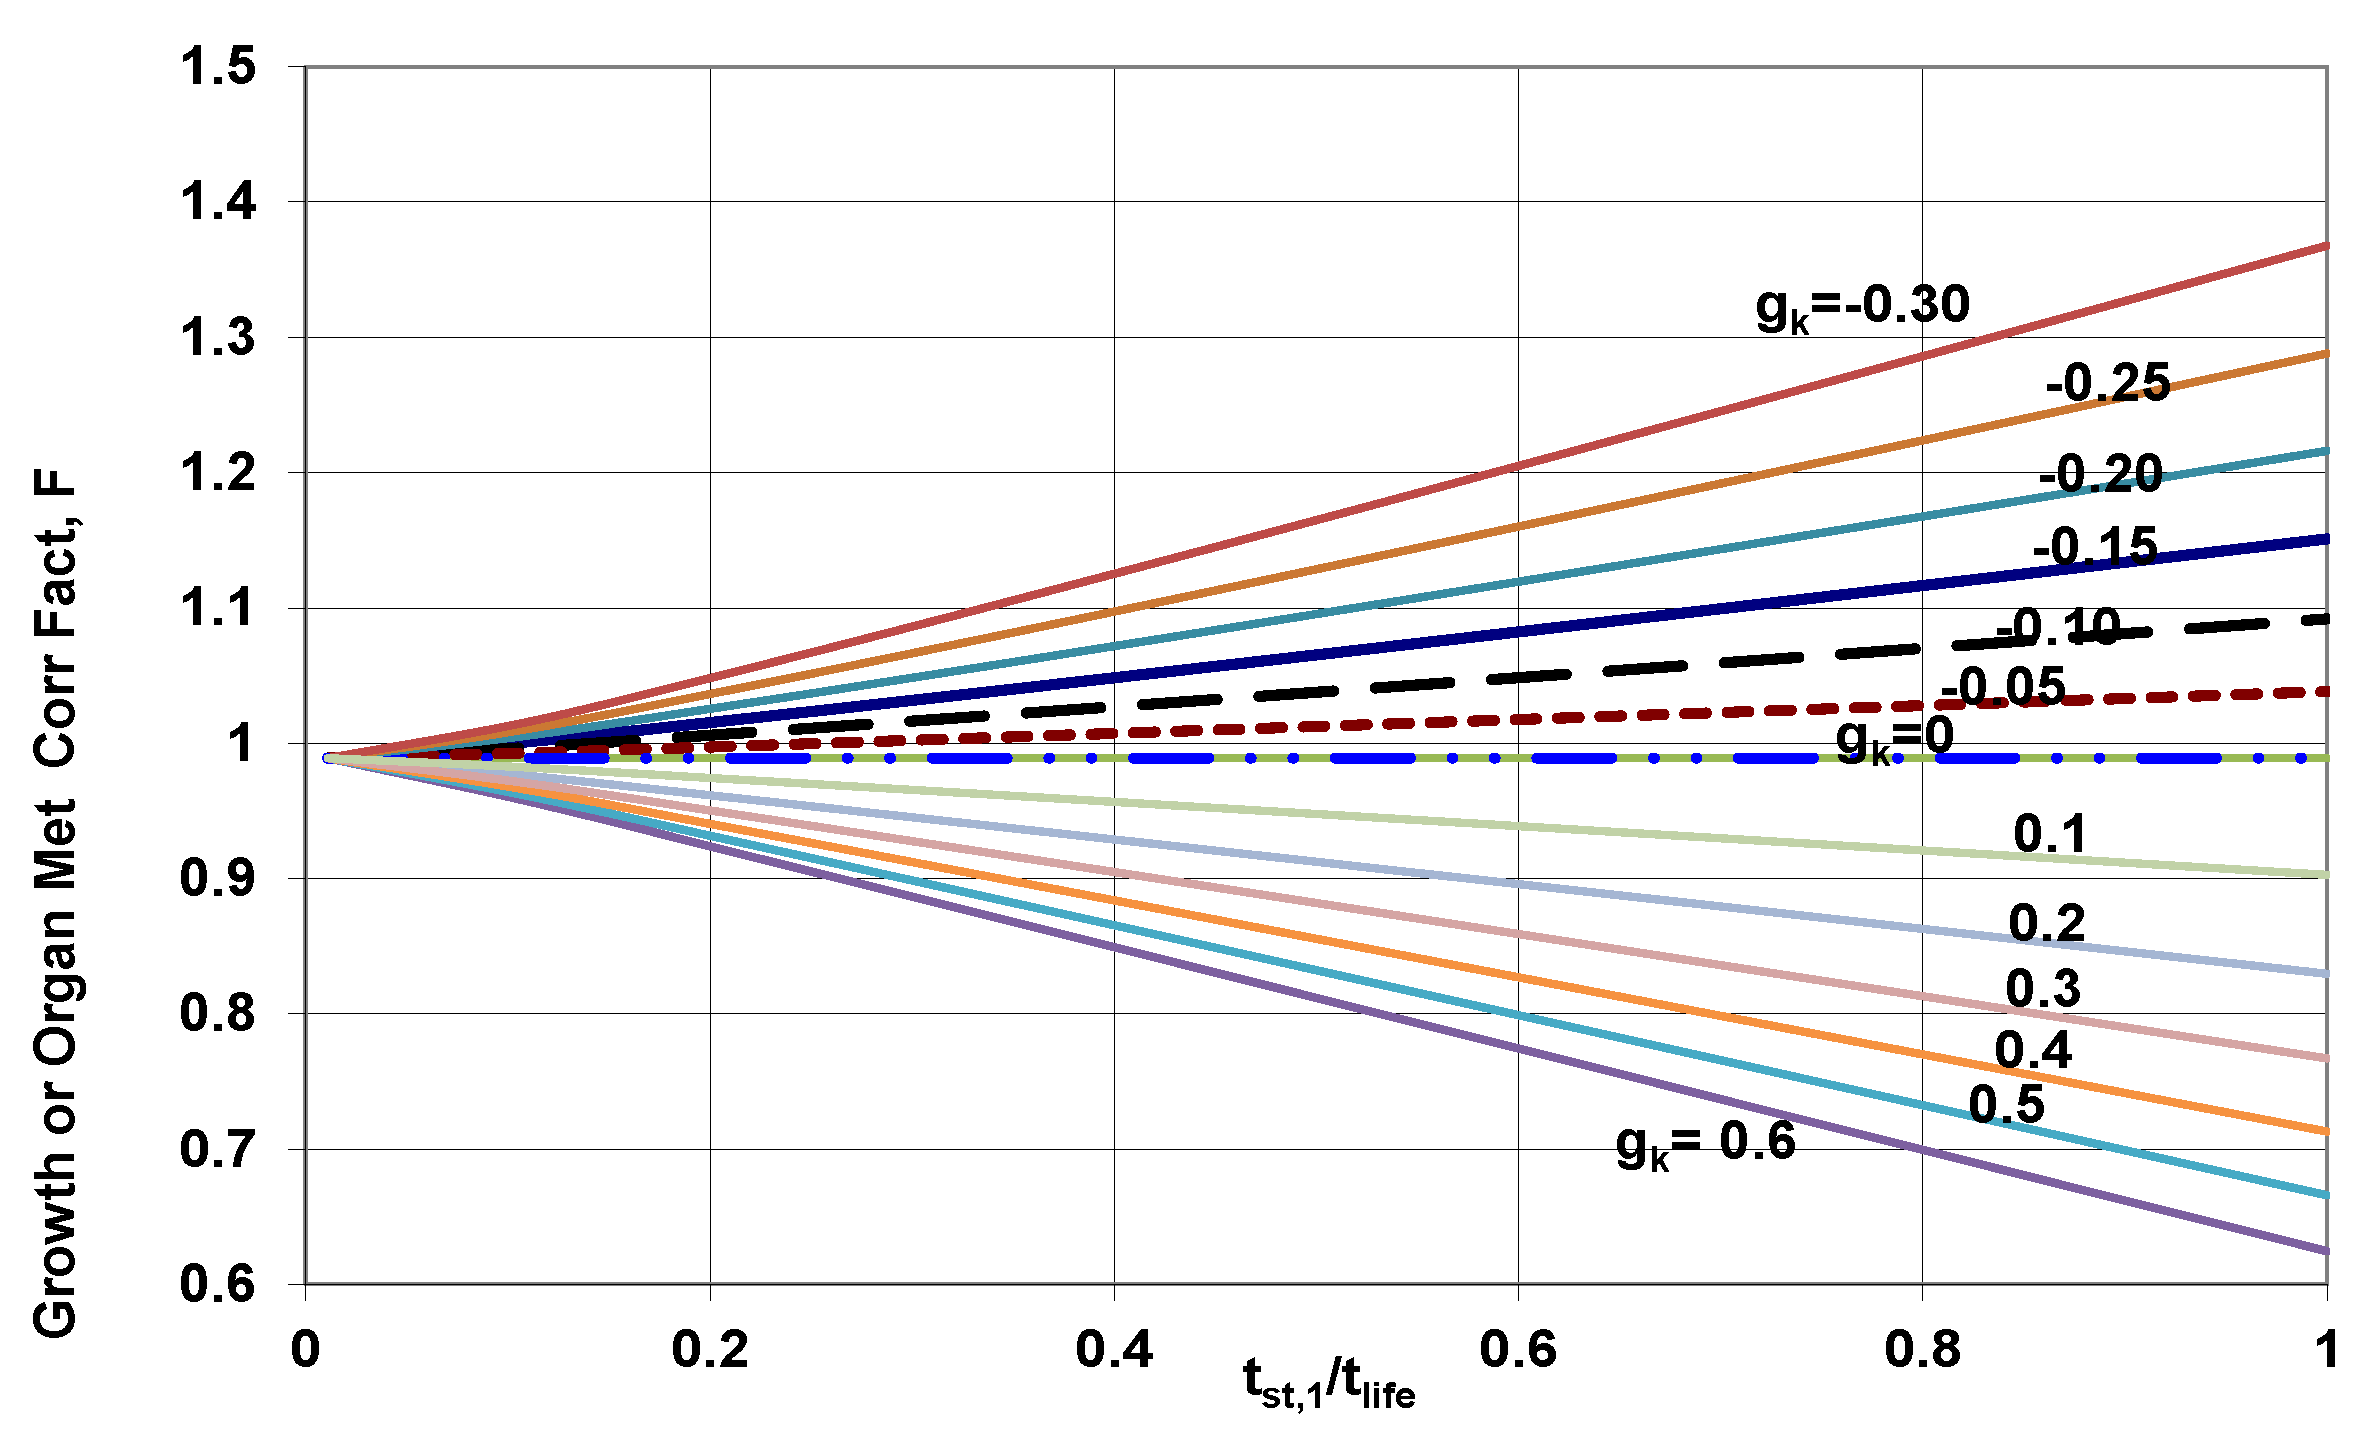
4.1. Growth Correction Factor (GCF)
4.2. Lifetime Specific Energy Release of Organ
4.3. Mitochondrial Metabolic Loading
4.4. Maximum Possible Blood Temperature
5. Results and Discussion
5.1. Nutrient Properties and Body Mass Growth Data
5.2. Basic Allometric Constants
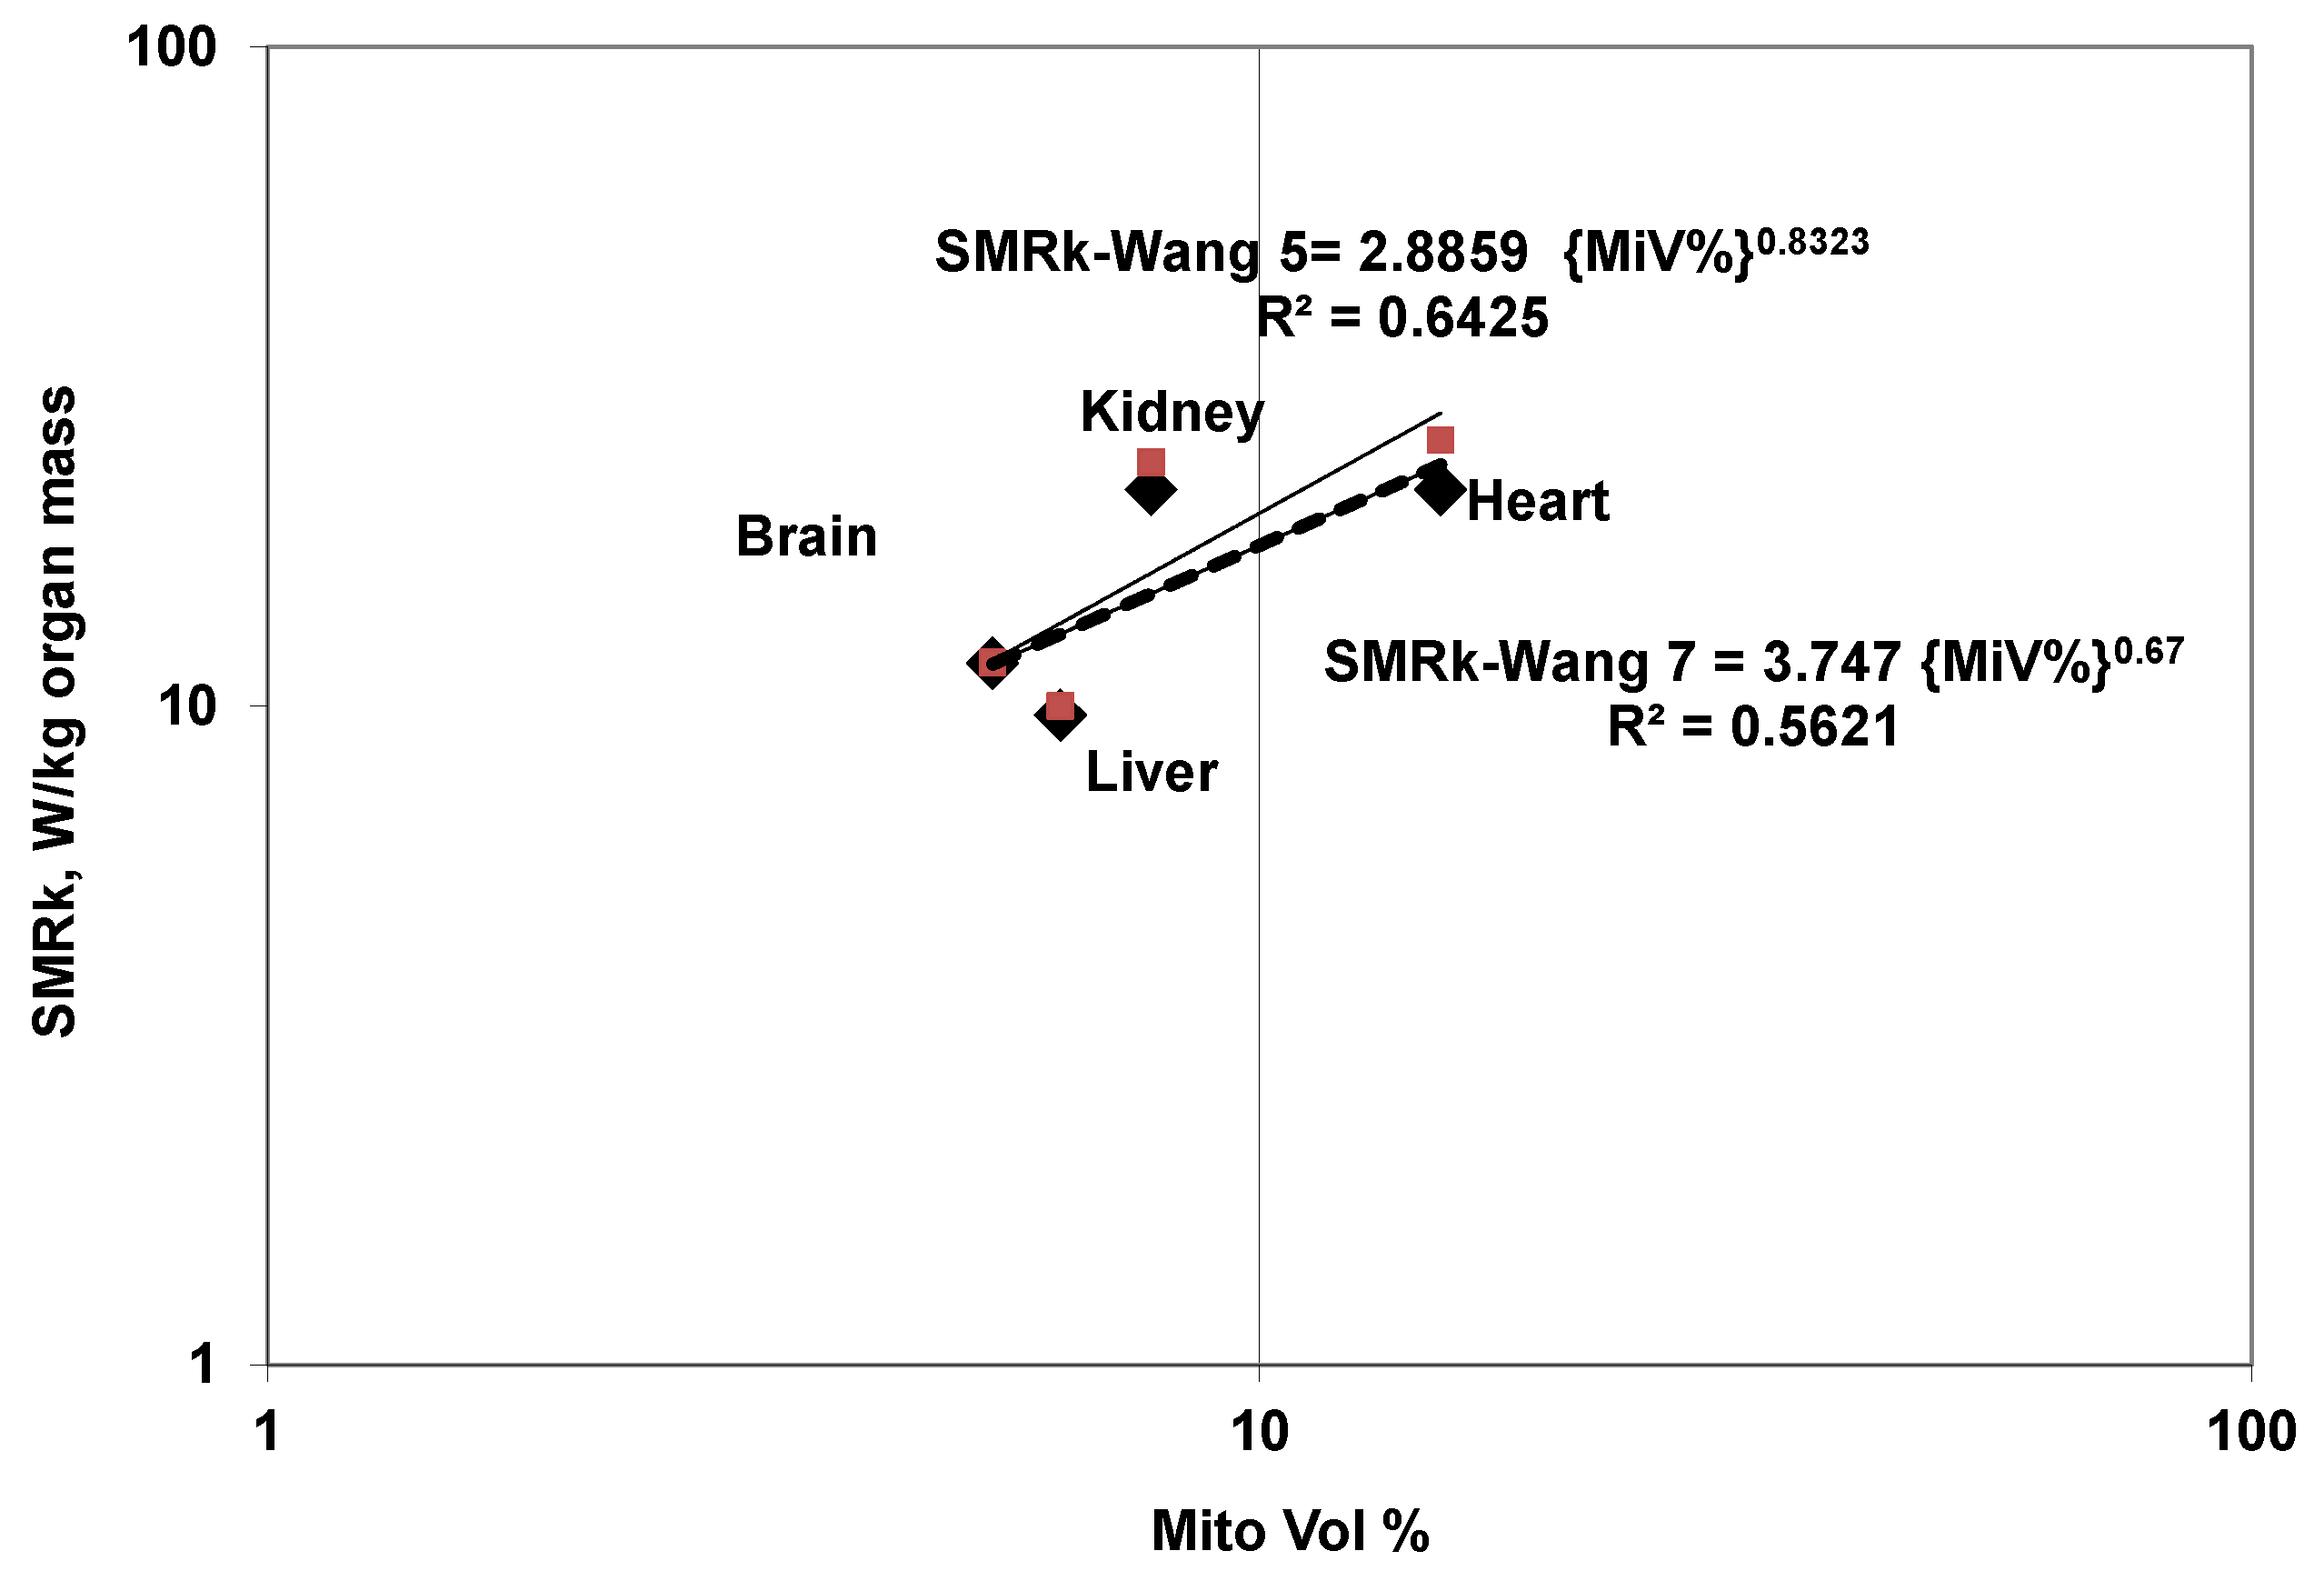
- Wang-5-Wang SMRk or SMRk (5 Organ Model): Here the whole body is divided into 5 organs: B, H, K, L, and R5 where R denotes residual mass and R5 denotes residual mass in the 5-organ model. Table 3 lists the basic allometric constants. The in vivo measurements of O2 concentration differences between artery and vein, and blood flow rate measurement provided data on organ metabolic rates. Using data for 6 species (Rat, rabbit, cat, dog, human-1, human-2) (0.48–70 kg), Wang et al. presented allometric relation for body mass-dependent SMRk and organ mass in terms of body mass and the basic allometric constants are listed (within parentheses) in Table 3 [19].
- Wang 7–Elia-SMRk Model: The allometric constants were presented by Wang et al. considering a body with 14 organs: four higher metabolically active vital organs: BHKL, two intermediate organs, AT and SM and eight low level metabolic organs with equal metabolic intensity: adrenal, blood, gut, lung, skin, skeleton, spleen and thyroid. For the current work, the whole body is divided into 7 organs: BHKL, AT, SM and R7 (R7: Residual mass for 7-organ model). The allometric constants for SMR of R7 are different from R5 due to the following: body mass independent SMRk throughout growth [13] i.e., constant irrespective of size/mass of selected vital organ, R7 mass is different and the R7 includes 8 sub-organs: adrenal, blood, gut, lung, skin, skeleton, spleen and thyroid. The allometric constant for R7 are curve fitted in terms of body knowing the constants for 8 sub-organs. Table 3 lists the basic allometric constants for Wang-7 organ model.
- Blood Flow Rate and Mitochondrial Volume Fraction (MiV): The basic allometric constants for blood flow rate to each organ (mL/s per kg organ k), and average mitochondrial volume fraction (vfk,Mito, cm3 of Mito/cm3 of cells within organ k), etc are given in terms of body mass (mB, kg) (Table 3).
5.3. Derived Allometric Constants
5.4. Maximum Possible Blood Temperature
- body mass, which affects the blood flow rate and metabolic rates of an organ
- blood flow rates and OEF during resting period exercise (during exercise the metabolic rate may increase to 480 W, almost 6 times that of normal resting metabolic rate which requires skin blood flow rate of almost 1.9 L/min for 1.8 m2 area person. Core to skin temperature difference is of the order of 5 °C with skin temperature around 30–31 °C) [40]
- metabolic efficiency
- nutrients oxidized and concussion in brain which affect metabolic efficiency
5.5. Results Based on Organ
5.5.1. Metabolic Efficiency
5.5.2. Growth Correction Factor (GCF)
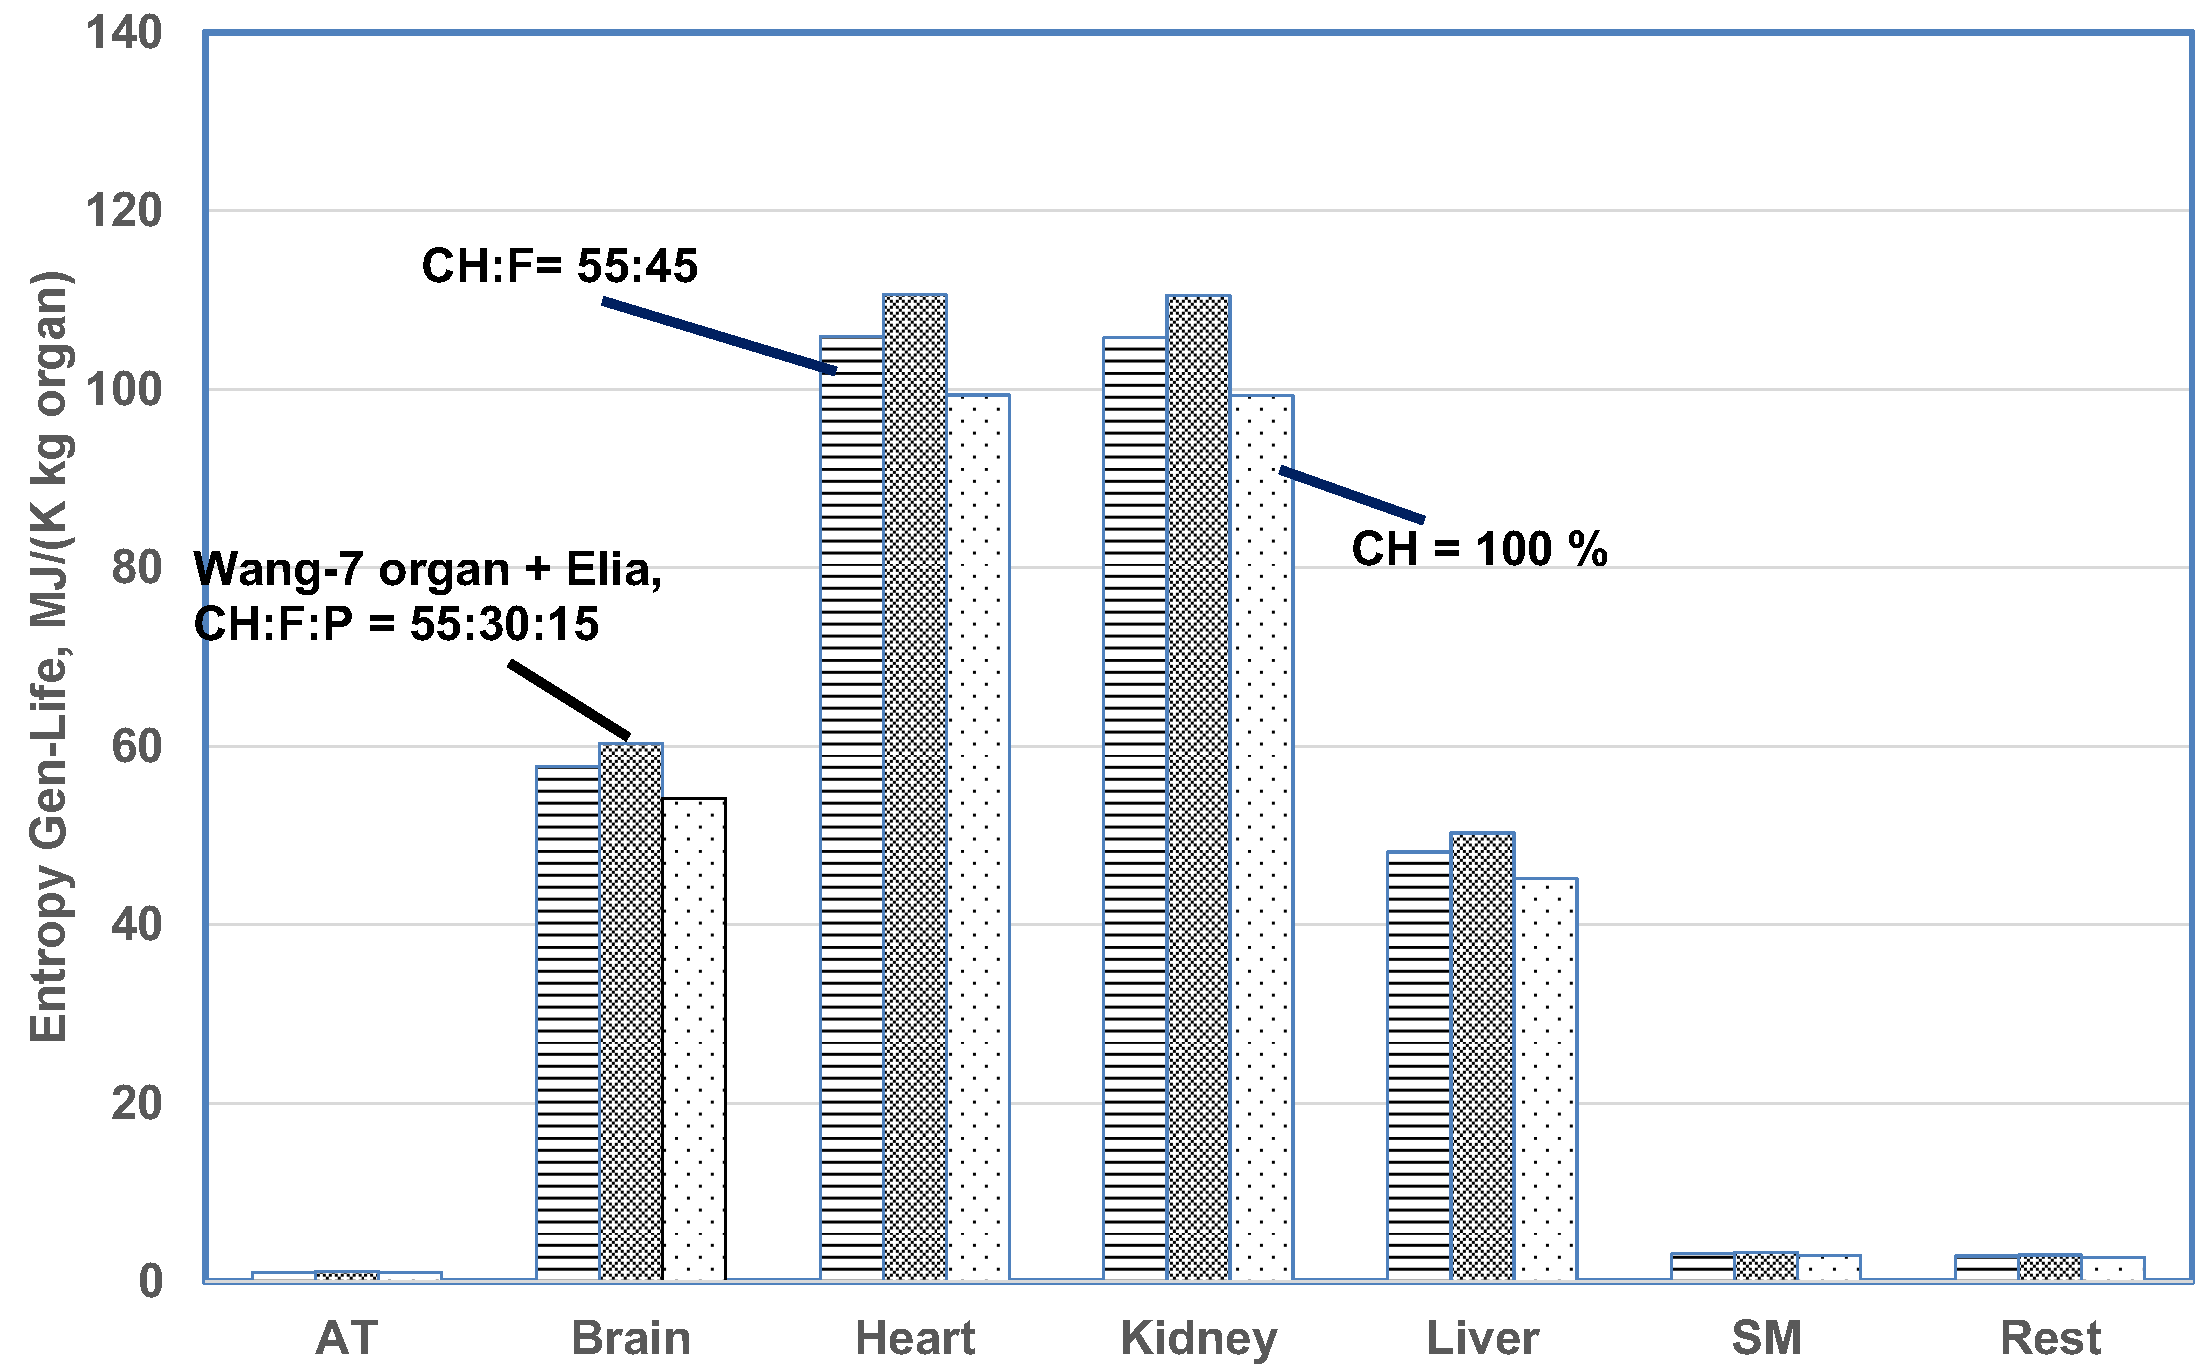
5.5.3. Effects of Diet Composition
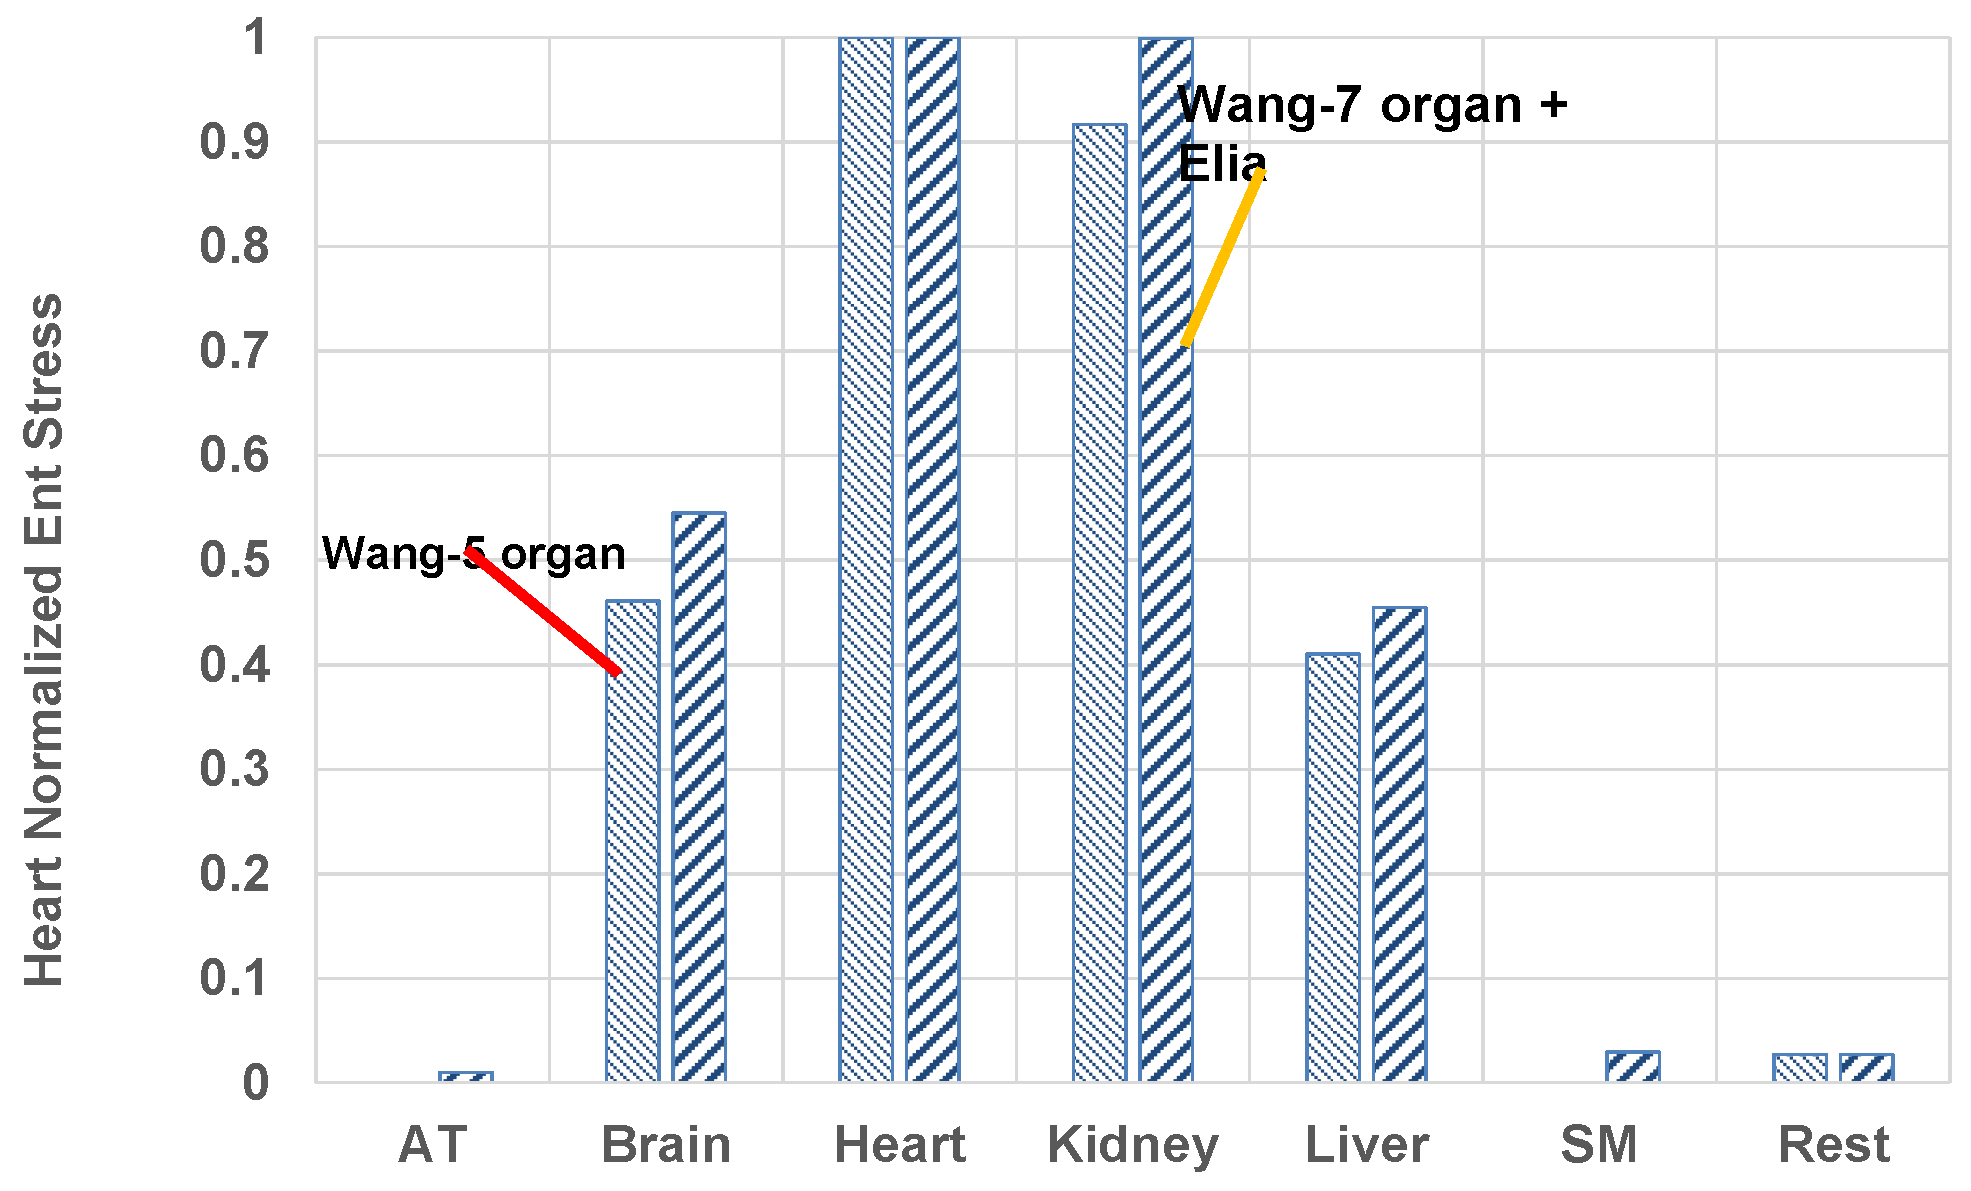
5.5.4. Effects of 5 Organ vs. 7 Organ Models
5.6. Results Based on Mitochondria
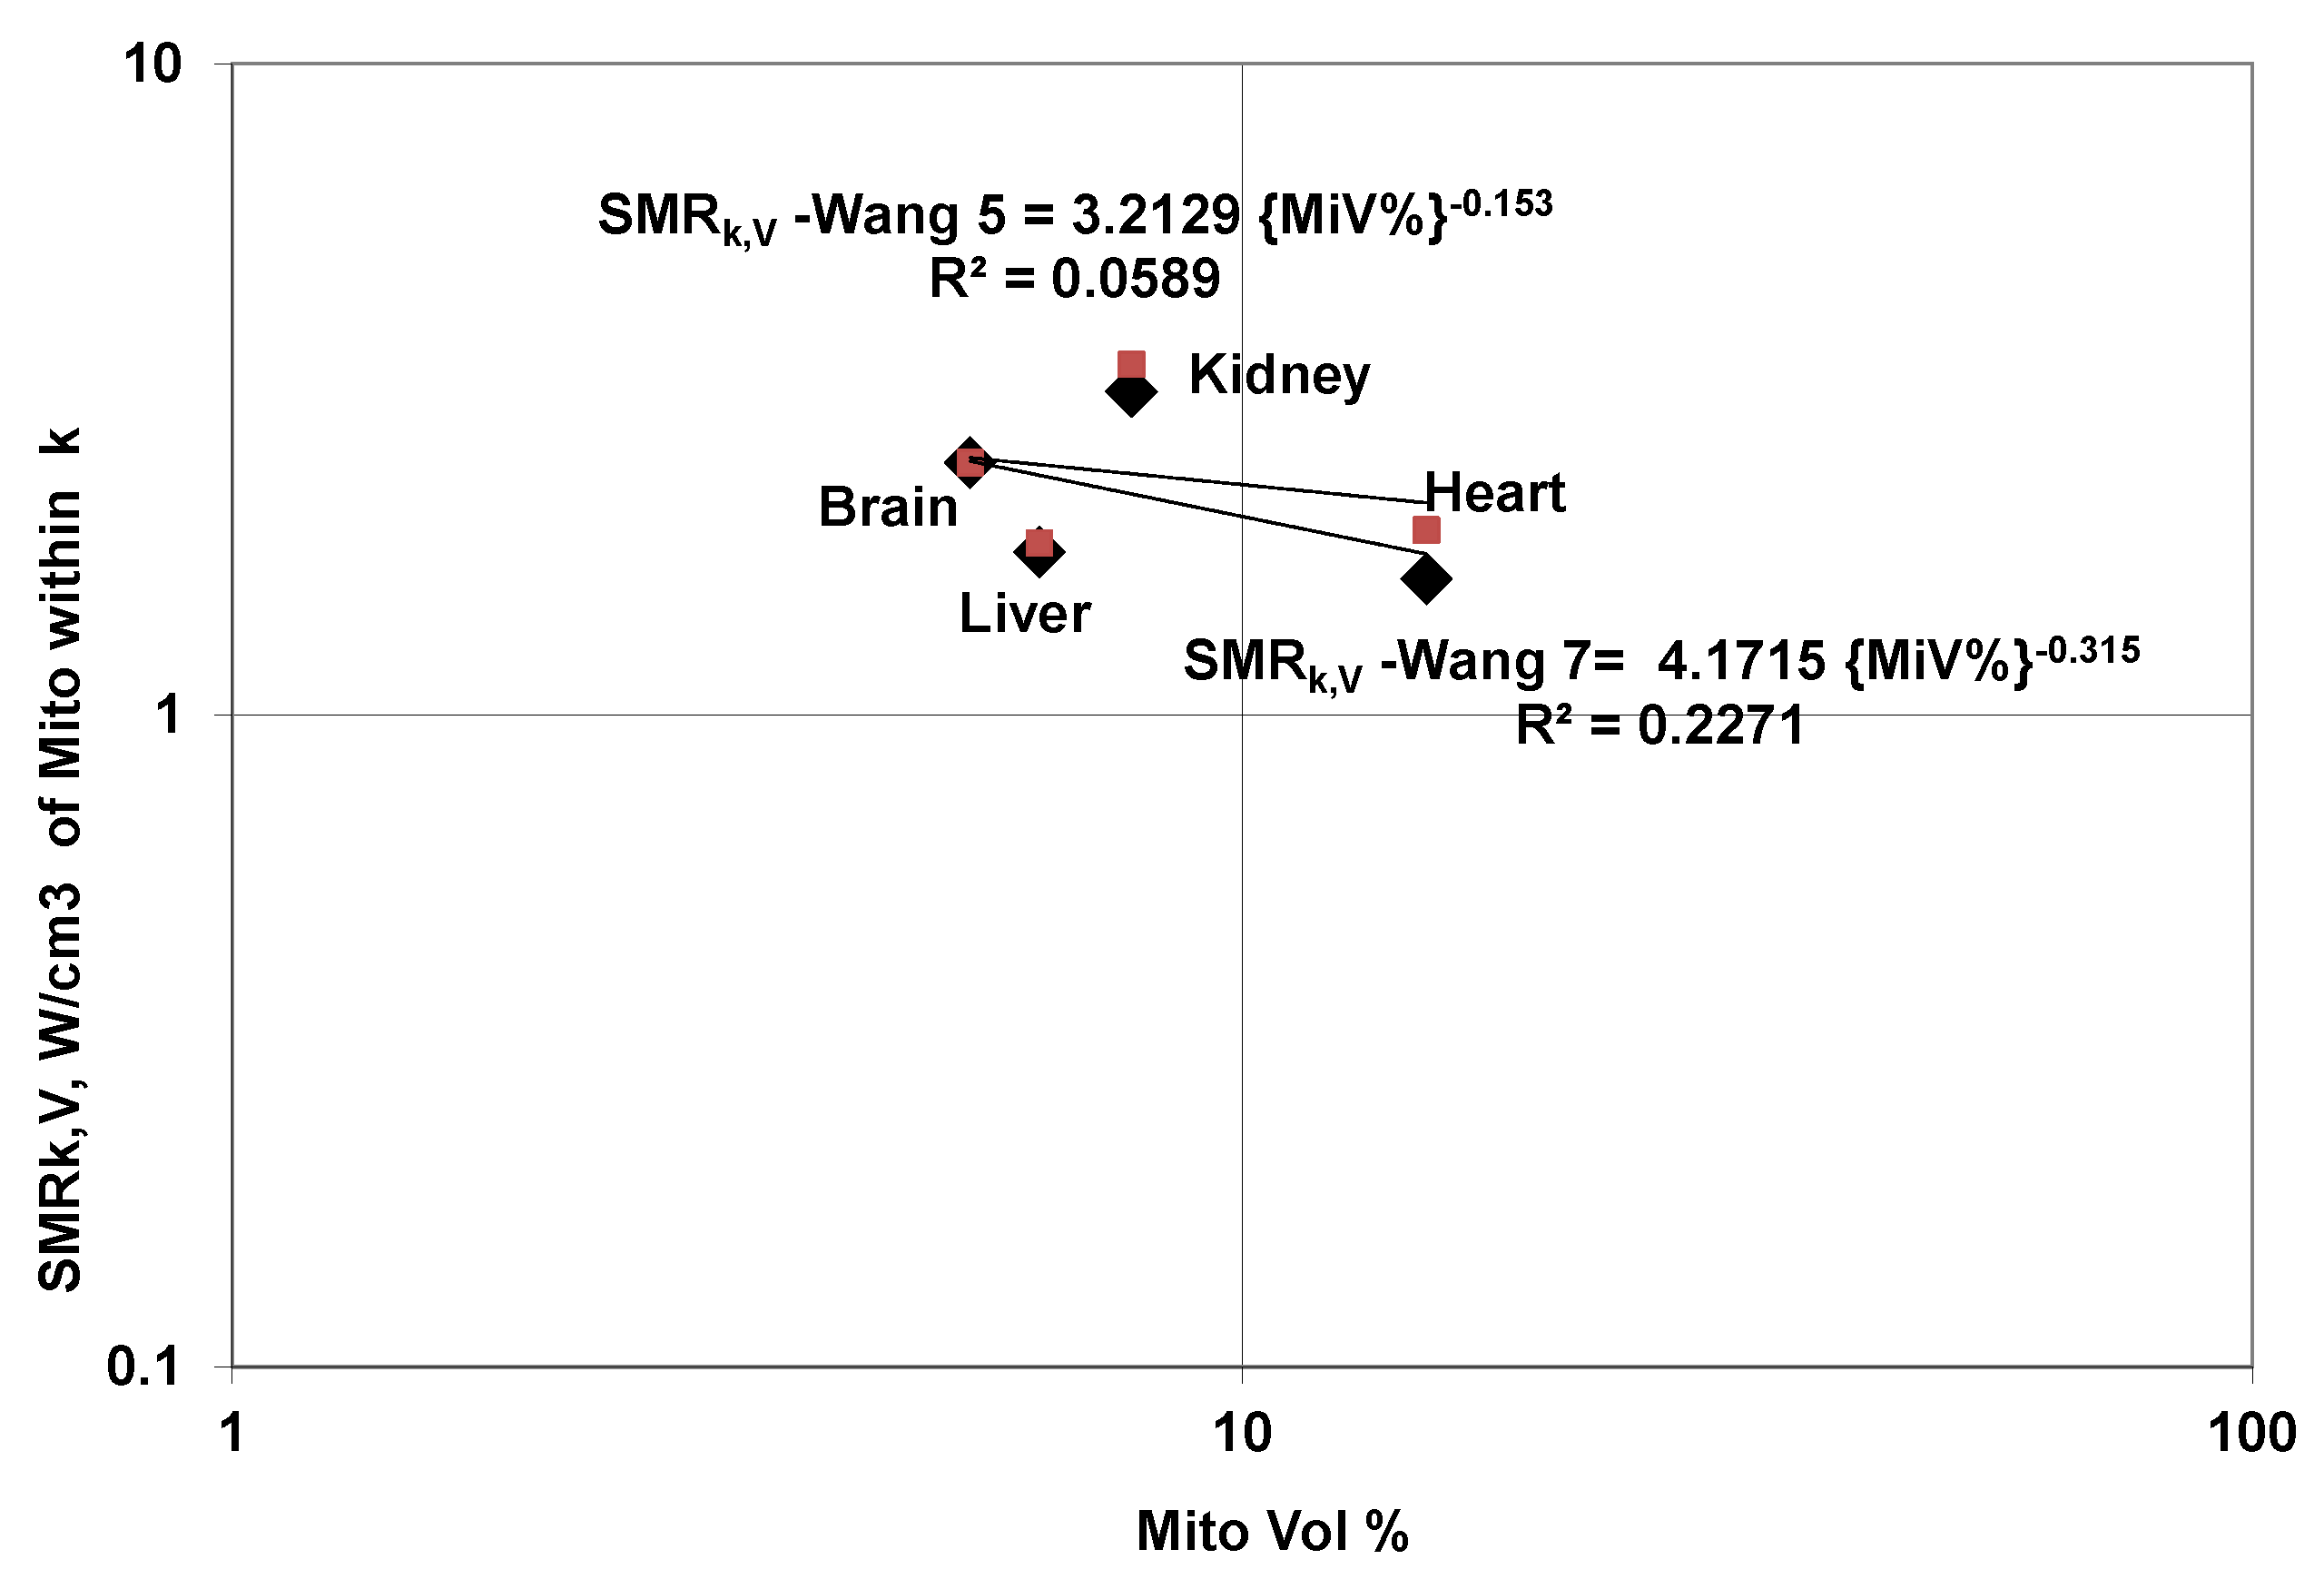
5.6.1. SMRk (W/kg Organ k) Variation with Mito Volume
5.6.2. SMRk,V,Mito (W/cm3 of Mito) Variation with Mito Volume
5.6.3. SMRk,V,Mito Variation of Organs with Body Mass
6. Suggested Procedure for Estimation of Biological Aging
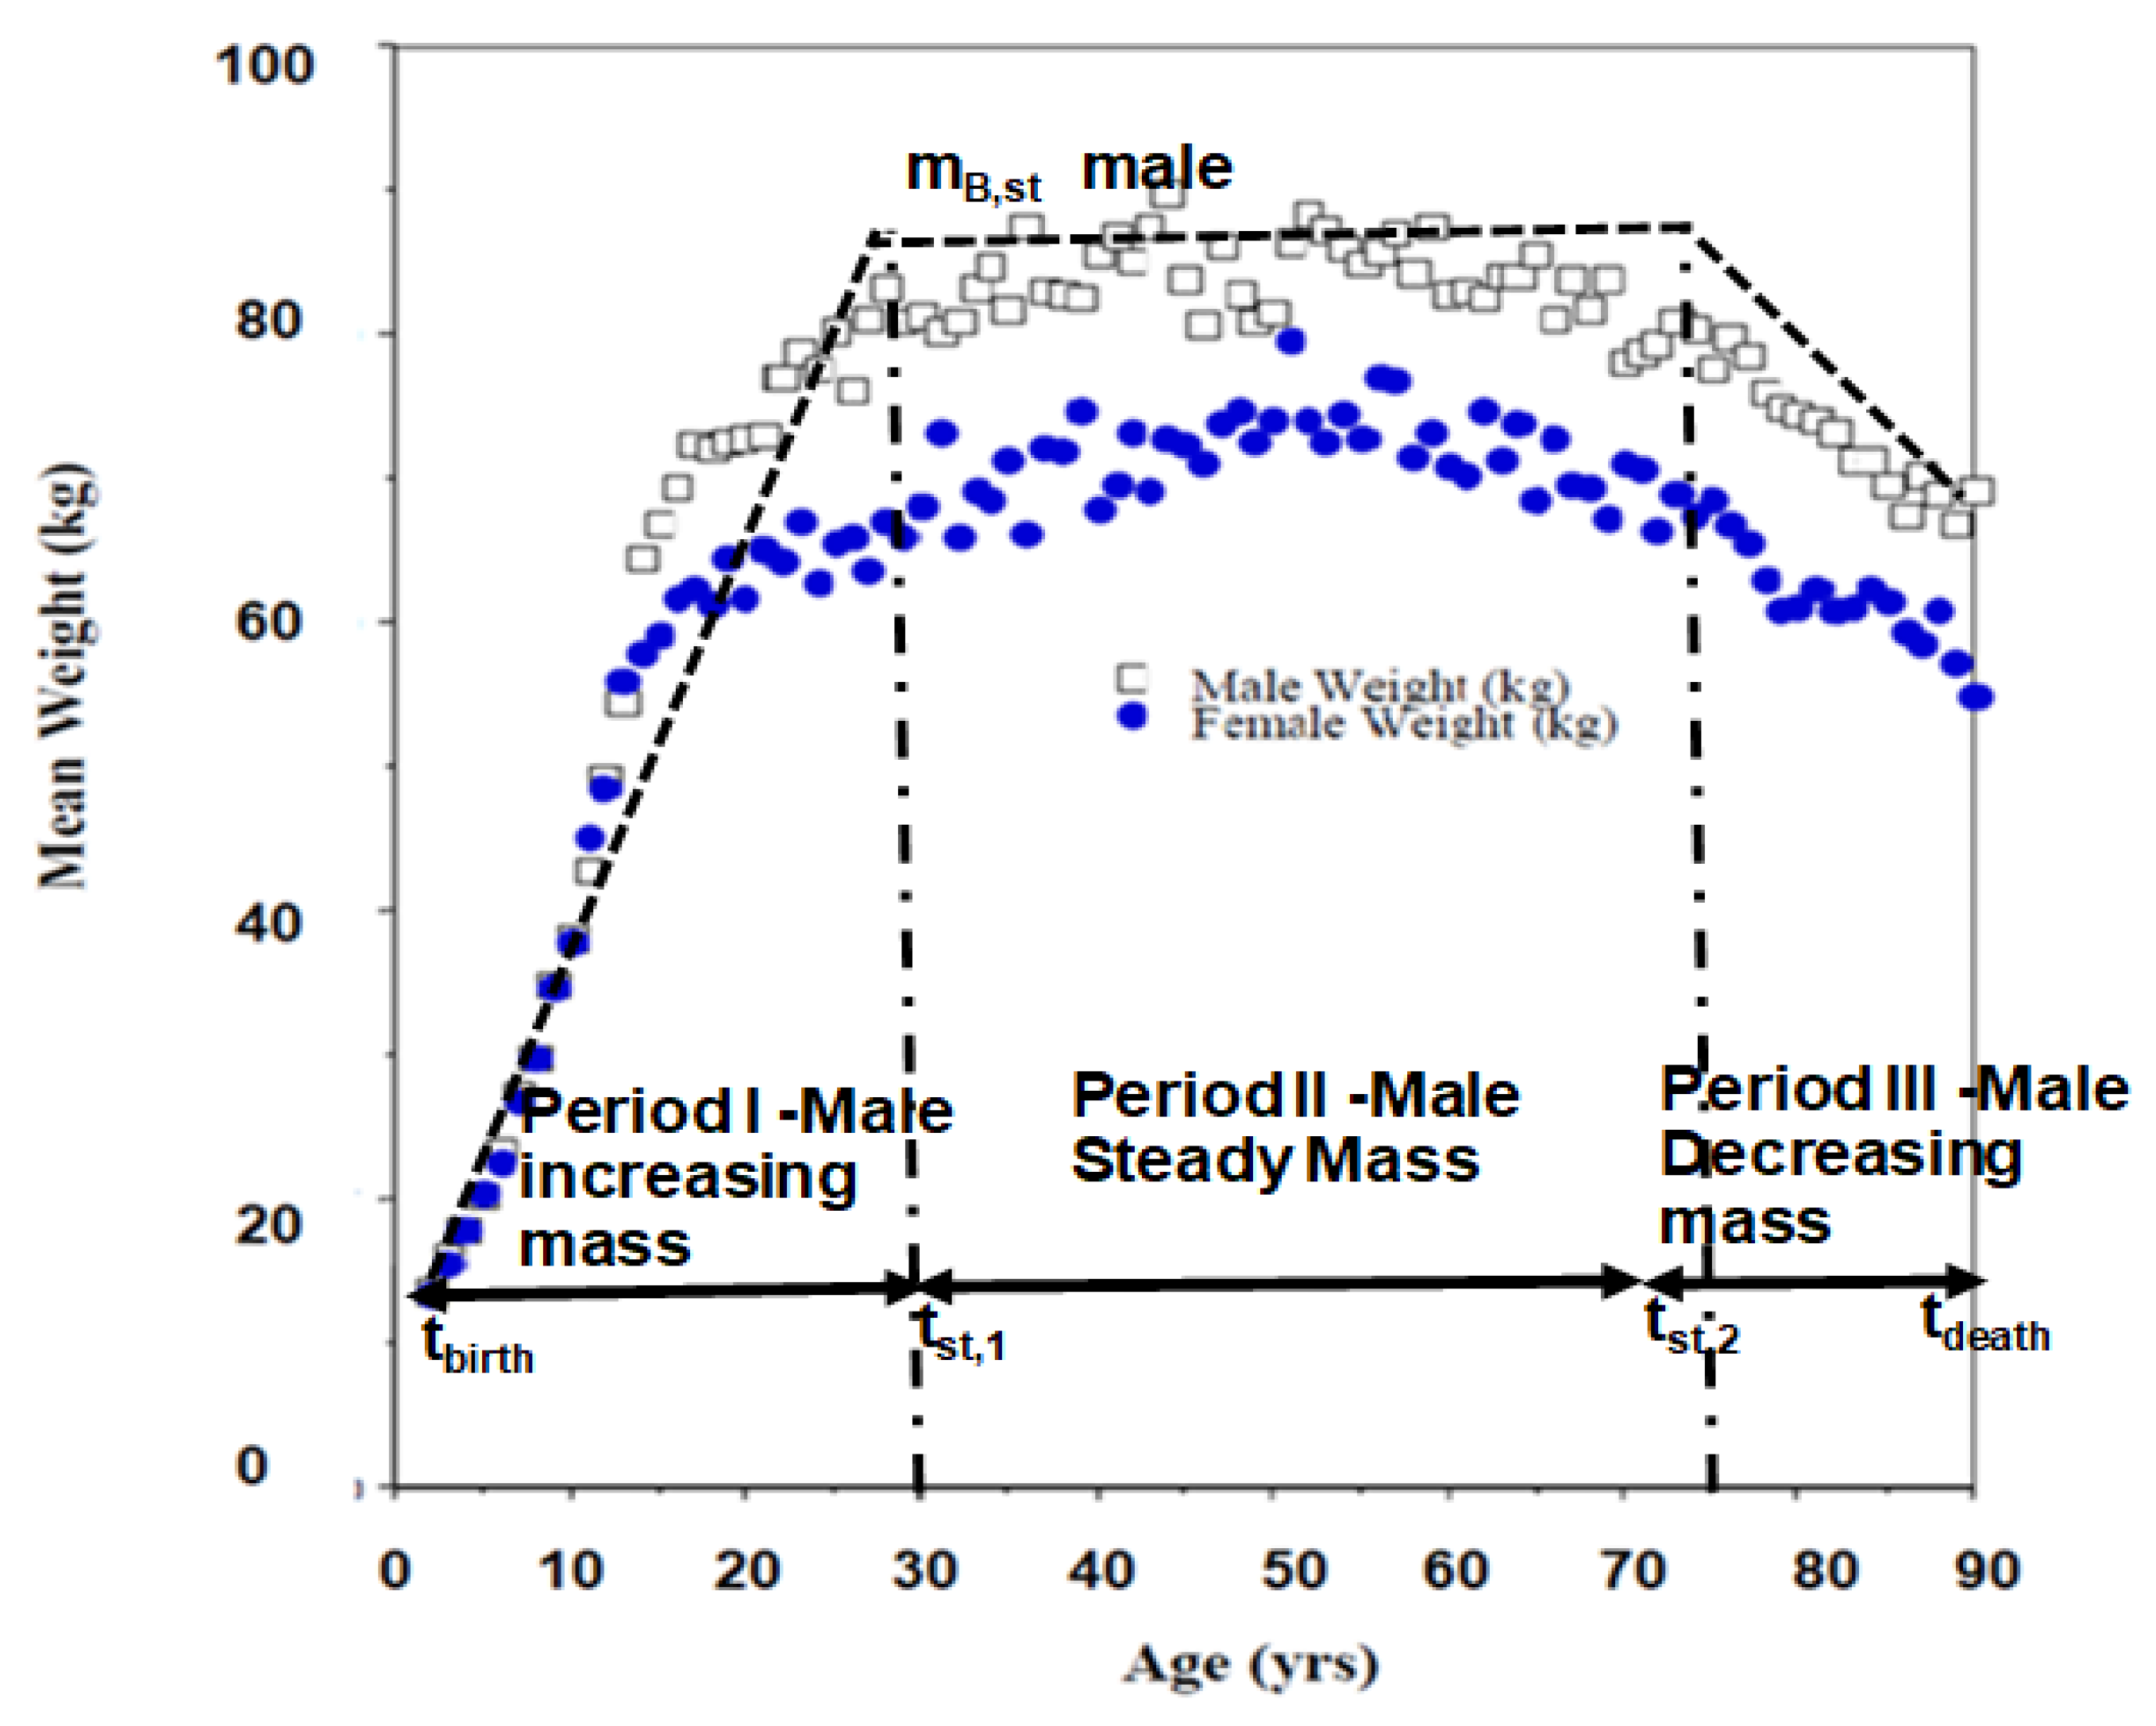
- First assume as though the person has constant body mass or steady mass (for e.g., the UK data reveals mB,st = 84 kg). Estimate kth organ mass using allometric relation and known ck, and dk (Table 3); thus for heart, k = H, mH,st = 0.48 kg when mB,st = 84 kg.
- Estimate specific energy release rate (SERRk) or specific metabolic rate (SMRk) (W/kg organ k) during steady body mass period with known ek and fk given by allometric law:
- Multiplying tlife one get GJ per kg of heart over life spanSee last column in Table 4. Similarly estimate and for all organs.
- Estimate the contribution rate by each organ to unit mass of body:So with k = H, the contribution rate by heart to unit body mass is estimated asMultiplying tlife one get GJ contributed by heart over life span to each unit body massSimilarly estimate and qk,M,st,life for all organs.
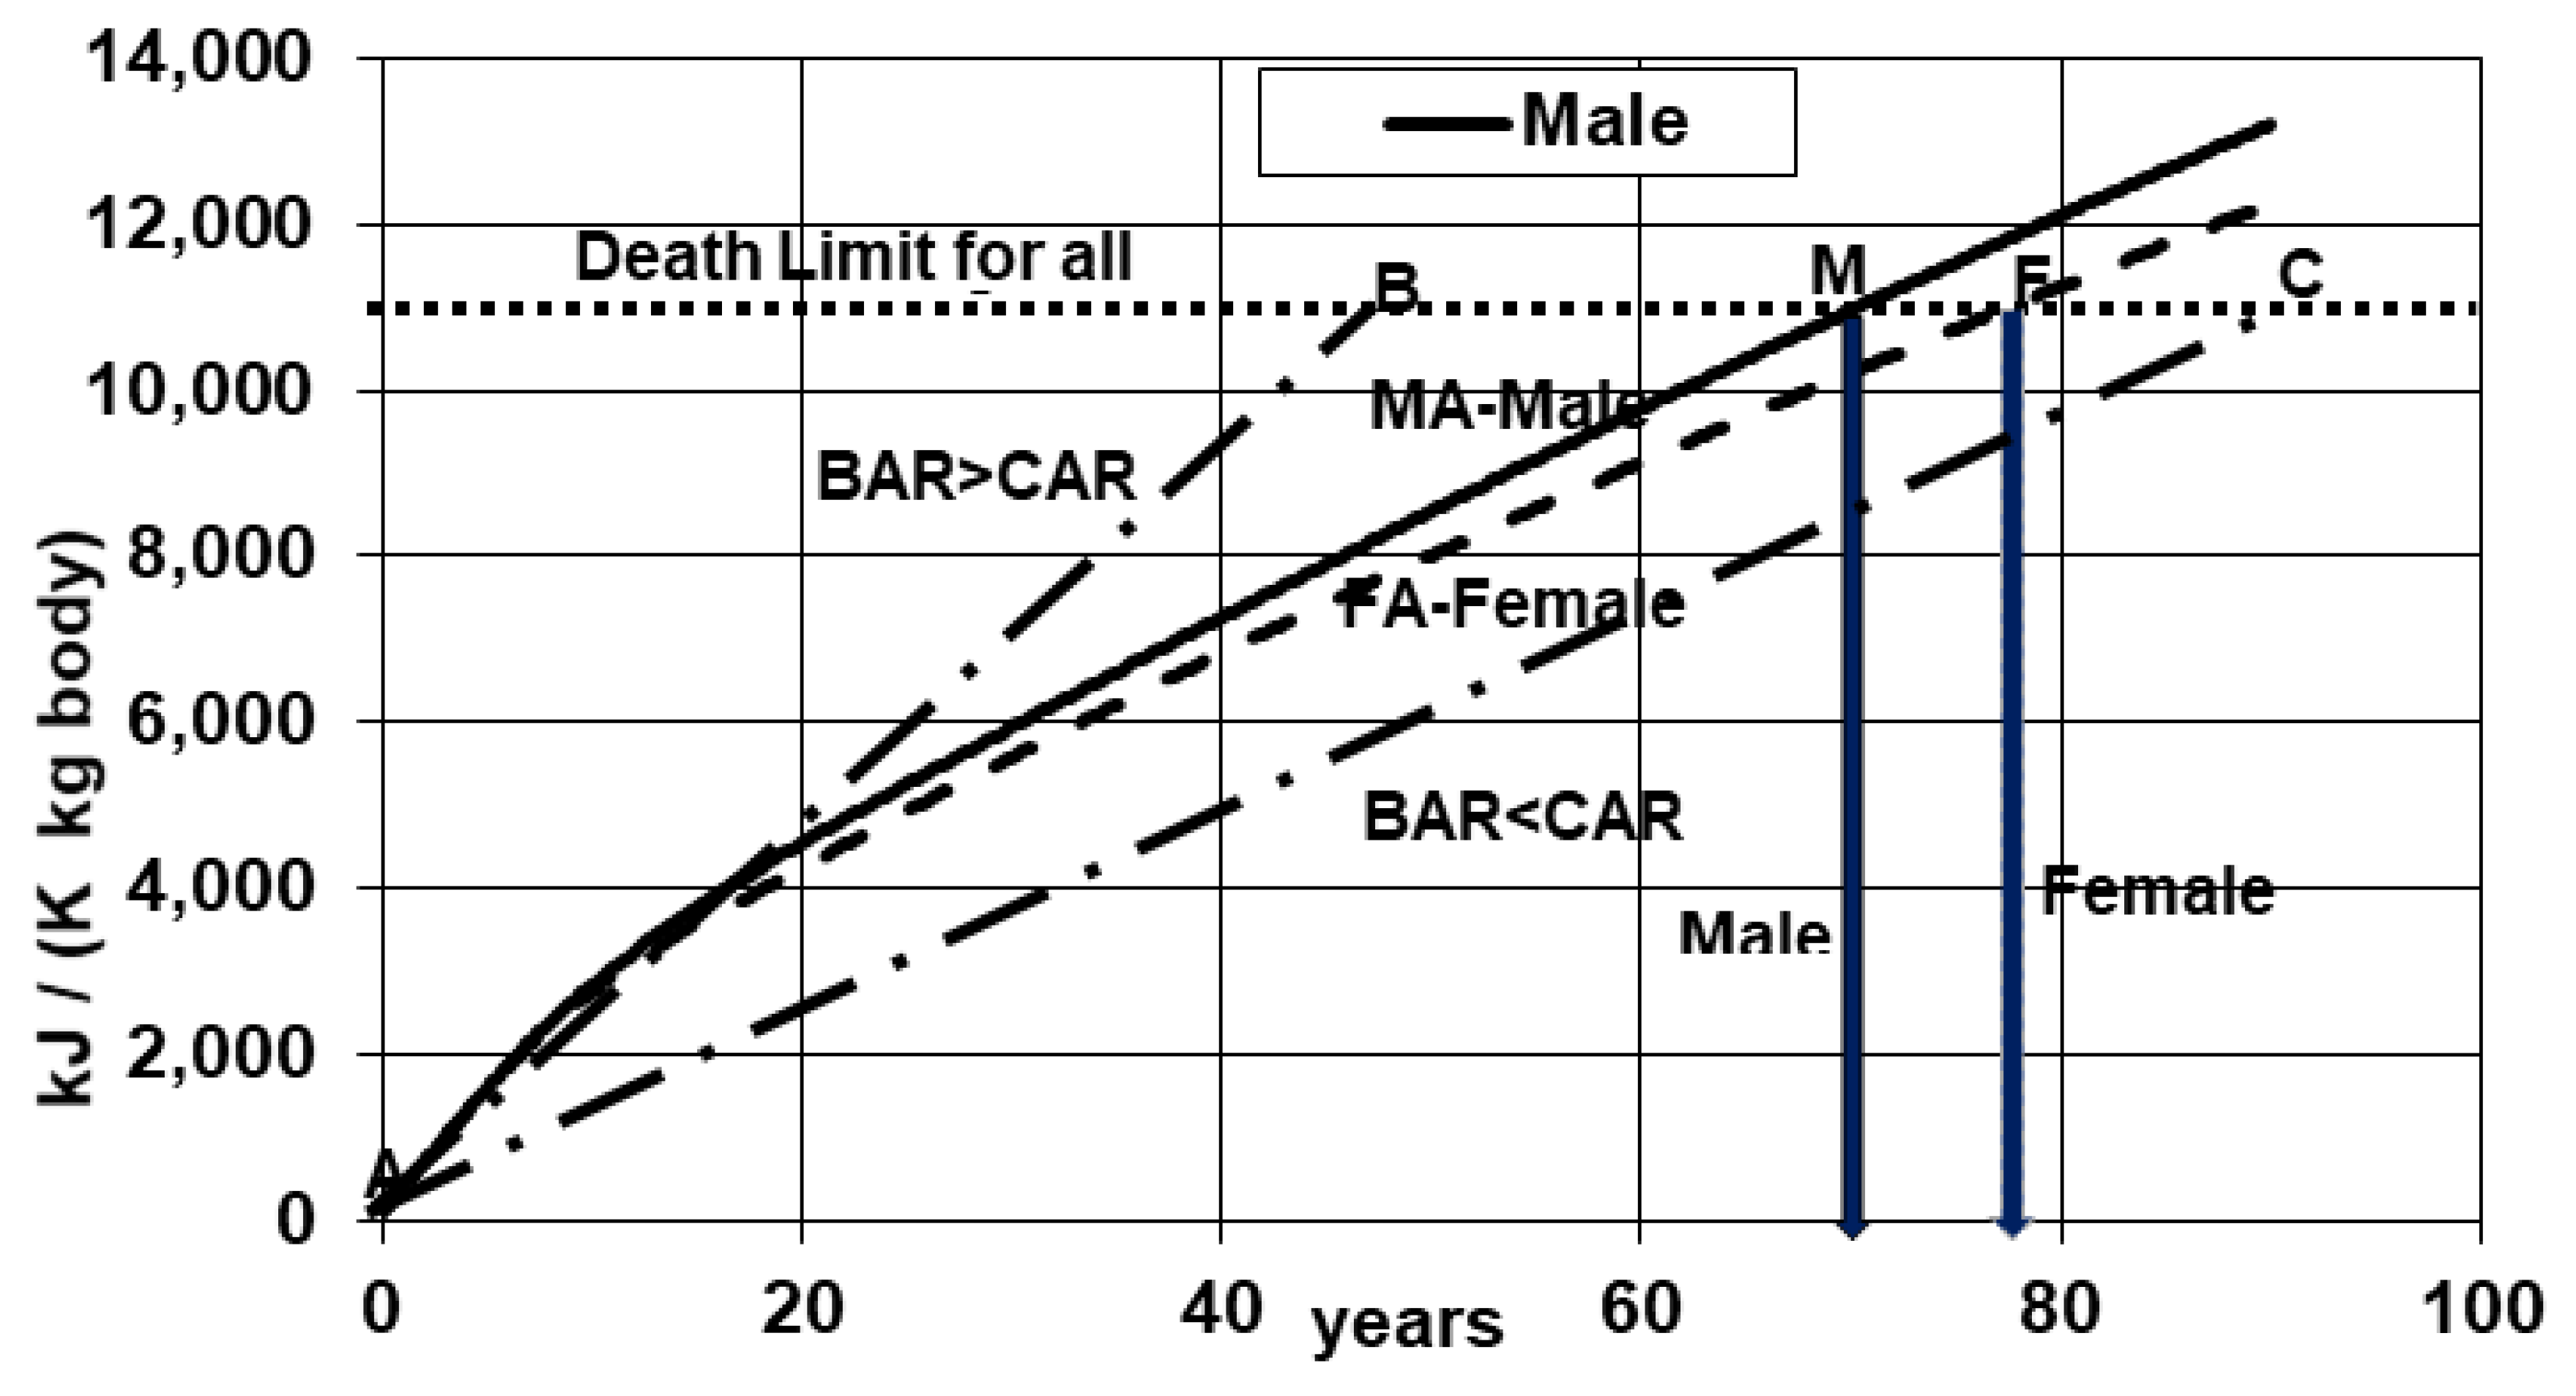
- Add contributions by all organs to each unit body mass under steady period and check the total with estimate from Kleiber’s law. In Method A, the biomarkers which determine BAR are empirical organ allometric coefficients, steady mass and the metabolic rate (First law, heterogeneous) which determines the slope of biological aging curve in Figure 1.
- 6.
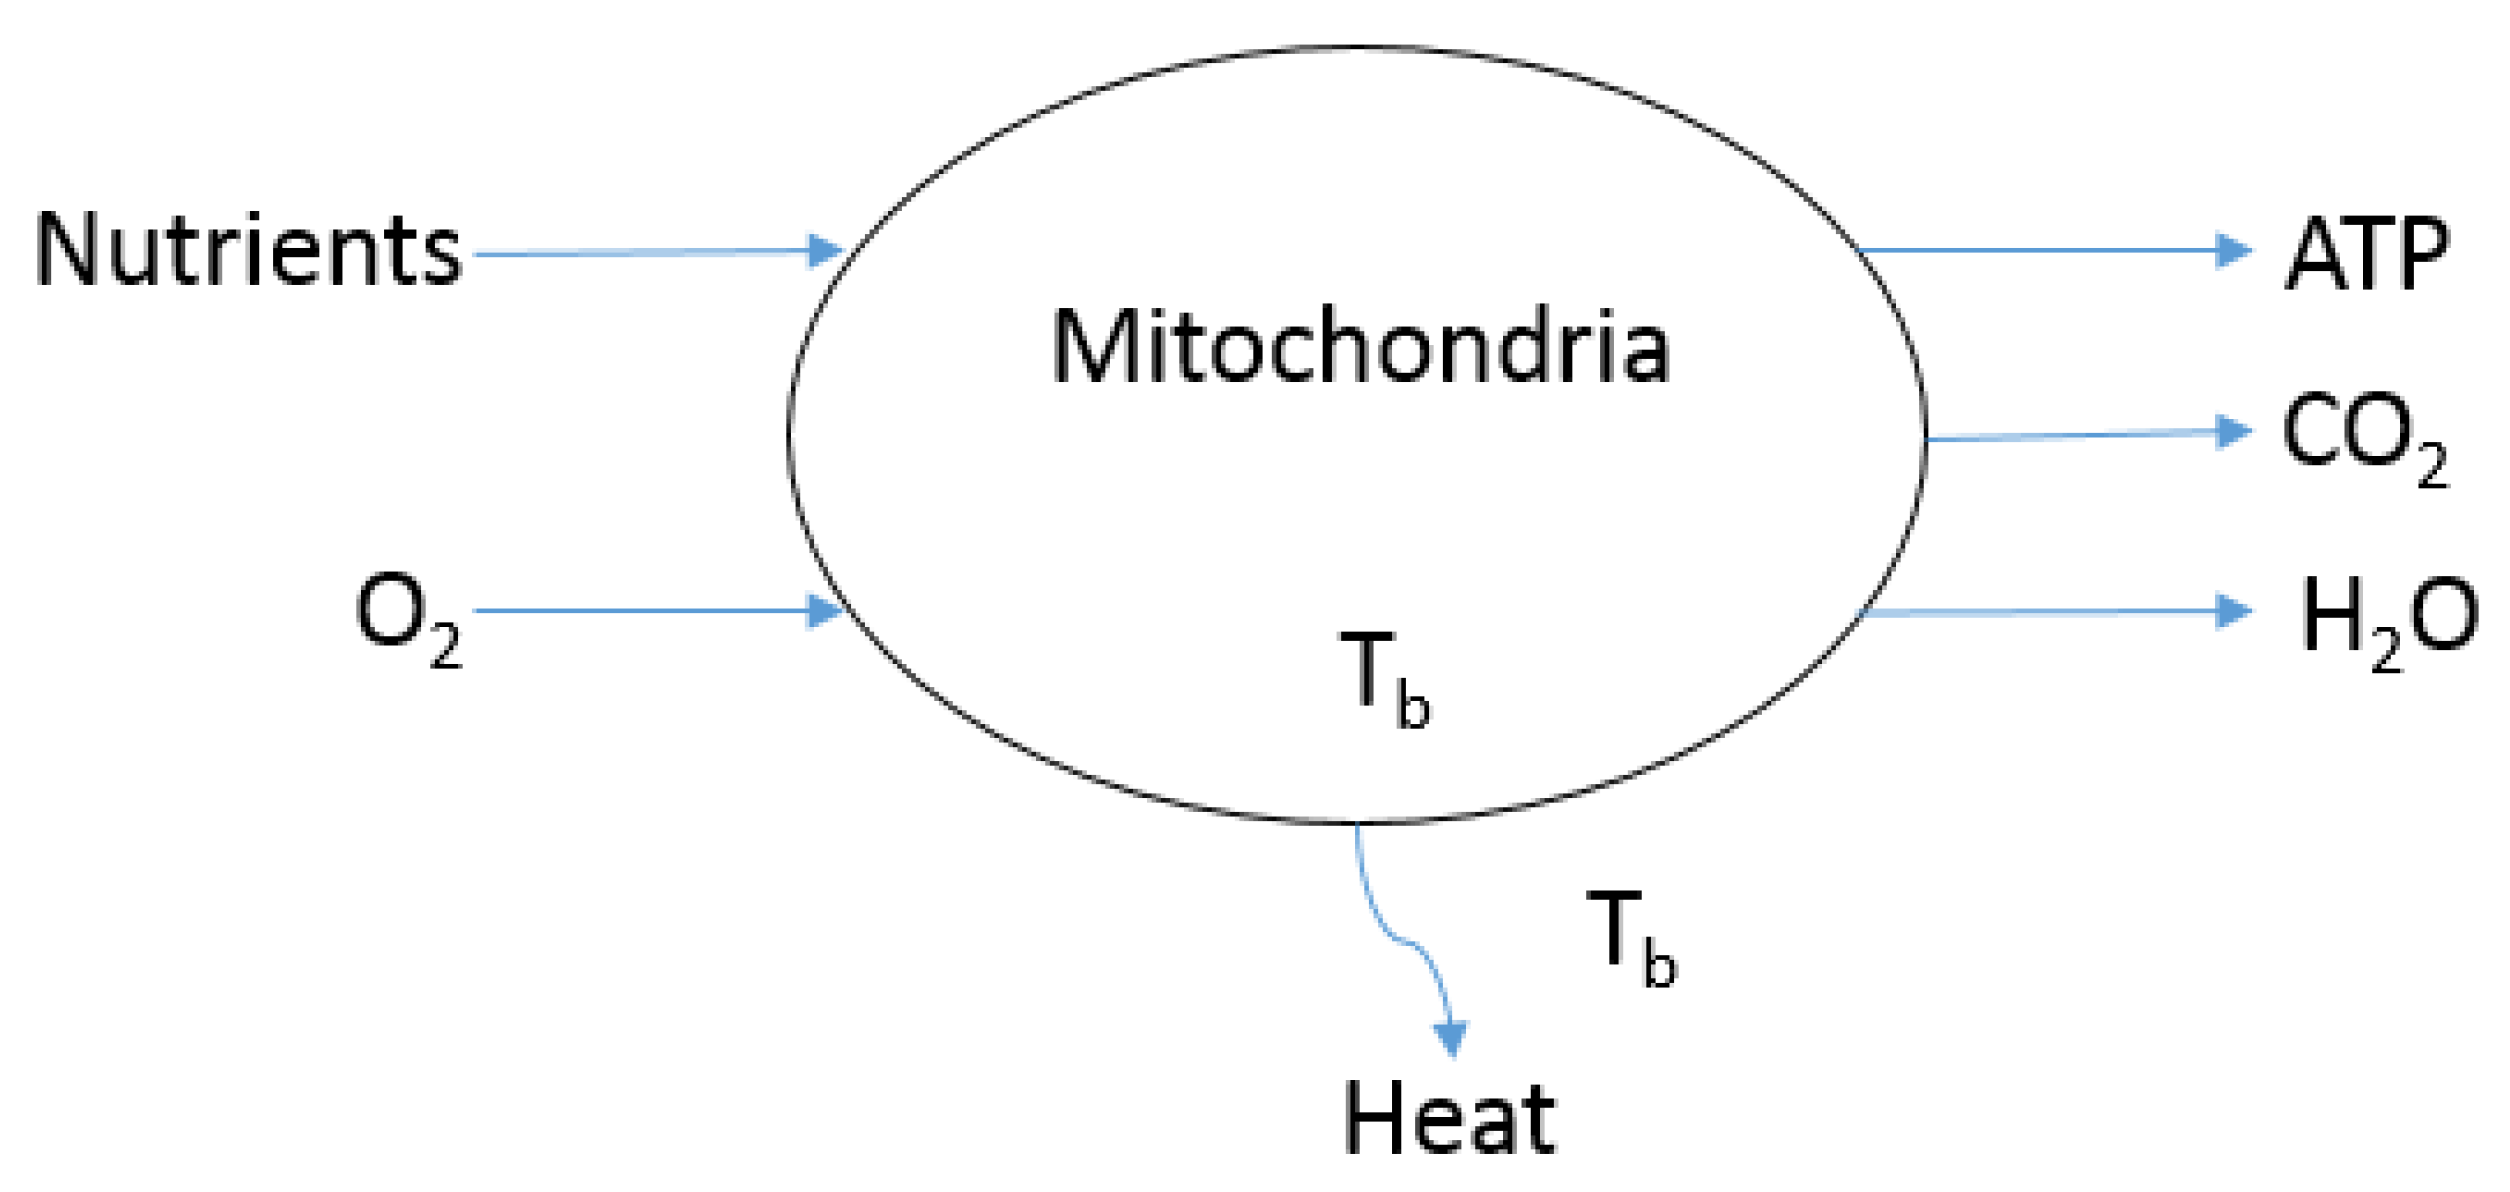
- Assuming constant average metabolic efficiency () for all organs, estimate heat part of SERRkand estimate corresponding entropy generation rate from organ k as
- 7.
- Multiplying tlife (= over 75 years) one get GJ of heat per kg of heart over life span asand corresponding
- 8.
- Following part A, the contribution by each organ to unit body mass are given below:
- 9.
- Add entropy contributions by all organs to each unit body mass under steady period to determine lifetime entropy generation per unit body mass. In Method B, the biomarkers which determine BAR are empirical organ allometric coefficients, steady mass, entropy generation rate (second law, heterogeneous)which determines the slope of biological aging curve in Figure 1.
- 10.
- If Elia’s model is used where specific organ metabolic rate does not change with body mass (e.g., from birth to death), all the numbers in rate form per unit mass of organ will not change or growth correction factor = 1 for all rate form based on unit mass of organ. However, for Wang-5, the SMRk change with age since body mass does not remains constant from birth to death and as such GCF are necessary. Further organ mass changes with age (due to change with body mass with age) and hence their contribution to unit body mass will change even for Elia model; as such estimates for GCF are necessary when contribution to unit body mass is required for both Elia and Wang-5 models. Thus, one must use charts presented in Figure 4. When period of standard mass is short compared to life span, GCF ≈ 1.0.
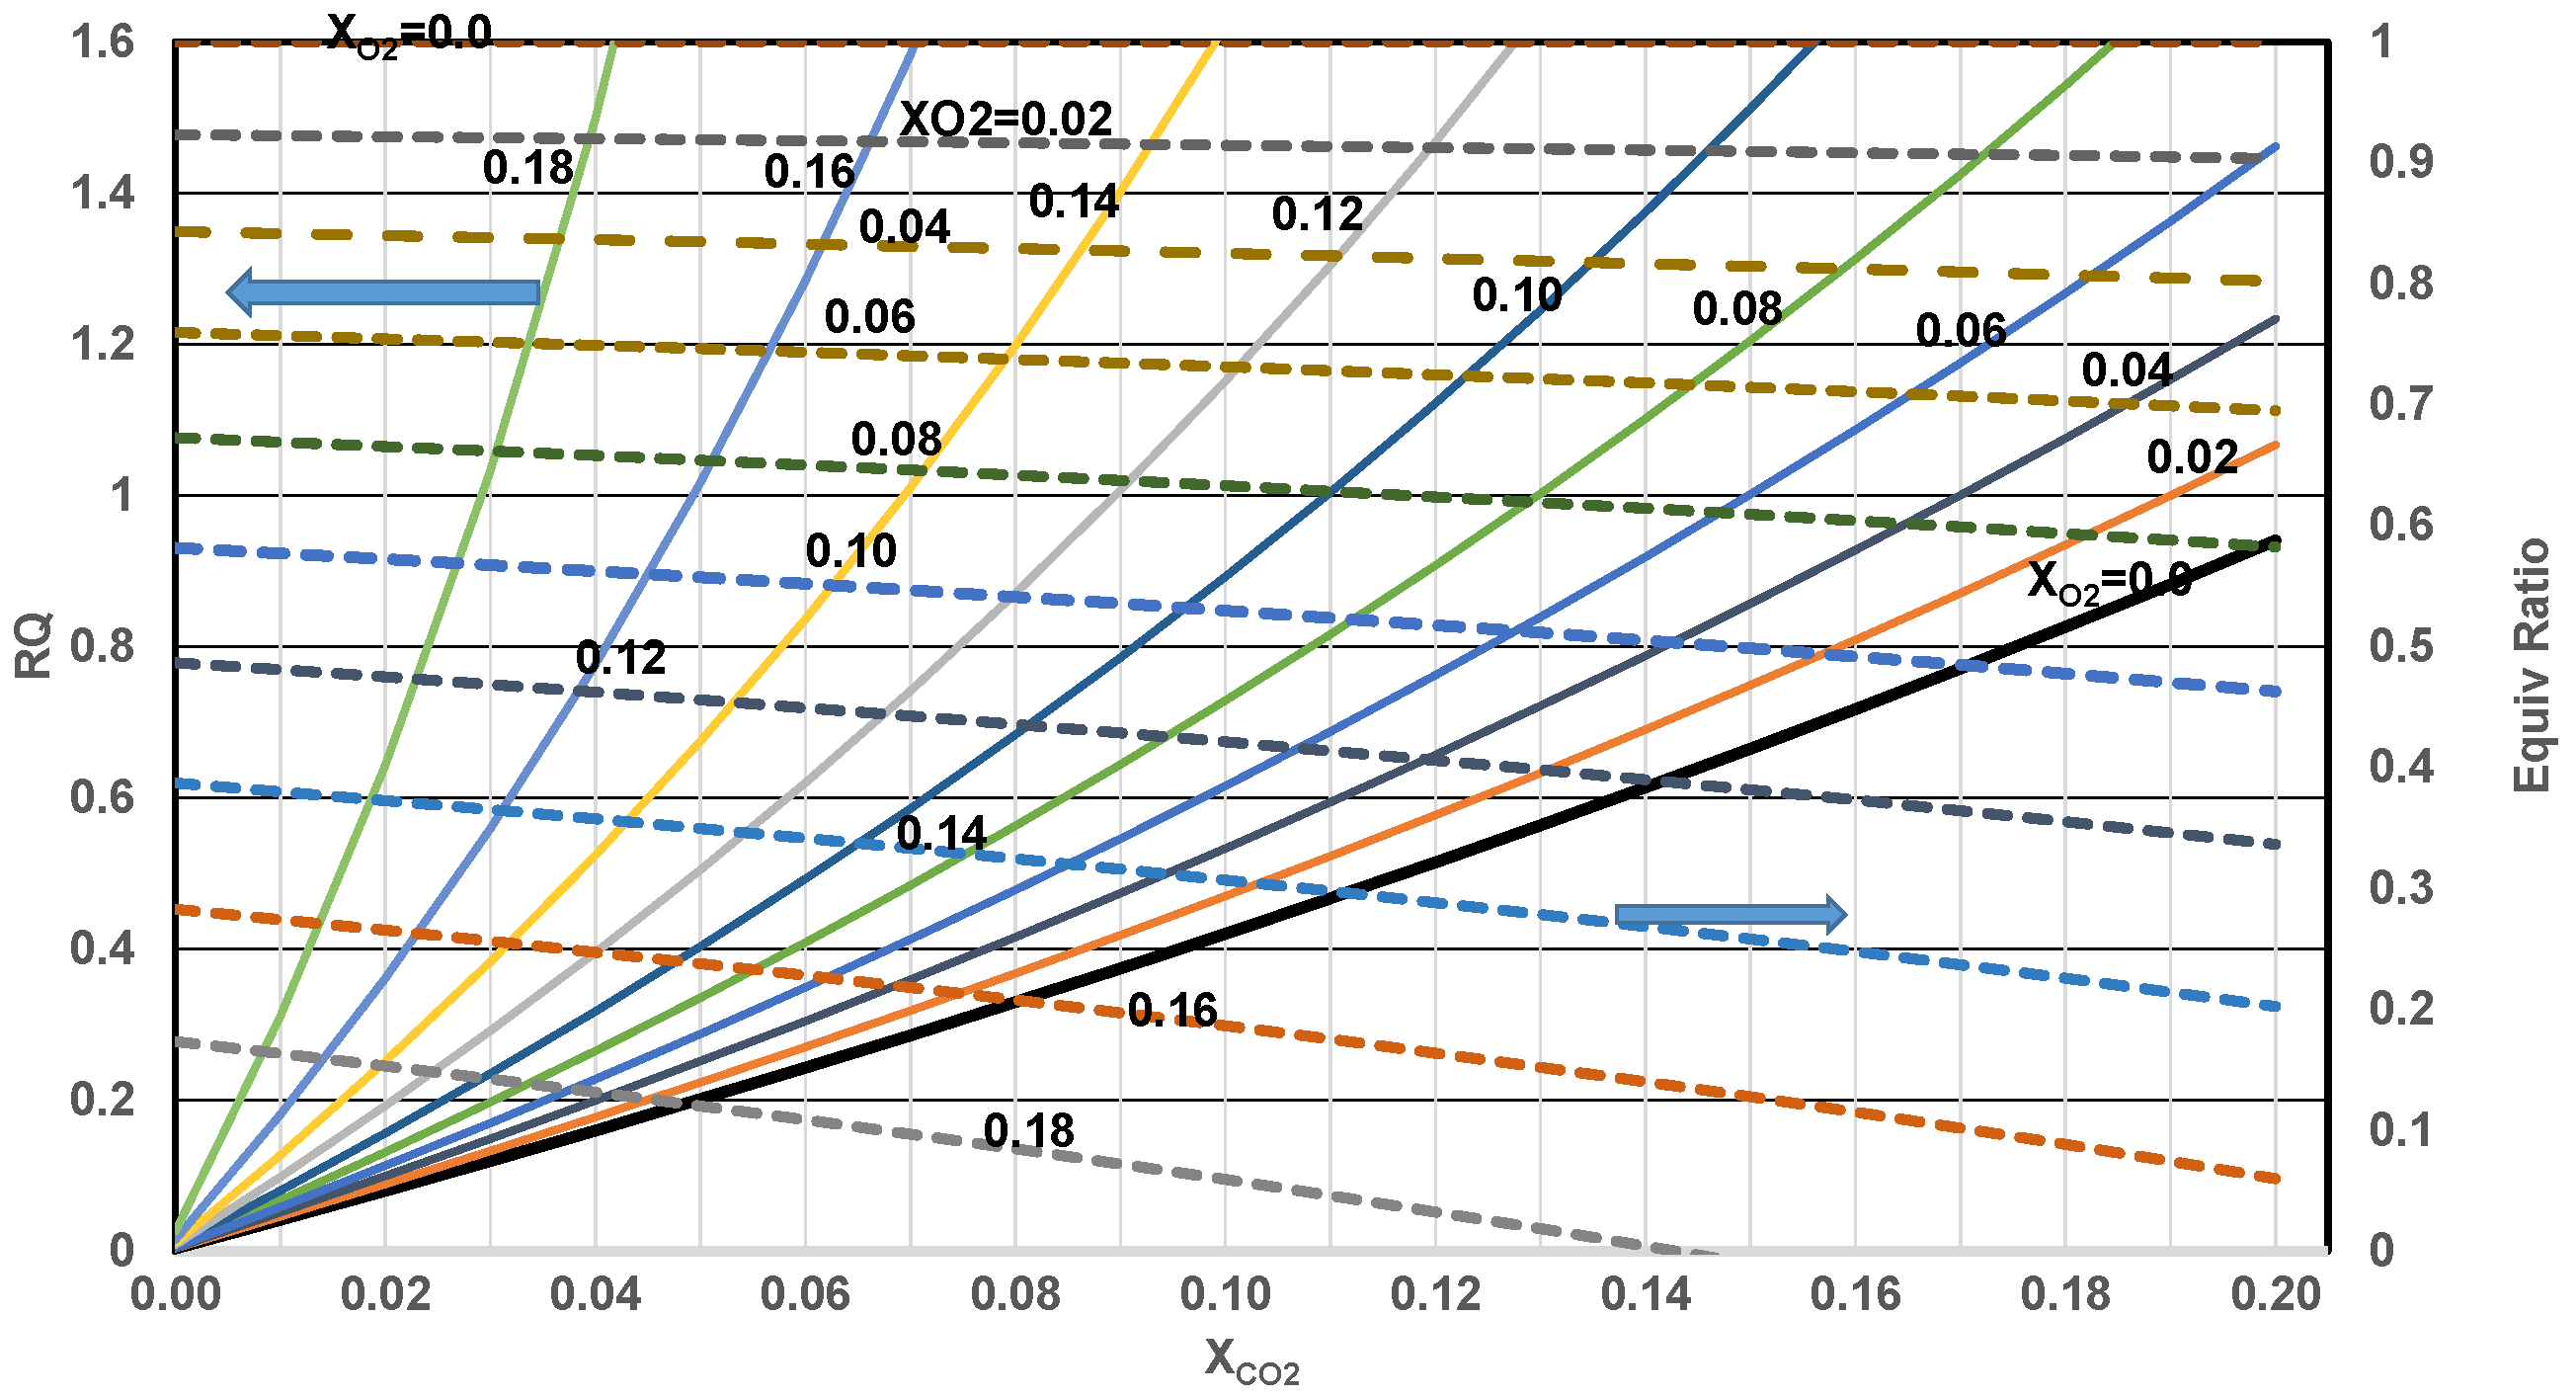
- Monitor the patient’s breathing rate (L/s), mass of body (mB(t)) and CO2, O2 and H2O % in nasal exhaust gases vs. age.
- Determine heat fraction contributed by CH and fat. Since RQ of blended nutrient mixture is given aswhere HF1, ratio of energy released by nutrient 1 (CH) to energy released by the blend (mixture of CH and fat). Then for RQ1 ≠ RQ2, the above equation yields heat fraction faction of CH, (nutr 1) and fat (nutr 2)where HF2 represent the ratio of energy released by metabolism of fat (i.e., “Calories” released by fat) to total energy released by blend. RQ1 for glucose = 1, RQ2 for fat is 0.7. The mole fraction of CH in nutrient mixture can also be estimated if needed.Knowing molecular weights, mass fraction of CH can be determined.
- Estimate oxygen extraction fraction (OEF) from inspired air:
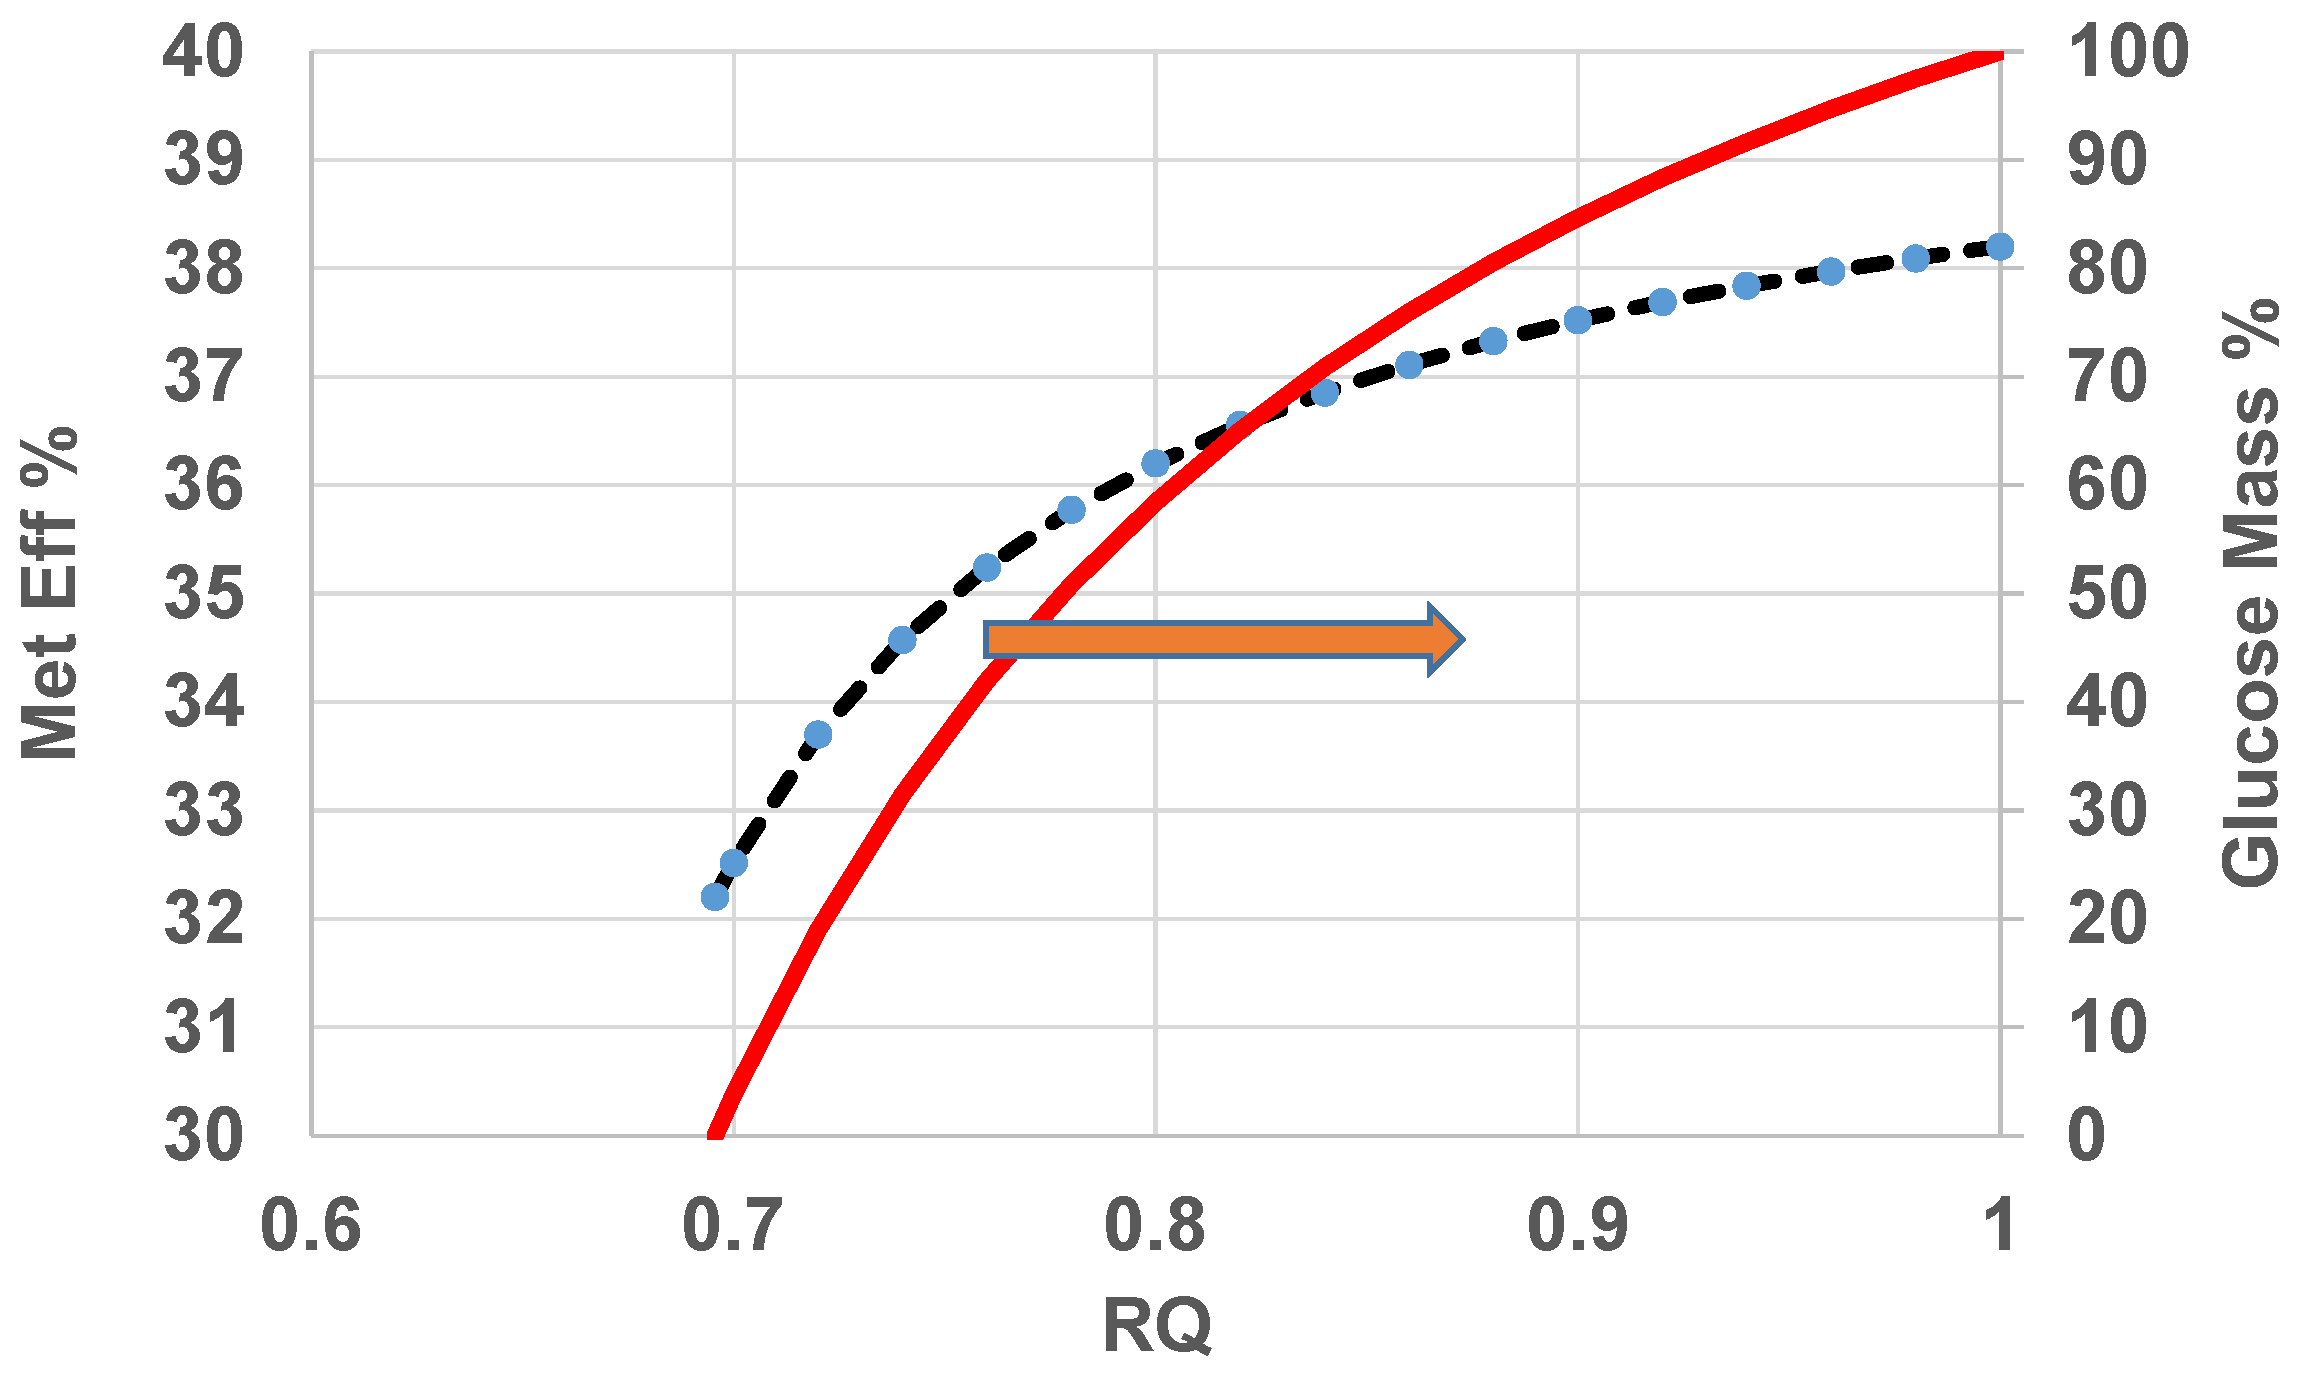
- Estimate the overall metabolic efficiency of the body vs. age:Figure 12 shows variation of metabolic efficiency and glucose mass % metabolized with RQ if it is assumed that dominant energy release occurs via metabolism of a mixture of CH and F. If RQ increases with age, the more glucose metabolized and less fat metabolized indicating accumulation of “fat” mass if “fat” consumption is known.
- Using nasal exhaust analysis, get oxygen extraction fraction (OEF), determine specific metabolic rate (SMRM)where oxygen mass fraction in air is assumed to be 0.23. Further specific entropy generation rate vs. age is given asAs such BAR cane be compared with CAR as shown in Figure 1. Equation (27) accounts for variation of metabolic rate and metabolic efficiency with age while the results reported in Figure 9 and Figure 10 are based on constant metabolic efficiency.
7. Summary and Conclusions
- While Rubner’s relies on 1st law analysis for estimating the aging rate (irrespective of metabolic efficiency), the current work uses 2nd law analysis for estimating entropy generation per unit mass of organ and per unit volume of mitochondria, which can be used as one of the biomarkers for predicting the biological aging rate.
- The inclusion of entropy generation for adipose tissue and skeletal muscle has minimal effect on whole body specific entropy generation rate.
- Increased % of glucose diet seems to increase life span while increased protein % shortens life span due to low metabolic efficiency of proteins.
- The increase in SMRV (per unit volume of organ) is less than proportional to increase in mitochondrial density (Mitochondrial volume %, MiV) within the cell.
- The heart is the most stressed organ whether one adopts 5- or 7-organ model for resting humans when organ-based entropy stress model is used.
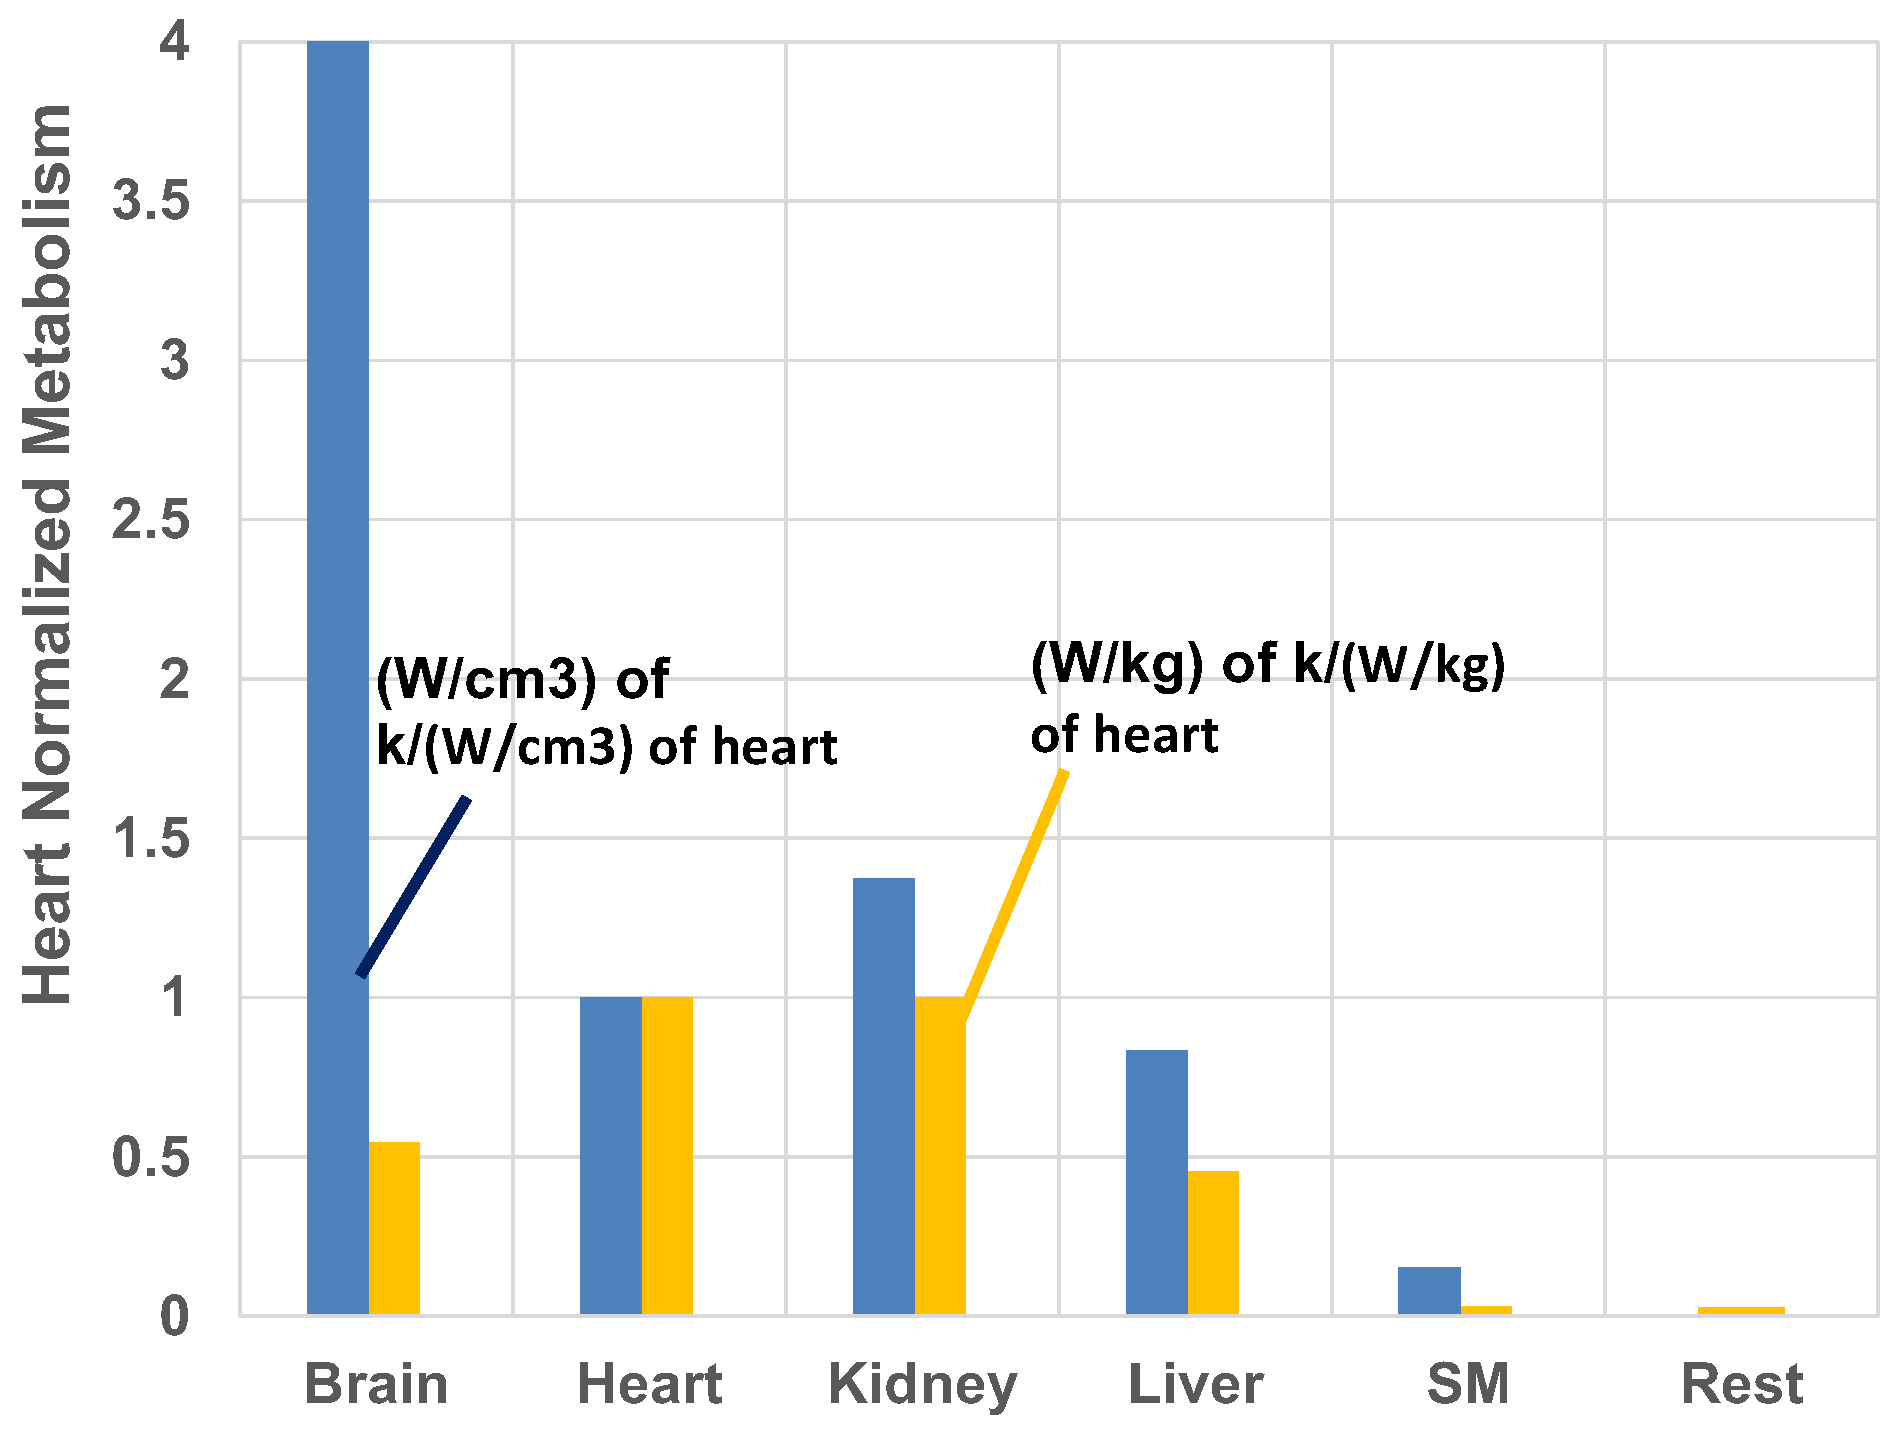
- Ranking of entropy stress based on unit volume of mitochondria differs from entropy stress ranking based on unit mass of organ. At a mitochondrial level, the brain has the highest stress and liver has the lowest loading among all vital organs. Particularly athletes with constant concussions may be subject to more brain anomalies near the end of their lifetimes due to low metabolic efficiency with concussion.
- While ATP produced via oxidation of nutrients supplies energy for repair and replacement of cells (synthesis) through oxidation, such an oxidation path also serves as the “destroyer” (decomposition) of cells through generation of ROS and hence involves delicate balance.
- With currently available diagnostic tools for measurements of nasal exhaust gas composition, respiration rate and body mass vs. age, the whole body specific energy release and entropy generation (which accounts for whole body average metabolic efficiency) methodologies can be used to provide one of the biomarkers for tracking biological aging.
Acknowledgments
Author Contributions
Conflicts of Interest
Symbols and Acronyms
| ATP | Adenosine Tri-Phosphate |
| AT | Adipose Tissue |
| B | Brain |
| BA | Biological Aging |
| BAR | Biological Aging Rate |
| BS | Biological Systems |
| C | Specific Heat Capacity |
| CA | Chronological Aging |
| CAR | Chronological Aging Rate |
| CH | Carbohydrates |
| CR | Calorie Restriction |
| CV | Control Volume |
| DNA | Deoxyribonucleic Acid |
| ERR | Energy Release Rate |
| EU | European Union |
| F | Fat |
| FNB | Food and Nutrition Board |
| GCF | Growth Correction Factor |
| H | Heart |
| HV | Heating Value |
| HHV | Higher Heating Value |
| K | Kidney |
| KE | Kinetic Energy |
| L | Liver |
| LBM | Lean Body Mass |
| LH | Langmuir Hinshelwood |
| MiV | Mitochondrial Volume Density |
| MM | Michaelis Menten |
| OEF | Oxygen Extraction Factor |
| p | Pressure |
| P | Protein |
| PE | Potential Energy |
| R | Rest of Organs |
| ROL | Rate of Living theory |
| ROS | Radical Oxygen Species |
| SM | Skeletal Muscles |
| U | Internal Energy |
| V | Volume |
| vfMito | Volume Fraction of Mitochondria |
| W | Work |
Nomenclature
| h | Enthalpy, kJ/kg |
| I | Irreversibility, kJ |
| Irreversibility rate, kJ/s | |
| M | Mass, kg |
| mB | Body Mass |
| mk | Mass of organ, k |
| n | Mass flow rate of nutrient n in organ k |
| Consumption rate of oxygen by nutrient n in organ k | |
| Q | Heat, kJ |
| Heat transfer rate due to metabolic heat release at organ k, kJ/s | |
| k,n | Specific metabolic energy release rate from organ k per unit mass of organ k |
| k,M | Energy release rate of organ k contributed to the unit mass of body |
| S | Entropy, kJ/K |
| s | Specific Entropy, kJ/kg K |
| TB | Body temperature, K |
| t | Time or age |
| tst | Time to reach steady weight |
| U | Internal Energy |
| WK | Work delivered by metabolism at organ k |
| Gibbs Free Energy for Combustion | |
| Gibbs Free Energy for metabolism (with ATP production) |
Greek Symbols
| η | Metabolic efficiency |
| σ | Entropy generation, kJ/K |
| σM,k | Entropy contribution to unit mass of body by whole organ k |
| M | Entropy generation rate per unit body mass (W/kg of body mass K) |
| m,k | Specific entropy generation rate of organ k (W/K-kg of k) |
| ψ | Stream availability, kJ/kg |
| νO2,n | Stoichiometric oxygen mass per unit mass of nutrient n |
| ηn,k | Metabolic efficiency of nutrient n in organ k |
General Notes
| A bar (-) on top of any property indicates its specific property per kmole of substance |
| A dot (.) on top of any property indicates its time rate of change |
Appendix A. Nasal Gas Analyses
References
- Flatt, T. A New Definition of Aging? Front. Genet. 2012, 3, 148. [Google Scholar] [CrossRef] [PubMed]
- Weinert, B.T.; Timiras, P.S. Physiology of Aging Invited Review: Theories of aging. J. Appl. Physiol. 2003, 95, 1706–1716. [Google Scholar] [CrossRef] [PubMed]
- Mostafavi, H.; Berisa, T.; Day, F.R.; Perry, J.R.B.; Przeworski, M.; Pickrell, J.K. Identifying genetic variants that affect viability in large cohorts. PLoS Biol. 2017, 15, 9. [Google Scholar] [CrossRef] [PubMed]
- Medvedev, Z.A. An attempt at a rational classification of theories of ageing. J. Biol. Rev. Camb. Philos. Soc. 1990, 65, 375–398. [Google Scholar] [CrossRef]
- Lee, D.; Hwang, W.; Artan, M.; Jeong, D.-E.; Lee, S.-J. Effects of nutritional components on aging. Aging Cell 2015, 14, 8–16. [Google Scholar] [CrossRef] [PubMed]
- Kirkwood, T. Understanding the Odd Science of Aging. Cell 2005, 120, 437–447. [Google Scholar] [CrossRef] [PubMed]
- Guachalla, L.M.; Ju, Z.; Koziel, R.; von Figura, G.; Song, Z.; Fusser, M.; Epe, B.; Jansen-Durr, P.; Rudolph, K.L. Sod2 haploinsufficiency does not accelerate aging of telomere dysfunctional mice. Aging 2009, 1, 303–315. [Google Scholar] [CrossRef] [PubMed]
- Silva, C.; Annamalai, K. Entropy Generation and Human Aging: Lifespan Entropy and Effect of Physical Activity Level. J. Entropy 2008, 10, 100–123. [Google Scholar] [CrossRef]
- Silva, C.; Annamalai, K. Entropy generation and human aging: Lifespan entropy effect of diet composition and caloric restriction diets. J. Thermodyn. 2009, 2009, 1–10. [Google Scholar] [CrossRef]
- Andresen, B.; Shiner, J.S.; Uehlinger, D.E. Allometric scaling and maximum efficiency in physiological eigen time. PNAS 2002, 99, 5822–5825. [Google Scholar] [CrossRef] [PubMed]
- Pinker, S. The Second Law of Thermodynamics, Life History: Why Things Fall Apart. The Wall Street Journal, 31 December 2016–1 January 2017.
- Annamalai, K.; Puri, I.K. Combustion Science and Engineering; CRC Press, Taylor and Francis: Boca Raton, FL, USA, 2006; ISBN 9780849320712. [Google Scholar]
- Elia, M. Organ and tissue contribution to metabolic rate. In Energy Metabolism: Tissue Determinants and Cellular Corollaries; Kinney, J.M., Tucker, H.N., Eds.; Raven Press, Ltd.: New York, NY, USA, 1992; pp. 61–79. [Google Scholar]
- Annamalai, K.; Miller, J.A. Link between O2 Deficient Metabolism in Organs and Group Combustion in Engineering. In Proceedings of the 10th U.S. National Combustion Meeting, College Park, MD, USA, 23–26 April 2017. [Google Scholar]
- Miller, J. Oxygen Deficient Metabolism in Organs: A link to Combustion Science. Master’s Thesis, Texas A&M University, College Station, TX, USA, December 2014. [Google Scholar]
- Annamalai, K.; Silva, C. Thermal Sciences and Biological Systems, Chapter 14. In Advanced Thermodynamics Engineering, 2nd ed.; Annamalai, K., Puri, I., Jog, M., Eds.; CRC Press: Boca Raton, FL, USA, 2011; p. 1096. ISBN 9781439805725. [Google Scholar]
- Hershey, D.; Wang, H. A New Age-Scale for Humans; Lexington Books: New York, NY, USA, 1980. [Google Scholar]
- Aoki, I. Entropy production in human lifespan: A thermodynamical measure for aging. AGE 1994, 1, 29–31. [Google Scholar] [CrossRef]
- Wang, Z.; Zhang, J.; Ying, Z.; Heymsfield, S. Organ-Tissue Level Model of Resting Energy Expenditure across Mammals: New Insights into Kleiber’s law. ISRN Zool. 2012, 2012, 1–9. [Google Scholar] [CrossRef]
- Wang, Z.; Ying, Z.; Bosy-Westphal, A.; Zhang, J.; Schautz, B.; Later, W. Specific metabolic rates of major organs and tissues across adulthood: Evaluation by mechanistic model of resting energy expenditure. Am. J. Clin. Nutr. 2010, 92, 1369–1377. [Google Scholar] [CrossRef] [PubMed]
- Kummitha, C.M.; Kalhan, S.C.; Saidel, G.M.; Lai, N. Relating tissue/organ energy expenditure to metabolic fluxes in mouse and human: Experimental data integrated with mathematical modeling. Physiol. Rep. 2014, 2, e12159. [Google Scholar] [CrossRef] [PubMed]
- Singer, D. Size Relationship of Metabolic Rate: Oxygen Availability as the Missing Link between Structure and Function. Thermochim. Acta 2006, 446, 20–28. [Google Scholar] [CrossRef]
- Annamalai, K.; Silva, C. Entropy Stress and Scaling of Vital Organs over Life Span Based on Allometric Laws. J. Entropy 2012, 14, 2550–2577. [Google Scholar] [CrossRef]
- Gemma, C.; Vila, J.; Bachstetter, A.; Bickford, P. Oxidative Stress and the Aging Brain: From Theory to Prevention. Chapter 15. In Brain Aging: Models, Methods, and Mechanisms; CRC Press/Taylor & Francis: Boca Raton, FL, USA, 2007. [Google Scholar]
- Else, P.L.; Hulbert, A.J. Mammals: An allometric study of metabolism at tissue and mitochondrial level. Am. Physciol. Soc. 1985, 248, R415–R421. [Google Scholar]
- Huaxiong, H.; Milevsky, M.A.; Salisbury, T.S. Retirement Spending and Biological Age. Available online: https://ssrn.com/abstract=2918055 (accessed on 22 October 2017).
- Making Sure Our Longer Lives Are Healthy Ones. Available online: https://www.forbes.com/sites/nextavenue/2017/02/06/making-sure-our-longer-lives-are-healthy-ones/#5e2a662e28f6 (accessed on 22 October 2017).
- Summary Report of a Peer Involvement Workshop on the Development of an Exposure Factors Handbook for the Aging. Available online: https://cfpub.epa.gov/ncea/efp/recordisplay.cfm?deid=171923 (accessed on 22 October 2017).
- Nanda, N. Entropy Stress Based on Organ and Mitochondrial Metabolic Loading. Master’s Thesis, Mechanical Engineering, Texas A&M University, College Station, TX, USA, May 2017. [Google Scholar]
- Vagnozzi, R.; Tavazzi, B.; Signoretti, S.; Amorini, A.M.; Belli, A. Temporal window of metabolic brain vulnerability to concussions: Mitochondrial-related impairment—Part I. Nuerosurgery 2007, 61, 379–388. [Google Scholar] [CrossRef] [PubMed]
- Lee, C.P.; Gu, Q.; Xiong, Y.; Mitchell, R.A.; Ernster, L. P/O ratios reassessed: mitochondrial P/O ratios consistently exceed 1.5 with succinate and 2.5 with NAD-linked substrates. FASEB J. 1996, 10, 345–350. [Google Scholar] [PubMed]
- Skeletal muscle mass and distribution in 468 men and women aged 18–88 yr. Available online: http://jap.physiology.org/content/89/1/81.short (accessed on 22 October 2017).
- Wenger, B.C. The Regulation of Body Temperature. Chapter 29. Temperature Regulation and Exercise Physiology. Available online: http://www.academia.edu/4940904/The_Regulation_of_Body_Temperature (accessed on 22 October 2017).
- Hoppeler, H.; Lindstedt, S.L.; Claassen, H.; Taylor, C.R.; Mathieu, O.; Weibel, E.R. Scaling mitochondrial volume in heart to body mass. Respir. Physiol. 1984, 55, 131–137. [Google Scholar] [CrossRef]
- Abrahams, S.; Greenwald, L.; Stetson, D.L. Contribution of renal medullary mitochondrial density to urinary concentrating ability in mammals. Am. J. Physiol. 1991, 261, R719–R726. [Google Scholar] [PubMed]
- Porter, R.K.; Brand, M.D. Causes of differences in respiration rate of hepatocytes from mammals of different body mass. Am. J. Physiol. 1995, 269, R1213–R1224. [Google Scholar] [PubMed]
- Davies, M. On Body Size and Tissue Respiration. J. Cell. Compar. Physiol. 2005, 57, 135–147. [Google Scholar] [CrossRef]
- Sacher, G. Longevity, Aging, and Death: An Evolutionary Perspective. Gerontologist 1978, 18, 112–120. [Google Scholar] [CrossRef] [PubMed]
- Calder, W. Scaling of Physiological Processes in Homeothermic Animal. Ann. Rev. Physiol. 1981, 43, 301–322. [Google Scholar] [CrossRef] [PubMed]
- Segolene, M.; Fanny, V.; Thomas, G. Brain Temperature: Physiology and Pathophysiology after Brain Injury Review Article. Anesthesiol. Res. Pract. 2012, 2012, 1–13. [Google Scholar]
- Brain Core Temperature of Patients with Mild Traumatic Brain Injury as Assessed by DWI-Thermometry. Available online: https://link.springer.com/article/10.1007/s00234-014-1384-5 (accessed on 22 October 2017).
- Variation in the Link between Oxygen Consumption and ATP Production, and Its Relevance for Animal Performance. Available online: http://rspb.royalsocietypublishing.org/content/282/1812/20151028 (accessed on 22 October 2017).
- Flyod, R.A.; West, M.; Hensley, K. Oxidative Biochemical Markers Cluse to Understanding Aging in Long Lived Species. Exp. Gerontol. 2001, 36, 619–640. [Google Scholar] [CrossRef]
- Hansell, P.; William, J.W.; Roland, C.B.; Fredrik, P. Determinants of kidney oxygen consumption and their relationship to tissue oxygen tension in diabetes and hypertension. Clin. Exp. Pharm. Physiol. 2013, 40, 123–137. [Google Scholar] [CrossRef] [PubMed]
- Wang, Z.; Heshka, S.; Gallaghar, D.; Boozer, C.; Kotler, D.P.; Heymsfield, S.B. Resting energy expenditure-fat-free mass relationship: New insights provided by body composition modeling. Am. J. Physiol. Endocrinol. Metab. 2000, 279, E539–E545. [Google Scholar] [PubMed]
- Annamalai, K.; Siva, T.; Ranjan, D. Ranking Renewable and Fossil Fuels on Global Warming Potential Using Respiratory Quotient (RQ) Concept. J. Combust. 2017, in press. [Google Scholar]
- Enhanced Protein Translation Underlies Improved Metabolic and Physical Adaptations to Different Exercise Training Modes in Young and Old Humans. Available online: http://www.cell.com/cell-metabolism/fulltext/S1550-4131(17)30099-2?_returnURL=http%3A%2F%2Flinkinghub.elsevier.com%2Fretrieve%2Fpii%2FS1550413117300992%3Fshowall%3Dtrue (accessed on 22 October 2017).


| # | Desired Variable | Non-Dimensional Form of Desired Variable | Growth Correction Factor, GCF Right Side of Equation (18); Note 2 | Example for Heart, (Wang 5 Data SERRK Body Mass Depend; mBst = 84 kg, 75 years, tst,1 = 24 years, RQmix = 0.80, ηmet = 0.312, mH,std = 0.006 × 840.98 = 0.46 kg, z = 0.75; tst2 = tlife = 75 years (Note 1)) |
|---|---|---|---|---|
| 1 | Lifetime Specific metabolic energy release by organ k | gk in Figure 4 = z fk; gk = 0 with Elia data | z = 0.75, fH = −0.12; gH = zfH = 0.75 × (−0.12) = −0.09, GCF from chart = 1.015 (Wang SERRk), = 1 for Elia; H.m,st = 21 W/kg heart; qH,m,Life,st = 60.GJ/kg heart, qH,m,Life = 60 × 1.015 = 60.8 GJ/kg heart | |
| 2 | Lifetime Specific Entropy Generation of organ k, | gk in Figure 4= z fk | GCF = 1.015, , σH,m,st = 134 MJ/(K kg heart) σH,m,s = 134 × 1.015= 135 MJ/(K kg heart) | |
| 3 | Lifetime metabolic energy contribution by organ k to unit mass of body, | gk in Figure 4 = z(fk + dk − 1) | gH = z(fH + dH − 1)=0.75 × (−0.12 + 0.98 − 1) = −0.105, GCF = 1.02 = 60 × 0.46/84 = 0.33 GJ by heart to 1 kg body mass, qH,M,life = 0.33 × 1.02 = 0.336 GJ to 1 kg body mass | |
| 4 | Lifetime Entropy Generation contribution by organ k to unit mass of body | gk in Figure 4 = z(fk + dk − 1) | GCF = 1.02, σH,m,Life,st = 0.33 × 1000 × (1 − 0.31)/310= 0.73 MJ/K by heart to 1 kg body mass; σH,m,Life = 0.73 × 1.02 = 0.745 MJ/K by heart to 1 kg body mass | |
| 5 | Lifetime metabolic energy contribution by organ k to whole body (qk,life) | gk in Figure 4 = z(fk + dk) | gH = z(fk + dk) = 0.75 × (−0.12 + 0.98) = 0.645, GCF = 0.874, qH,Life,st = 0.33 × 84 = 27.72 GJ st by heart to whole body qH,Life, = 27.72 GJ × 0.874 = 24.1 GJ by heart to whole body | |
| 6 | Lifetime Entropy Generation contribution by organ k to whole body | gk in Figure 4 = z(fk + dk) | σH,Life,st = 27.72*(1 − 0.31) × 1000/310 = 61.34 MJ/K by heart to whole body at std mass; σH,Life,st = 61 × 34 × 0.874 = 53.6 MJ/K to whole body over life span | |
| 7 | Lifetime Specific metabolic energy release per m3 mito within organ k | gk in Figure 4 = z (fk − qk) | fH = −0.12 + 0.044 = −0.076; GCF = 1.015 |
| Nutrients | M, kg/kmol | St. O2 kg/kg Nutrient (Mole per Mole Nutrient) | HHV MJ/kg (MJ/kmol) = |ΔHc°| | RQ | M J/kg of O2 | MJ/kmol | MJ/kmol | kmol O2 Consumed per kmol ATP | Metabolic Efficiency (%) | |
|---|---|---|---|---|---|---|---|---|---|---|
| Glucose(CH), C6H12O6 | 180 | 1.066 (6 mole O2/mole CH) | 15.630 (2813 MJ/kmol) | 1 | 14.65 | −2895 | - | 1.03 | 0.158 | 38.2 |
| Fat (F), C16H32O2 | 256 | 2.869 (23 moles O2/mol F) | 39.125 (10,015 MJ/kmol) | 0.7 | 13.60 | −9840, −9800 | −6715 | 0.98 | 0.217 | 32.2 |
| Protein(P), C4.57H9.03N1.27O2.25S0.046 | 119 | 1.53 (5.70 moles O2/mole empirical P) | 22.79 (2712 MJ/kmol) | 0.80 0.82 | 14.87 | −2665 | - | 0.98 | - | 10.4 |
| Mixture, CH:F:P, 55:30:15 (Mass %) | 182 | 1.68 (9.56 moles O2 per mole mix with empirical P) | 23.75 (4328 MJ/kmol) | 0.82 | 14.146 | 4,319,894 | - | 0.999 | - | 31.23 |
| Organ | Density g/cc | ck, kg [33] | dk | ek W/kg | fk | hk (Note 4) | ik (Note 4) | pk (Note 3) | qk (Note 3) | |
|---|---|---|---|---|---|---|---|---|---|---|
| - | ρk | - | ||||||||
| Adipose Tisue-7 organ [20] | 0.9–0.92 [20] | 0.0753 (-) | 1.19 (-) | 0.22 | 0.0 | - | - | - (-) | - (-) | - |
| Brain | 1.036 [20] | 0.1025 (0.011) | 0.71 (0.76) | 11.62 (21.62) | 0.0 (−0.14) −0.07 [34] | 0.101 | 0.704 | 0.0538 (0.0538) [25] | 0.00 (0.00) [25] | 0.0442 |
| Heart (1.06) [20] | 1.06 | 0.006 (0.006) | 0.98 (0.98) | 21.3 (43.113) | 0.0 (−0.12) | 0.224 | 0.714 | 0.282 [34] (0.227) | −0.044 [34] (−0.09) | 0.146 |
| Kidney (1.05) [20] | 1.05 | 0.0089 (0.007) | 0.71 (0.85) | 21.3 (33.414) | 0.0 (−0.08) | 0.603 | 0.774 | 0.562 [35] (0.144) | −0.056 [35] (−0.14) | 0.108 |
| Liver (1.06) [20] | 1.06 | 0.0491 (0.0330) | 0.70 (0.87) | 9.7 (33.113) | 0.0 (−0.27) −0.24 [25] | 0.156 | 0.856 | 0.18 [36] (0.112) | −0.09 [36] (−0.13) | 0.186 |
| Residual Mass (RM)-Wang 2000-7 organ mass- Elia-Mod (SMRK for AT, BHKL SM and R with Wang) | - | 0.3296 (0.939) | 1.01 (1.01) | 0.58 (1.446) | 0.0 (−0.17) | - | - | - (-) | - (-) | (0.192) |
| Skeletal Muscle [20,25] | 1.04 | 0.4683 (-) | 0.99 (-) | 0.63 (-) | 0.0 (-) | 0.769 (0.769) | 0.737 (0.737) | 0.0438 (0.0438) [25] | −0.09 (−0.09) [25] | - |
| Organ k | Ek | Fk | Hk | Ik | Bk | Ok | Pk | Qk | Jk | Lk | Nk |
|---|---|---|---|---|---|---|---|---|---|---|---|
| - | Note 1, Note 2 | Note 1 | Note 1 | Note 1 | Note 1 | ||||||
| AT | 0.22 (-) | 0.0 (-) | - (-) | −1.19 (-) | 0.22 (-) | 0.0 (-) | - (-) | - (-) | - (-) | - (-) | - (-) |
| Brain | 11.62 (9.42) | 0.0 (−0.184) | 0.985 (9.182) | −0.006 (−0.056) | 11.62 (14.36) | 0.0 (−1400) Note 2 | 2.44 (4.544) | 0.0 (−0.14) | 2.623 (0.524) | 0.006 (−0.084) | 3.090 (0.617) |
| Heart | 21.31 (23.04) | 0.0 (−0.122) | 37.333 (37.333) | −0.266 (−0.266) | 22.53 (39.16) | 0.0 (2.72) | 0.874 (1.769) | 0.044 (−0.076) | 0.127 (0.257) | 0.266 (0.146) | 0.150 (0.303) |
| Kidney | 21.3 (20.95) | 0.0 (−0.094) | 65.753 (86.143) | 0.064 (−0.076) | 21.99 (32.95) | 0.0 (1.43) | 0.434 (0.681) | 0.056 (−0.024) | 0.07 (0.086) | −0.064 (−0.004) | 0.0824 (0.102) |
| Liver | 9.69 (11.49) | 0.0 (−0.310) | 3.177 (4.727) | 0.156 (−0.014) | 11.31 (24.32) | 0.0 (3.00) | 0.623 (2.128) | 0.09 (−0.18) | 0.678 (1.558) | −0.156 (−0.256) | 0.799 (1.836) |
| Residual | 0.58 (1.43) | 0.0 (−0.168) | - (-) | −0.994 (−1.01) | - (-) | - (-) | - (-) | - (-) | - (-) | - (-) | - (-) |
| SM | 0.63 (-) | 0.0 (-) | 1.643 (-) | −0.253 (-) | 0.84 (-) | 0.0 (-) | - (-) | - (-) | - (-) | - (-) | - (-) |
| Organ | Max Temp Rise, C | Organ Mass, kg Steady | MiVf-steady (Note 3) | (W/kg Organ Mass)-Steady | W/cm3 of Mito (Note 1) | Normalized Energy Release Rate W/cm3 of Mito in k/W per cm3 of Heart-Steady | q̇k (W by k) | MJ to One kg Body) | (kJ/K) to One kg Body Mass | MJ/K per kg Organ Mass | Heart Normalized Entropy Stress during Lifetime (Note 1) |
|---|---|---|---|---|---|---|---|---|---|---|---|
| AT | - | 14.620 (-) | - | 0.22 | - | 3.216 (NA) | 86.4 (NA) | 191.8 (NA) | 1.14 (-) | 1.0% (-) | |
| Brain | 3.174 (0.425) | 2.382 (0.319) | 0.0538 (0.0377) | 11.62 (11.63) | 2.44 (2.44) | 2.3 (1.93) | 27.680 (3.71) | 825.8 (113.5) | 1832.8 (252.0) | 60.32 (62.25) | 54.5% (46.1%) |
| Heart | 0.486 (0.578) | 0.461 (0.461) | 0.232 (0.283) | 21.31 (25.33) | 1.06 (1.26) | 1 (1) | 9.829 (7.09) | 274.8 (335.6) | 609.9 (744.8) | 110.6 (135.00) | 100% (100%) |
| Kidney | 0.062 (0.099) | 0.207 (0.303) | 0.439 (0.204) | 21.31 (23.44) | 0.556 (0.612) | 0.524 (.485) | 4.406 (7.09) | 131.4 (208.2) | 291.7 (462.1) | 110.6 (123.79) | 100% (91.7%) |
| Liver | 0.400 (0.590) | 1.092 (1.558) | 0.121 (0.155) | 9.69 (10.01) | 0.928 (0.959) | 0.873 (0.76) | 10.578 (15.60) | 316.4 (480.4) | 702.3 (1066.2) | 50.30 (55.37) | 45.5% (41.0%) |
| Residual Mass | - | 26.617 (82.45) | - | 0.63 (0.68) | - | - (-) | 15.438 (56.17) | 430.4 (1620.6) | 955.2 (3596.9) | 3.01 (3673.4) | 2.7% (2.7%) |
| SM | 0.308 (-) | 37.608 (-) | 0.055 (0.0) | 0.58 (0.58) | - (-) | 0.455 (0.455) | 23.693 (56.17) | 661.1 (NA) | 1467.3 (NA) | 3.27 (-) | 3% (-) |
| Sum | - | 82.99 (85.09) (Note 1) | - | - | - | - | 94.8 (94.2) | 2726.5 (2758.4) | 6051.0 (6121.9) | - | - |
© 2017 by the authors. Licensee MDPI, Basel, Switzerland. This article is an open access article distributed under the terms and conditions of the Creative Commons Attribution (CC BY) license (http://creativecommons.org/licenses/by/4.0/).
Share and Cite
Annamalai, K.; Nanda, A. Biological Aging and Life Span Based on Entropy Stress via Organ and Mitochondrial Metabolic Loading. Entropy 2017, 19, 566. https://doi.org/10.3390/e19100566
Annamalai K, Nanda A. Biological Aging and Life Span Based on Entropy Stress via Organ and Mitochondrial Metabolic Loading. Entropy. 2017; 19(10):566. https://doi.org/10.3390/e19100566
Chicago/Turabian StyleAnnamalai, Kalyan, and Arnab Nanda. 2017. "Biological Aging and Life Span Based on Entropy Stress via Organ and Mitochondrial Metabolic Loading" Entropy 19, no. 10: 566. https://doi.org/10.3390/e19100566
APA StyleAnnamalai, K., & Nanda, A. (2017). Biological Aging and Life Span Based on Entropy Stress via Organ and Mitochondrial Metabolic Loading. Entropy, 19(10), 566. https://doi.org/10.3390/e19100566