1. Introduction
Transfer Entropy (TE) [
1] is an information-theoretical functional able to detect a causal association between two variables [
2,
3,
4,
5]. TE identifies the potential driver and driven variable by statistically quantifying the flow of information from one to the other distinguishing the directionality due to its asymmetric property. Backshifting one variable at some particular lag, it returns a nonzero value indicating information flow between variables, or zero otherwise. However, in real data application, it may assume a nonzero value simply due to bias associated with the finiteness of the sample, and not because of an actual coupling [
6,
7].
Recently, sophisticated algorithms using transfer entropy have improved causal detection [
8,
9]. However, even these advanced methods require sufficient sample points to avoid false positives due to data-shortage bias. Previous studies addressed the entropy bias by estimating the probability distribution of the underlying processes [
10,
11,
12]. However, from an inference-based approach, there is still a lack of rigorous computation regarding the appropriate minimum size of the sample for a reliable TE outcome. To overcome such an issue, a statistical hypothesis test is required to distinguish independence from a causal relation. The outcome of testing depends on the sample size. This raises concern regarding the minimum sample size required for TE to provide a reliable inference of causal relation.
To answer this, we employ TE as a statistical test and search for the lower bound of the sample size that produces a reliable true positive. For the purpose of consistency, the investigation is carried out in a stationary regime, so the sample range does not result in a different interaction behavior. To this end, paradigmatic models are used in the analysis: two coupled linear
autoregressive-moving-average (ARMA) models and two coupled non-linear
logistic maps. The former is used in model-driven approaches to detect Granger causality through parametric estimation [
13]. The latter is a typical example of a nonlinear system that challenges causal inference due to its chaotic properties.
The results show that the minimum sample size for reliable outcome depends on the strength of the coupling. The larger the coupling, the smaller the sample size required to provide a reliable true positive. The relationship between coupling strength and sample size varies according to the model. We pinpoint the lower bound of the sample size at the limit of high coupling for each model.
The contents of this paper are organized as follows. In
Section 2 and
Section 3, the models and the methodology are described, in
Section 4 the main findings are presented, and in
Section 5, the results are discussed.
3. Methodology
Consider two given sets of discrete variable
and
. Any causal relationship between them should be restrained in the temporal order of the
X and
Y elements. Let us suppose that
X influences
Y after
units of time. One can detect this relationship using the TE functional. TE evaluates the reduction in the uncertainty of the
past of a possible driver
due to the knowledge of the
present of a possible driven
Y when the
past of
is given.
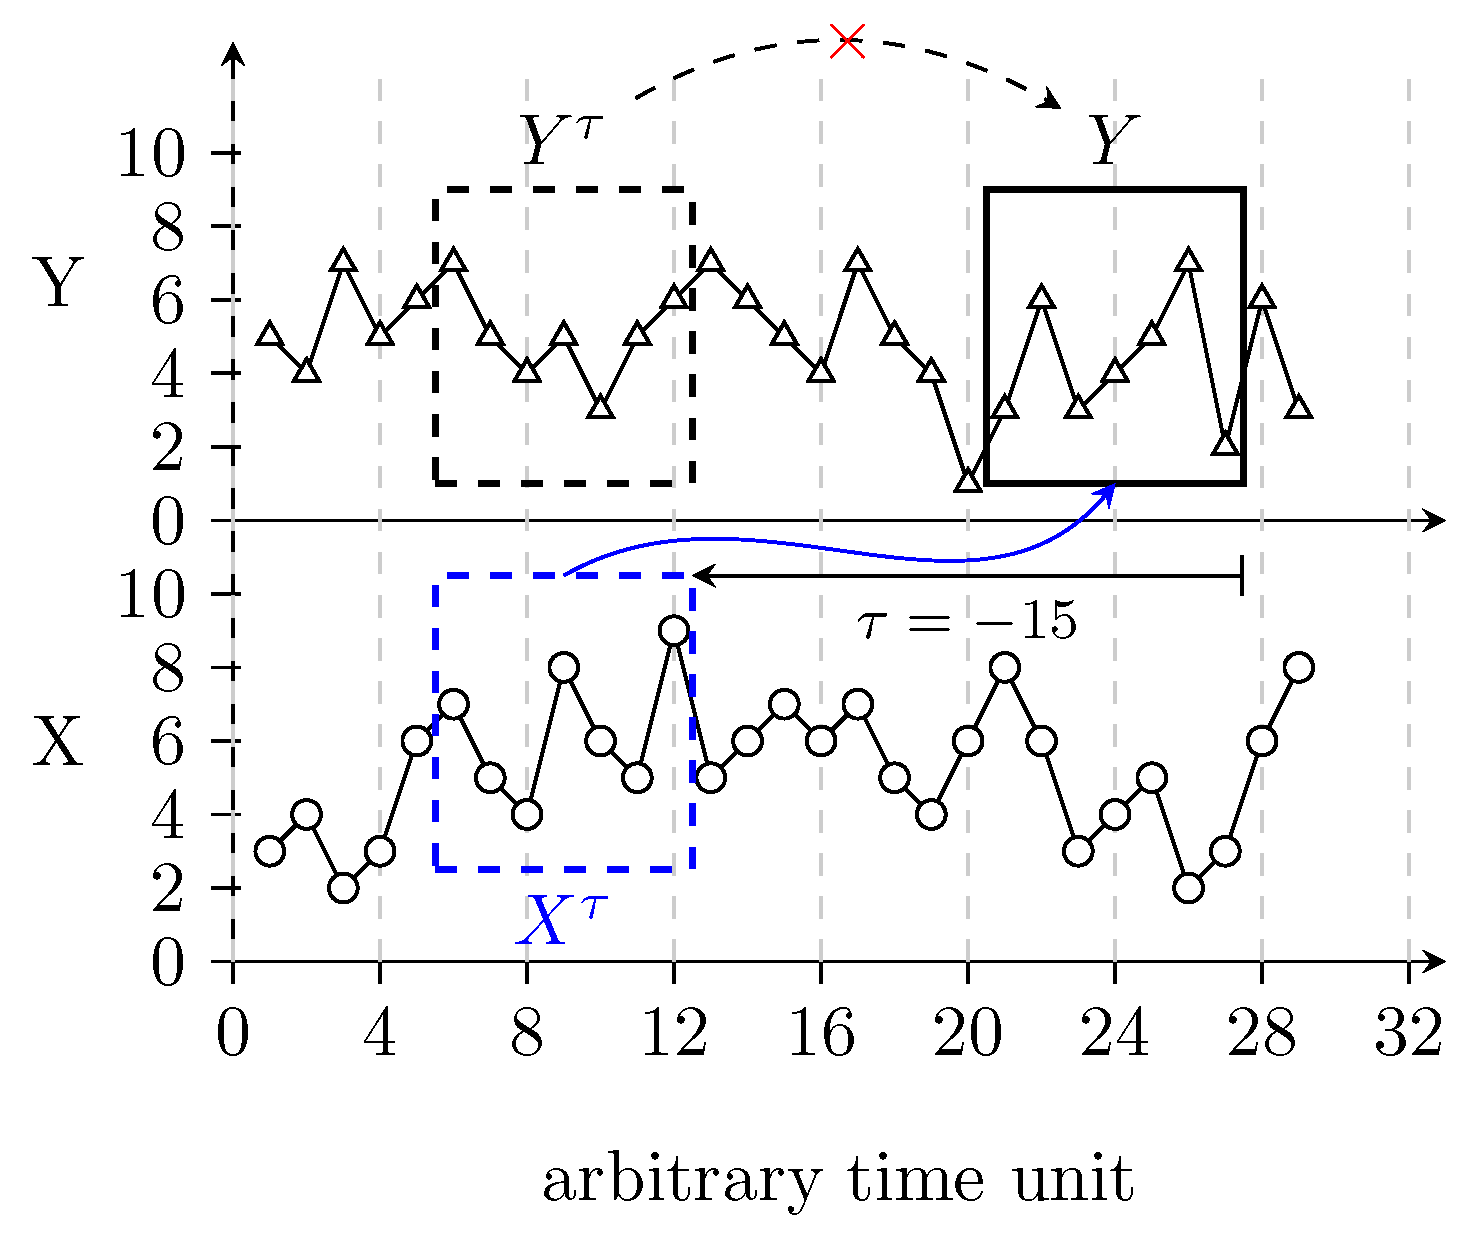
Figure 1 illustrates the idea behind the sampling for TE calculation. The TE from
X to
Y is evaluated as follows
Whenever X and Y are infinite independent random variables, the expression (3) is zero. However, in the case of two finite datasets, TE will be greater than zero, even if X and Y are supposed to be independent. This bias is due to a finite size effect, and it has to be addressed via a statistical inference procedure.
Let us assume a null hypothesis stating that
X and
Y are independent for a particular lag
. At this lag, an ensemble of surrogate data is generated from the original data. A confidence interval is defined as a percentile of the surrogate’s TE distribution. If the TE calculated from the original dataset (original TE) is significantly higher than the confidence interval, then the null hypothesis is rejected and causality is detected. However, for a small dataset, the bias is considerable when compared to the original TE [
16]. The small-sample issue leads to a type II error, e.g.,
X and
Y are not independent, but the hypothesis is falsely accepted.
The minimum number of sample points that prevent such bias has been estimated. Assuming the processes as being independent and with each having equiprobable B partitions, one can find a preliminary lower bound for the proper sample size such that .
Our computational approach improves this naive estimation by investigating the dependence of the TE value with the sample size
N. It searches for the smallest
so the original TE is significantly higher than the confidence interval. The trustworthiness of TE is tested for the models presented in
Section 2, contemplating its particularities.
The methodology is described as follows. The reliability of the true positives is tested against several sample sizes. For each sample size tested, 100 runs with different initial conditions are performed. For each run, an ensemble of 2000 surrogates is obtained from the original data, and the respective TE is calculated at a fixed
. A significance level of
is chosen, so the 99.95 percentile of the surrogate ensemble is defined as the upper confidence bound, which for the sake of simplicity we have called the threshold
. Whenever the original TE is higher than
, the null hypothesis is rejected. Otherwise it is accepted. This produces a comparison-wise error rate of
when considering the multiple comparisons between the 100 runs of different initial conditions. In other words, a significance level of 4.9% is obtained when all the 100 TEs calculated from the original dataset are significantly higher than all the respective
. In the analysis, we consider the most coarse-grained measure, i.e., a bipartition of the variable’s dynamics domain using two ordinal patterns.
Appendix A presents the details of the probability estimation while
Appendix B explains the upper bound of Transfer Entropy.
4. Results
In this section, the minimum sample size
required to avoid type II error is pinpointed with a significance level of 4.9%.
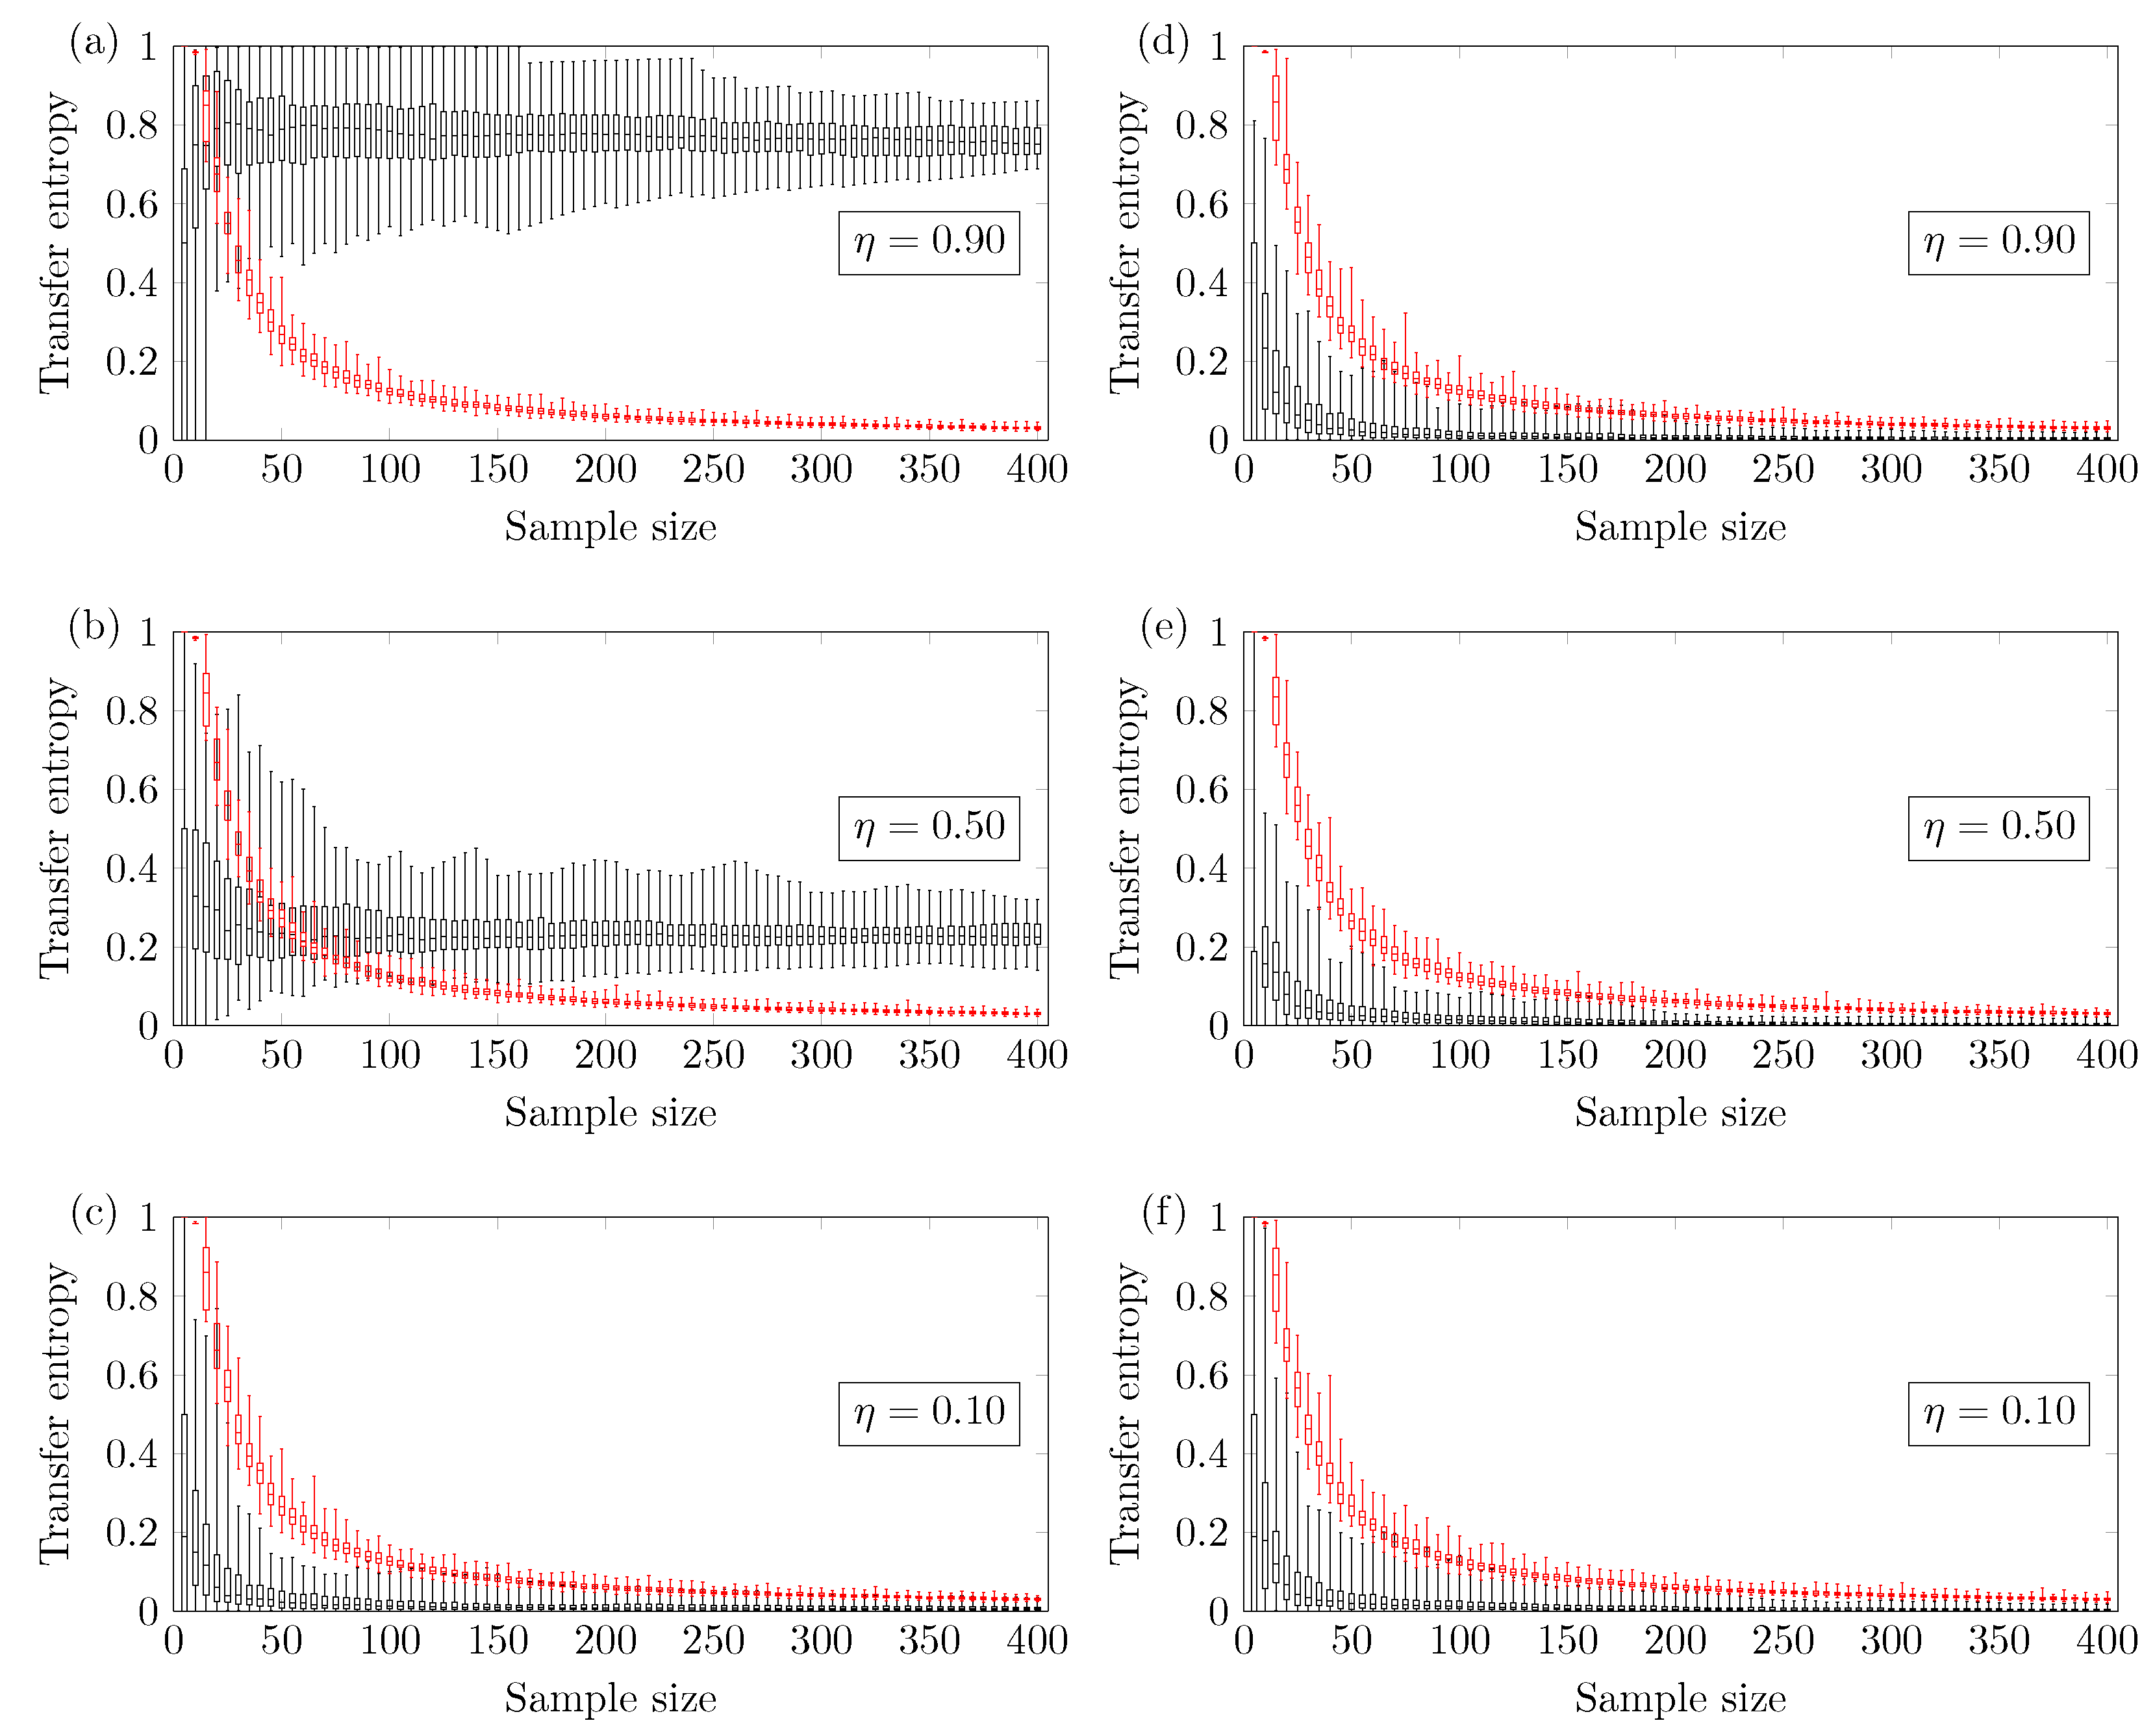
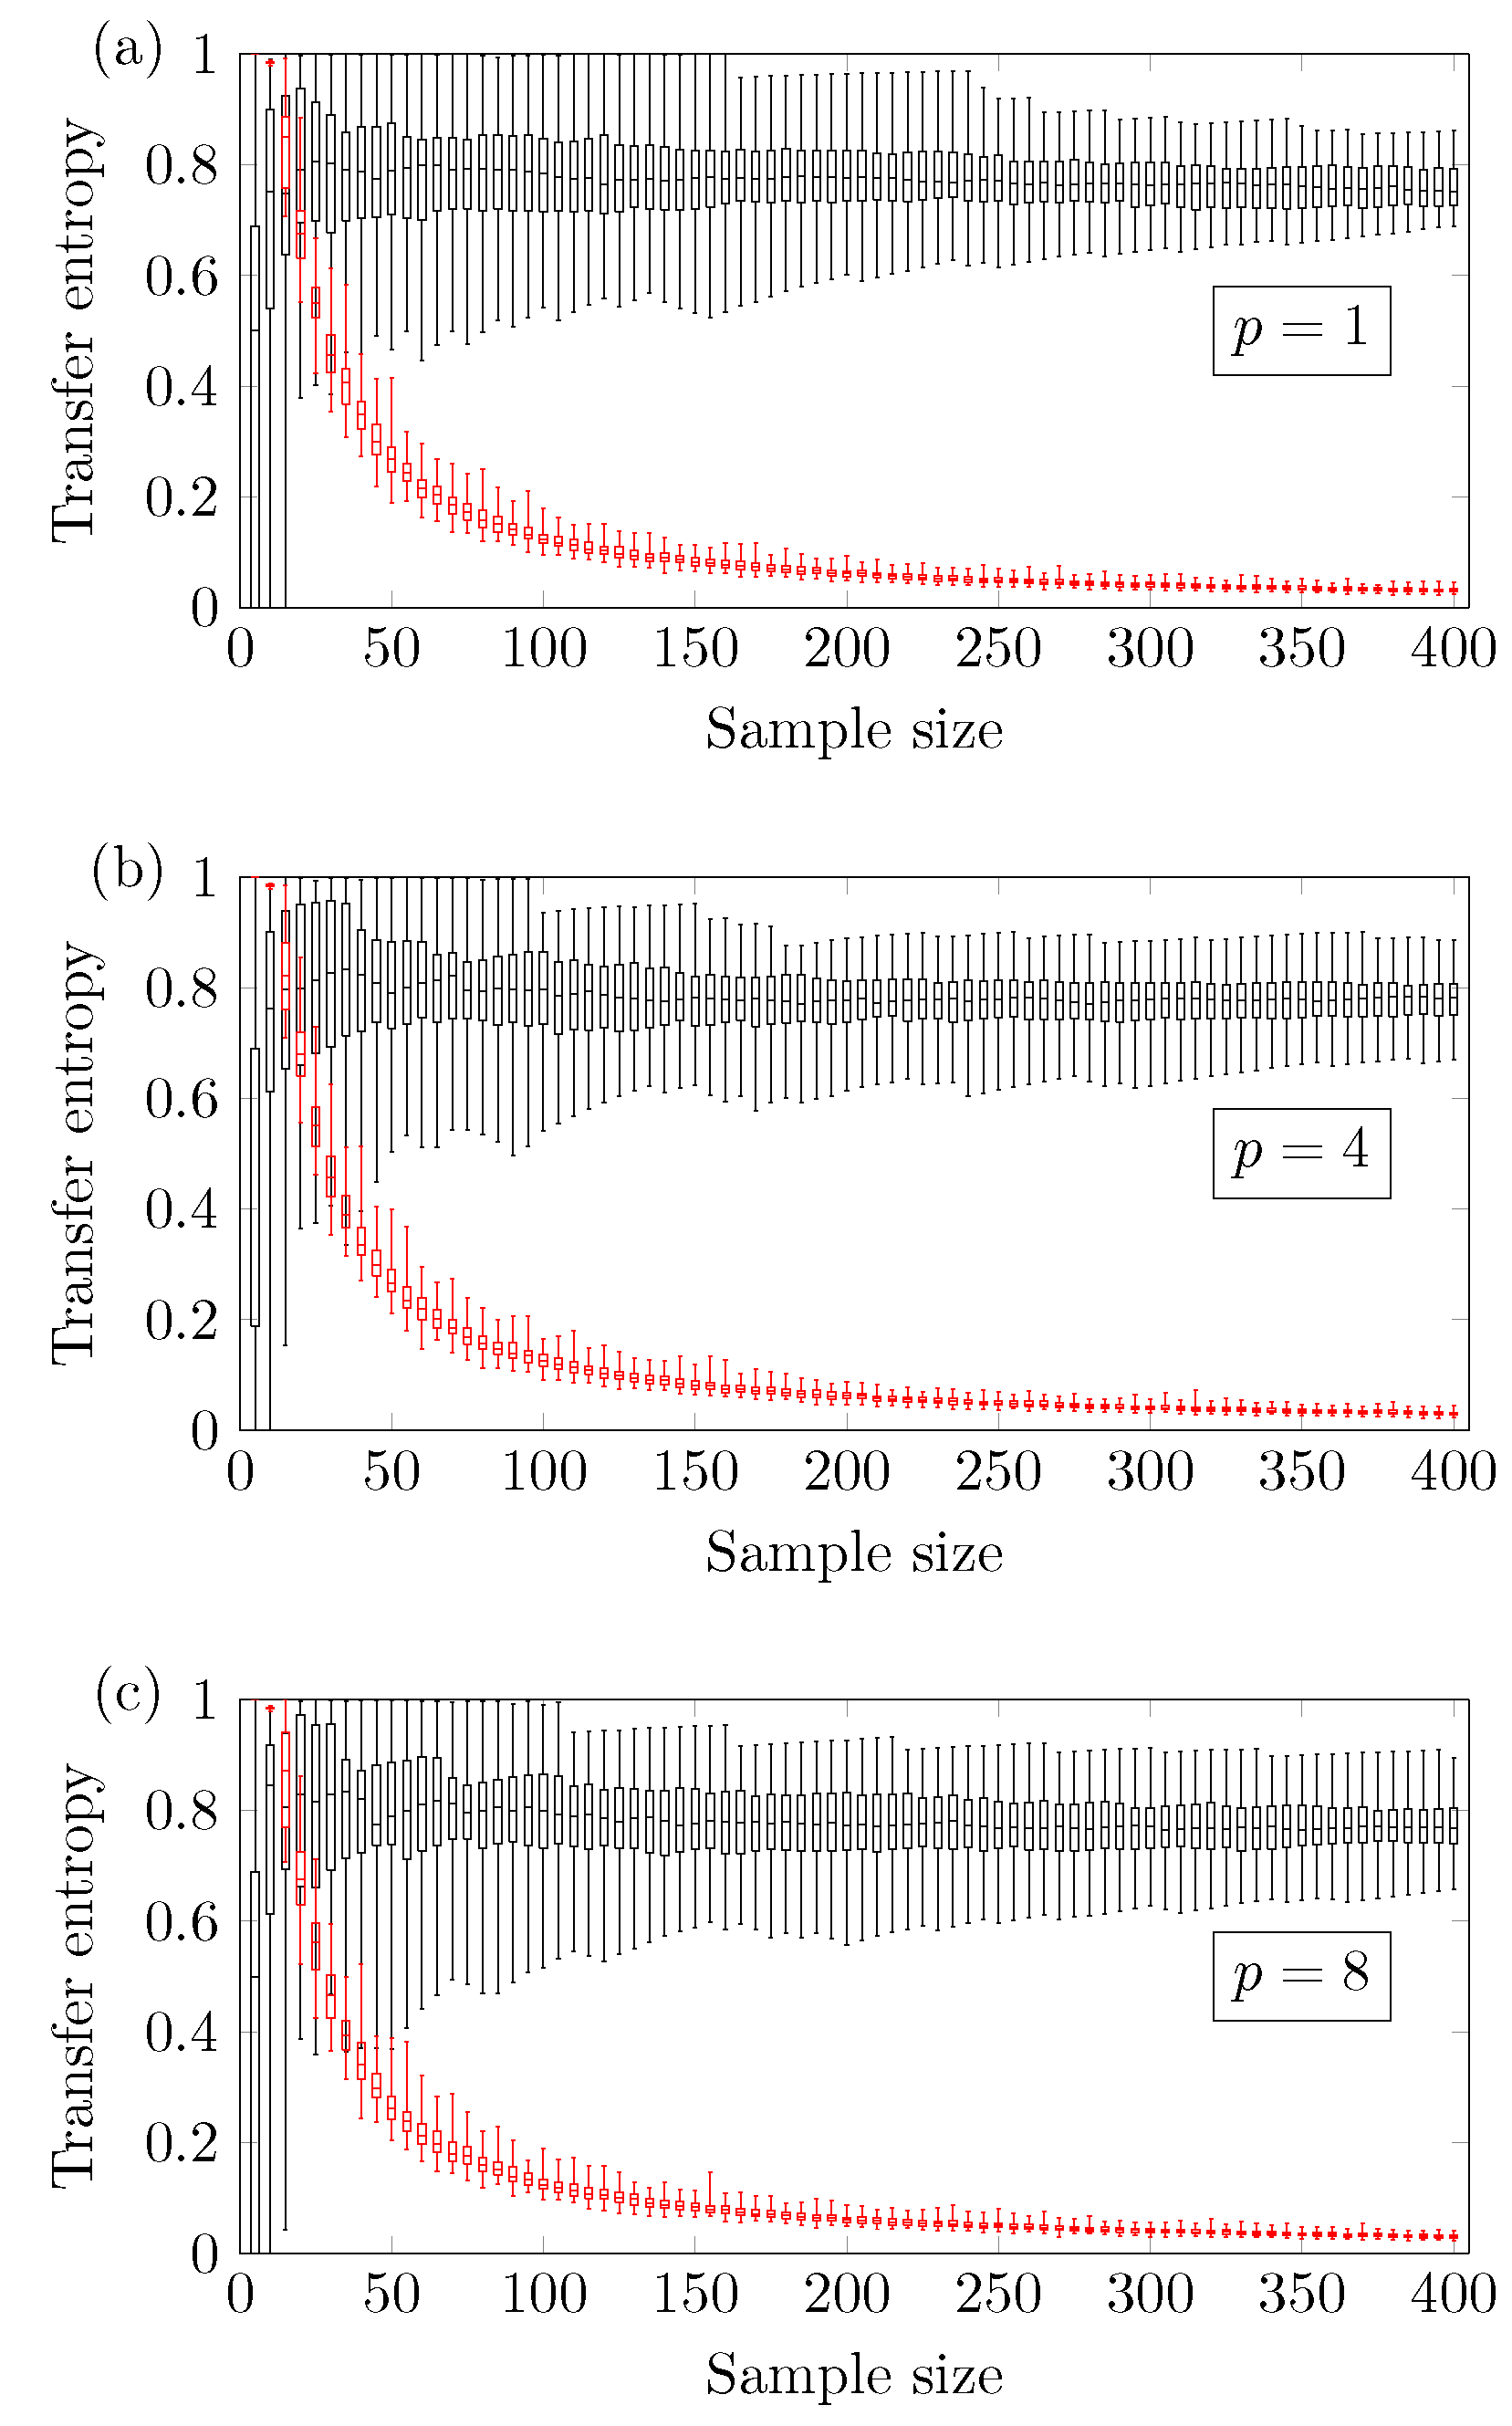
Figure 2,
Figure 3,
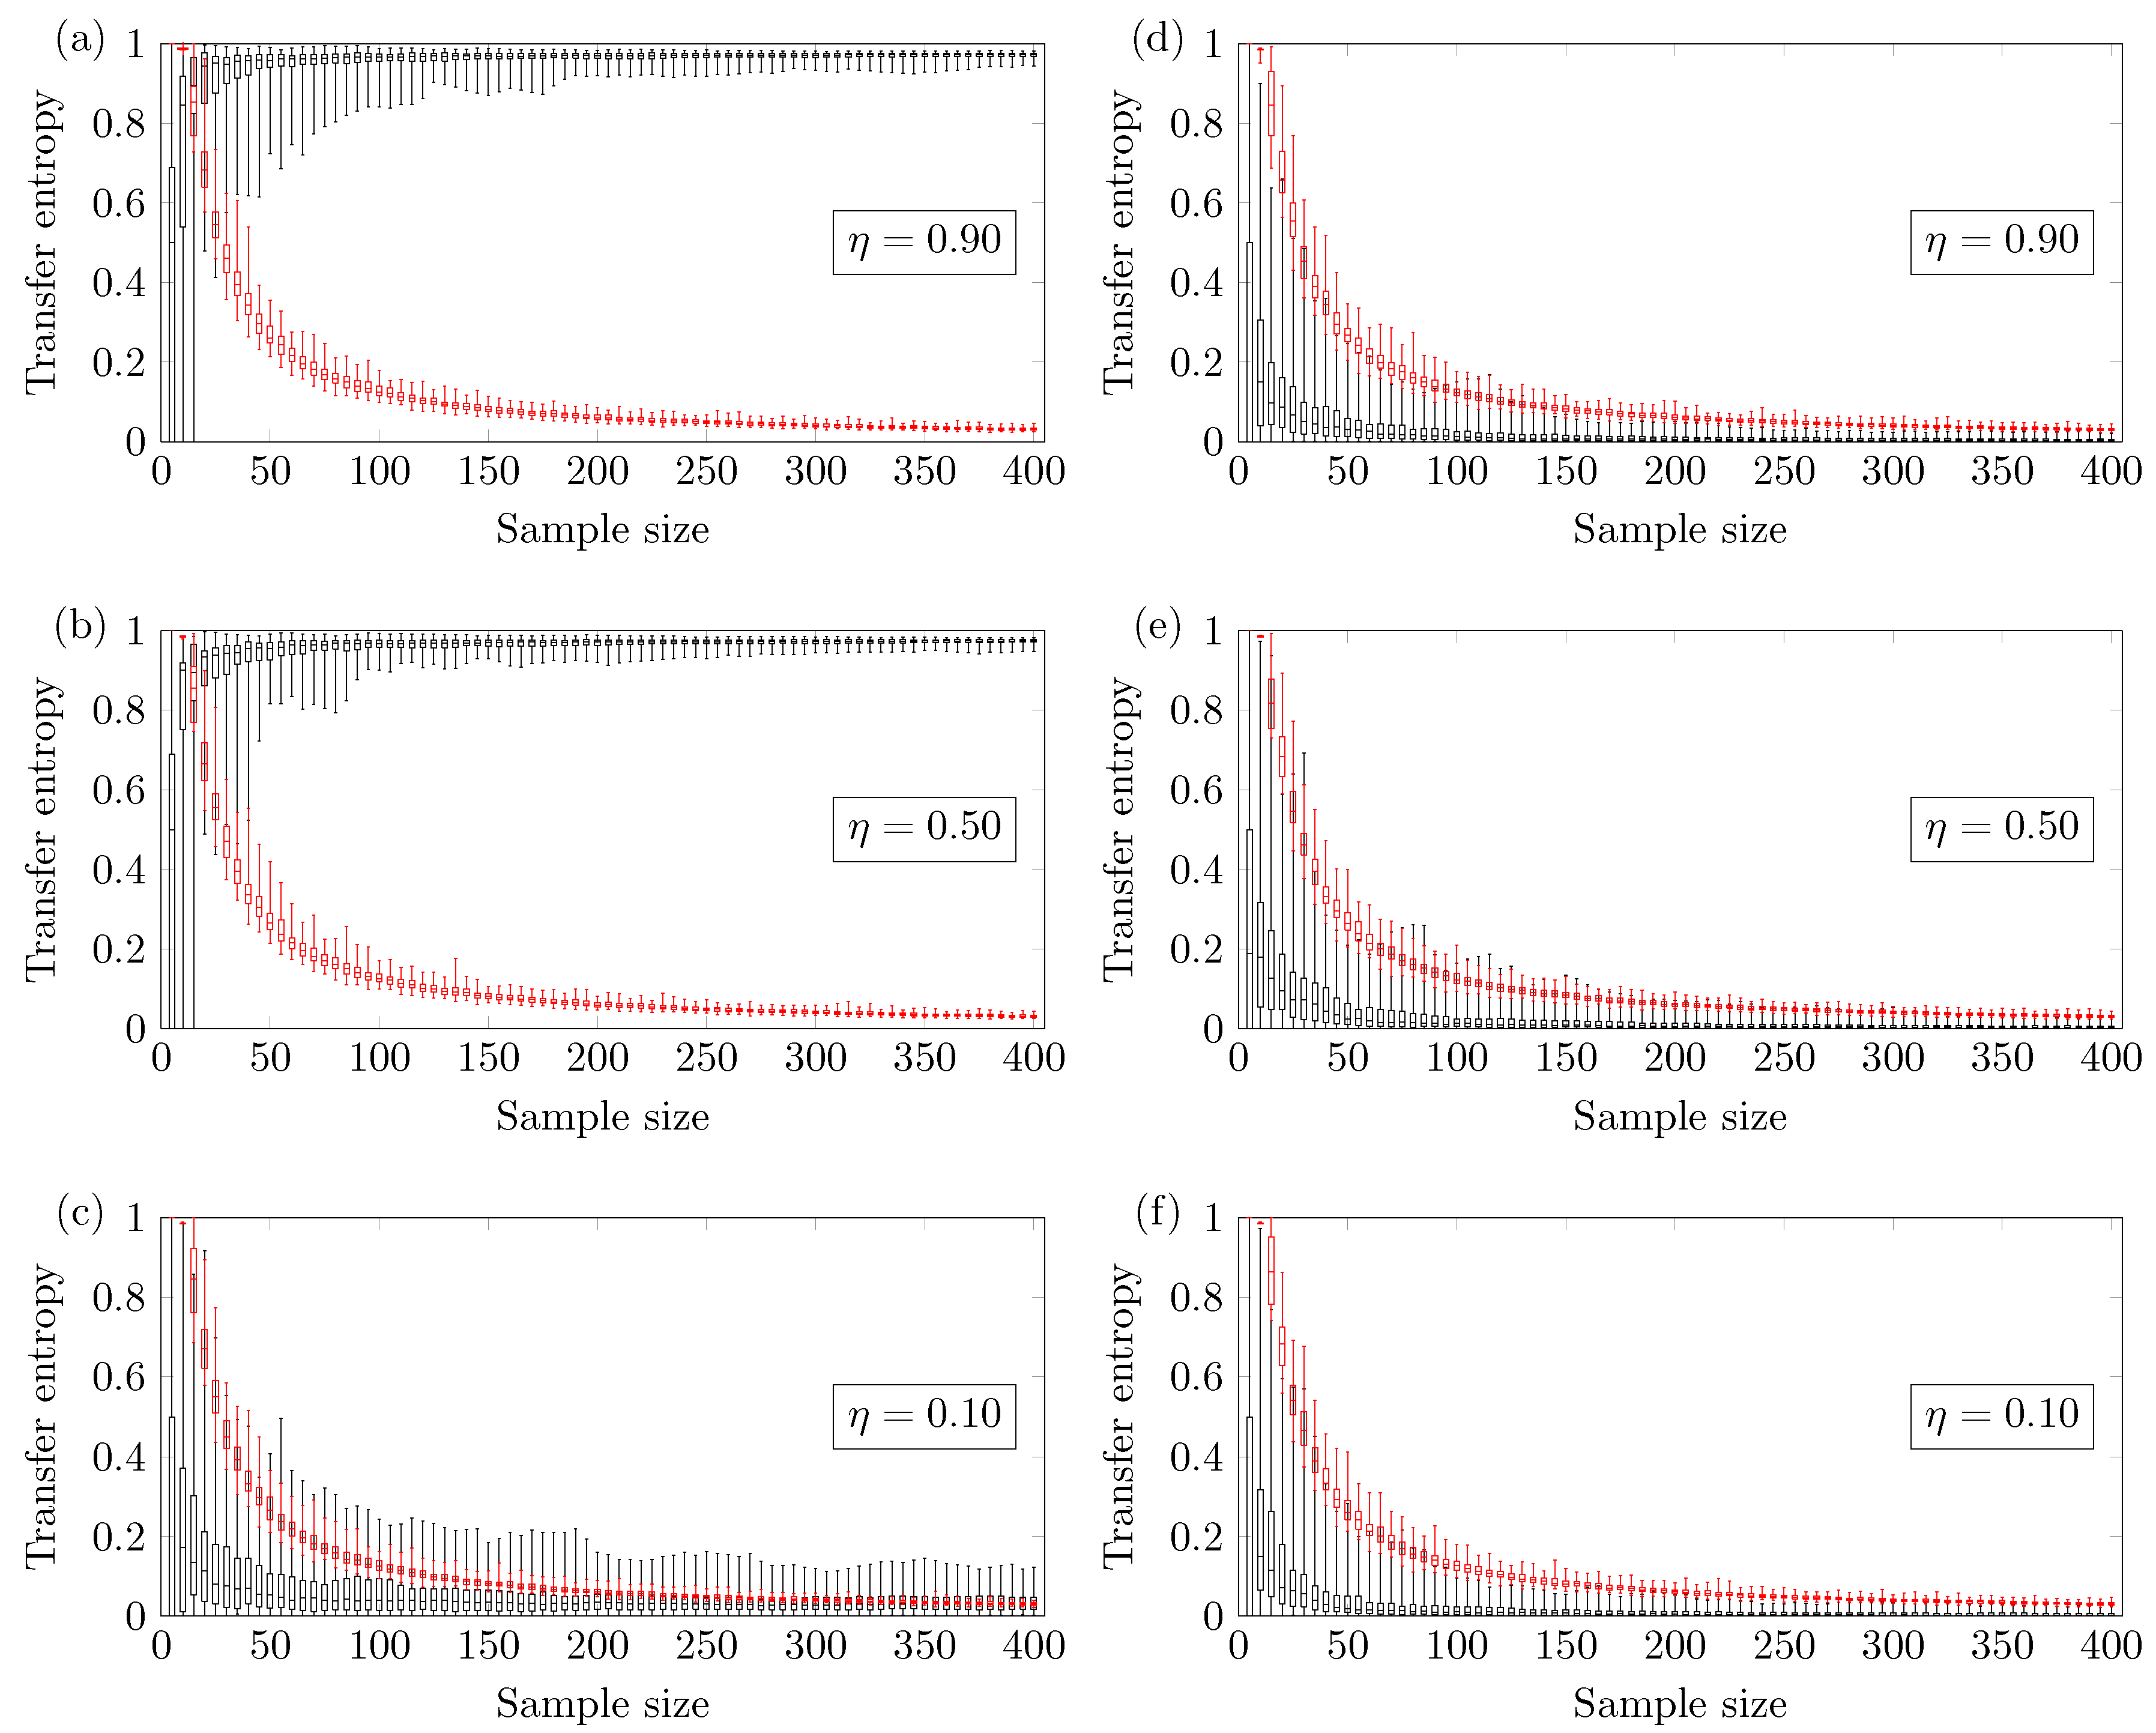
Figure 4 and
Figure 5 show the boxplot regarding the 100 TE values versus the sample size
N. The ends of the whiskers represent the minimum and maximum TE values. The TE calculated from the original time series is seen in black, and the threshold
(family-wise error rate of 0.0005) is seen in red. The minimum reliable sample size
is defined as the smallest
N therefore the minimum TE value calculated from the original time series is higher than the maximum TE calculated from the threshold. All statements have been made according to a confidence level of 4.9% (comparison-wise error rate).
4.1. Coupled ARMA[p,q]
Figure 2 shows the results for the two coupled ARMA[1,1] models. The reliable minimum sample size
depends on the coupling strength of the model.
Figure 2a shows results for coupling strength
; the TE method yields a reliable true positive if one uses
.
Figure 2b shows results for coupling strength
; the TE method yields a reliable true positive if one uses
. Finally,
Figure 2c shows results for coupling strength
; no minimum sample size
is identified (up to
). This means that there is a higher chance of obtaining false negatives.
Figure 2d–f show the TE of
versus the sample size. In this case, the methodology presents a negligible chance of type I error, which is the incorrect rejection of a true null hypothesis.
In the particular case of the ARMA[
] model,
Figure 3 shows that the reliable minimum sample size
does not depend significantly on the memory of the autoregressive term. The results refer to the autoregressive window size
.
We also investigated the relationship between the reliable minimum sample size
and the parameter
that regulates the stochasticity.
Figure 4a,b show the results for
and
. One can notice that
depends on the ARMA parameter
. For
, the minimum reliable sample size is
, and for
, the minimum reliable sample size is
. So the higher the parameter
is, the larger the
value must be to obtain a reliable true positive.
4.2. Couple Logistic Maps
Figure 5 shows that the
value here changes more abruptly according to the coupling strength in the nonlinear coupled logistic map if compared with the ARMA model.
Figure 5a shows the results for coupling strength of
. In this case, one requires
sample points for the proper detection of the influence of
X on
Y. This lower bound is very close to the one identified in the ARMA model with the same coupling strength.
Figure 5b shows the results for the coupling strength
; in this case, the number of sample points for a reliable true positive is
. For the coupling strength
, no minimum sample size
is identified (up to
).
Figure 5c shows a high probability of obtaining false negatives, so no lower bound is identified.
Figure 5d–f show that the TE method presents a negligible chance of type I error.
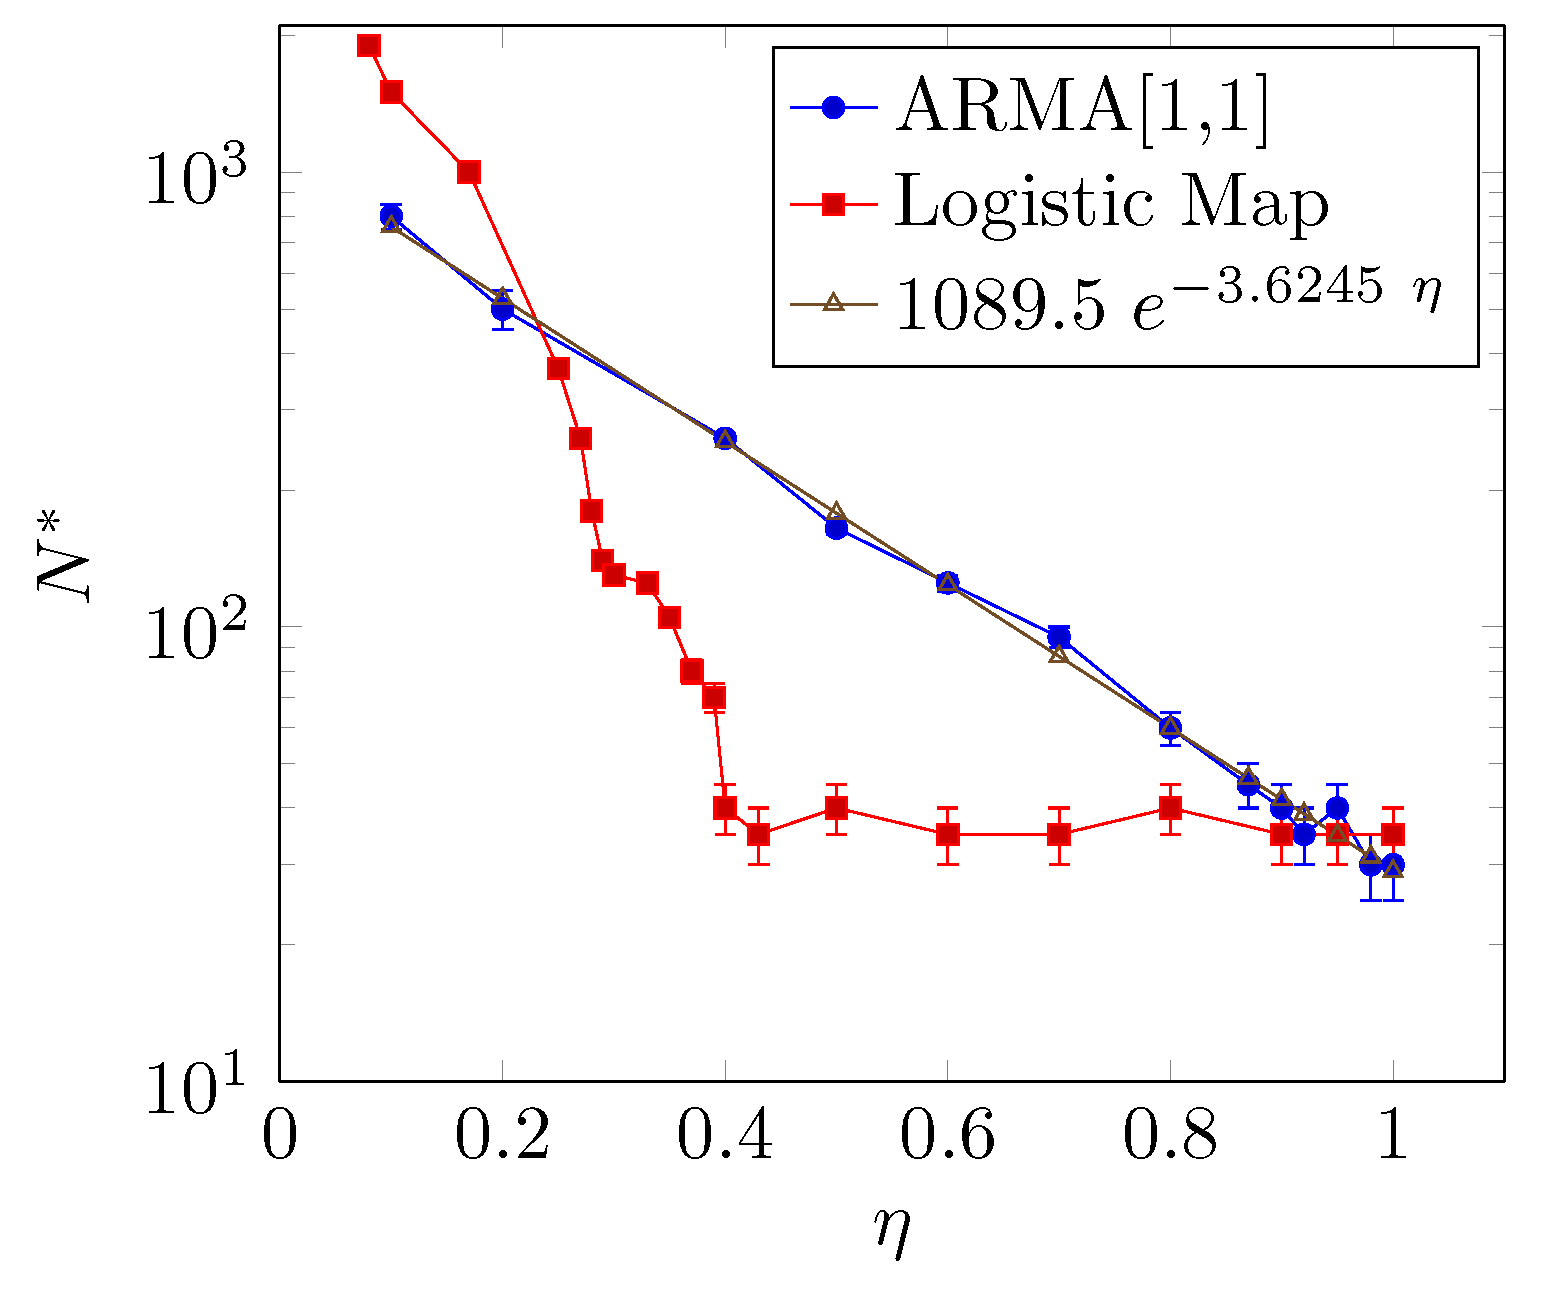
Figure 6 shows the relationship between the reliable minimum sample size
and the coupling parameter
. The larger the coupling parameter
is, the smaller the
that is required, but the way
decays with
is different for the two models. The relationship between
and
for the ARMA[1,1] model presents an exponential decay, whereas for the coupled logistic map,
presents an abrupt decay when
and a saturation behavior around
for
.
The result regarding the coupled logistic map depicted in
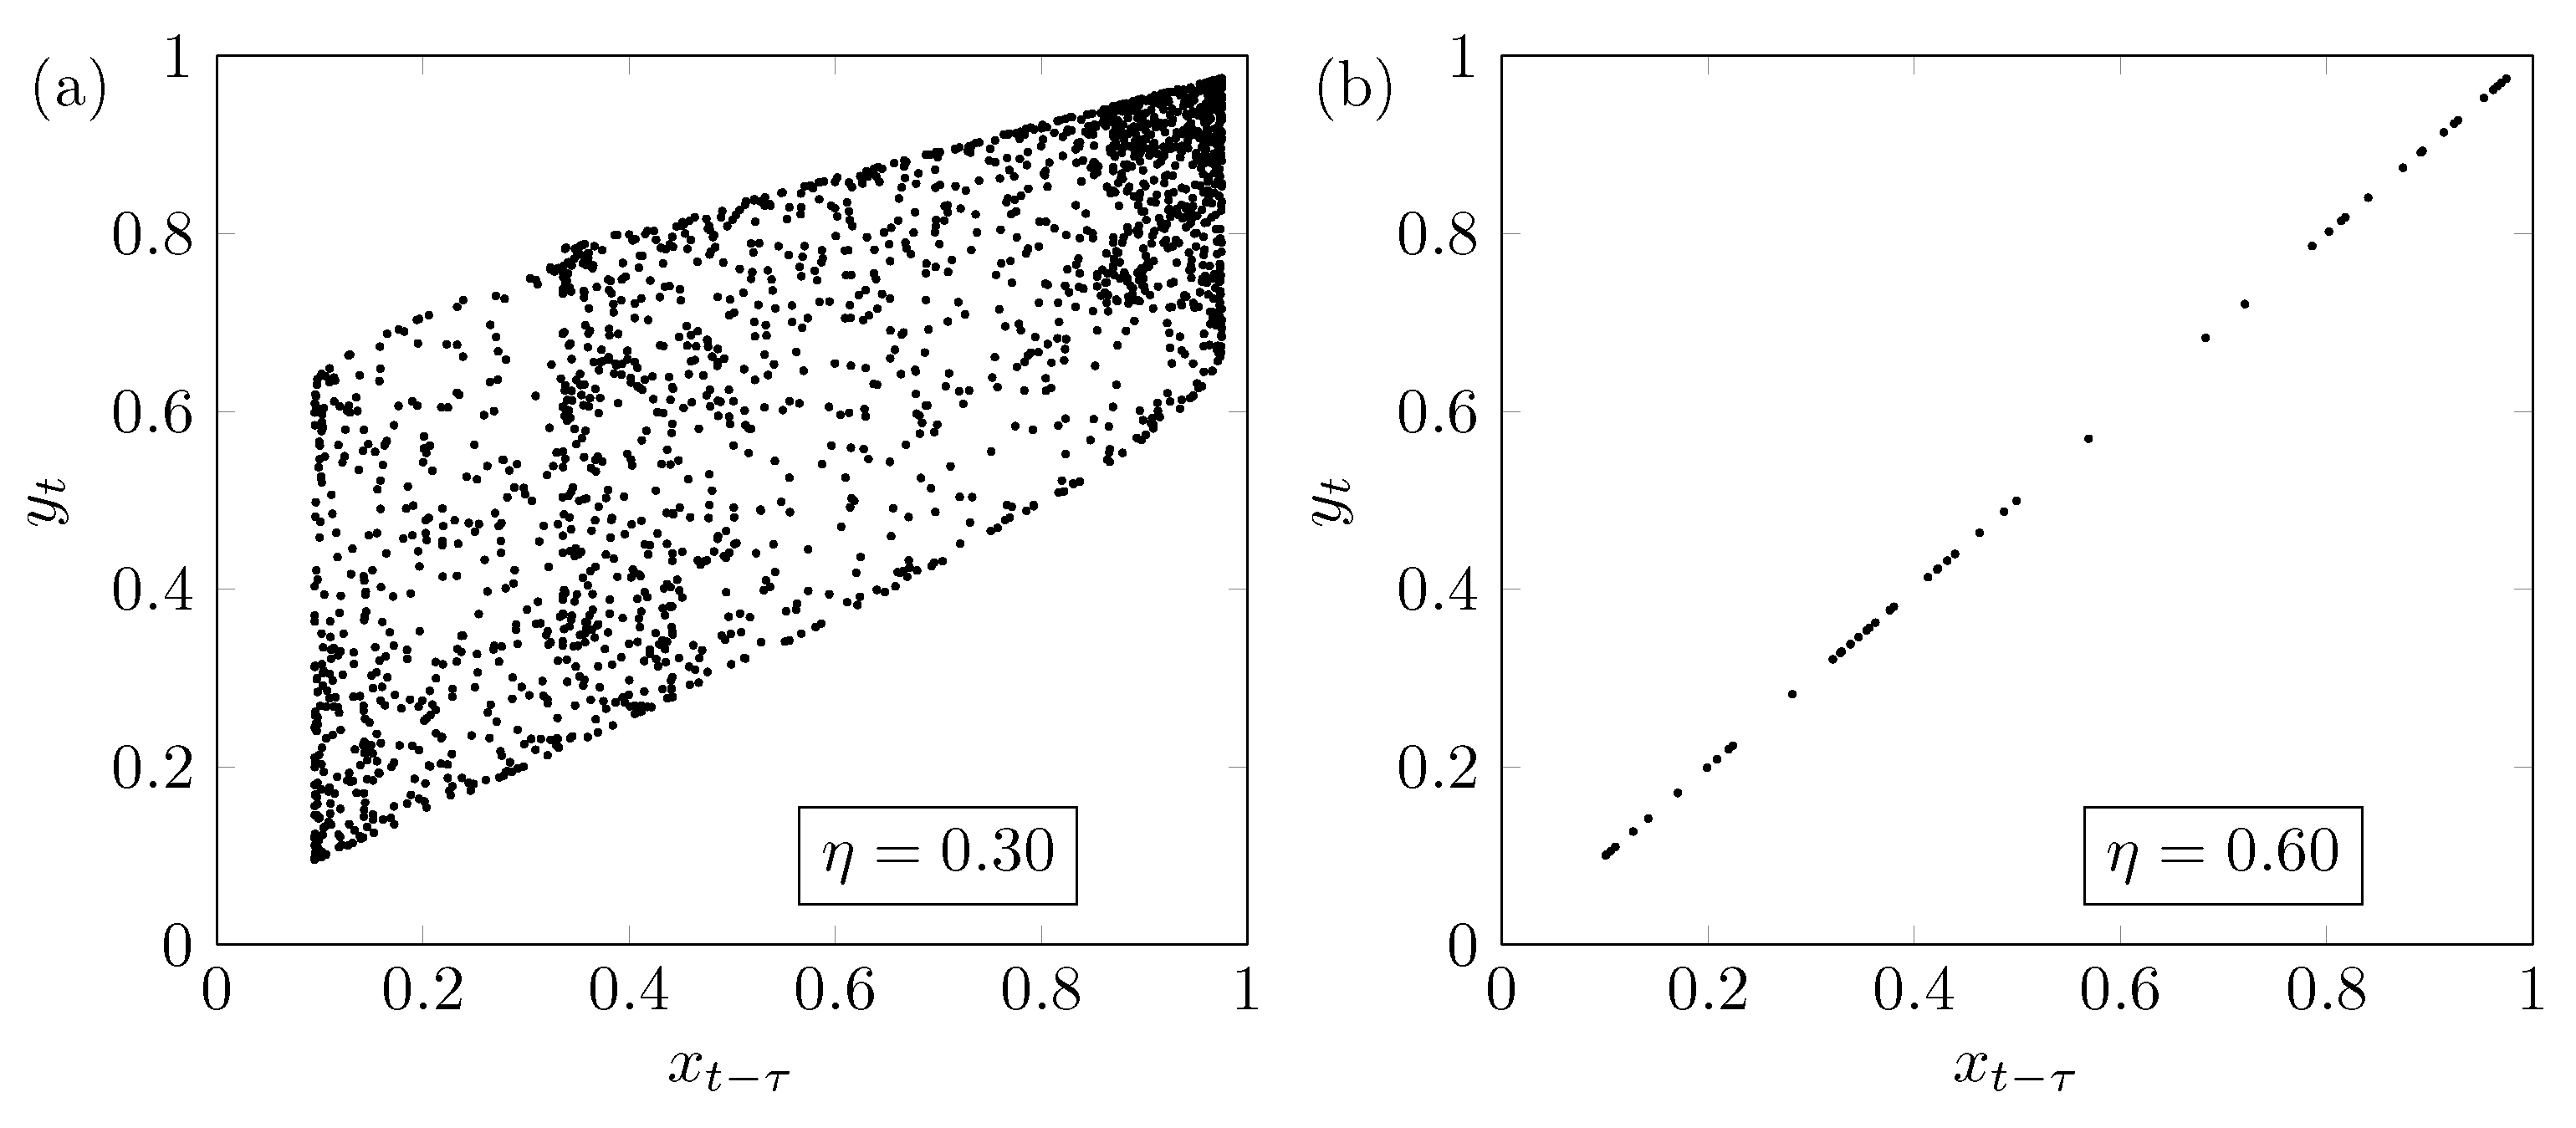
Figure 6 can be explained as follows: The saturation happens because around
, the driven synchronizes its dynamics with the driver.
Figure 7a shows the behavior of the system for
, i.e., below the synchronization transition. Furthermore,
Figure 7b shows the behavior when the system is very close to the synchronized state between the systems with
. We stress that this result is important and unexpected because it shows that, even in an almost synchronized state, the underlying methodology can detect interactions correctly.
Moreover, at the high coupling limit, the minimum sample size of the ARMA[1,1] model is , somewhat small if compared with the logistic maps, namely . Despite the fact that this coupling analysis considers only ideal and simplified models, this number can be thought of as the lower bound for the entropy transfer using a significance level of 5% and two ordinal patterns.
4.3. Three Ordinal Pattern
A larger amount of sample points is needed to obtain a reliable outcome using three ordinal patterns.
Figure 8 shows the relationship between TE and
N using three ordinal patterns and
. One can see that the ARMA[1,1] model requires at least
sample points, while the logistic model needs at least
sample points.
5. Conclusions
In this paper, we have presented a quantitative analysis to find the minimum sample size that produces a reliable true positive outcome using Transfer Entropy. We have tested two paradigmatic models: the linear ARMA model, commonly used in Granger causality approaches; and the well known nonlinear logistic map. The models are constructed to describe two coupled variables X and Y; X influences Y after a lag with coupling strength regulated by the parameter .
The analysis shows that the size of
depends on the coupling strength
,
being the larger and
the smaller. This result is expected since the information flow increases with the coupling [
5,
17], therefore it is reasonable to conclude that the larger the coupling is, the smaller the sample size required to infer causality.
However, the relationship between and depends on the model. For the coupled ARMA model, decreases exponentially as increases whereas, for the coupled logistic map, decays abruptly for followed by a saturation as increases.
Furthermore, at the high coupling limit, the value of approaches sample points. This result establishes the lower bound of the reliable minimum sample size for inference-based causality testing using Transfer Entropy. For this particular case, we use a probability estimation through bipartition of the variable domain. We have shown that the higher the partitioning is, the higher the value is. This methodological procedure can be reproduced for different models, control experimental data and also probability estimation.
