We now give the detailed analysis of the prediction procedures in the following subsections.
3.1. Data Preprocessing
The collection and the preprocessing of historical data are very important for the prediction scheme. However, some missing or unreasonable and even wrong data are usually contained in the original dataset, which is often obtained by a statistical machine and artificial classification. Accordingly, we should perform analysis and preprocessing of the original data to eliminate the influence of the abnormal data in order to improve the accuracy of the prediction scheme.
- (1)
Error data and missing data processing.
On the basis of the analysis of the distribution of the EC data, we use the data at the same time point in the last year to replace the error data or the missing data.
For the error data and the missing data in a dataset, these can be replaced by that of the same period of the last year’s electricity and the last or the next month’s electricity of the same year.
- (2)
Normalization processing.
In our proposed prediction scheme, four variables are considered as the factors affecting the electric power consumption with different dimension. Therefore, the data should be normalized by a suitable method first. In this work, we use the following formula to normalize the data:
where
denotes the electricity data before normalization, and
and
are the maximum and minimum data in the dataset, respectively;
stands for normalized data.
We can easily obtain the anti-normalization data by the following formula:
3.2. Selection of Influence Factors
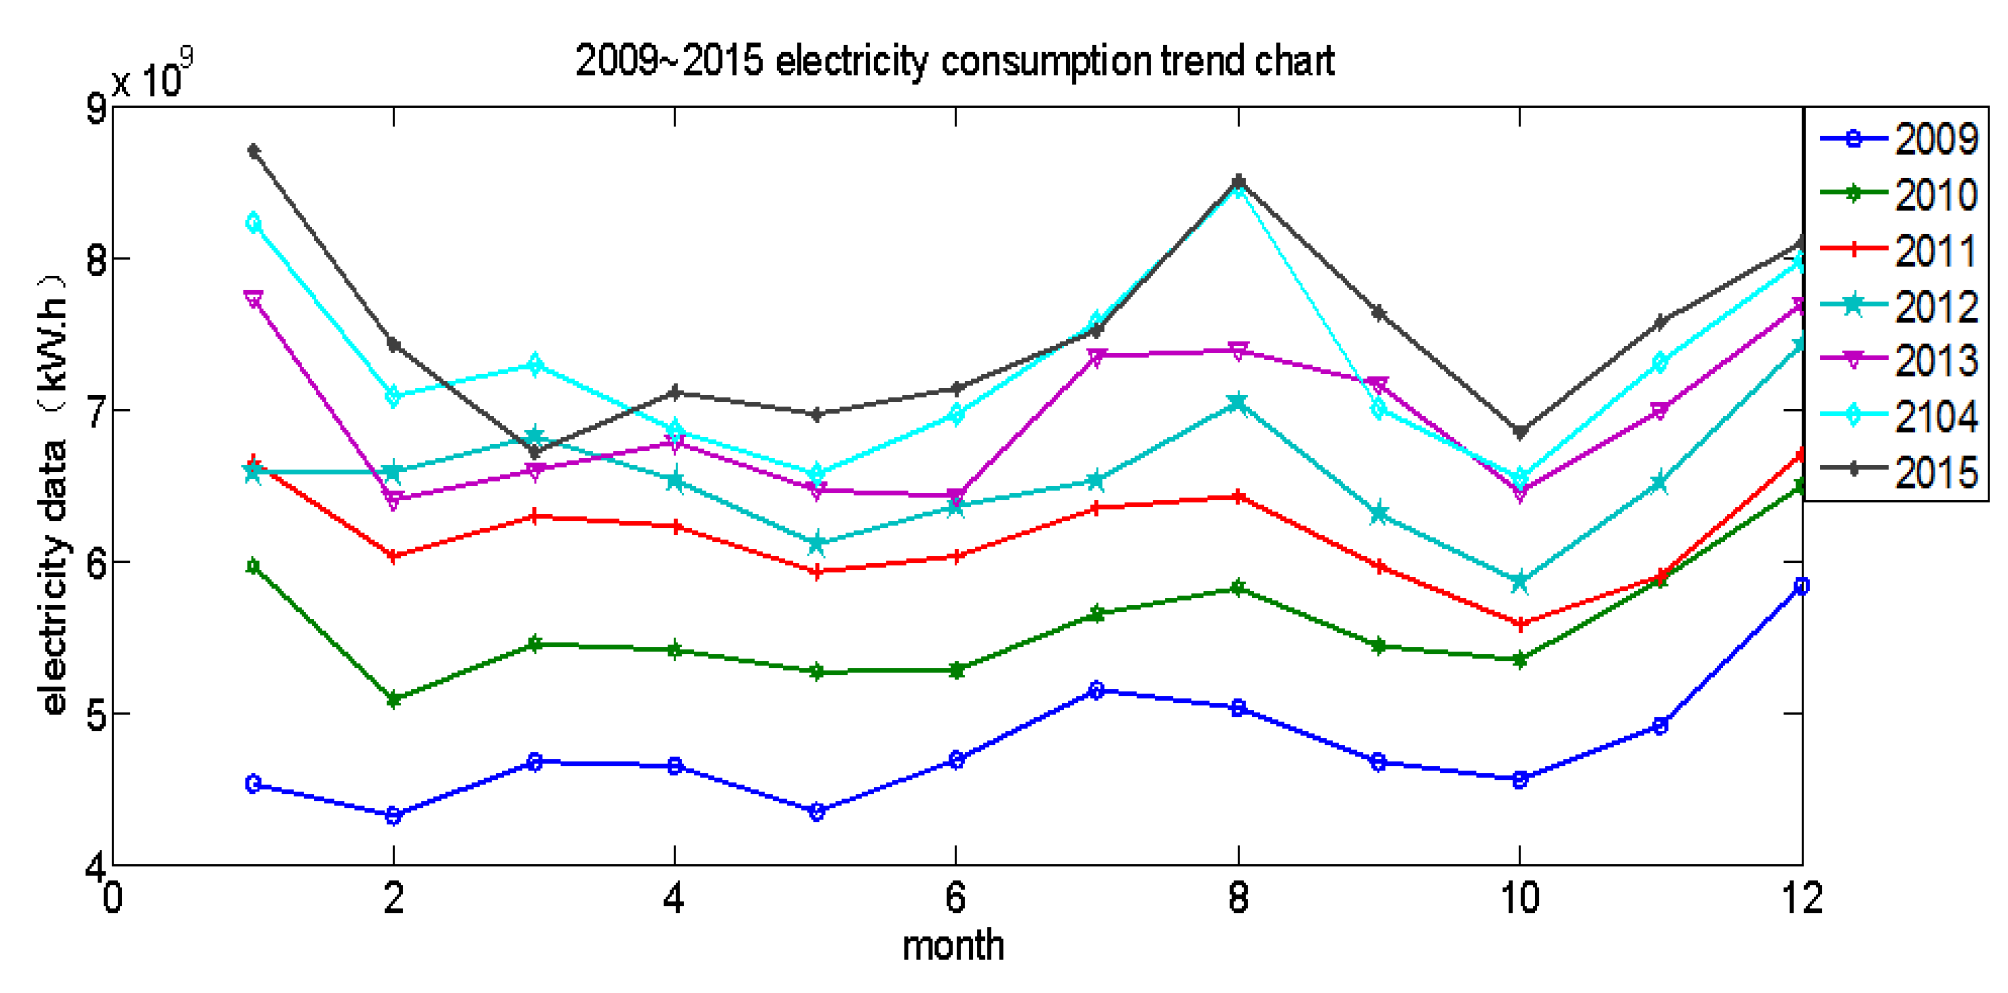
In this work, we mainly focus on predicting the EC of Shaanxi Province, China by using the proposed model. We have collected the EC data each month from 2009 to 2015 in Shaanxi Province. The trend of the EC is given in
Figure 1. One can observe that although the EC fluctuated among the different years, the trend of the EC for every year was essentially identical. This primary result indicates that the EC has a certain regularity, and it is predictable.
The main factors affecting EC are the economy, climate, electricity structure, electricity and so on. After analyzing the existing data, from the point of view that it can best reflect the change in EC, this paper chooses historical EC data, gross domestic product (GDP), and the regional temperature for a total of three features supplemented by holidays to correct.
- (1)
The quantity of electricity data.
According to the historical electricity data analysis above, we can roughly observe the development trend of the electricity demand. Consequently, it provides a profitable tool for extracting rules from that experience and knowledge to estimate the overall distribution trend in the future.
Electricity data always contains hidden information; from these historical data can be summed up the law of changes in demand for electricity; researchers on the basis of these laws can estimate the future trend of the overall distribution of the EC. In order to describe the trend of EC more clearly, this section uses the original quantity of electricity data, which is not normalized.
The historical EC is shown in
Figure 1. Horizontally, there is a significant fluctuation in the amount of electricity for the 12 months of the year. First, we calculate the standard deviation of the data by the following Equation (
16), and the degree of fluctuation as the proportion of the standard deviation and average value are defined. The maximum fluctuation using Equation (
16) of the above data is 23.4%. Longitudinally, the amount of electricity consumed increases to different degrees every year, with an average increase of 5.21%.
where
N denotes the number of the month,
is the monthly electricity, and
is the average annual EC.
- (2)
Regional temperature.
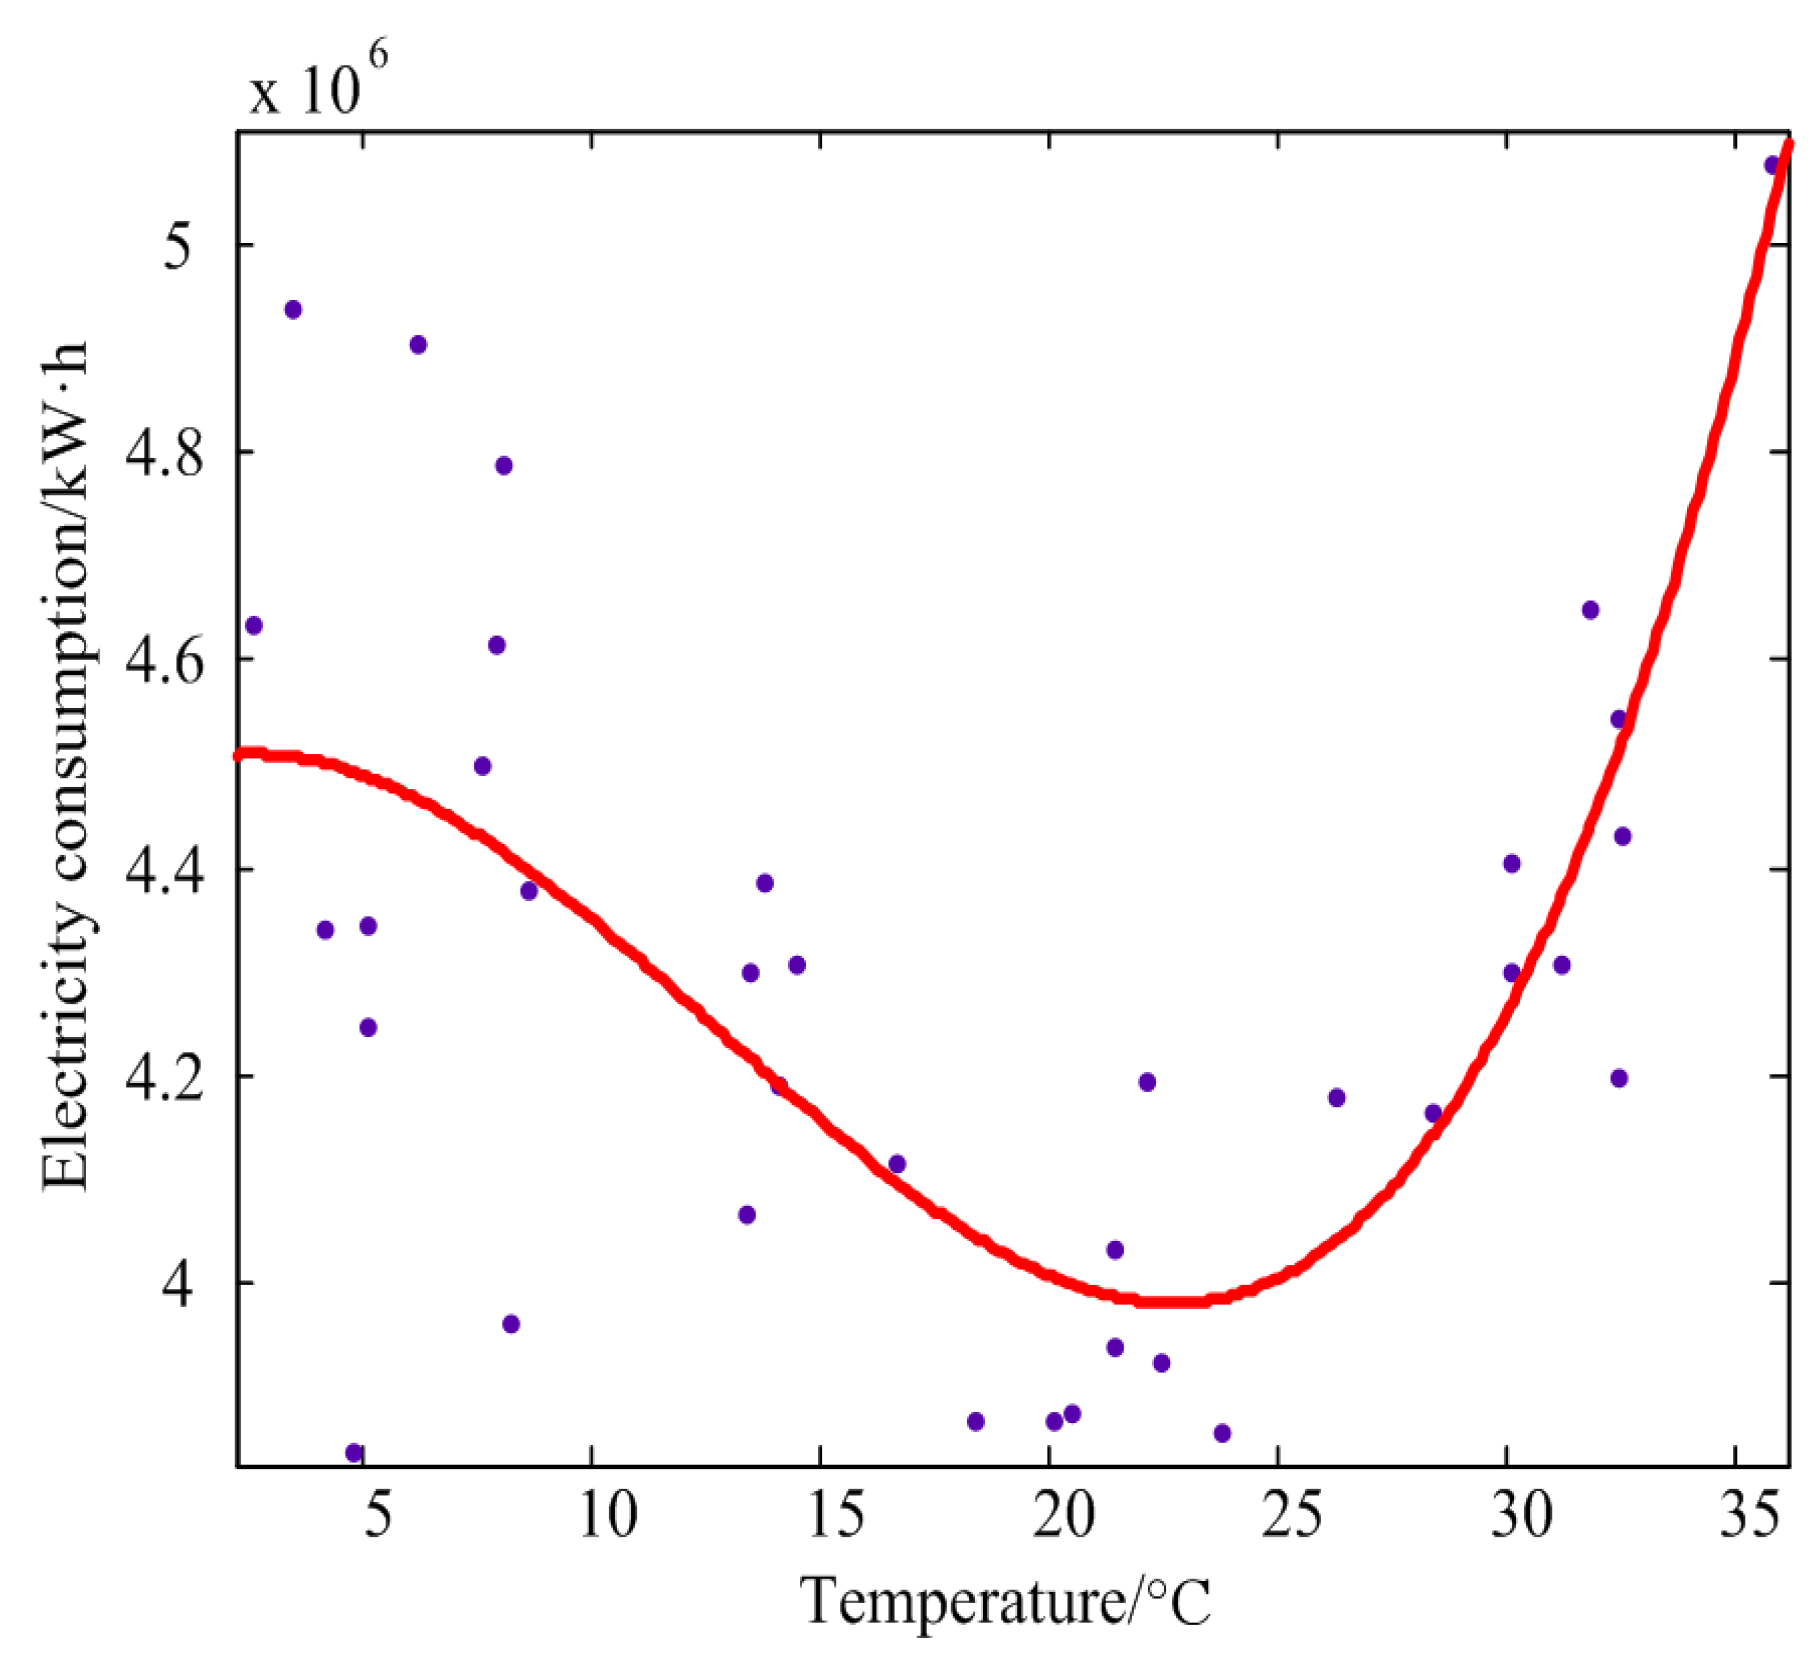
For the current residential or industrial EC, there is a relationship between the temperature and the EC [
27], as shown in
Figure 2. In the season with a high temperature, the user’s power consumption will be greatly increased as a result of the input of refrigeration facilities such as air conditioners, and in the season with low temperature, the warmth will still consume a large amount of electric energy. Therefore, this paper also sets the temperature as an important factor affecting the EC.
- (3)
GDP.
Economic factors, such as the development of industry and commerce, have an influence on the power system, because the rapid development of industry and commerce necessarily leads to an increase in electricity demand. In this paper, we use the GDP, which is the most representative in the field of economy, to represent economic factors.
- (4)
Number of holidays and types of holidays.
Holidays have significant impacts on the electricity demand. In general, holiday production will be significantly reduced and electricity demand will decrease accordingly. However, the demand of electricity may increase in the Spring Festival and on the National Day because of residential electricity use substantially increasing. Accordingly, we should conduct an analysis of the characteristics of the local electricity demand to confirm the change in its trend (i.e., increasing or decreasing). Finally, after predicting the user’s EC using the proposed scheme, the prediction result may also be corrected according to the holidays.
3.3. Parameter Optimization
When the LSSVM model is used find to the quantity of electricity, the kernel parameters and the regularization parameter have a very important effect for the prediction accuracy; thus they need to be optimized firstly. The grid optimization method and K-fold cross-validation are combined to optimize the parameters in this paper. The reasons and principle introduction are as follows:
Using this combination algorithm is simple and direct for searching the parameters of LSSVM, and the searching speed compared with the test-set parameters may be faster.
The main mechanism of the combination algorithm combination?algorithm is to divide the parameters in a predetermined range into a certain number of grids and then make the model traverse all the parameters in the grid to determine the parameters of the model performance.
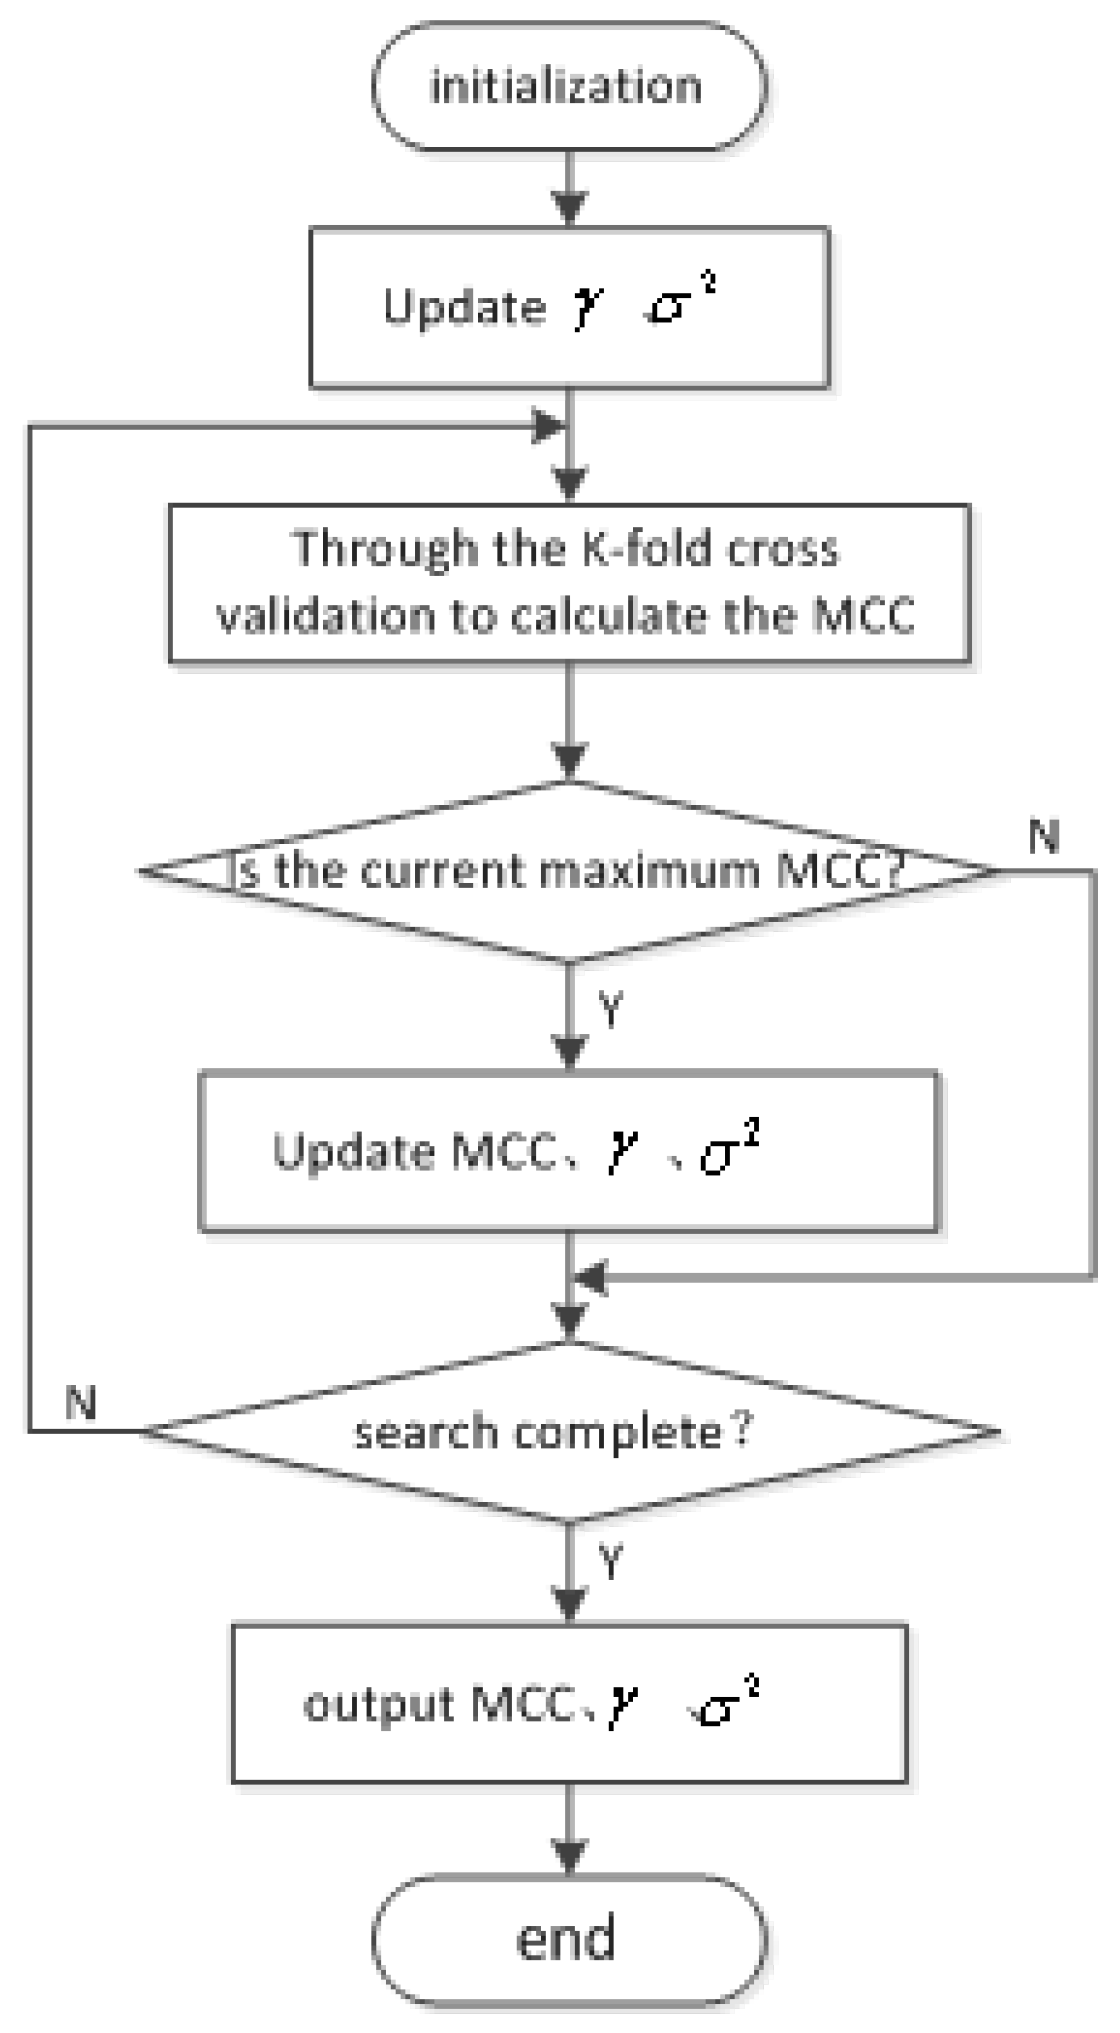
Just as for the traditional LSSVM model, two parameters in the proposed ECPM need to be optimized. During the optimization process, we used the training samples to train the LSSVM model, while the MCC instead of the MSE was employed to evaluate the optimal performance obtained by the certain parameters in the set of parameters and .
In order to perform the parameter optimization, the MCC is introduced as a risk function. When the training sample does not satisfy the Gaussian distribution, it can also find the appropriate parameters, which is very helpful to improve the accuracy of the prediction of the quantity of electricity. The MCC can be expressed by Equation (
17):
where
is the value of the kernel width optimized by the mesh optimization method.
By Equation (
17), we conclude that the larger the value of the MCC, the greater the similarity of the data between the predictive value and the real value. To this end, we select the parameters that make the MCC the maximum as the optimal parameter of the prediction model. The flow chart of the parameter optimization is shown in
Figure 3.


