The Informational Dynamics of Mean‒Variance Relationships in Fertilizer Markets: An Entropic Investigation


Abstract
:1. Introduction
2. Methodology
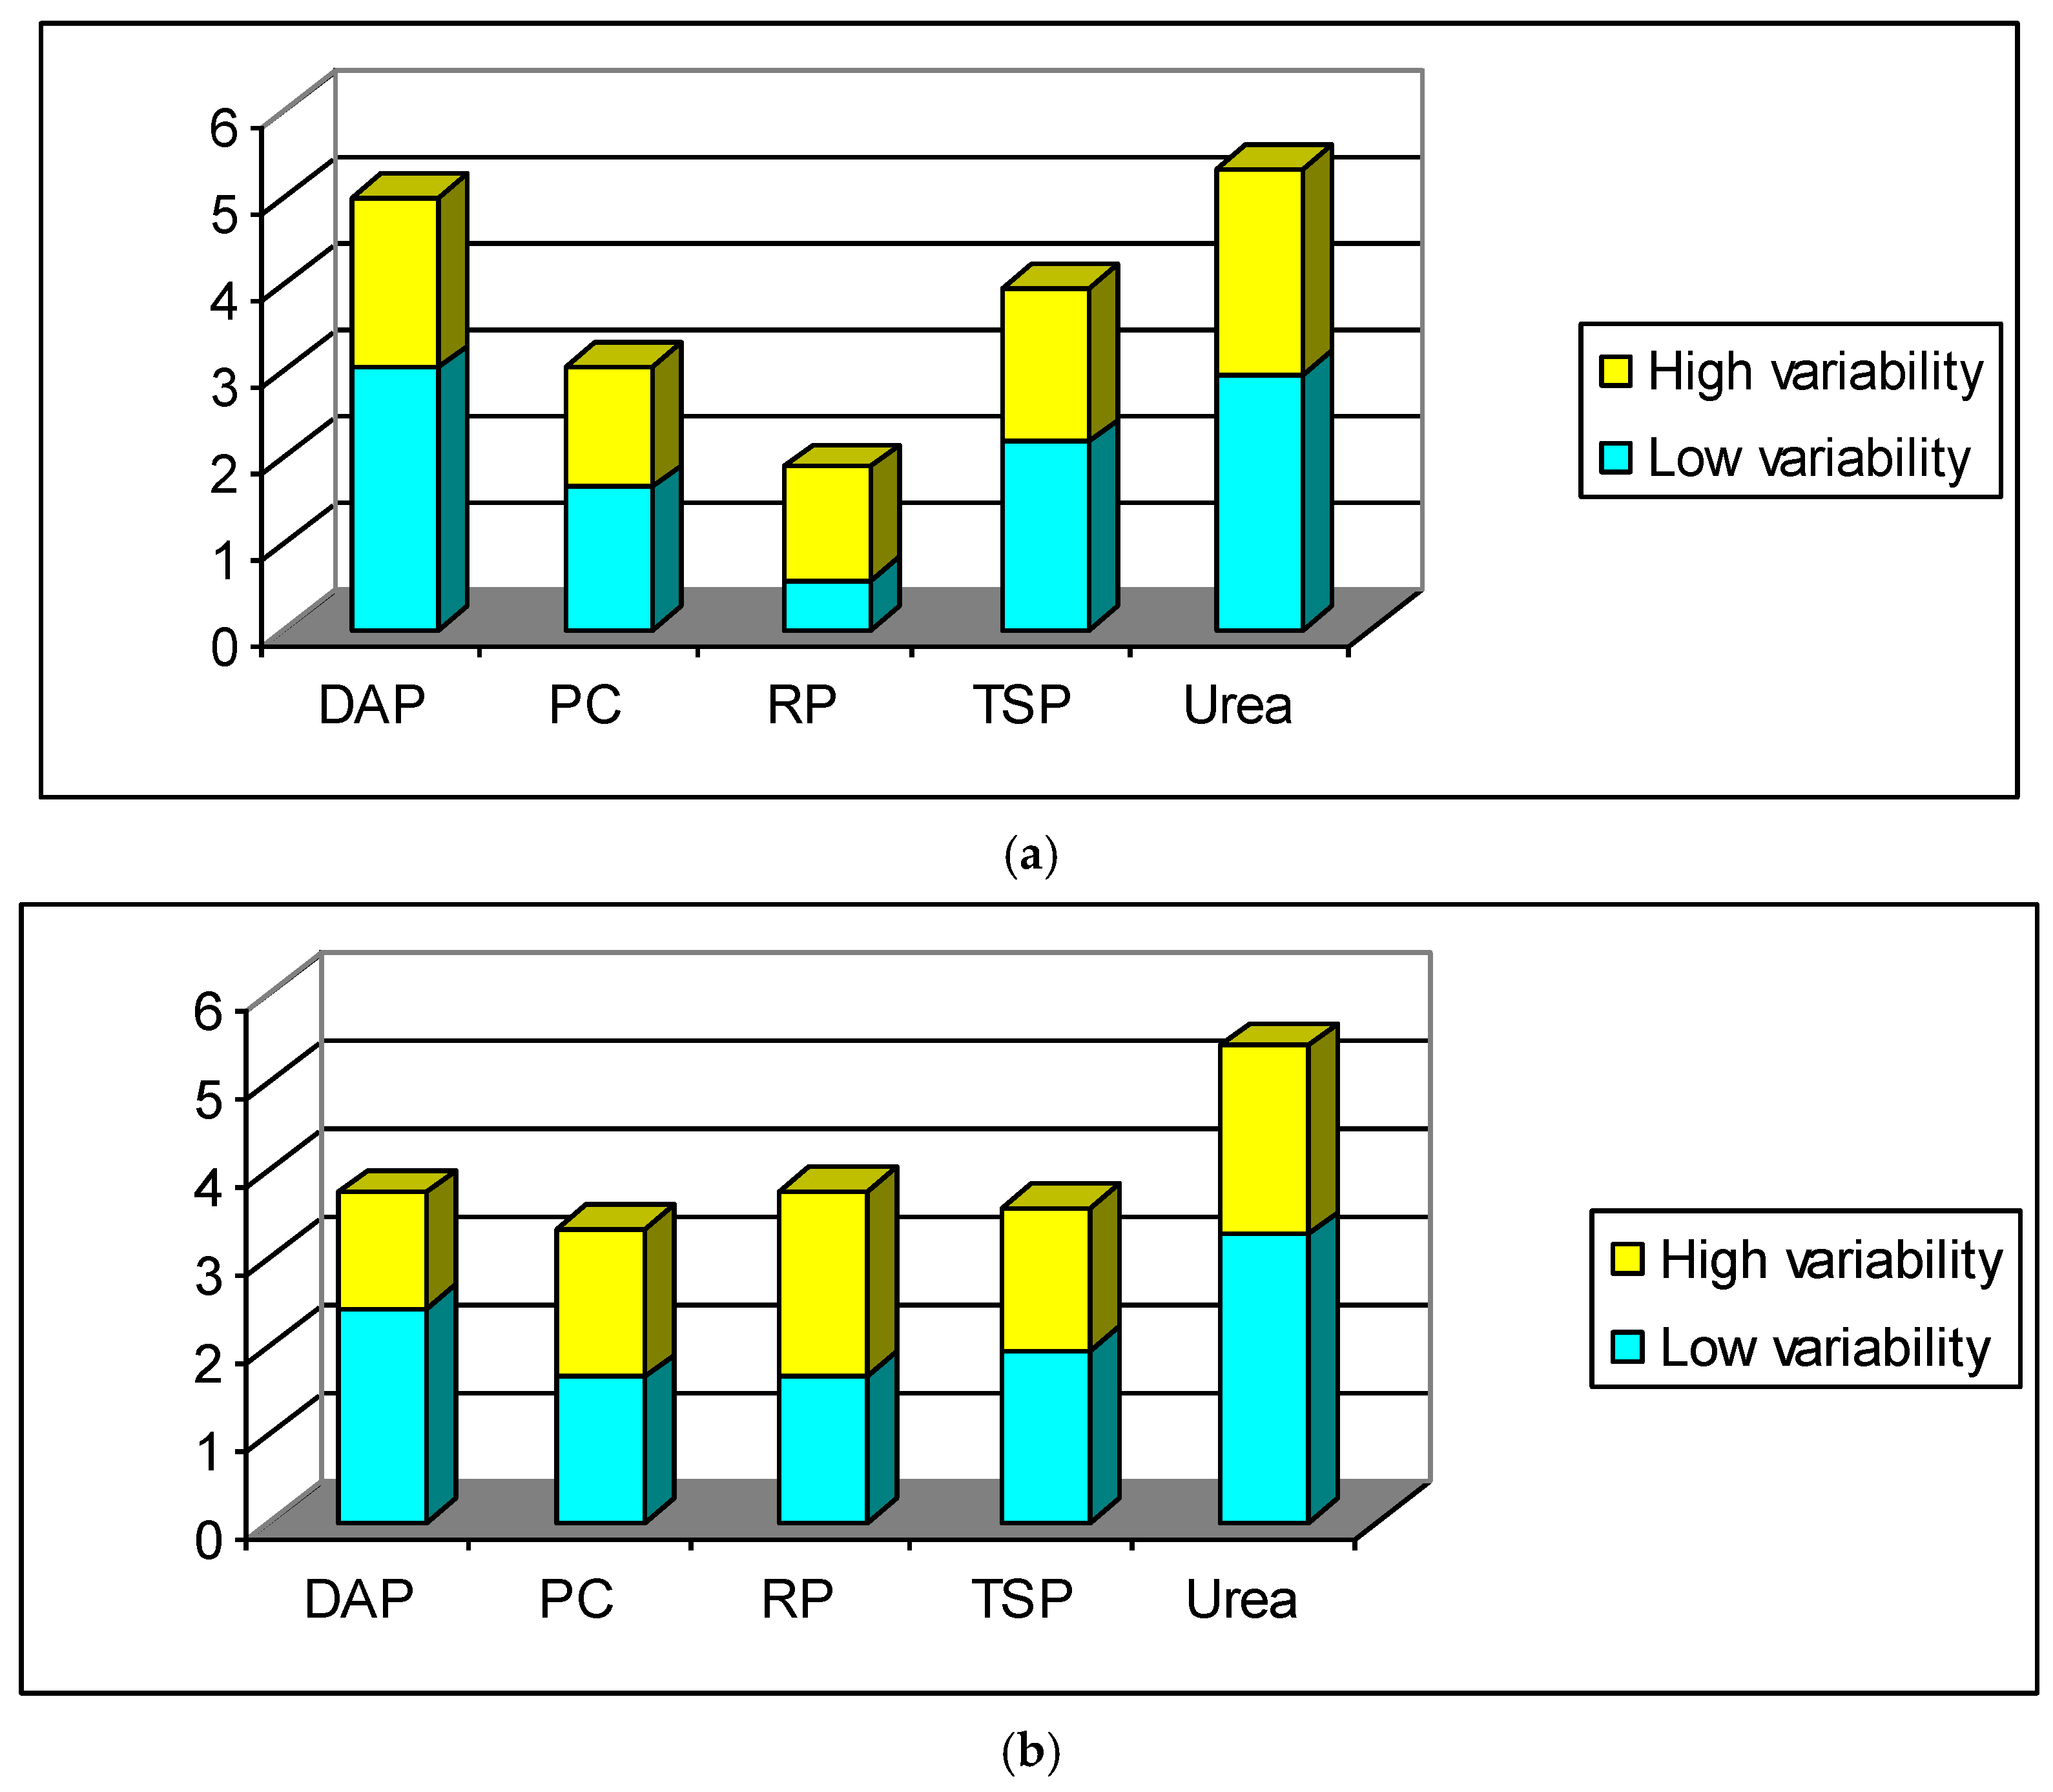
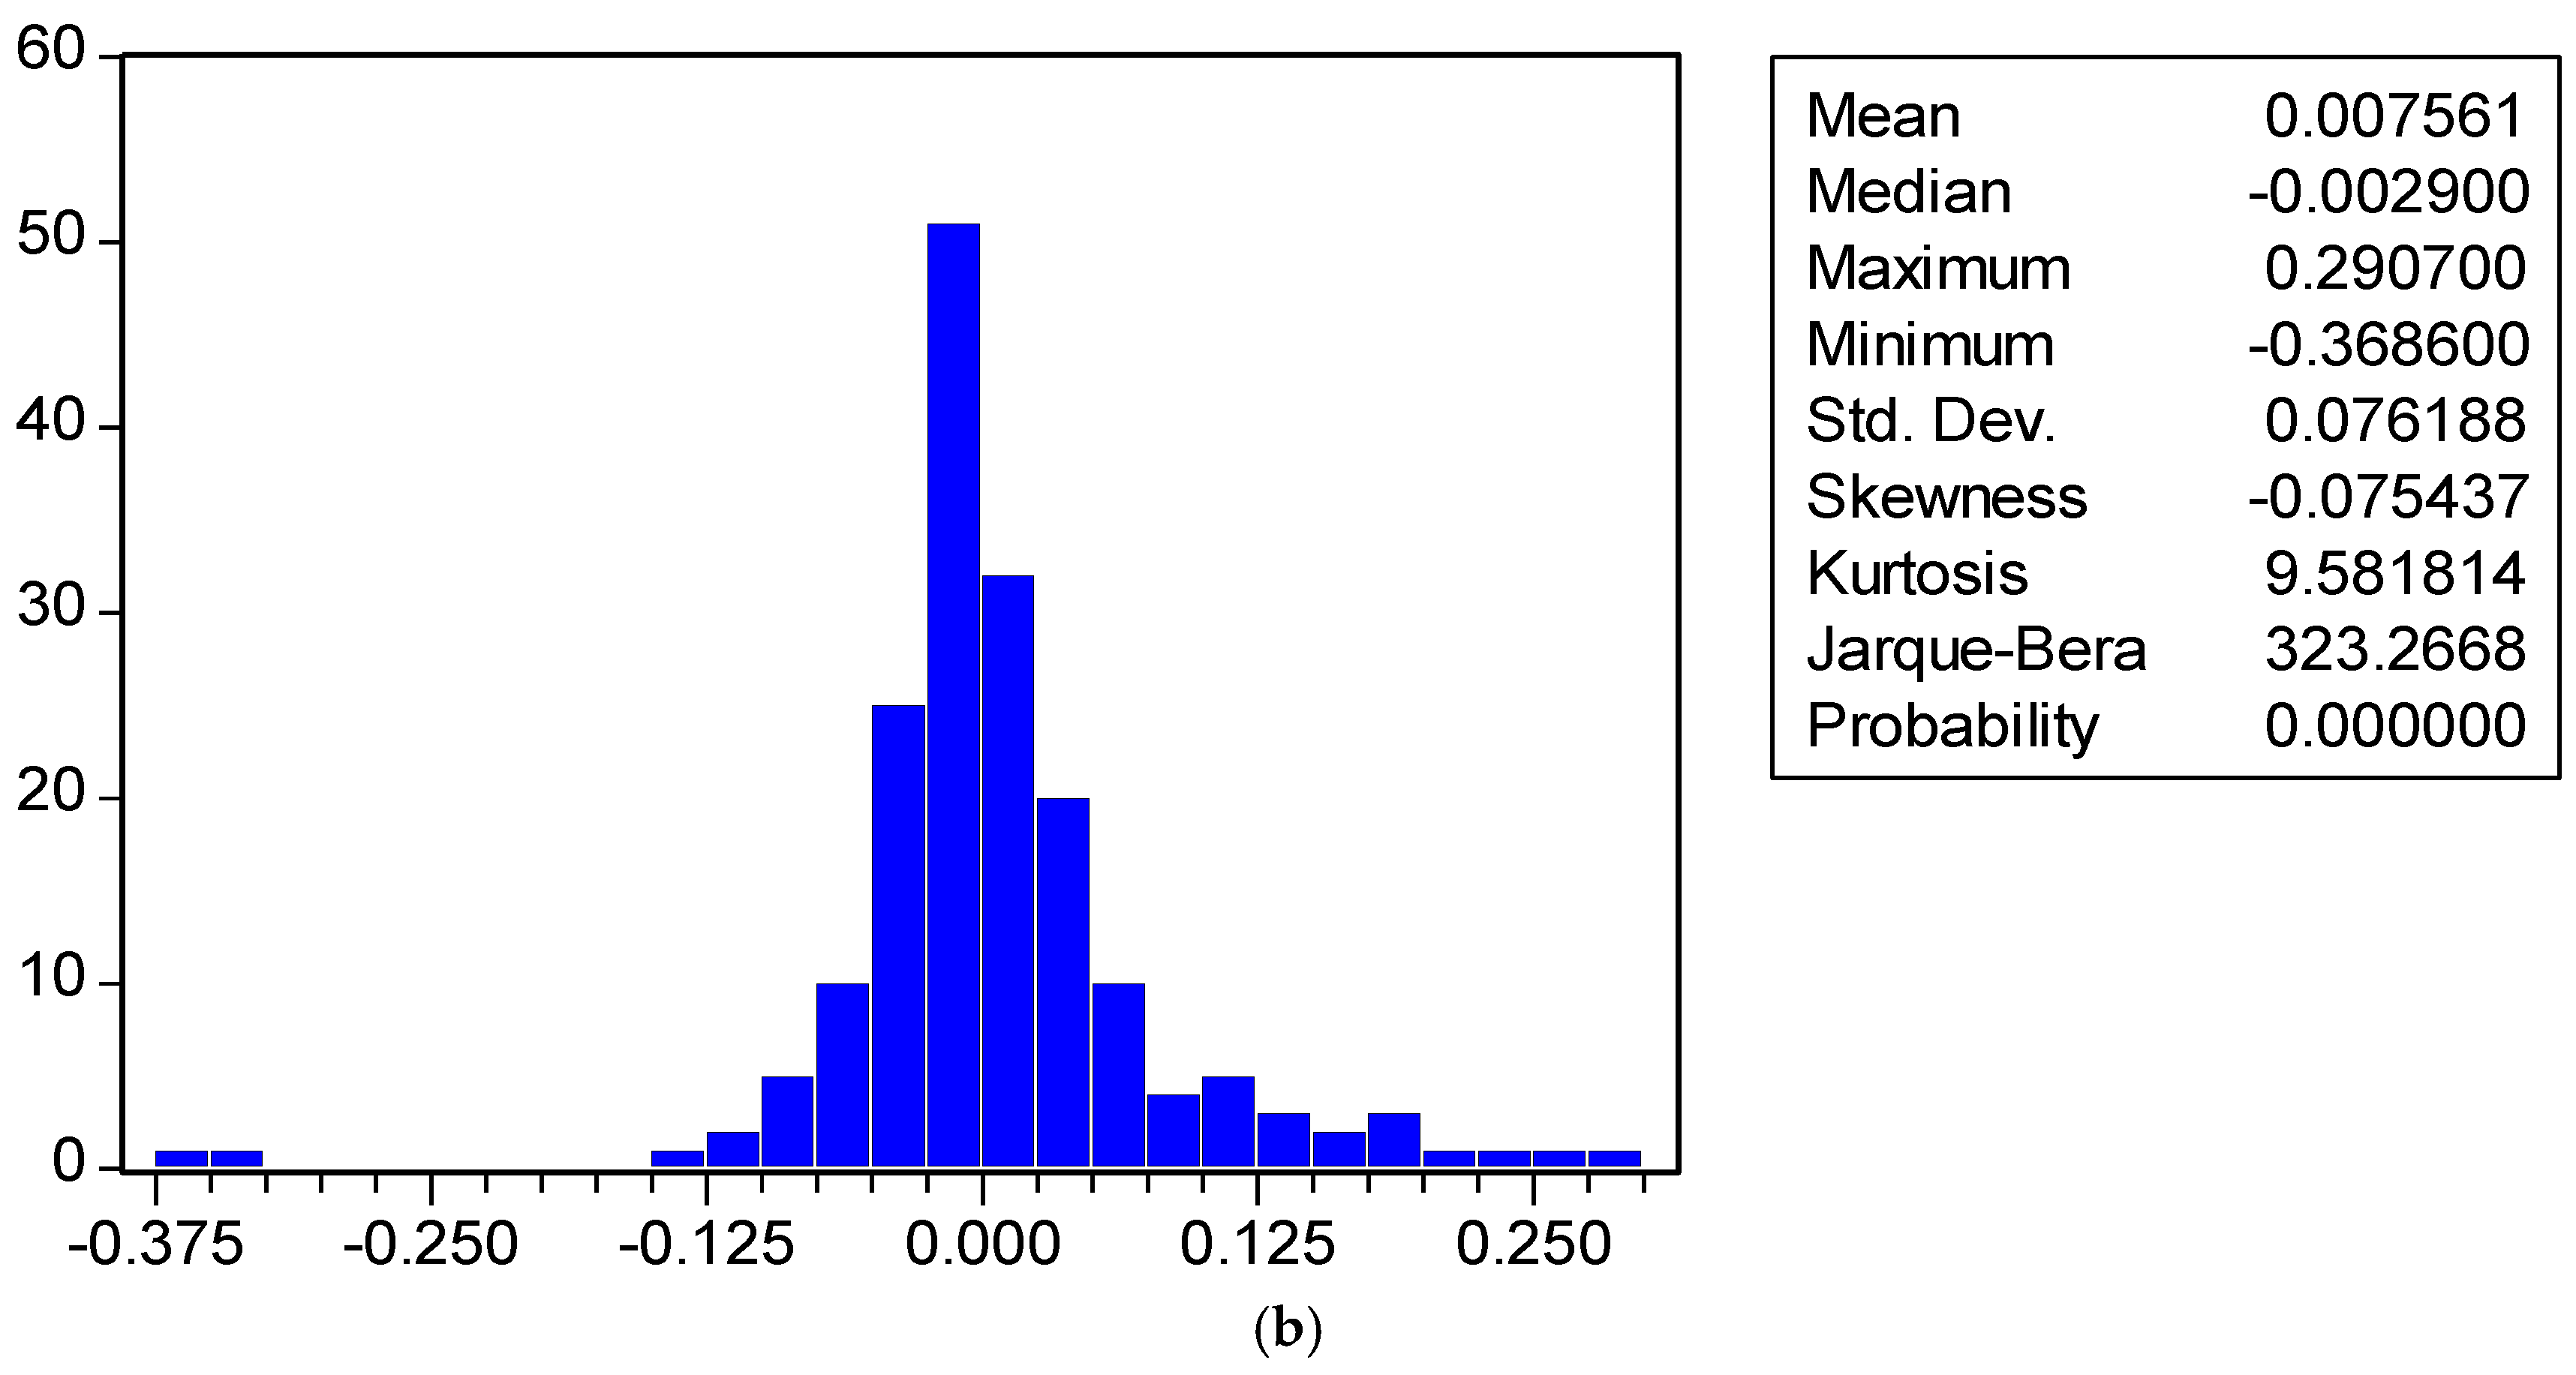
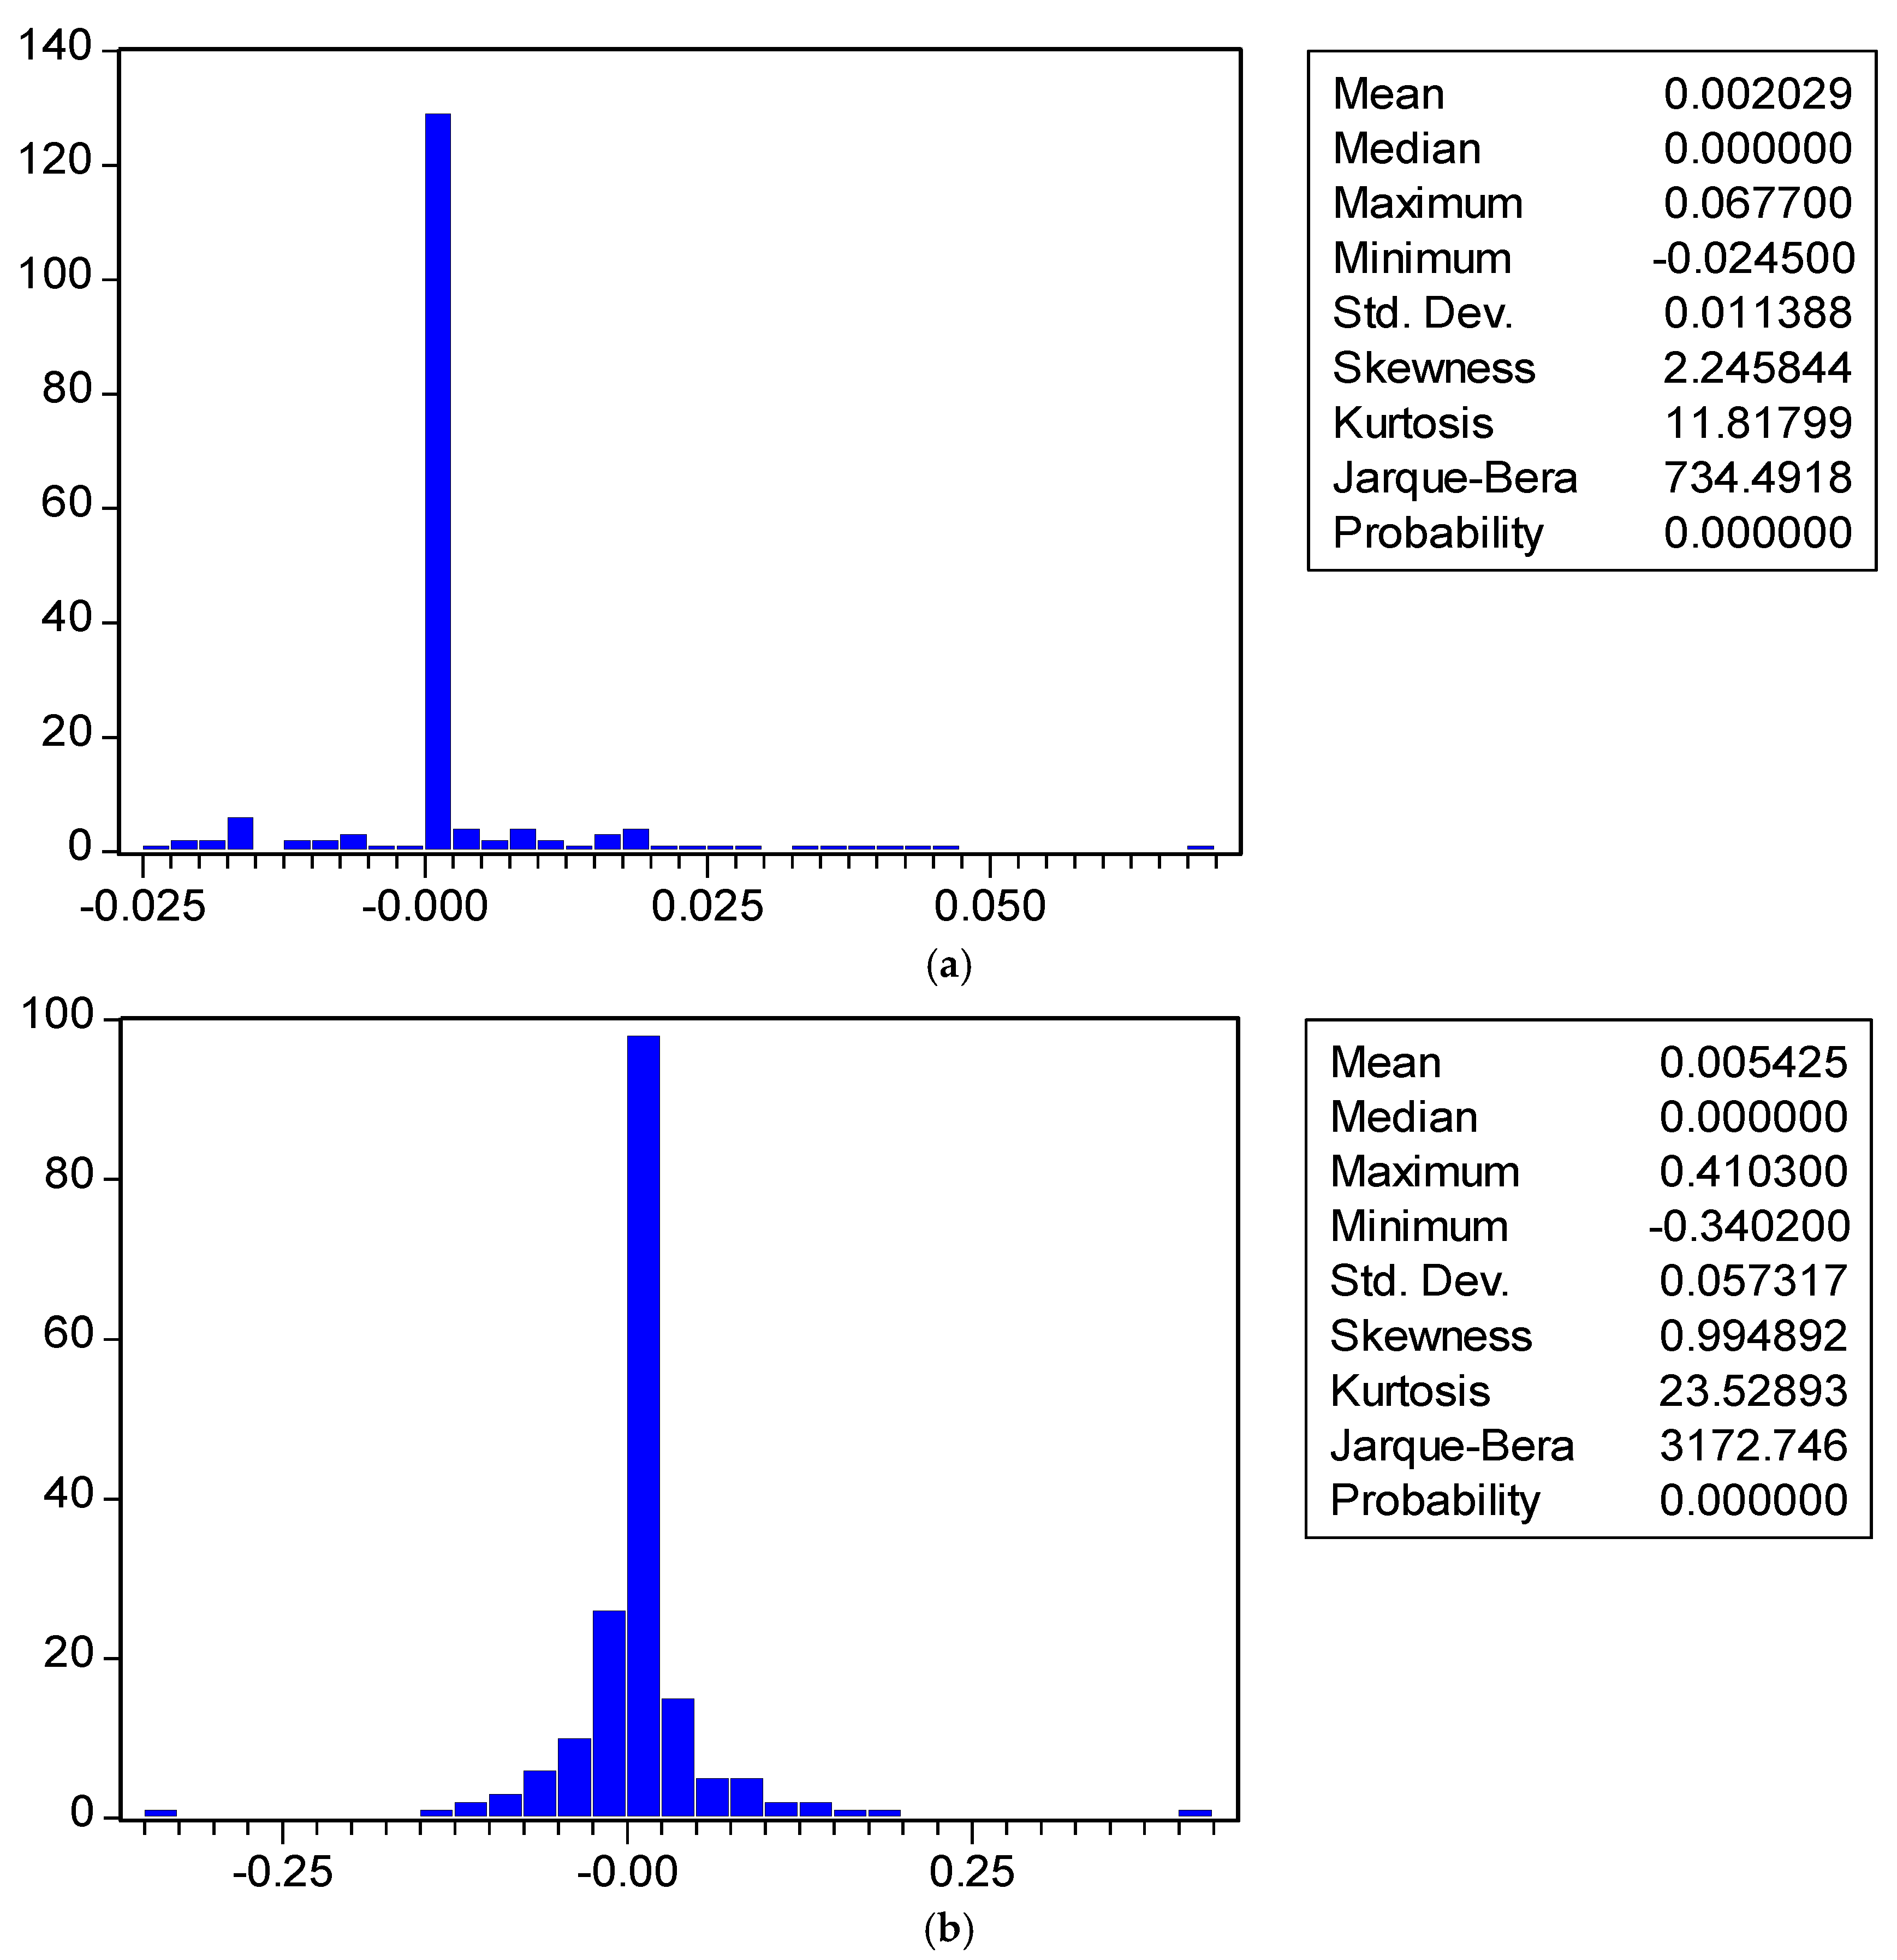
3. Data and Results
4. Discussion and Conclusions
Author Contributions
Funding
Conflicts of Interest
Appendix A


References
- Fernandez, V. Linear and non-linear causality between price indices and commodity prices. Resour. Policy 2014, 41, 40–51. [Google Scholar] [CrossRef]
- Fernandez, V. Influence in commodity markets: Measuring co-movement globally. Resour. Policy 2015, 45, 151–164. [Google Scholar] [CrossRef]
- Giuliodori, D.; Rodriguez, A. Analysis of the stainless steel market in the EU, China and US using co-integration and VECM. Resour. Policy 2015, 44, 12–24. [Google Scholar] [CrossRef]
- Ahmed, K.; Mahalik, M.K.; Shahbaz, M. Dynamics between economic growth, labor, capital and natural resource abundance in Iran: An application of the combined cointegration approach. Resour. Policy 2016, 49, 213–221. [Google Scholar] [CrossRef]
- Jain, A.; Biswal, P.C. Dynamic linkages among oil price, gold price, exchange rate, and stock market in India. Resour. Policy 2016, 49, 179–185. [Google Scholar] [CrossRef]
- Kanjilal, K.; Ghosh, S. Dynamics of crude oil and gold price post 2008 global financial crisis—New evidence from threshold vector error-correction model. Resour. Policy 2017, 52, 358–365. [Google Scholar] [CrossRef]
- Lahmiri, S.; Salah Uddin, G.; Bekiros, S. Clustering of short and long-term co-movements in international financial and commodity markets in wavelet domain. Physica A 2017, 486, 947–955. [Google Scholar] [CrossRef]
- Lahmiri, S.; Salah Uddin, G.; Bekiros, S. Nonlinear dynamics of equity, currency and commodity markets in the aftermath of the global financial crisis. Chaos Solitons Fractals 2017, 103, 342–346. [Google Scholar] [CrossRef]
- Batten, J.A.; Ciner, C.; Lucey, B.M. The macroeconomic determinants of volatility in precious metals markets. Resour. Policy 2010, 35, 65–71. [Google Scholar] [CrossRef]
- Ma, Y. Iron ore spot price volatility and change in forward pricing mechanism. Resour. Policy 2013, 38, 621–627. [Google Scholar] [CrossRef] [Green Version]
- Todorova, N.; Worthington, A.; Souček, M. Realized volatility spillovers in the non-ferrous metal futures market. Resour. Policy 2014, 39, 21–31. [Google Scholar] [CrossRef]
- Gil-Alana, L.A.; Tripathy, T. Modelling volatility persistence and asymmetry: A Study on selected Indian non-ferrous metals markets. Resour. Policy 2014, 41, 31–39. [Google Scholar] [CrossRef]
- Tiwari, A.K.; Sahadudheen, I. Understanding the nexus between oil and gold. Resour. Policy 2015, 46, 85–91. [Google Scholar] [CrossRef]
- Singhal, S.; Ghosh, S. Returns and volatility linkages between international crude oil price, metal and other stock indices in India: Evidence from VAR-DCC-GARCH models. Resour. Policy 2016, 50, 276–288. [Google Scholar] [CrossRef]
- Yaya, O.S.; Tumala, M.M.; Udomboso, C.G. Volatility persistence and returns spillovers between oil and gold prices: Analysis before and after the global financial crisis. Resour. Policy 2016, 49, 273–281. [Google Scholar] [CrossRef]
- Lahmiri, S.; Bekiros, S. Disturbances and complexity in volatility time series. Chaos Solitons Fractals 2017, 105, 38–42. [Google Scholar] [CrossRef]
- Geman, H.; Eleuterio, P.V. Investing in fertilizer-mining companies in times of food scarcity. Resour. Policy 2013, 38, 470–480. [Google Scholar] [CrossRef]
- Lahmiri, S. Cointegration and causal linkages in fertilizer markets across different regimes. Physica A 2017, 471, 181–189. [Google Scholar] [CrossRef]
- Lahmiri, S. Asymmetric and persistent responses in price volatility of fertilizers through stable and unstable periods. Physica A 2017, 466, 405–414. [Google Scholar] [CrossRef]
- Shannon, C.E. A mathematical theory of communication. Bell Syst. Tech. J. 1948, 27, 379–423. [Google Scholar] [CrossRef]
- Li, S.; He, J.; Song, K. Network entropies of the Chinese financial market. Entropy 2016, 18, 331. [Google Scholar] [CrossRef]
- Gençay, R.; Gradojevic, N. The Tale of two financial crises: An entropic perspective. Entropy 2017, 19, 244. [Google Scholar] [CrossRef]
- Parker, E. The entropic linkage between equity and bond market dynamics. Entropy 2017, 19, 292. [Google Scholar] [CrossRef]
- Yang, J.; Feng, Y.; Qiu, W. Stock selection for portfolios using expected utility—Entropy decision model. Entropy 2017, 19, 508. [Google Scholar] [CrossRef]
- Billio, M.; Casarin, R.; Costola, M.; Pasqualini, A. An entropy-based early warning indicator for systemic risk. J. Int. Financ. Mark. Inst. Money 2016, 45, 42–59. [Google Scholar] [CrossRef]
- Maasoumi, E.; Racine, J. Entropy and predictability of stock market returns. J. Econ. 2002, 107, 291–312. [Google Scholar] [CrossRef] [Green Version]
- Pele, D.T.; Lazar, E.; Dufour, A. Information entropy and measures of market risk. Entropy 2017, 19, 226. [Google Scholar] [CrossRef]
- Nelson, D. Conditional heteroskedasticity in asset returns: A new approach. Econometrica 1991, 59, 347–370. [Google Scholar] [CrossRef]
- Glosten, L.R.; Jagannathan, R.; Runkle, D.E. On the relation between the expected value and the volatility of the nominal excess return on stocks. J. Financ. 1993, 48, 1779–1801. [Google Scholar] [CrossRef]
- Huang, P.; Hueng, C.J. Conditional risk-return relationship in a time-varying beta model. Quant. Financ. 2008, 8, 381–390. [Google Scholar] [CrossRef]
- Park, B.-J. Risk-return relationship in equity markets: Using a robust GMM estimator for GARCH-M models. Quant. Financ. 2009, 9, 93–104. [Google Scholar] [CrossRef]
- Nam, K.; Krausz, J.; Arize, A.C. Revisiting the intertemporal risk–return relation: Asymmetrical effect of unexpected volatility shocks. Quant. Financ. 2014, 14, 2193–2203. [Google Scholar] [CrossRef]
- Levy, H. Risk-return analysis: The theory and practice of rational investing. Quant. Financ. 2014, 14, 1141–1144. [Google Scholar] [CrossRef]
- Merton, R.C. On estimating the expected return on the market. J. Financ. Econ. 1980, 8, 323–361. [Google Scholar] [CrossRef]


| First Subsample | Second Subsample | Full Sample | ||||
|---|---|---|---|---|---|---|
| Value | p-Value | Value | p-Value | Value | p-Value | |
| DAP | ||||||
| μ | −0.0192 | 0.0181 | −0.0093 | 0.1551 | −0.0154 | 0.0053 |
| φ | 0.0677 | 0.6333 | 0.1744 | 0.1231 | 0.1299 | 0.1767 |
| θ | 0.4465 | 0.0005 | 0.5317 | 0.0000 | 0.4878 | 0.0000 |
| λ | 0.5535 | 0.0358 | 0.1255 | 0.4908 | 0.3810 | 0.0268 |
| ω | −0.8732 | 0.0308 | −2.8214 | 0.0004 | −2.3303 | 0.0000 |
| β | 0.3266 | 0.0166 | 1.2059 | 0.0062 | 0.7685 | 0.0000 |
| α | −0.1515 | 0.0945 | −0.2859 | 0.2613 | −0.2278 | 0.0403 |
| γ | 0.9065 | 0.0000 | 0.6302 | 0.0000 | 0.7108 | 0.0000 |
| PC | ||||||
| μ | −0.0548 | 0.1687 | −0.0000 | 0.9306 | −0.0001 | 0.4559 |
| φ | −0.3773 | 0.0269 | 0.3126 | 0.0100 | 0.0967 | 0.3474 |
| θ | 0.3276 | 0.2095 | 0.0482 | 0.7314 | 0.1556 | 0.1486 |
| λ | 4.6759 | 0.7115 | 0.0006 | 0.6758 | 0.0059 | 0.2427 |
| ω | −8.8725 | 0.1619 | −1.018 | 0.0383 | −1.7725 | 0.0000 |
| β | 0.0761 | 0.7165 | 54.3856 | 0.3001 | 7.7506 | 0.0142 |
| α | 0.1038 | 0.7323 | 5.3444 | 0.4850 | 1.4158 | 0.0357 |
| γ | 0.0019 | 0.9711 | 0.7502 | 0.0000 | 0.7900 | 0.0000 |
| RP | ||||||
| μ | 0.0000 | 0.0459 | 0.0002 | 0.0012 | −0.0471 | 0.4581 |
| φ | 0.0228 | 0.9555 | 0.1040 | 1.1779 | 0.2118 | 0.2182 |
| θ | −0.0231 | 0.9551 | −0.1045 | 1.1772 | −0.2269 | 0.1501 |
| λ | −5.6948 | 0.8151 | −0.0036 | 0.8610 | 1.2088 | 0.3167 |
| ω | −9.2508 | 0.0412 | −6.0945 | 11.4906 | −6.1920 | 0.1945 |
| β | −0.0381 | 0.6276 | 2.8587 | 12.1593 | −0.0025 | 0.4743 |
| α | −0.0870 | 0.6266 | −0.6703 | 2.8912 | 0.0302 | 0.6075 |
| γ | 0.2551 | 0.0766 | −0.3521 | 0.0579 | 0.0496 | 0.7294 |
| TSP | ||||||
| μ | −0.0492 | 0.5103 | 0.0000 | 0.9399 | 0.0000 | 0.9615 |
| φ | 0.5792 | 0.0041 | 0.1617 | 0.3055 | 0.4073 | 0.0018 |
| θ | −0.4437 | 0.0849 | 0.1608 | 0.3358 | −0.1629 | 0.2672 |
| λ | 0.0434 | 0.8788 | −0.0039 | 0.8766 | 0.0088 | 0.6918 |
| ω | −0.4106 | 0.9822 | −0.0669 | 0.0770 | −0.7030 | 0.0000 |
| β | 3.1484 | 0.8826 | 0.5660 | 0.0020 | 1.3692 | 0.0696 |
| α | 0.5642 | 0.9104 | 0.0276 | 0.5786 | 0.0814 | 0.5674 |
| γ | −0.3110 | 0.4728 | 1.0390 | 0.0000 | 0.9298 | 0.0000 |
| Urea | ||||||
| μ | −0.0289 | 0.1558 | 0.0103 | 0.5857 | −0.0203 | 0.1546 |
| φ | 0.2314 | 0.3104 | 0.1280 | 0.5614 | 0.1613 | 0.2675 |
| θ | 0.1229 | 0.5871 | 0.3337 | 0.1066 | 0.2554 | 0.0637 |
| λ | 0.4986 | 0.1288 | 0.0361 | 0.9026 | 0.3950 | 0.0768 |
| ω | −0.7959 | 0.0822 | −0.4697 | 0.0773 | −0.7401 | 0.0053 |
| β | 0.3482 | 0.0119 | 0.1750 | 0.1000 | 0.3628 | 0.0008 |
| α | 0.0973 | 0.2649 | 0.1944 | 0.0390 | 0.0998 | 0.1472 |
| γ | 0.9026 | 0.0000 | 0.9346 | 0.0000 | 0.9123 | 0.0000 |
© 2018 by the authors. Licensee MDPI, Basel, Switzerland. This article is an open access article distributed under the terms and conditions of the Creative Commons Attribution (CC BY) license (http://creativecommons.org/licenses/by/4.0/).
Share and Cite
Lahmiri, S.; Bekiros, S. The Informational Dynamics of Mean‒Variance Relationships in Fertilizer Markets: An Entropic Investigation. Entropy 2018, 20, 677. https://doi.org/10.3390/e20090677
Lahmiri S, Bekiros S. The Informational Dynamics of Mean‒Variance Relationships in Fertilizer Markets: An Entropic Investigation. Entropy. 2018; 20(9):677. https://doi.org/10.3390/e20090677
Chicago/Turabian StyleLahmiri, Salim, and Stelios Bekiros. 2018. "The Informational Dynamics of Mean‒Variance Relationships in Fertilizer Markets: An Entropic Investigation" Entropy 20, no. 9: 677. https://doi.org/10.3390/e20090677