Article

Surface Thermodynamics, Viscosity, Activation Energy of N-Methyldiethanolamine Aqueous Solutions Promoted by Tetramethylammonium Arginate

1
School of Environmental Science and Engineering, North China Electric Power University, Baoding 071003, China
2
Hebei Key Lab of Power Plant Flue Gas Multi-Pollutants Control, Department of Environmental Science and Engineering, North China Electric Power University, Baoding 071003, China
*
Author to whom correspondence should be addressed.
Entropy 2020, 22(12), 1337; https://doi.org/10.3390/e22121337
Submission received: 27 October 2020 / Revised: 17 November 2020 / Accepted: 24 November 2020 / Published: 25 November 2020

Abstract

:
The surface tension and viscosity values of N-methyldiethanolamine (MDEA) aqueous solutions promoted by tetramethylammonium arginate ([N1111][Arg]) were measured and modeled. The experimental temperatures were 303.2 to 323.2 K. The mass fractions of MDEA (wMDEA) and [N1111][Arg] (w[N1111][Arg]) were 0.300 to 0.500 and 0.025 to 0.075, respectively. The measured surface tension and viscosity values were satisfactorily fitted to thermodynamic models. With the aid of experimentally viscosity data, the activation energy (Ea) and H2S diffusion coefficient (DH2S) of MDEA-[N1111][Arg] aqueous solution were deduced. The surface entropy and surface enthalpy of the solutions were calculated using the fitted model of the surface tension. The quantitative relationship between the calculated values (surface tension, surface entropy, surface enthalpy, viscosity, activation energy, and H2S diffusion coefficient) and the operation conditions (mass fraction and temperature) was demonstrated.

1. Introduction

China is a large coke producer, and coke oven gas (COG) is the second most abundant coking product after coke in the coking industry, with generation of 300–360 m3 of COG as a by-product for every 1 t of coke produced [1]. The main components of COG are hydrogen and methane, which have high calorific values and application value. COG can be used as an urban or industrial fuel gas, in gas-fired power stations to generate electricity, or as a raw material to synthesize ammonia, methanol, and other chemicals [2]. However, COG contains impurities that must be removed before use, such as hydrogen sulfide (H2S). As an odorous, toxic, and corrosive gas, H2S can cause severe corrosion of equipment and transportation pipelines, and its combustion products, SO2, can also cause environmental problems, such as acid rain [3]. Therefore, COG must be desulfurized to improve the gas quality and protect the environment.
Chemical absorption using alkanolamines as absorbents is a mature desulfurization method [4,5]. The alkanolamine method has the distinguishing feature of large absorption capacity, high removal efficiency, and good stability and reliability. The most widely used alkanolamine is monoethanolamine (MEA), which can remove more than 98% of H2S from COG [6]. However, the MEA method has certain disadvantages. For example, because of its corrosiveness, the MEA content is generally not allowed to exceed 30% in a solution, its regeneration process is highly energy-consuming, and it is volatile and prone to degradation, which results in large consumption during operation [7]. N-methyldiethanolamine (MDEA), a tertiary alkanolamine, is significantly less corrosive than MEA, exhibits strong resistance to degradation and oxidation, has low reaction heat, and its concentration in the solution can be high, which reduces the energy consumption of the solvent regeneration process. Studies have shown that MDEA has excellent selectivity and efficiency for the removal of H2S [8,9].
In addition to containing a single alkanolamine, an absorbent solution often contains two or three alkanolamines to combine the advantages of each while avoiding their drawbacks. Many studies have shown that a mixed alkanolamine solution has better desulfurization performance than a single alkanolamine solution [9,10,11]. Our previous study indicated that adding small quantities of MEA to MDEA aqueous solutions can obviously improve the H2S absorption capacity and absorption rate [12].
Ionic liquids (ILs) are considered a green solvent with many excellent properties and are attracting increased attention in the field of acid gas absorption [13,14,15,16,17,18,19,20,21]. However, ILs are highly viscous and their current prices are relatively high, which hinders their use as a pure solvent in large-scale commercial applications. Therefore, it is desirable to use ILs jointly with alkanolamines. Amino acid ionic liquids (AAILs), which are synthesized from amino acids, have advantages over ILs. Furthermore, they can be synthesized from widely available raw materials and, thus, their costs are much lower. As a result, they are often used in H2S removal studies [22,23,24]. In our previous studies, we used MDEA aqueous solutions promoted by two ILs, namely tetramethylammonium glycinate ([N1111][Gly]) and tetramethylammonium arginate ([N1111][Arg]), to explore the performances of such mixed solutions for absorbing H2S. The results showed that the two AAILs were superior to MEA in promoting the absorption of H2S by MDEA solution. Moreover, of these two promoters, the MDEA aqueous solutions promoted by [N1111][Arg] exhibited the highest absorption capacity and absorption rate for low-concentration H2S. Therefore, [N1111][Arg]-promoted MDEA aqueous solutions show commercial potential [12,25].
Viscosity and surface tension are the two main physical parameters of a solution, and significantly affect the mass transfer, heat transfer, and gas–liquid flow process [26,27,28,29]. They play a vital role in process simulations and the development of desulfurization equipment. Zuiderweg [30] reported that the surface tension has a greater effect on mass transfer processes than other physical properties, such as the density, viscosity, and diffusion coefficient. The smaller the surface tension, the smaller the mean diameter of the bubbles, which increases the interfacial mass transfer area [31]. If the desulfurization equipment is a tray column, the surface tension impacts the bubble size by affecting the bubble stability, which has an effect on the mass transfer area. A high solution viscosity promotes bubble accumulation, which leads to a decrease in the mass transfer efficiency [32]. Therefore, the determination of these thermodynamic properties is vital for practical applications of a solution. To date, no studies have been conducted on the measurement of the viscosity and surface tension values of MDEA-[N1111][Arg] solutions, or to investigate the effects of the temperature and solution concentration on the viscosity and surface tension.
To fill this knowledge gap, the viscosity and surface tension values of MDEA-[N1111][Arg] solutions under different mass fractions and temperatures were measured and modeled in this study. Based on the experimental data and calculation, the surface entropy (SS), surface enthalpy (HS), viscosity activation energy (Ea), and H2S diffusion coefficient (DH2S) were obtained, and the effects of the temperature and solute mass fraction on these results were analyzed. To this end, the mass fractions of MDEA (wMDEA) and [N1111][Arg] (w[N1111][Arg]) in the solutions were changed from 0.300 to 0.500 and from 0.025 to 0.075, respectively, and the solution temperature was changed from 303.2 to 323.2 K.

2. Experimental

2.1. Reagents

The reagents used in the experiments are shown in Table 1. Each component in the absorbent was accurately weighed using an analytical balance (FA1604A, uncertainty = ±0.1 mg) based on the required mass percentages, and the components were well mixed.

2.2. Instrumentation and Process

Surface tension was determined by the BZY-1 surface tension meter (which employs the Wilhemy plate method, uncertainty = ±0.1 mN·m−1). The viscosity was determined by the NDJ-5S digital viscometer (uncertainty = ±0.1 mPa·s). The operational procedures and the reliability of the instruments were documented in our previous studies and are not repeated here [33,34,35].

3. Results and Discussion

3.1. Surface Tension and Model

Table 2 presents the surface tension values of the aqueous MDEA-[N1111][Arg] solutions at different mass fractions and temperatures. In addition to obtaining data experimentally, it is also important to develop an accurate model to fit and predict the surface tension values. The surface tension of a mixed solution depends on the composition and temperature of the solution. The model used in a previous study was adopted here because of its simplicity and prediction accuracy [36]:
γ a q   =   0   +   γ
where γ0 and γ′ can be expressed as follows:
γ 0 = x 1 γ 1 + x 2 γ 2 + x 3 γ 3
γ = x 1 x 2 G 12 + x 1 x 3 G 13 + x 2 x 3 G 23
where the subscripts 1, 2, and 3 in the formulas represent MDEA, [N1111][Arg], and water, respectively; xi represents the mole fraction of component i; and γi represents the surface tension of pure component i, which is linear with temperature. Gij represents the mutual influence between components i and j. To adapt to the new solution system in this study, the calculation equation is obtained by modifying the equation used in the previous research [36]:
G 13 = ( a 13 + b 13 w MDEA ) T
G 23 = ( a 23 + b 23 w [ N 1111 ] [ Arg ] ) T
G 12 = ( a 12 + b 12 [ ( w MDEA + w [ N 1111 ] [ Arg ] ) / 2 ] ) T
By combining Equations (1)–(6), the surface tension can be formulated as:
γ a q = γ 0 + γ = x 1 γ 1 + x 2 γ 2 + x 3 γ 3 + x 1 x 2 G 12 + x 1 x 3 G 13 + x 2 x 3 G 23 = x 1 ( a 1 T + b 1 ) + x 2 ( a 2 T + b 2 ) + x 3 ( a 3 T + b 3 ) + x 1 x 2 ( a 12 + b 12 [ ( w MDEA + w [ N 1111 ] [ Arg ] ) / 2 ] ) T + x 1 x 3 ( a 13 + b 13 w MDEA ) T + x 2 x 3 ( a 23 + b 23 w [ N 1111 ] [ Arg ] ) T
where γ i = ( a i T + b i ) represents the surface tension of pure component i, which varies linearly with temperature.
For a ternary solution, six adjustable model parameters should be optimized using experimental data so that the established thermodynamic model can provide accurate predictions. In the process of optimizing parameters, the average relative deviation (ARD) can be defined as follows:
ARD = 1 n i = 1 n [ 1 γ c a l / γ e x p ] · 100 %
The superscripts cal and exp represent the experimental and calculated results, respectively, and n is the number of experimental data. The optimized parameters were determined to be the following: a13 = −1.31, b13 = 1.59, a23 = −1.73, b23 = −0.866, a12 = 8.72, b12 = 11.5, and ARD = 1.23%. The small ARD value indicates that the predicted results fit well with the experimental results.
Figure 1 presents the changes in the surface tension of MDEA-[N1111][Arg] aqueous solutions with changes in the w[N1111][Arg] and temperature. The surface tension gradually decreased as the temperature increased. This phenomenon may be because the molecular motion intensified as the temperature increased, which increased the kinetic energy and decreased the intermolecular cohesion, thereby reducing the surface tension [37]. In addition, as the w[N1111][Arg] and wMDEA increased, the surface tension showed a gradual decrease. This might be caused by the presence of alkyl groups in the solvent component, which makes them easier to distribute at the gas–liquid interface.
Moreover, the established model parameters can be used to calculate other surface thermodynamic properties of the solution, such as the surface entropy (SS) and surface enthalpy (HS) [35,38]:
S s = ( γ aq T ) x ,   P
H s = γ T ( γ aq T ) x ,   P
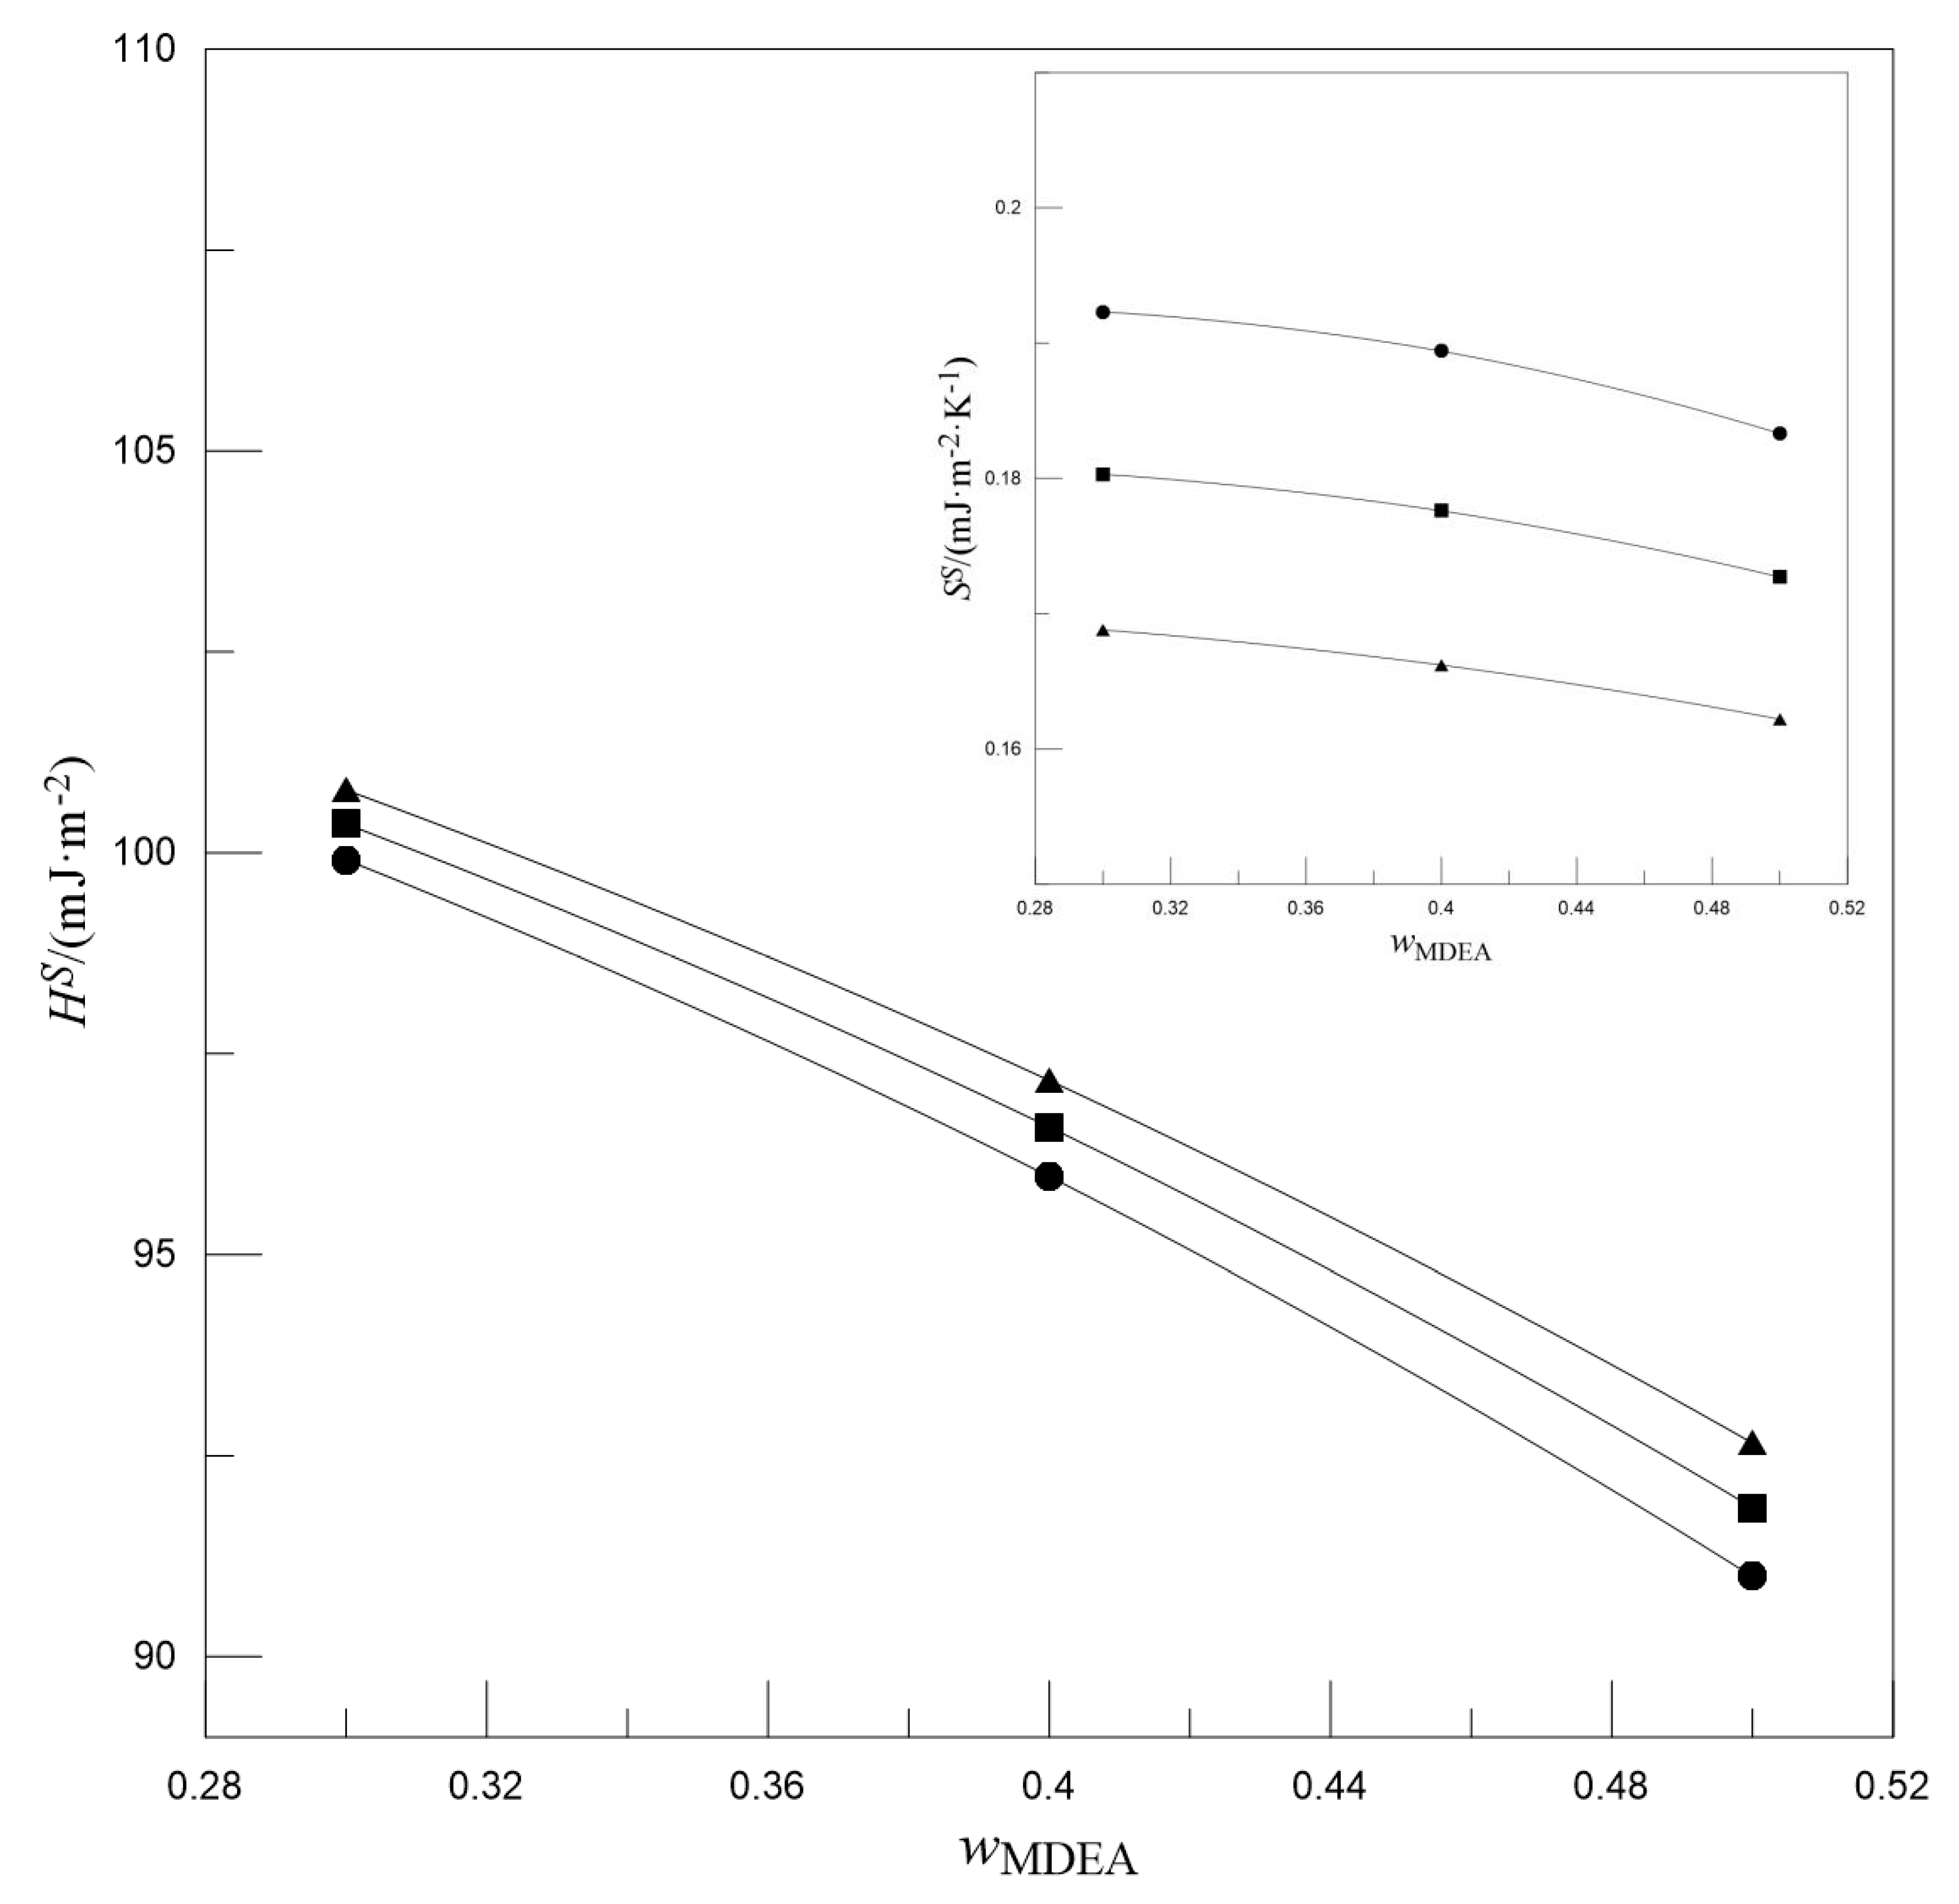
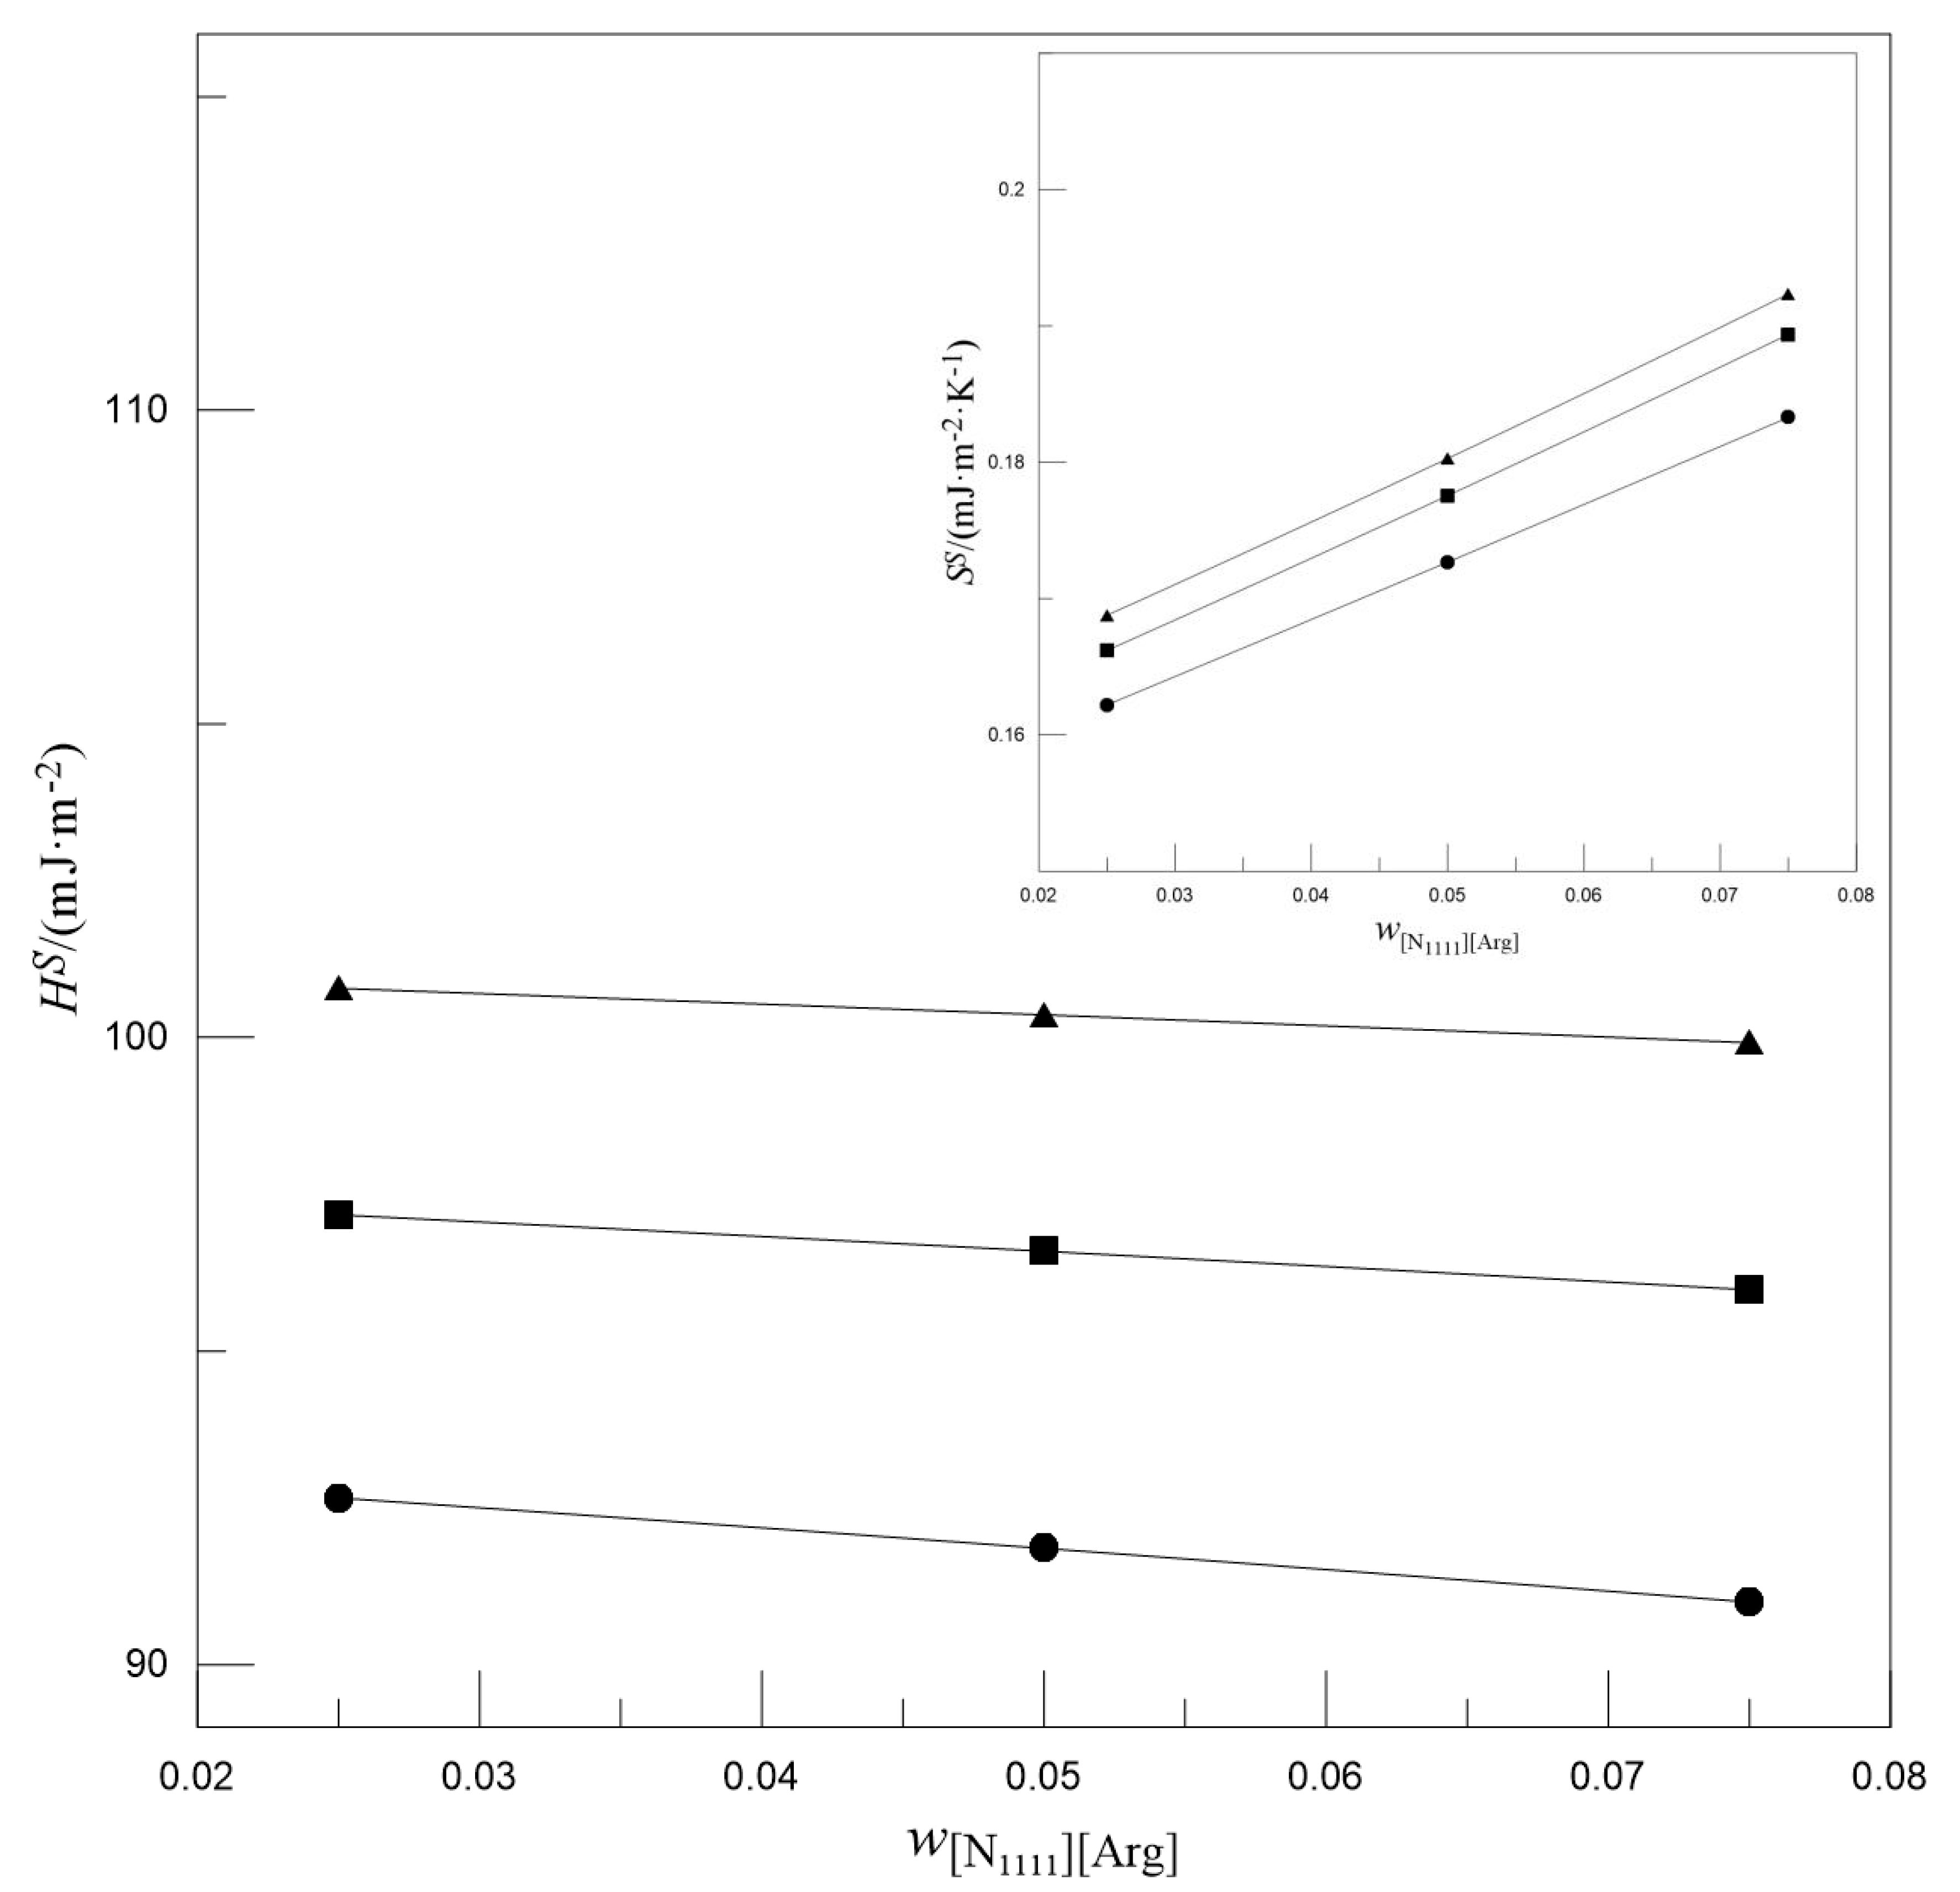
Gliński et al. [39] and Maham et al. [40] fit the surface tension values of alkanolamine solutions to a linear function of temperature, γaq = K1 + K2T. Therefore, for a given mass fraction of alkanolamine, the SS and HS values of the solution are −K2 and K1, respectively. However, in this study, the absorption solution is a ternary mixture and may not be appropriate using the above equation. Given that Equation (7) can be used to fit the surface tension, it can be used in conjunction with Equations (9) and (10) to further calculate the SS and HS values of the solution; the results are shown in Figure 2 and Figure 3.
Figure 2 shows the effect of wMDEA on the SS and HS. For a given w[N1111][Arg], the SS and HS values of the solutions both decrease with the increase in wMDEA. Figure 3 presents the effect of w[N1111][Arg] on the SS and HS. For a given wMDEA, the HS values of the solutions decrease slightly with the increase in w[N1111][Arg], whereas the SS values increase with the increase in w[N1111][Arg]. The decrease in HS indicates that less energy is required when the surface area increases. The increase in SS after adding [N1111][Arg] may be because its molecules are more likely to be distributed on the surface; after the molecules migrate to the surface, the intermolecular forces decrease, which leads to the decrease in the order degree of molecular arrangement.

3.2. Viscosity and the Model

The viscosity data of MDEA-[N1111][Arg] solutions were measured and results are shown in Table 3. Measuring all viscosity data is a highly expensive, time-consuming, and difficult process. An alternative means is to use an equation that can correlate the viscosities correctly. Numerous different equations have been proposed to correlate and predict the viscosity data of solutions [41,42,43,44]. Of these, the Weiland equation [44], which is a semi-empirical equation, can describe the dependence of solute composition and temperature on viscosity simultaneously. Thus, it is used for the correlation of viscosity data in this study [33,45]. For MDEA-[N1111][Arg] aqueous solutions, it can be expressed as:
η m i x = w M D E A w M D E A + w [ N 1111 ] [ Arg ] η 1 + w [ N 1111 ] [ Arg ] w M D E A + w [ N 1111 ] [ Arg ] η 2
where ηmix represents the viscosity of MDEA-[N1111][Arg] solution, and η1 and η2 are expressed as:
η i = η w a t e r × exp { [ ( a i w + b i ) T + ( c i w + d i ) ] w T 2 }
where ηwater represents the viscosity of pure water, w = wMDEA + w[N1111][Arg], ai, bi, ci, di are adjustable parameters. In this work, the parameters for MDEA were calculated by fitting to the viscosity data of MDEA aqueous solutions: (a1 = −0.1863, b1 = 0.3844, c1 = 879.8408, d1 = 2889.61). The parameters for [N1111][Arg] (a2, b2, c2 and d2) can also be calculated from a [N1111][Arg]-water system. However, when the model parameters of both MDEA and [N1111][Arg] are given, there are no adjustable parameters in the Weiland equation and the deviation between experiments and calculations will be significant. Thus, in this work the model parameters of [N1111][Arg] were regressed by fitting to the experiments of MDEA-[N1111][Arg] aqueous solutions. The optimized values are a2 = 0.2391, b2 = 0.8127, c2 = −0.5879, d2 = −0.7844. The ARD is 2.23%.
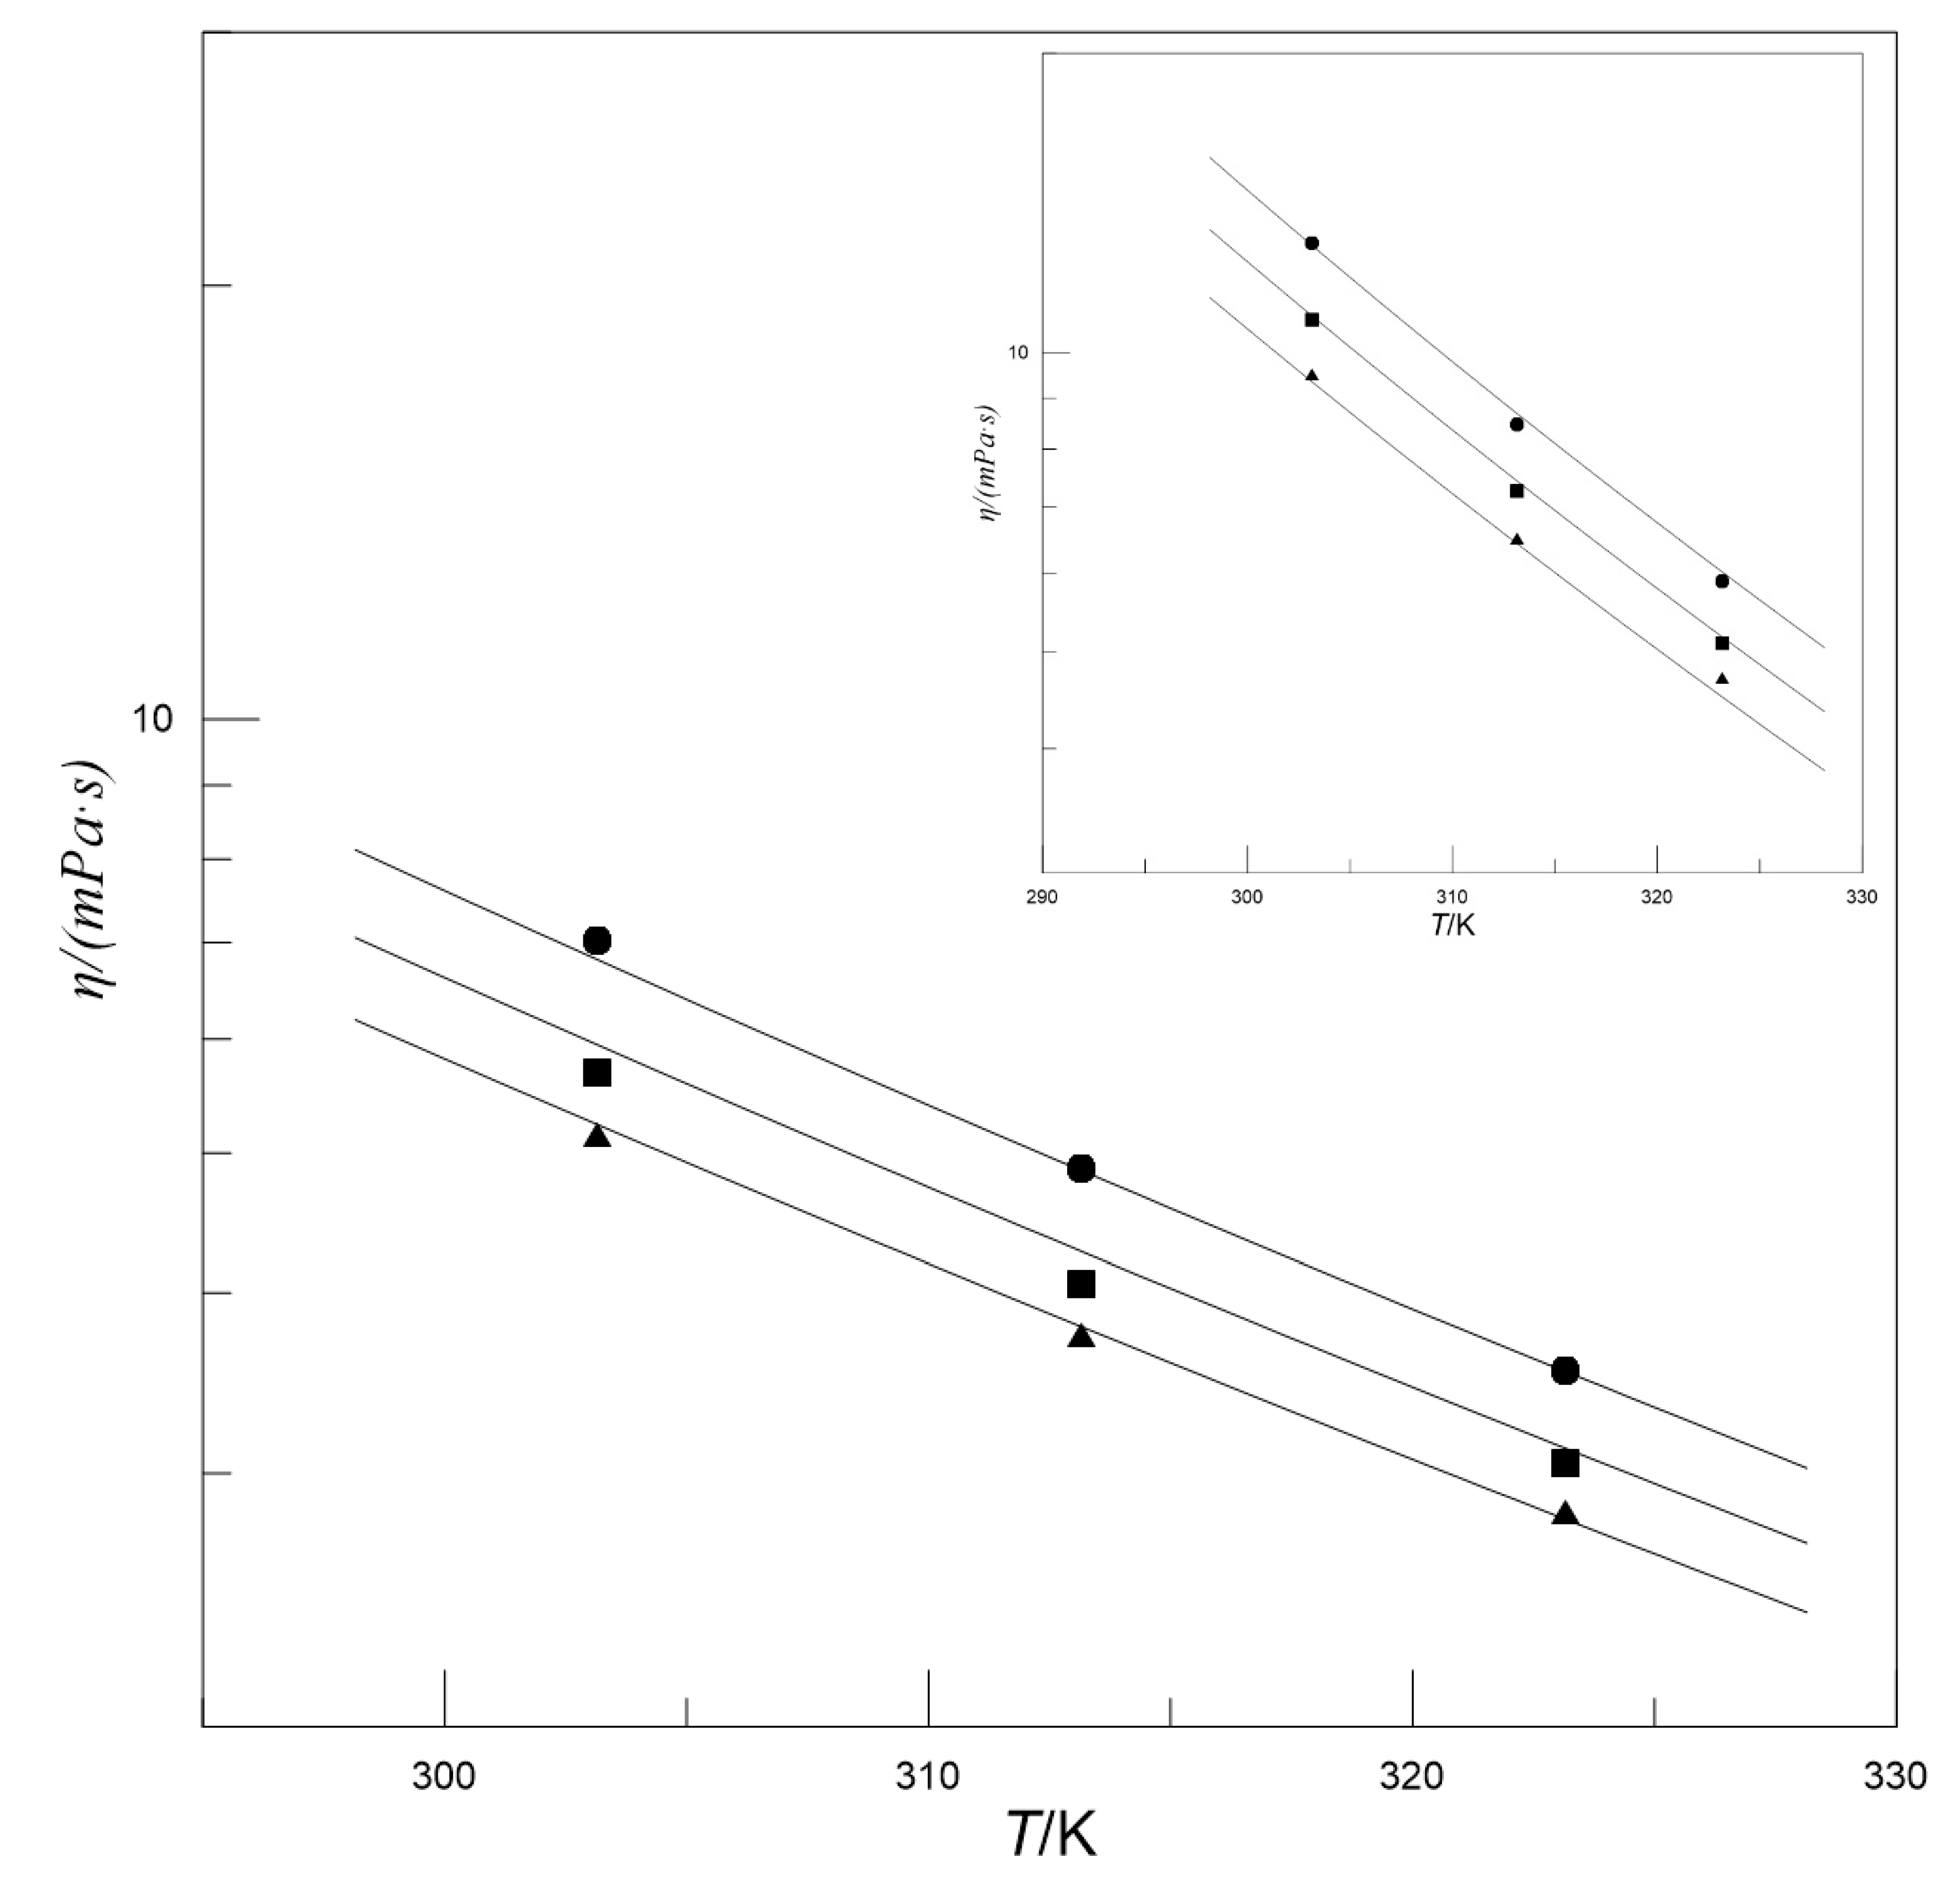
Figure 4 presents the influence of w[N1111][Arg] on the viscosity of MDEA-[N1111][Arg] aqueous solutions. It can be found that at a given wMDEA and temperature, with the increase in w[N1111][Arg], the viscosity gradually increases and the amplitude of this increase gradually becomes larger. This may be caused by the larger molecular structure of [N1111][Arg], which affects the flow of the surrounding liquid. Therefore, although the w[N1111][Arg] is low, it has a significant impact on viscosity. Figure 5 presents the influence of temperature on the viscosity of MDEA-[N1111][Arg] aqueous solutions, and shows that the viscosity decreases with increasing temperature at given wMDEA and w[N1111][Arg]. This phenomenon may be explained by the expansion of the liquid with increasing temperature, which causes an increase in the molecular distance and a decrease in viscosity.
The viscosity activation energies (Ea) indicate the difficulty of material flow and can also reflect the sensitivity of viscosity to temperature changes. In this work, it was calculated by fitting the viscosity data using the following equation [46,47]:
η = η e x p ( E a / R T )
where η is the viscosity at infinite temperature, R is the gas constant. Equation (14) was used to linearly fit the viscosity data shown in Table 3. Then the Ea values can be obtained by the slope of the fitted line:
ln ( η ) = E a R T + ln ( η )
The Ea value shown in Table 4 increased from 20.6 to 32.0 kJ·mol−1 with the increasing wMDEA and w[N1111][Arg]. This implies that the higher the viscosity of the solution, the higher the viscosity activation energy. Although higher w[N1111][Arg] can improve the absorption capacity of H2S, it also weakens the mass transfer. The calculated Ea value in this study is larger than that of water (Eawater = 17.0 kJ·mol−1), but smaller than those of some common imidazolium-based ILs (e.g., Ea[bmim][PF6] = 34.1 kJ·mol−1) [48].
In the process of absorbing H2S, the diffusion coefficient is also a significant parameter, and is highly important for the study of the gas–liquid mass transfer process. The Stokes–Einstein equation can express the relationship between diffusion coefficient and temperature and viscosity. It is generally accepted that the diffusion coefficient of a gas is inversely proportional to the viscosity of the solution [49].
Geert et al. [50] proposed a modified Stokes–Einstein relationship when studying the diffusion coefficient of N2O:
( D N 2 O η 0.8 ) s o l u = constant = ( D N 2 O η 0.8 ) w a t e r
Portugal et al. [49] proposed that the ratio of the diffusivity of a gas in an electrolyte solution to the diffusivity of the same gas in water does not vary significantly with the nature of the diffusant. Therefore, it is reasonable to use the so-called N2O analogy to estimate the diffusion coefficient of H2S in solutions:
D N 2 O ,     s o l u D N 2 O , w = D H 2 S ,   s o l u D H 2 S , w
Combined with the above two equations, it can be obtained that [49,51]:
D H 2 S ,     s o l u = D H 2 S , w ( η w a t e r η s o l u ) 0.8
where ηsolu is the viscosity of MDEA-[N1111][Arg] solution. DH2S,w is the diffusivity of H2S in water. It can be fitted as a function of temperature according to the method of Versteeg et al. [51] using data from published studies by Haimour et al. [52] and Tamimi et al. [53]:
D w = 6.04 × 10 7 exp ( 1714 / T )   m 2 · s 1
The results are shown in Table 5. It can be seen that DH2S decreases with the increase in wMDEA and w[N1111][Arg] at a given temperature, and at a given mass fraction, it increases with the increase in temperature. This indicates that lower mass fraction and higher temperature are favorable for the diffusion of H2S in MDEA-[N1111][Arg] solution.

4. Conclusions

In the present study, the viscosity and surface tension values of MDEA-[N1111][Arg] aqueous solutions were measured, and thermodynamic models were used to fit the experimental data. The experimental results and models were used to explore the effects of the solution mass fraction and temperature on the viscosity and surface tension. Furthermore, the SS and HS values of the solutions were obtained using the fitted model of the surface tension. The viscosity activation energy and the diffusion coefficient of H2S were calculated based on the measurement of viscosity. The main findings were as follows:
  • The surface tension decreased with the increase in solution mass fraction and temperature. The viscosity increased with the increase in solution mass fraction and decreased with the increase in temperature.
  • The thermodynamic models accurately reflected the effects of the solution mass fraction and temperature on the surface tension and viscosity.
  • With the increase in wMDEA, both the SS and HS decreased, whereas the SS increased and the HS decreased with the increase in w[N1111][Arg].
  • The increase in solution mass fraction can result in the increase in Ea and decrease in DH2S,solu.

Author Contributions

X.T. and D.F. participated in the design of this study, L.W. and P.Z. carried out the study and collected important background information. X.T. performed the Data analysis. X.T. drafted the manuscript. All authors have read and agreed to the published version of the manuscript.

Funding

This research was funded by the National Natural Science Foundation of China (No. 51776072), the Fundamental Research Funds for the Central Universities (No. 2018QN091 and No. 2019MS106), and the Natural Science Foundation of Hebei Province (No. E2020502044 and No. E2018502062).

Conflicts of Interest

The authors declare no conflict of interest.

References

  1. Razzaq, R.; Li, C.; Zhang, S. Coke oven gas: Availability, properties, purification, and utilization in China. Fuel 2013, 113, 287–299. [Google Scholar] [CrossRef]
  2. Bai, Z.; Bai, J.; Li, W. Utilization of coke oven gas in China and its potential for reduction of CO2 emission. Clean Coal Technol. 2016, 22, 90–95. [Google Scholar] [CrossRef]
  3. Zou, H.; Sheng, M.; Sun, X.; Ding, Z.; Arowo, M.; Luo, Y.; Zhang, L.; Chu, G.; Chen, J.-F.; Sun, B. Removal of hydrogen sulfide from coke oven gas by catalytic oxidative absorption in a rotating packed bed. Fuel 2017, 204, 47–53. [Google Scholar] [CrossRef]
  4. Kazemi, A.; Malayeri, M.; Kharaji, A.G.; Shariati, A. Feasibility study, simulation and economical evaluation of natural gas sweetening processes—Part 1: A case study on a low capacity plant in Iran. J. Nat. Gas Sci. Eng. 2014, 20, 16–22. [Google Scholar] [CrossRef]
  5. Abdulrahman, R.; Sebastine, I. Natural gas sweetening process simulation and optimization: A case study of Khurmala field in Iraqi Kurdistan region. J. Nat. Gas Sci. Eng. 2013, 14, 116–120. [Google Scholar] [CrossRef]
  6. Zhang, L. Application of Desulfurization and Decyanation as Well as Acid Making Technology for Coke Oven Gas in TISCO. Metall. Power 2013, 3, 17–18. [Google Scholar]
  7. Zhang, P.; Li, M.; Lv, C.; Zhang, Y.; Wang, L.; Fu, D. Effect of partial pressure on CO2 absorption performance in piperazine promoted 2-diethylaminoethanol and 1-dimethylamino-2-propanol aqueous solutions. J. Chem. Thermodyn. 2020, 150, 106198. [Google Scholar] [CrossRef]
  8. Qian, Z.; Xu, L.-B.; Li, Z.-H.; Li, H.; Guo, K. Selective Absorption of H2S from a Gas Mixture with CO2 by AqueousN-Methyldiethanolamine in a Rotating Packed Bed. Ind. Eng. Chem. Res. 2010, 49, 6196–6203. [Google Scholar] [CrossRef]
  9. Mandal, B.; Biswas, A.; Bandyopadhyay, S. Selective absorption of H2S from gas streams containing H2S and CO2 into aqueous solutions of N-methyldiethanolamine and 2-amino-2-methyl-1-propanol. Sep. Purif. Technol. 2004, 35, 191–202. [Google Scholar] [CrossRef]
  10. Lu, J.-G.; Zheng, Y.; He, D.-L. Selective absorption of H2S from gas mixtures into aqueous solutions of blended amines of methyldiethanolamine and 2-tertiarybutylamino-2-ethoxyethanol in a packed column. Sep. Purif. Technol. 2006, 52, 209–217. [Google Scholar] [CrossRef]
  11. Haghtalab, A.; Afsharpour, A. Solubility of CO2+H2S gas mixture into different aqueous N-methyldiethanolamine solutions blended with 1-butyl-3-methylimidazolium acetate ionic liquid. Fluid Phase Equilibria 2015, 406, 10–20. [Google Scholar] [CrossRef]
  12. Tian, X.; Wang, L.; Fu, D.; Li, C. Absorption and Removal Efficiency of Low-Partial-Pressure H2S in a Monoethanolamine-Activated N-Methyldiethanolamine Aqueous Solution. Energy Fuels 2018, 33, 629–635. [Google Scholar] [CrossRef]
  13. Zheng, W.; Wu, D.; Feng, X.; Hu, J.; Zhang, F.; Wu, Y.-T.; Hu, X. Low viscous Protic ionic liquids functionalized with multiple Lewis Base for highly efficient capture of H2S. J. Mol. Liq. 2018, 263, 209–217. [Google Scholar] [CrossRef]
  14. Wang, L.; Xu, Y.-L.; Li, Z.-D.; Wei, Y.-N.; Wei, J.-P. CO2/CH4 and H2S/CO2 Selectivity by Ionic Liquids in Natural Gas Sweetening. Energy Fuels 2017, 32, 10–23. [Google Scholar] [CrossRef]
  15. Huang, K.; Zhang, X.-M.; Zhou, L.-S.; Tao, D.-J.; Fan, J.-P. Highly efficient and selective absorption of H2S in phenolic ionic liquids: A cooperative result of anionic strong basicity and cationic hydrogen-bond donation. Chem. Eng. Sci. 2017, 173, 253–263. [Google Scholar] [CrossRef]
  16. Jou, F.-Y.; Mather, A.E. Solubility of Hydrogen Sulfide in [bmim][PF6]. Int. J. Thermophys. 2007, 28, 490–495. [Google Scholar] [CrossRef]
  17. Mortazavi-Manesh, S.; Satyro, M.; Marriott, R.A. Screening ionic liquids as candidates for separation of acid gases: Solubility of hydrogen sulfide, methane, and ethane. AIChE J. 2013, 59, 2993–3005. [Google Scholar] [CrossRef]
  18. Huang, K.; Zhang, J.-Y.; Hu, X.; Wu, Y.-T. Absorption of H2S and CO2 in Aqueous Solutions of Tertiary-Amine Functionalized Protic Ionic Liquids. Energy Fuels 2017, 31, 14060–14069. [Google Scholar] [CrossRef]
  19. Zhang, F.; Gao, K.-X.; Meng, Y.-N.; Qi, M.; Geng, J.; Wu, Y.-T.; Zhang, Z.-B. Intensification of dimethyaminoethoxyethanol on CO2 absorption in ionic liquid of amino acid. Int. J. Greenh. Gas Control 2016, 51, 415–422. [Google Scholar] [CrossRef]
  20. Zhang, X.; Tu, Z.; Li, H.; Huang, K.; Hu, X.; Wu, Y.; Macfarlane, D.R. Selective separation of H2S and CO2 from CH4 by supported ionic liquid membranes. J. Membr. Sci. 2017, 543, 282–287. [Google Scholar] [CrossRef]
  21. Handy, H.; Santoso, A.; Widodo, A.; Palgunadi, J.; Soerawidjaja, T.H.; Indarto, A. H2S–CO2 Separation Using Room Temperature Ionic Liquid [BMIM][Br]. Sep. Sci. Technol. 2014, 49, 2079–2084. [Google Scholar] [CrossRef]
  22. Ohno, H.; Fukumoto, K. Amino acid ionic liquids. Acc. Chem. Res. 2007, 40, 1122–1129. [Google Scholar] [CrossRef] [PubMed]
  23. Wang, B.; Zhang, K.; Ren, S.; Hou, Y.; Wu, W. Efficient capture of low partial pressure H2S by tetraethyl ammonium amino acid ionic liquids with absorption-promoted solvents. RSC Adv. 2016, 6, 101462–101469. [Google Scholar] [CrossRef]
  24. Seyedhosseini, B.; Izadyar, M.; Housaindokht, M.R. A Computational Exploration of H2S and CO2 Capture by Ionic Liquids Based on α-Amino Acid Anion and N7,N9-Dimethyladeninium Cation. J. Phys. Chem. A 2017, 121, 4352–4362. [Google Scholar] [CrossRef] [PubMed]
  25. Tian, X.; Wang, L.; Fu, D. Absorption and Removal Efficiency of Low-Partial-Pressure H2S in a Tetramethylammonium Glycinate Activated N-Methyldiethanolamine Aqueous Solution. Energy Fuels 2019, 33, 8413–8422. [Google Scholar] [CrossRef]
  26. Tariq, M.; Freire, M.G.; Saramago, B.; Coutinho, J.A.P.; Lopes, J.N.C.; Rebelo, L.P.N. Surface tension of ionic liquids and ionic liquid solutions. Chem. Soc. Rev. 2012, 41, 829–868. [Google Scholar] [CrossRef] [PubMed]
  27. Li, Z.; Sun, Y.; Zhao, D.; Zhuang, Y.; Wang, R.; Yang, F.; Liu, X.; Chen, Y. Surface tension of binary mixtures of (ionic liquid + tributyl phosphate). J. Chem. Thermodyn. 2019, 132, 214–221. [Google Scholar] [CrossRef]
  28. Song, D.; Seibert, A.F.; Rochelle, G.T. Effect of liquid viscosity on the liquid phase mass transfer coefficient of packing. Energy Procedia 2014, 63, 1268–1286. [Google Scholar] [CrossRef] [Green Version]
  29. Song, D.; Seibert, A.F.; Rochelle, G.T. Effect of liquid viscosity on mass transfer area and liquid film mass transfer coefficient for GT-OPTIMPAK 250Y. Energy Procedia 2017, 114, 2713–2727. [Google Scholar] [CrossRef]
  30. Zuiderweg, F.; Harmens, A. The influence of surface phenomena on the performance of distillation columns. Chem. Eng. Sci. 1958, 9, 89–103. [Google Scholar] [CrossRef]
  31. Kováts, P.; Thévenin, D.; Zähringer, K. Influence of viscosity and surface tension on bubble dynamics and mass transfer in a model bubble column. Int. J. Multiph. Flow 2020, 123, 103174. [Google Scholar] [CrossRef]
  32. Wei, C.; Xie, B.; Xiao, H.; Wang, D. Volumetric Mass Transfer Coefficient of Oxygen in an Internal Loop Airlift Reactor with a Convergence-Divergence Draft Tube. Chem. Eng. Technol. 2000, 23, 597–603. [Google Scholar] [CrossRef]
  33. Wang, L.; Tian, X.; Fu, D.; Du, X.; Ye, J. Experimental investigation on CO2 absorption capacity and viscosity for high concentrated 1-dimethylamino-2-propanol–monoethanolamine aqueous blends. J. Chem. Thermodyn. 2019, 139, 105865. [Google Scholar] [CrossRef]
  34. Zhang, P.; Wang, L.; Lu, C.; Li, M.; Yu, S.; Fu, D. Experiment and model for surface tensions of 2-diethylaminoethanol-N-(2-aminoethyl)ethanolamine, 2-diethylaminoethanol-N-methyl-1,3-propane-diamine and 2-diethylaminoethanol-1,4-butanediamine aqueous solutions. J. Mol. Liq. 2019, 288, 111031. [Google Scholar] [CrossRef]
  35. Fu, D.; Wang, L.; Tian, X. Surface thermodynamics of DMA2P, DMA2P-MEA and DMA2P-PZ aqueous solutions. J. Chem. Thermodyn. 2017, 107, 79–84. [Google Scholar] [CrossRef]
  36. Wang, L.; Tian, X.; Fang, C.; Huang, H.; Fu, D.; Quan, Y. Analysis of Surface Thermodynamics for Amino Acid Ionic Liquid–1-Dimethylamino-2-propanol Aqueous Blends. J. Chem. Eng. Data 2019, 64, 3661–3667. [Google Scholar] [CrossRef]
  37. Rodríguez, D.M.; Romero, C.M. Surface Tension of Glycine, Alanine, Aminobutyric Acid, Norvaline, and Norleucine in Water and in Aqueous Solutions of Strong Electrolytes at Temperatures from (293.15 to 313.15) K. J. Chem. Eng. Data 2017, 62, 3687–3696. [Google Scholar] [CrossRef]
  38. Fu, D.; Wang, L.; Tian, X. Experiments and model for the surface tension of DEAE-PZ and DEAE-MEA aqueous solutions. J. Chem. Thermodyn. 2017, 105, 71–75. [Google Scholar] [CrossRef]
  39. Gliński, J.; Chavepeyer, G.; Platten, J.K. Surface properties of diluted aqueous solutions of solutes containing isopropyl hydrophobic group. J. Chem. Phys. 2001, 114, 5702–5706. [Google Scholar] [CrossRef]
  40. Maham, Y.; Chevillard, A.; Mather, A.E. Surface Thermodynamics of Aqueous Solutions of Morpholine and Methylmorpholine. J. Chem. Eng. Data 2004, 49, 411–415. [Google Scholar] [CrossRef]
  41. Yusoff, R.; Aroua, M.K.; Shamiri, A.; Ahmady, A.; Jusoh, N.S.; Asmuni, N.F.; Bong, L.C.; Thee, S.H. Density and viscosity of aqueous mixtures of N-methyldiethanolamines (MDEA) and ionic liquids. J. Chem. Eng. Data 2013, 58, 240–247. [Google Scholar] [CrossRef]
  42. Ghani, N.A.; Sairi, N.A.; Aroua, M.K.; Alias, Y.; Yusoff, R. Density, Surface Tension, and Viscosity of Ionic Liquids (1-Ethyl-3-methylimidazolium diethylphosphate and 1,3-Dimethylimidazolium dimethylphosphate) Aqueous Ternary Mixtures with MDEA. J. Chem. Eng. Data 2014, 59, 1737–1746. [Google Scholar] [CrossRef]
  43. Zhao, Y.; Zhang, X.; Zeng, S.; Zhou, Q.; Dong, H.; Tian, X.; Zhang, S. Density, viscosity, and performances of carbon dioxide capture in 16 absorbents of amine + ionic liquid + H2O, ionic liquid + H2O, and amine + H2O systems. J. Chem. Eng. Data 2010, 55, 3513–3519. [Google Scholar] [CrossRef]
  44. Weiland, R.H.; Dingman, J.C.; Cronin, D.B.; Browning, G.J. Density and viscosity of some partially carbonated aqueous alkanolamine solutions and their blends. J. Chem. Eng. Data 1998, 43, 378–382. [Google Scholar] [CrossRef]
  45. Wang, L.; Fang, C.; Du, X.; Fu, K.; Tian, X.; Zhang, P.; Fu, D. Surface thermodynamics and viscosity of 1-dimethylamino-2-propanol + 1-(2-aminoethyl)piperazine and 1-dimethylamino-2-propanol + 1,5-diamino-2-methylpentane aqueous solutions. J. Chem. Thermodyn. 2020, 151, 106242. [Google Scholar] [CrossRef]
  46. Zhao, Z.; Xing, X.; Tang, Z.; Zheng, Y.; Fei, W.; Liang, X.; Ataeivarjovi, E.; Guo, N. Experiment and simulation study of CO2 solubility in dimethyl carbonate, 1-octyl-3-methylimidazolium tetrafluoroborate and their mixtures. Energy 2018, 143, 35–42. [Google Scholar] [CrossRef]
  47. Li, Z.; Zhang, X.; Dong, H.; Zhang, X.; Gao, H.; Zhang, S.; Li, J.; Wang, C. Efficient absorption of ammonia with hydroxyl-functionalized ionic liquids. RSC Adv. 2015, 5, 81362–81370. [Google Scholar] [CrossRef]
  48. Brown, P.; Gurkan, B.; Hatton, T.A. Enhanced gravimetric CO2 capacity and viscosity for ionic liquids with cyanopyrrolide anion. AIChE J. 2015, 61, 2280–2285. [Google Scholar] [CrossRef]
  49. Portugal, A.; Marques, A.; Mendes, A. Carbon dioxide absorption kinetics in potassium threonate. Chem. Eng. Sci. 2008, 63, 3493–3503. [Google Scholar] [CrossRef]
  50. Versteeg, G.F.; Van Swaaij, W.P.M. Solubility and diffusivity of acid gases (carbon dioxide, nitrous oxide) in aqueous alkanolamine solutions. J. Chem. Eng. Data 1988, 33, 29–34. [Google Scholar] [CrossRef] [Green Version]
  51. Zhou, Z.; Jing, G.; Zhou, L. Characterization and absorption of carbon dioxide into aqueous solution of amino acid ionic liquid [N1111][Gly] and 2-amino-2-methyl-1-propanol. Chem. Eng. J. 2012, 204–206, 235–243. [Google Scholar] [CrossRef]
  52. Haimour, N.; Sandall, O.C. Molecular diffusivity of hydrogen sulfide in water. J. Chem. Eng. Data 1984, 29, 20–22. [Google Scholar] [CrossRef]
  53. Tamimi, A.; Rinker, E.B.; Sandall, O.C. Diffusion Coefficients for Hydrogen Sulfide, Carbon Dioxide, and Nitrous Oxide in Water over the Temperature Range 293–368 K. J. Chem. Eng. Data 1994, 39, 330–332. [Google Scholar] [CrossRef]
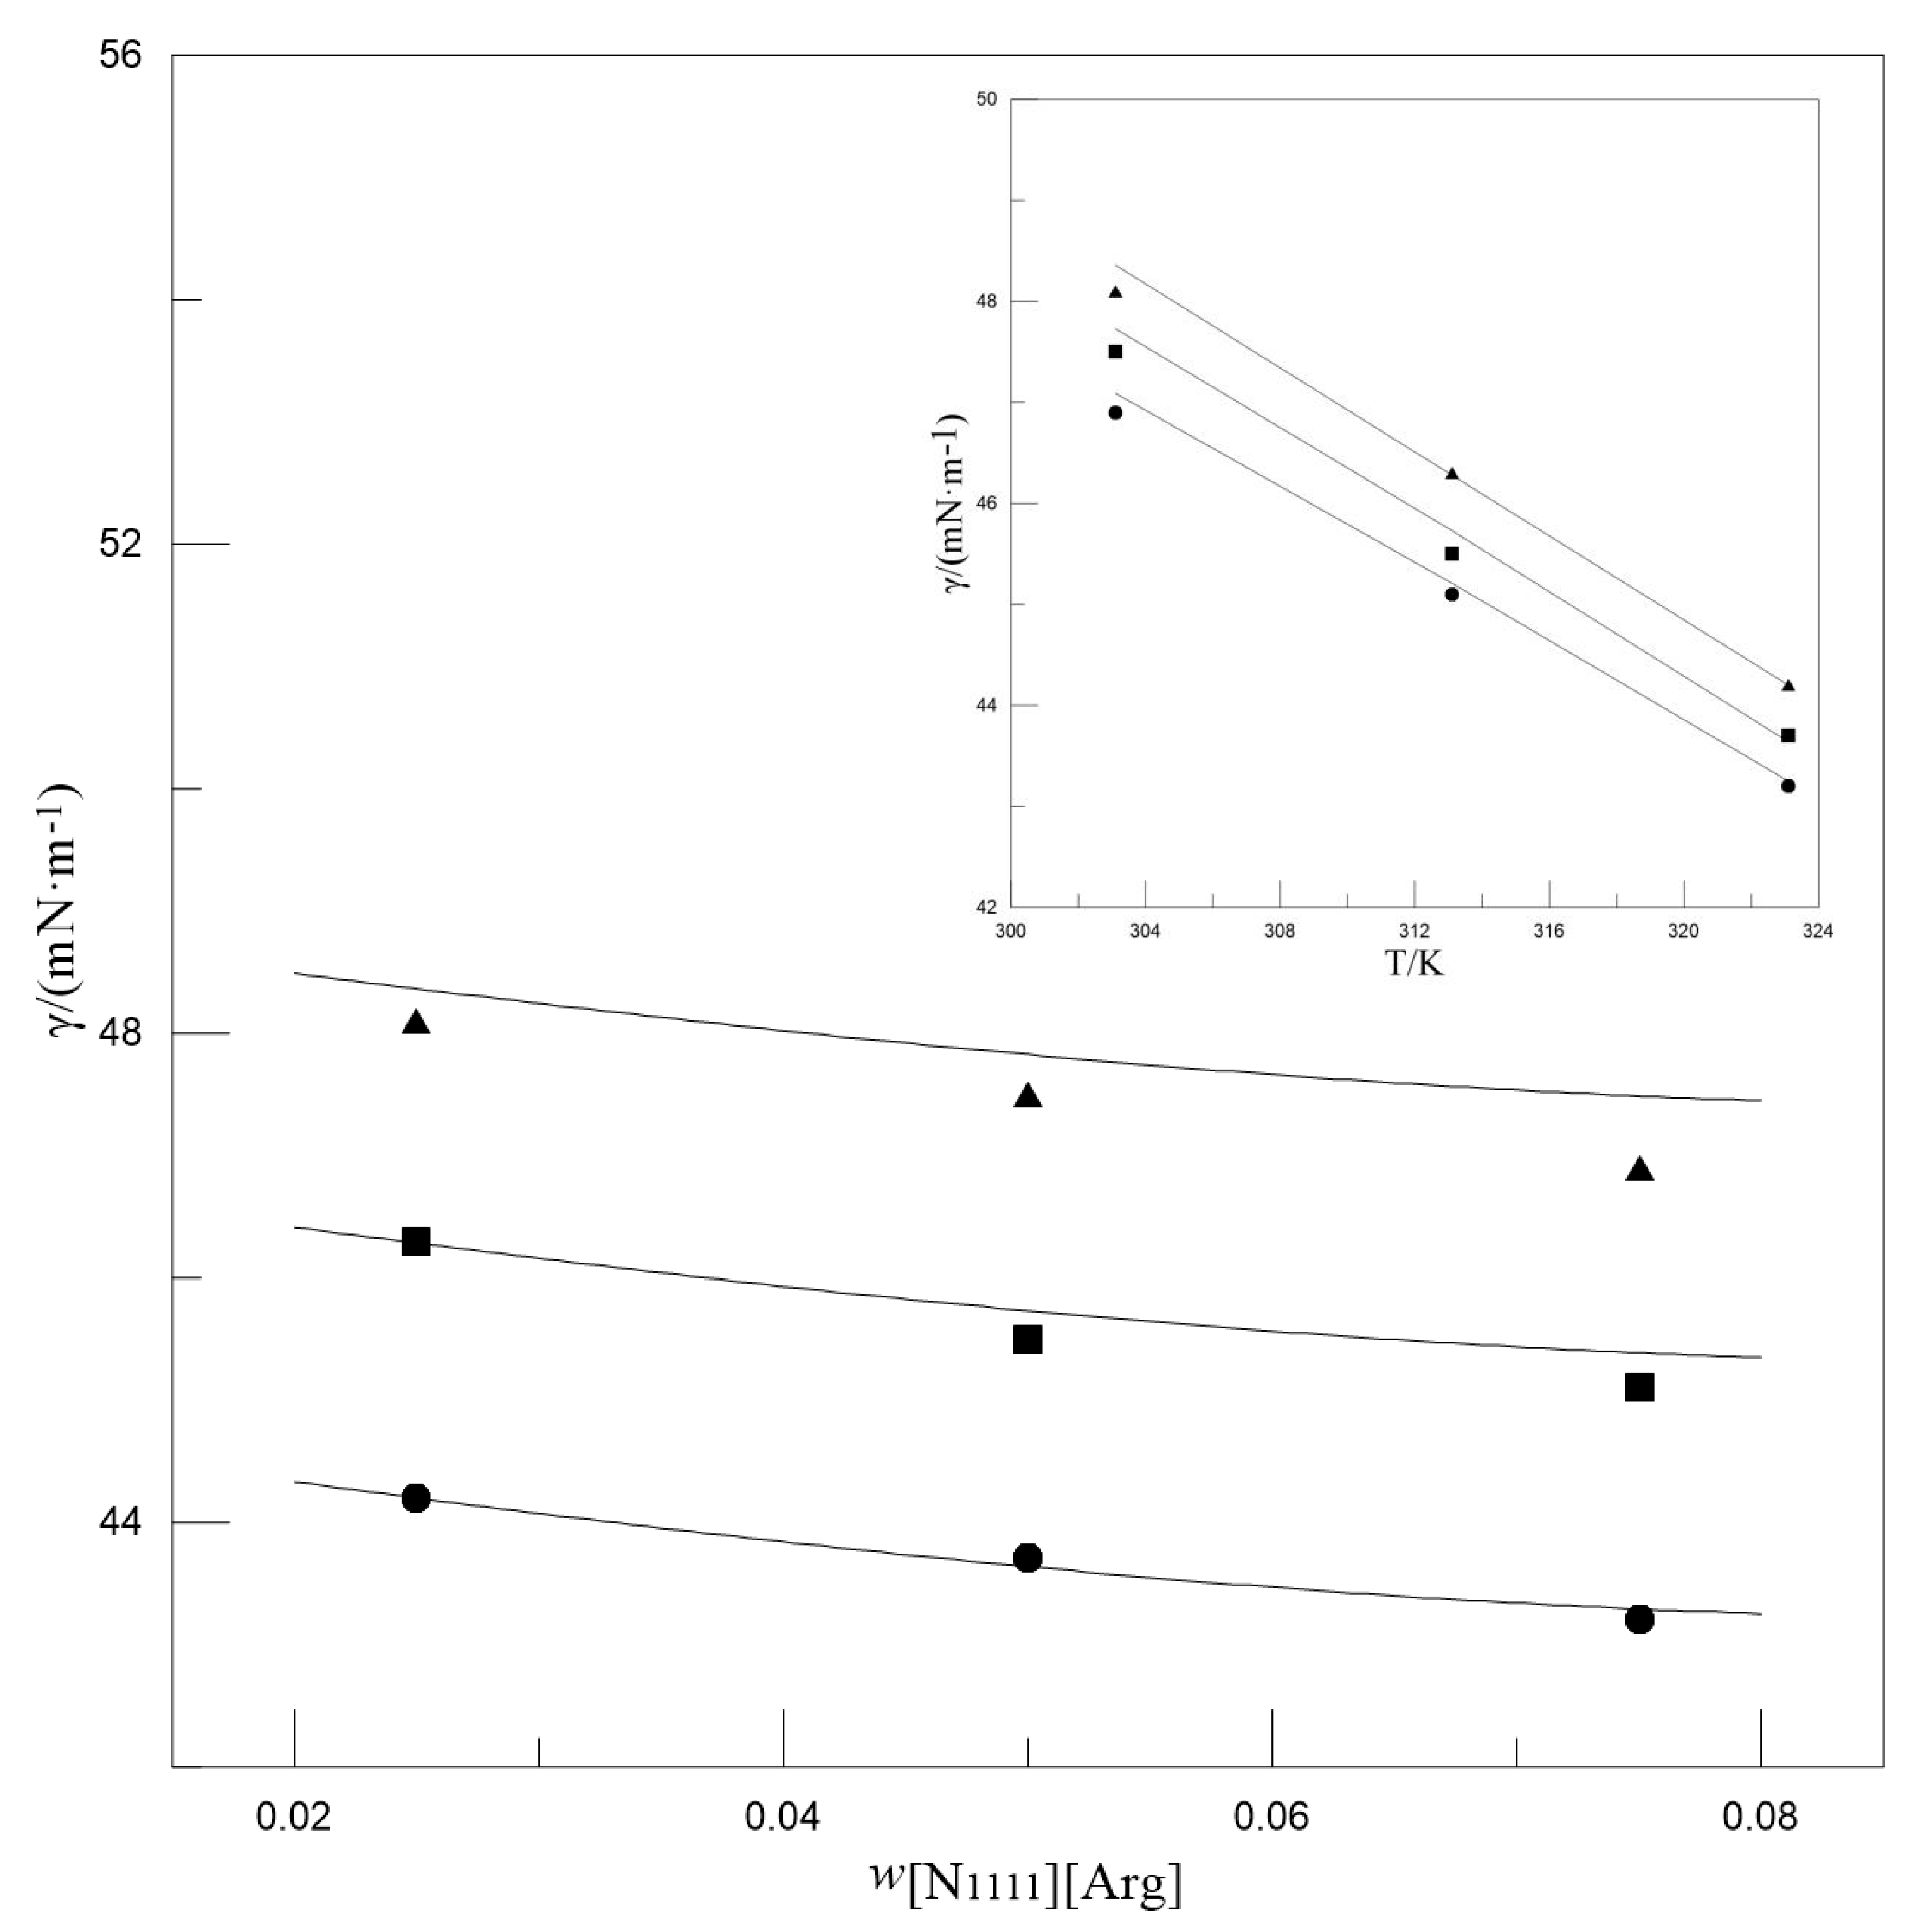
Figure 1. The effect of w[N1111][Arg] (main plot) and temperature (inset plot) on the surface tensions of MDEA-[N1111][Arg] aqueous solutions. Main plot: wMDEA = 0.500, ▲T = 303.2 K, ■T = 313.2 K, ●T = 323.2 K. Inset plot: wMDEA = 0.500, ▲w[N1111][Arg] = 0.025, ■w[N1111][Arg] = 0.050, ●w[N1111][Arg] = 0.075. Symbols: Experimental values. Lines: Calculated values.
Entropy 22 01337 g001
Figure 2. The effect of wMDEA on the surface enthalpies (main plot) and surface entropies (inset plot). ▲w[N1111][Arg] = 0.025, ■w[N1111][Arg] = 0.050, ●w[N1111][Arg] = 0.075. Symbols: Experimental values. Lines: Trend lines.
Entropy 22 01337 g002
Figure 3. The effect of w[N1111][Arg] on the surface enthalpies (main plot) and surface entropies (inset plot). ▲wMDEA = 0.3, ■wMDEA = 0.4, ●wMDEA = 0.5. Symbols: Experimental values. Lines: Trend lines.
Entropy 22 01337 g003
Figure 4. Effect of w[N1111][Arg] on the viscosity of MDEA-[N1111][Arg] aqueous solutions at wMDEA = 0.500, wMDEA = 0.400 (inset), ▲T = 303.2 K; ■T = 313.2 K; ●T = 323.2 K. Symbols: Experimental values. Lines: Calculated values.
Entropy 22 01337 g004
Figure 5. Effect of temperature on the viscosity of MDEA-[N1111][Arg] aqueous solutions at wMDEA = 0.40, wMDEA = 0.50 (insert), ▲w[N1111][Arg] = 0.025; ■w[N1111][Arg] = 0.050; ●w[N1111][Arg] = 0.075. Symbols: Experimental values. Lines: Calculated values.
Entropy 22 01337 g005
Table 1. Sample description.
Chemical NameCASPurity (Mass Fraction, as Stated by the Supplier)Source
MDEA105-59-9≥0.98Aladdin Reagent, Shanghai, China
[N1111][Arg]1450589-45-3≥0.98Shanghai Cheng Jie Chemical Co., Ltd., Shanghai, China
water7732-18-5Electrical resistivity > 15 MΩ cm at T = 298 KHeal Force ROE-100 apparatus, Shanghai, China
Table 2. Surface tensions (γ) of N-methyldiethanolamine (MDEA)-[N1111][Arg] aqueous solutions under different mass fractions of MDEA (wMDEA), [N1111][Arg] (w[N1111][Arg]), and temperature a.
wMDEAw[N1111][Arg]γ/(mN·m−1)
T = 303.2 KT = 313.2 KT = 323.2 K
0.3000.02552.250.047.8
0.05051.849.547.5
0.07551.549.247.2
0.4000.02550.148.246.1
0.05049.547.645.8
0.07549.047.245.5
0.5000.02547.445.943.8
0.05046.945.643.6
0.07546.345.443.3
a standard uncertainties u are u(T) = 0.1 K; u(wMDEA) = 0.011; u(w[N1111][Arg]) = 0.002; u(γ) = 0.2 mN·m−1.
Table 3. Viscosities (η) of MDEA-[N1111][Arg] aqueous solutions under different mass fractions of MDEA (wMDEA), [N1111][Arg] (w[N1111][Arg]) and temperature a.
wMDEAw[N1111][Arg]η/(mPa·s)
T = 303.2 KT = 313.2 KT = 323.2 K
0.3000.0253.102.351.87
0.0503.492.612.02
0.0754.032.962.26
0.4000.0255.153.742.82
0.0505.684.063.05
0.0757.014.873.53
0.5000.0259.526.504.71
0.05010.807.265.10
0.07512.908.475.89
a standard uncertainties u are u(T) = 0.1 K; u(wMDEA) = 0.011; u(w[N1111][Arg]) = 0.002; and relative uncertainty ur(η) = 2%.
Table 4. Fitted Arrhenius parameters of MDEA-[N1111][Arg] aqueous solution under different mass fractions of MDEA (wMDEA) and [N1111][Arg] (w[N1111][Arg]) a.
wMDEAw[N1111][Arg]Ea/(kJ·mol−1)
0.3000.02520.6
0.05022.3
0.07523.6
0.4000.02524.5
0.05025.3
0.07528.0
0.5000.02528.7
0.05030.6
0.07532.0
a Standard uncertainties u are u(wMDEA) = 0.011; u(w[N1111][Arg]) = 0.002; and relative uncertainty ur(Ea) = 2%.
Table 5. Diffusion coefficient of H2S in MDEA-[N1111][Arg] solutions under different mass fraction of MDEA (wMDEA) and [N1111][Arg] (w[N1111][Arg]) a.
wMDEAw[N1111][Arg] D H 2 S / ( × 10 9 m 2 · s 1 )
T = 303.2 KT = 313.2 KT = 323.2 K
0.3000.0250.720.911.13
0.0500.650.841.06
0.0750.580.760.97
0.4000.0250.480.630.81
0.0500.440.590.76
0.0750.370.510.68
0.5000.0250.290.410.54
0.0500.260.370.51
0.0750.230.330.45
a Standard uncertainties u are u(wMDEA) = 0.011; u(w[N1111][Arg]) = 0.002; and relative uncertainty ur(DH2S) = 2%.
Publisher’s Note: MDPI stays neutral with regard to jurisdictional claims in published maps and institutional affiliations.