Article

Microstructure and Mechanical Properties of TaNbVTiAlx Refractory High-Entropy Alloys

1
State Key Lab of Powder Metallurgy, Central South University, Changsha 410083, China
2
School of Materials Science and Engineering, Chongqing University, Chongqing 400044, China
3
College of Mechanical and Vehicle Engineering, Hunan University, Changsha 410082, China
*
Authors to whom correspondence should be addressed.
Entropy 2020, 22(3), 282; https://doi.org/10.3390/e22030282
Submission received: 29 January 2020 / Revised: 22 February 2020 / Accepted: 25 February 2020 / Published: 29 February 2020

Abstract

:
A series of TaNbVTiAlx (x = 0, 0.2, 0.4, 0.6, 0.8, and 1.0) refractory high-entropy alloys (RHEAs) with high specific strength and reasonable plasticity were prepared using powder metallurgy (P/M) technology. This paper studied their microstructure and compression properties. The results show that all the TaNbVTiAlx RHEAs exhibited a single BCC solid solution microstructure with no elemental segregation. The P/M TaNbVTiAlx RHEAs showed excellent room-temperature specific strength (207.11 MPa*cm3/g) and high-temperature specific strength (88.37 MPa*cm3/g at 900 °C and 16.03 MPa*cm3/g at 1200 °C), with reasonable plasticity, suggesting that these RHEAs have potential to be applied at temperatures >1200 °C. The reasons for the excellent mechanical properties of P/M TaNbVTiAl0.2 RHEA were the uniform microstructure and solid solution strengthening effect.

1. Introduction

With the development of the aerospace and nuclear industries, the service temperature of traditional nickel-base superalloys is close to its melting point [1]. Therefore, the development of new refractory alloys should be accelerated. In the last decade, refractory high-entropy alloys (RHEAs), which contain five or more refractory elements with a concentration between 5 at.% and 35 at.% [2], have attracted much attention due to their high melting points and outstanding high-temperature mechanical properties. Studies have shown that at 1600 °C, NbMoTaW RHEA has a higher yield strength than the Inconel 718 and Haynes 230 alloys, which can reach 405 MPa [3]. Deriving from this alloying design strategy, a series of RHEAs have been developed, such as MoNbTaV [4], VNbMoTaW [3], and NbMoTaWTi [5]. These RHEAs are considered backup alloys for high-temperature structural materials. However, such alloys generally exhibit lower plasticity and poor machinability, making them unusable for industrial applications.
Many researchers have done a lot of work to improve the processability of RHEAs [6,7,8]. Chen et al. [9] reported that the plasticity of RHEAs can be improved by reducing the number of valence electrons in a single-phase BCC solid solution. Sheikh et al. [10] reported a new RHEA (Hf0.5Nb0.5Ta0.5Ti1.5Zr) which achieved fracture strength of 1000 MPa and fracture plasticity of 20%. Guo et al. [11] prepared a novel NbTaTiV RHEA through powder metallurgy (P/M) method, which has a yield strength of 1.37 GPa and a fracture strain of 23%. Unfortunately, although these RHEAs have high strength and acceptable plastic strain, their density is still too high, which hinders the practical application.
The literature [12,13,14] shows that adding light elements (such as Al) to RHEAs can effectively reduce the density and increase the specific strength of the alloys. For example, Senkov et al. [12] prepared Al0.4Hf0.6NbTaTiZr RHEA by adding Al into the HfNbTaTiZr RHEA. The density of the alloy decreased from 9.94 g/cm3 to 9.05 g/cm3, and the specific yield strength increased from 93.56 MPa*cm3/g to 203.43 MPa*cm3/g. Yurchenko et al. [13] reported that with the increase of Al content, the density of CrNbTiVZrAlx RHEA gradually decreased from 6.56 g/cm3 (CrNbTiVZr) to 6.21 g/cm3 (Al0.5CrNbTiVZr), and the specific strength increased from 192.07 MPa*cm3/g to 262.48 MPa*cm3/g. Xu et al. [14] reduced the density of the Ti50-xAlxV20Nb20Mo10 RHEA from 6.102 g/cm3 (Ti40Al10V20Nb20Mo10) to 5.876 g/cm3 (Ti30Al20V20Nb20Mo10) by adjusting the Al content, and the room-temperature specific yield strength increased from 147.49 MPa*cm3/g to 202.01 MPa*cm3/g. Although the density and specific strength of these alloys are significantly improved after the addition of aluminum, their plasticity is generally reduced. Therefore, choosing a refractory high-entropy alloy with both high strength and high plasticity as a matrix, and then reducing its density by adding light elements such as Al, is an effective method to obtain structural materials with high strength, low density, and good plasticity. The recently reported TaNbVTi alloy meets the requirements of the matrix very well [11]. Furthermore, Yang et al. [15] reported that the arc-melted NbTiVTaAl0.25 HEA has a low density of 8.78 g/cm3 and reasonable plasticity greater than 50%. Nevertheless, the yield strength of this alloy is only 1330 MPa (specific strength of 151.48 MPa*cm3/g), which has the possibility of further improvement compared with most refractory high-entropy alloys.
Powder metallurgy is one of the effective methods for preparing refractory high-entropy alloys. Due to the multicomponents in the RHEAs and the large differences in melting point, coarse dendrites and severe segregation are easily formed during the melting process, resulting in a multiphase structure with even several intermetallic phases [16]. Studies [6,7,11,16,17] have shown that a P/M method is one of the effective methods for preparing multicomponent RHEAs, which can avoid component segregation and obtain a uniform equiaxed crystal structure. The mechanical properties of these RHEAs are also expected to be further improved because the P/M technology uses a powder mixing method to make the composition uniform. Moreover, spark plasma sintering (SPS) can make the powder completely solidified in a few minutes, which can effectively inhibit the grain growth and composition segregation. Therefore, a multicomponent alloy without segregation and fine grains can be obtained. In addition, considering the poor machinability of RHEAs, the advantages of the near-net forming technology of P/M technology can significantly broaden the application range. In this study, we developed a series of Al-alloyed RHEAs (TaNbVTiAlx) through a P/M method. The effect of Al on the microstructure and mechanical properties of the TaNbVTiAlx RHEAs was investigated. The strengthening mechanism was also discussed.

2. Materials and Methods

TaNbVTiAlx (x = 0, 0.2, 0.4, 0.6, 0.8, and 1.0) RHEAs, which are called Al0, Al0.2, Al0.4, Al0.6, Al0.8, and Al1.0, were prepared using an elemental P/M method. The theoretical compositions of the alloys are shown in Table 1.
Figure 1 illustrates the macroscopic morphology of elemental Ta, Nb, V, Ti, and Al powders. The average particle size and impurity content are presented in Table 2. The Ta, Nb, V, and Ti powders have irregular shapes and the powder sizes are not larger than 30 μm. The Al powder has a nearly spherical shape with particle size less than 20 μm.
The raw powders (purity > 99.5 wt.%) with different compositions were mixed and ball-milled in a stainless steel ball mill tank. The mass ratio of stainless steel ball: powder was 10:1 and the ball mill was operated at 150 rpm for 8 h. The milled powders were then sintered by using SPS (D25/3, FCT, Rauenstein, Germany). The powders were heated to 700 °C without pressure, and then the temperature was further increased to 1700 °C by applying pressure of 30 MPa; the holding time was 10 min. The heating rate during the entire sintering process was 100 °C/min. Throughout the sintering process, the high-purity argon gas charged into the furnace as a protective atmosphere to prevent oxidation.
Test specimens (d 6 × 9 mm3) for room-temperature compression and high-temperature compression were cut from the sintered RHEAs by using an electrical discharge machining (EDM) method. An INSTRON-5569 test system was used for room-temperature compression experiments with a compression rate of 10−3 s−1. High-temperature compression experiments were carried out with a Gleeble-3180 device with a strain rate of 10−3 s−1 at 900 °C, 1000 °C, 1100 °C, and 1200 °C, respectively.
Particle size distributions of the powders were measured by a laser particle size analyzer (Mastersizer 3000, Malvern, UK). The impurity elements in the powders were detected by an elemental analyzer (TCH600, LECO, San Jose, America). Phase analyses were performed by Cu-Ka target X-ray diffractometer (XRD, D/max 2500, CORP, Tokyo, Japan). Microstructures were observed via electron microscopy (SEM, G3-US, FEI, Hillsboro, America) with an electron backscatter diffraction (EBSD) device. A field emission probe microscope (EPMA, JXA-8530F, JEOL, Tokyo, Japan) was used to characterize the element distribution of the samples.

3. Results

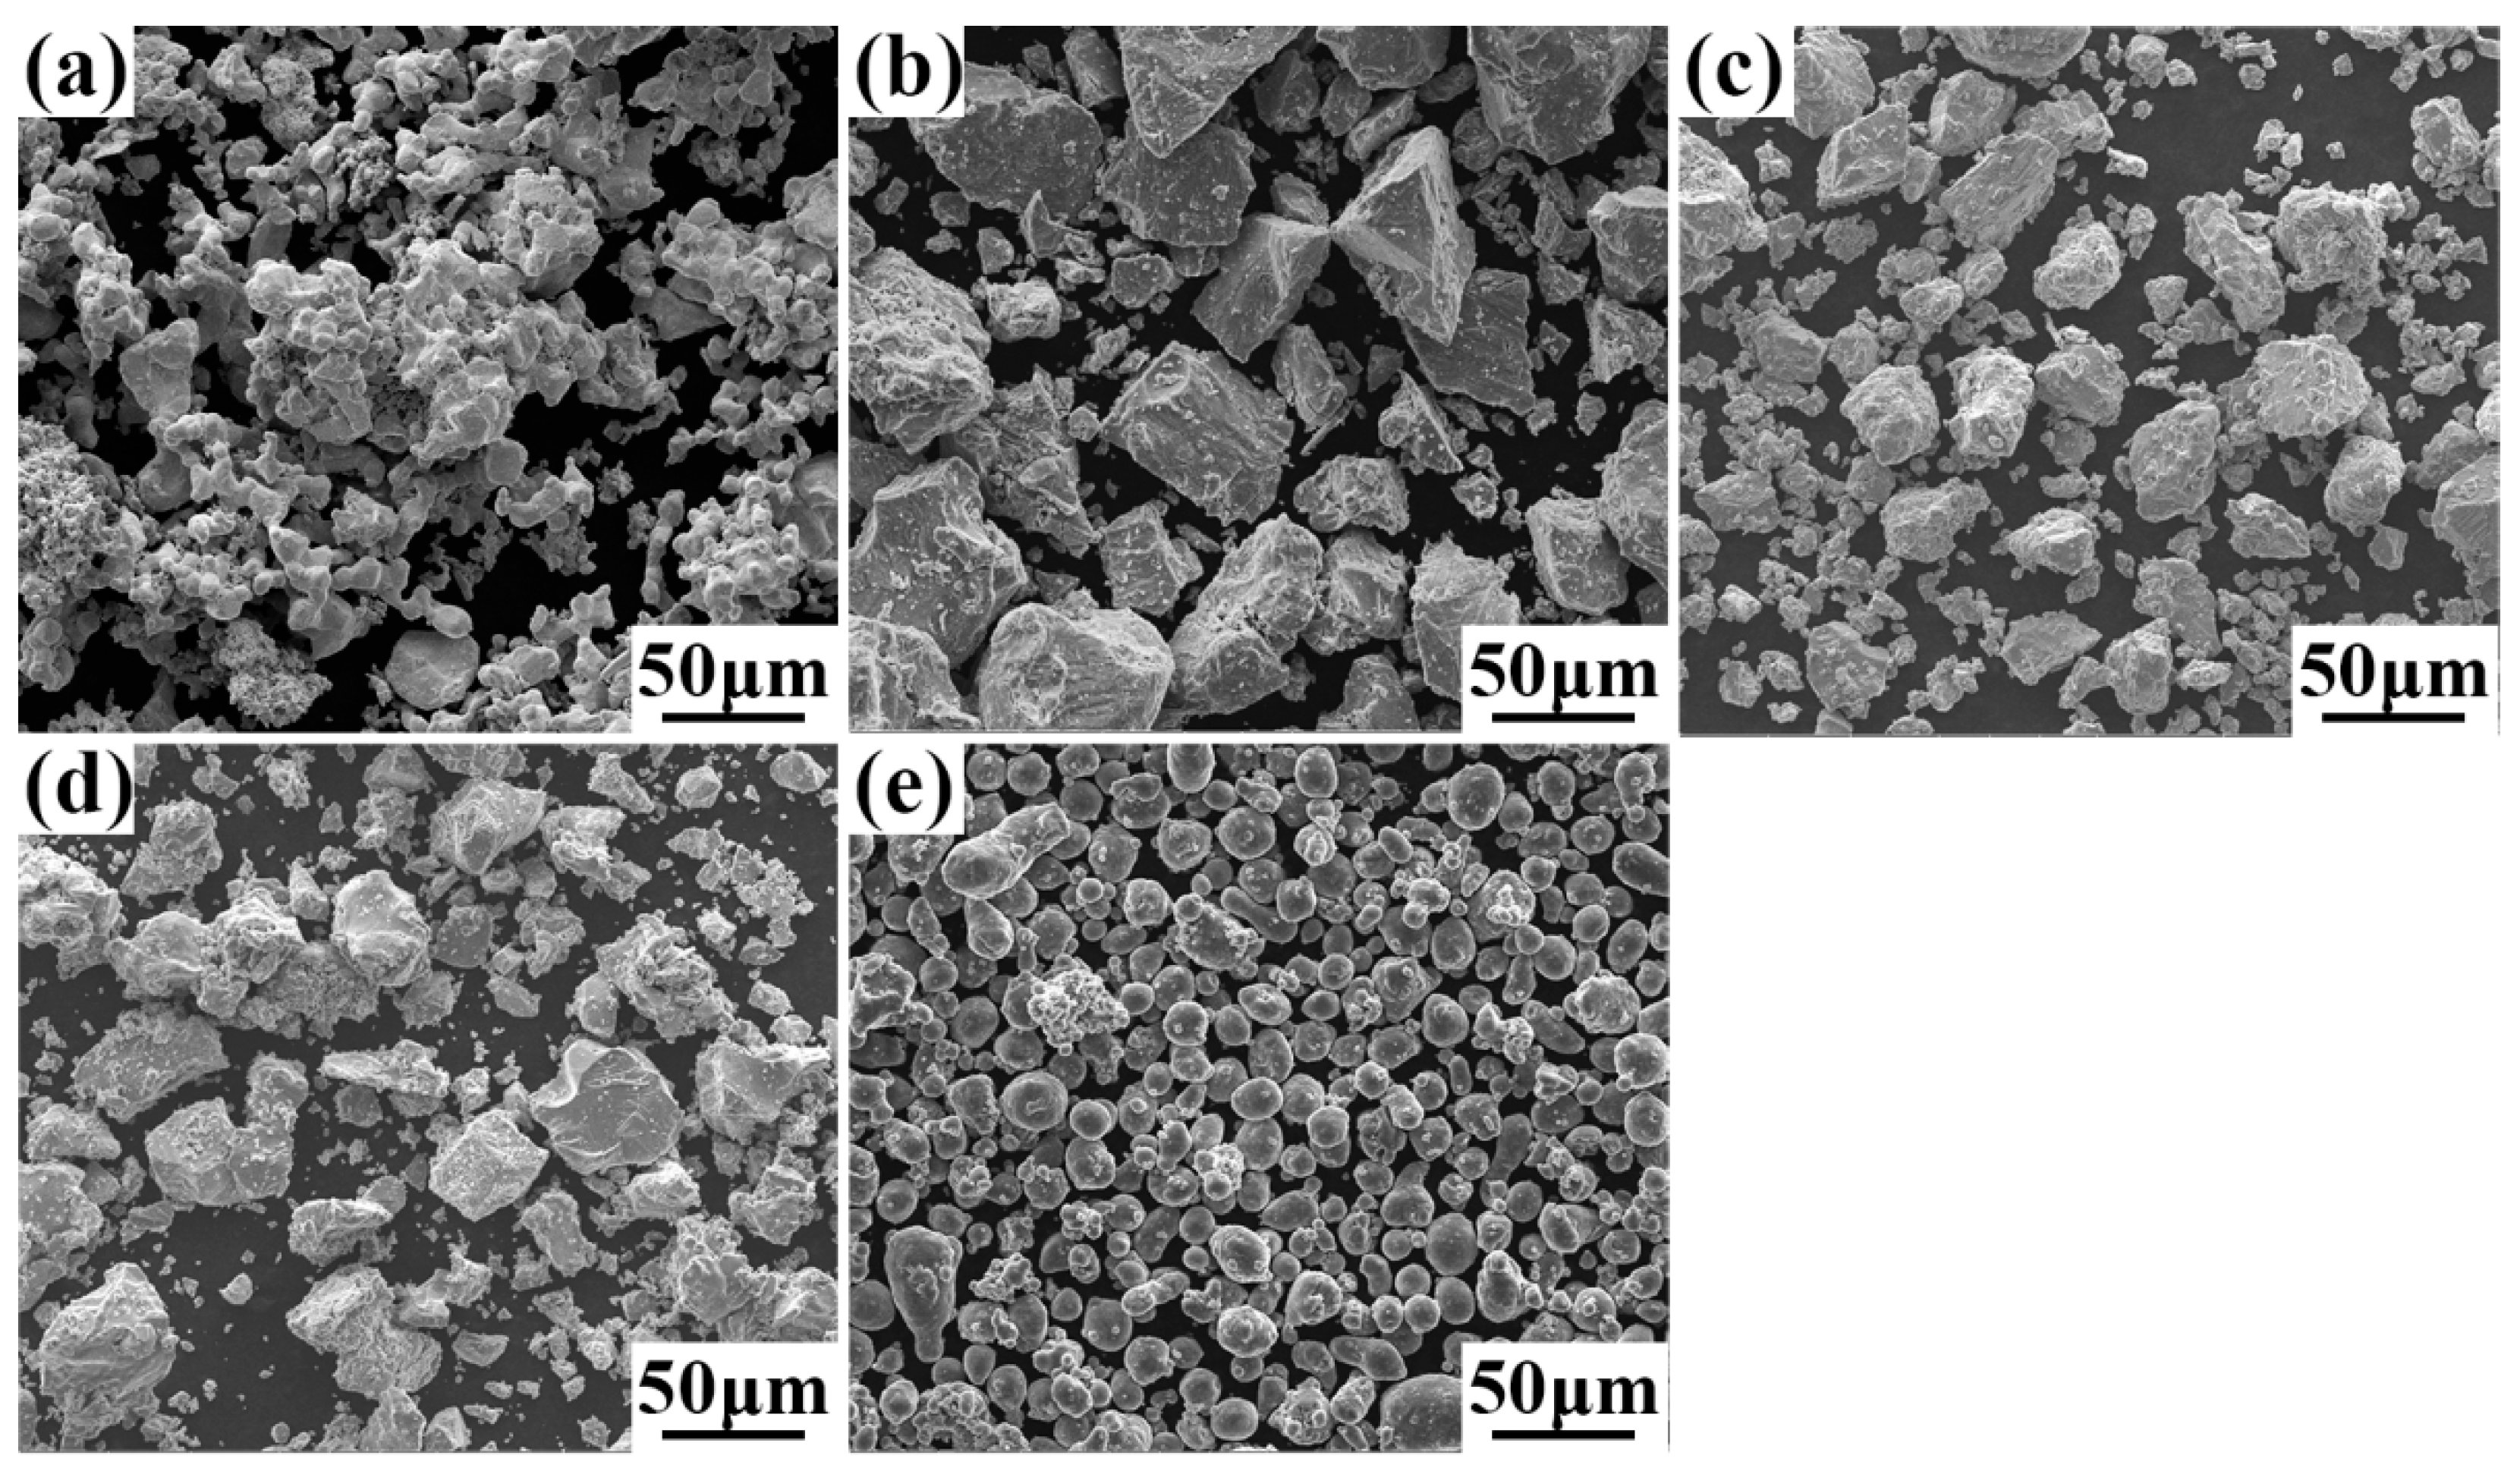
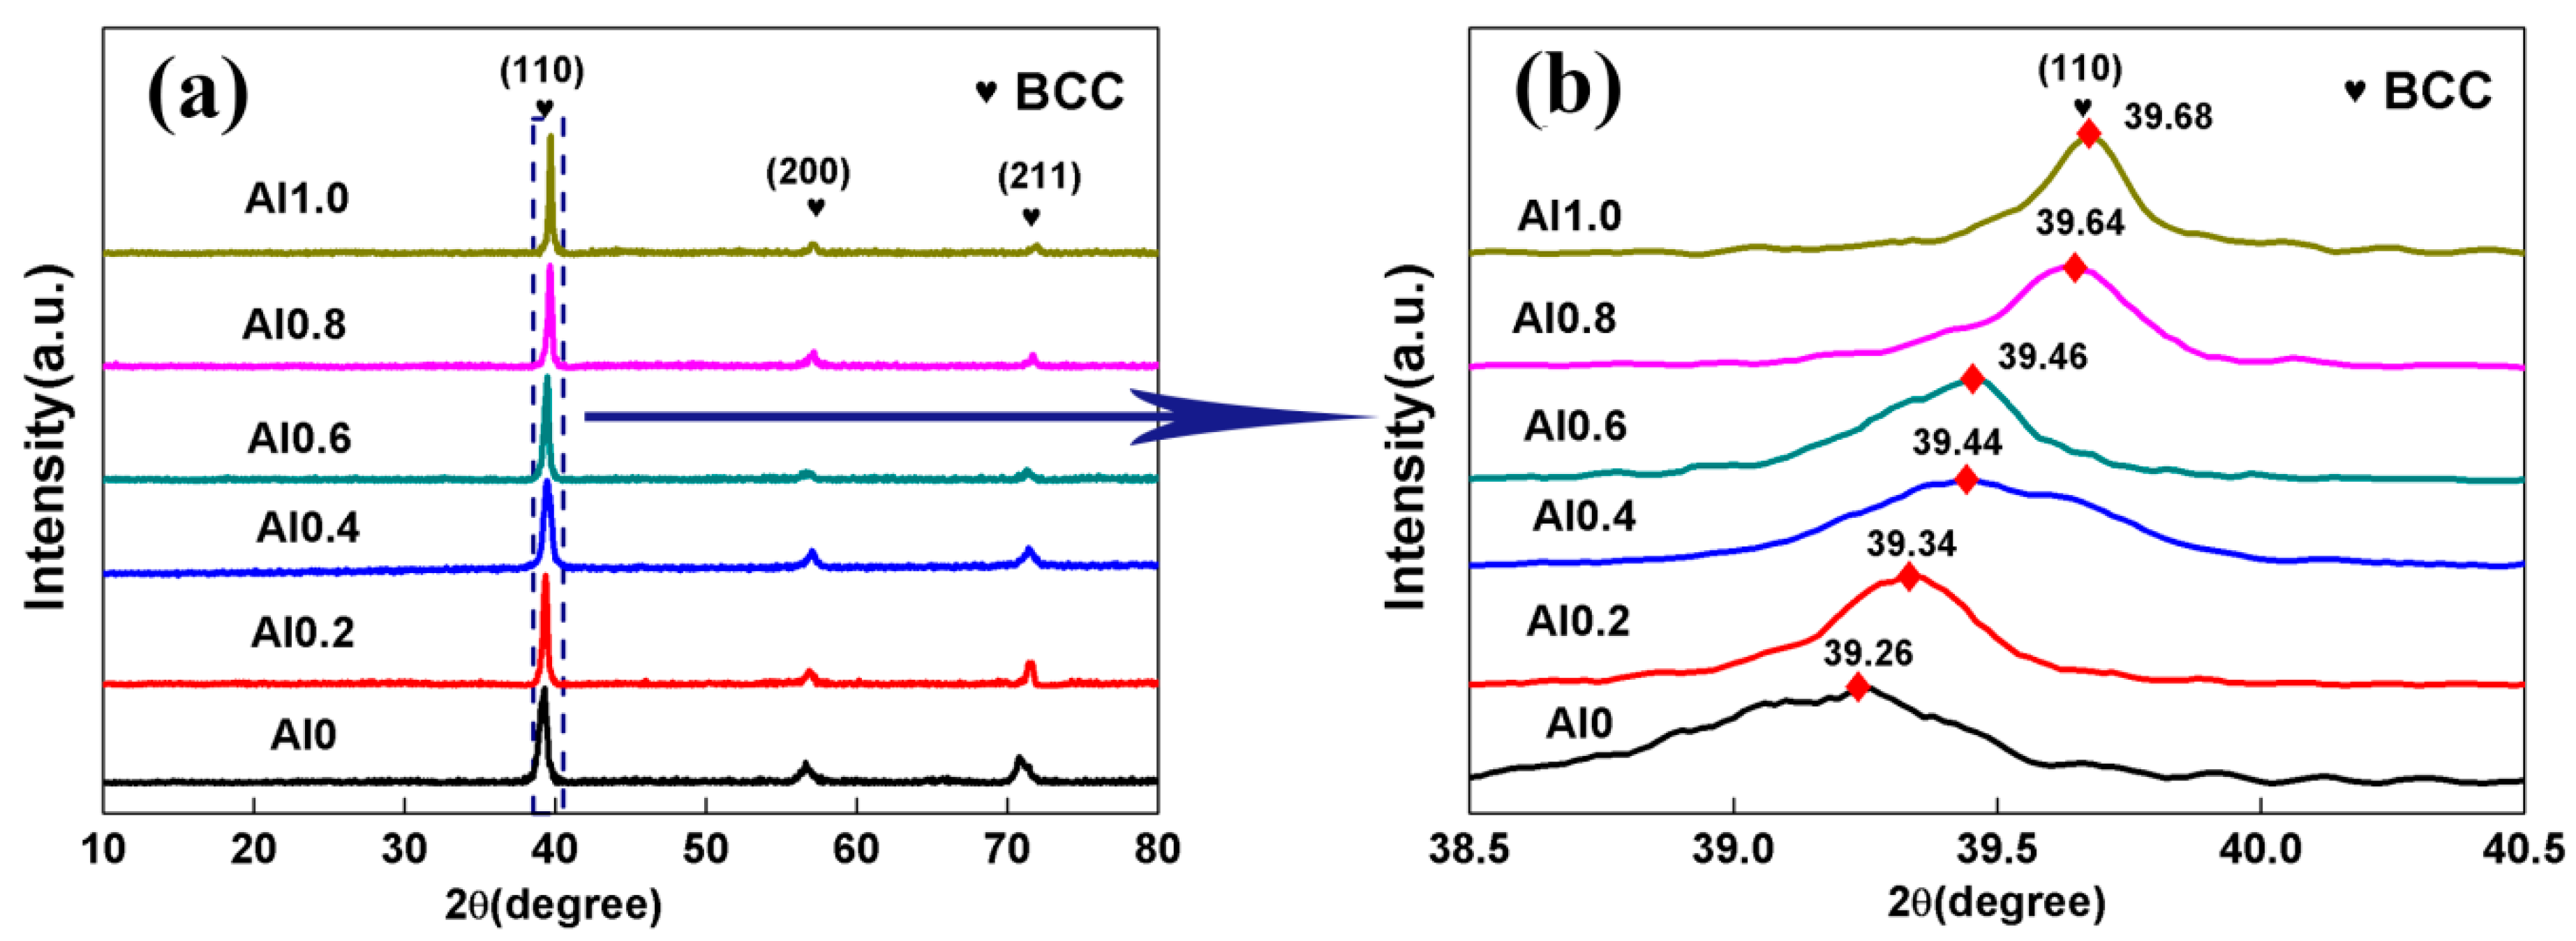
3.1. Microstructures of the TaNbVTiAlx RHEAs

Figure 2 shows the XRD patterns of the TaNbVTiAlx RHEAs. From Figure 2a, it can be seen that the TaNbVTiAlx RHEAs had three diffraction peaks, which corresponded to the (110), (200), and (211) crystal planes, respectively. The positions of these crystal planes were consistent with those of the diffraction peaks of a BCC single phase. Therefore, all the TaNbVTiAlx RHEAs exhibited a typical BCC solid solution microstructure. As shown in Figure 2b, the diffraction peak of the (110) shifted significantly from 39.26° to 39.68° as the Al content increased. It means that the (110) crystal plane lattice parameter gradually reduced with the increase of the Al content. Table 3 lists the crystal structures, calculated lattice parameters, theoretical lattice parameters, calculated melting temperatures, and theoretical densities of these alloys. The calculated lattice parameters were obtained based on the XRD results by a formula as follows [18]:
2 dsin θ = λ ,
d = a / h 2 + k 2 + l 2 ,
a = λ h 2 + k 2 + l 2 / ( 2 sin θ ) ,  
where d is the crystal surface spacing; θ is the diffraction angle; λ is the X-ray diffraction wavelength (λ = 1.5406 Å); a is the lattice constant; h, k, l are the crystal surface index.
In addition, the theoretical lattice parameter of these RHEAs can be calculated by the element’s theoretical lattice parameter of the RHEA. The calculation formula is as follows [19]:
a mix = i = 1 n c i a i ,
where ci is the content of the i component (at.%); ai is the lattice constant of the i component.
As seen in Table 3, with an increase of Al content, the calculated lattice parameter decreased from 3.243 Å to 3.210 Å, while the theoretical lattice parameter increased from 3.230 Å to 3.394 Å. The reason for the difference is that the p-layer saturated electron orbit of Al atom was easy to hybridize with the d-layer unsaturated electron orbit of transition metal to form a covalent bond, while the length of the covalent bond was small [20]. Therefore, with the increase of Al content, the hybrid effect was more obvious, and the lattice constant decreased. The atomic radius of Al is smaller than that of Ta, Nb, and Ti, and obviously larger than that of V. Moreover, the single-phase BCC solid solution structure was always present in these alloys, which indicated that Al could easily form a solid solution with the other elements, and enhance the high-entropy effect of the alloy. Therefore, the increase of the Al element led to the increase of lattice distortion, and eventually, led to the difference between calculated lattice parameters and theoretical lattice parameters. Similar results have been reported in NbTiMoVAlx RHEAs [18].
The theoretical densities of TaNbVTiAlx RHEAs were calculated by the following formula [21]:
ρ = c i   M i / c i M i ρ i ,
where the ci, Mi, and ρ i represent the concentration, molar mass, and theoretical density of the i component, respectively.
As the Al content increased, the density of the TaNbVTiAlx RHEAs decreased gradually from 9.16 g/cm3 of Al0 alloy to 7.89 g/cm3 of Al1.0 alloy, which was very close to that of nickel-based superalloys [22].
Figure 3 illustrates the inverse pole figure (IPF) and grain distribution maps of the TaNbVTiAlx RHEAs in the transverse direction. The average grain sizes were 69, 101, 106, 135, 147, and 187 μm for the Al0, Al0.2, Al0.4, Al0.6, Al08, and Al1.0, respectively. The results indicated that the higher the Al atom ratio, the larger the grain size of TaNbVTiAlx RHEAs, which may be because of the higher the atomic ratio of aluminum, the lower the melting point of the alloy. At the same sintering temperature, the lower the melting point of the alloy, the closer it was to the sintering temperature and the faster the grain growth rate, resulting in an increase of grain size. In addition, there were no obvious textures in the as-sintered RHEAs, as shown in Figure 3. Figure 4 shows the EPMA results of the TaNbVTiAl1.0 RHEA. It can be found that the distribution map of all elements shows a single color without obvious bright spots. Therefore, the distribution of all elements was uniform and no significant segregation was observed.

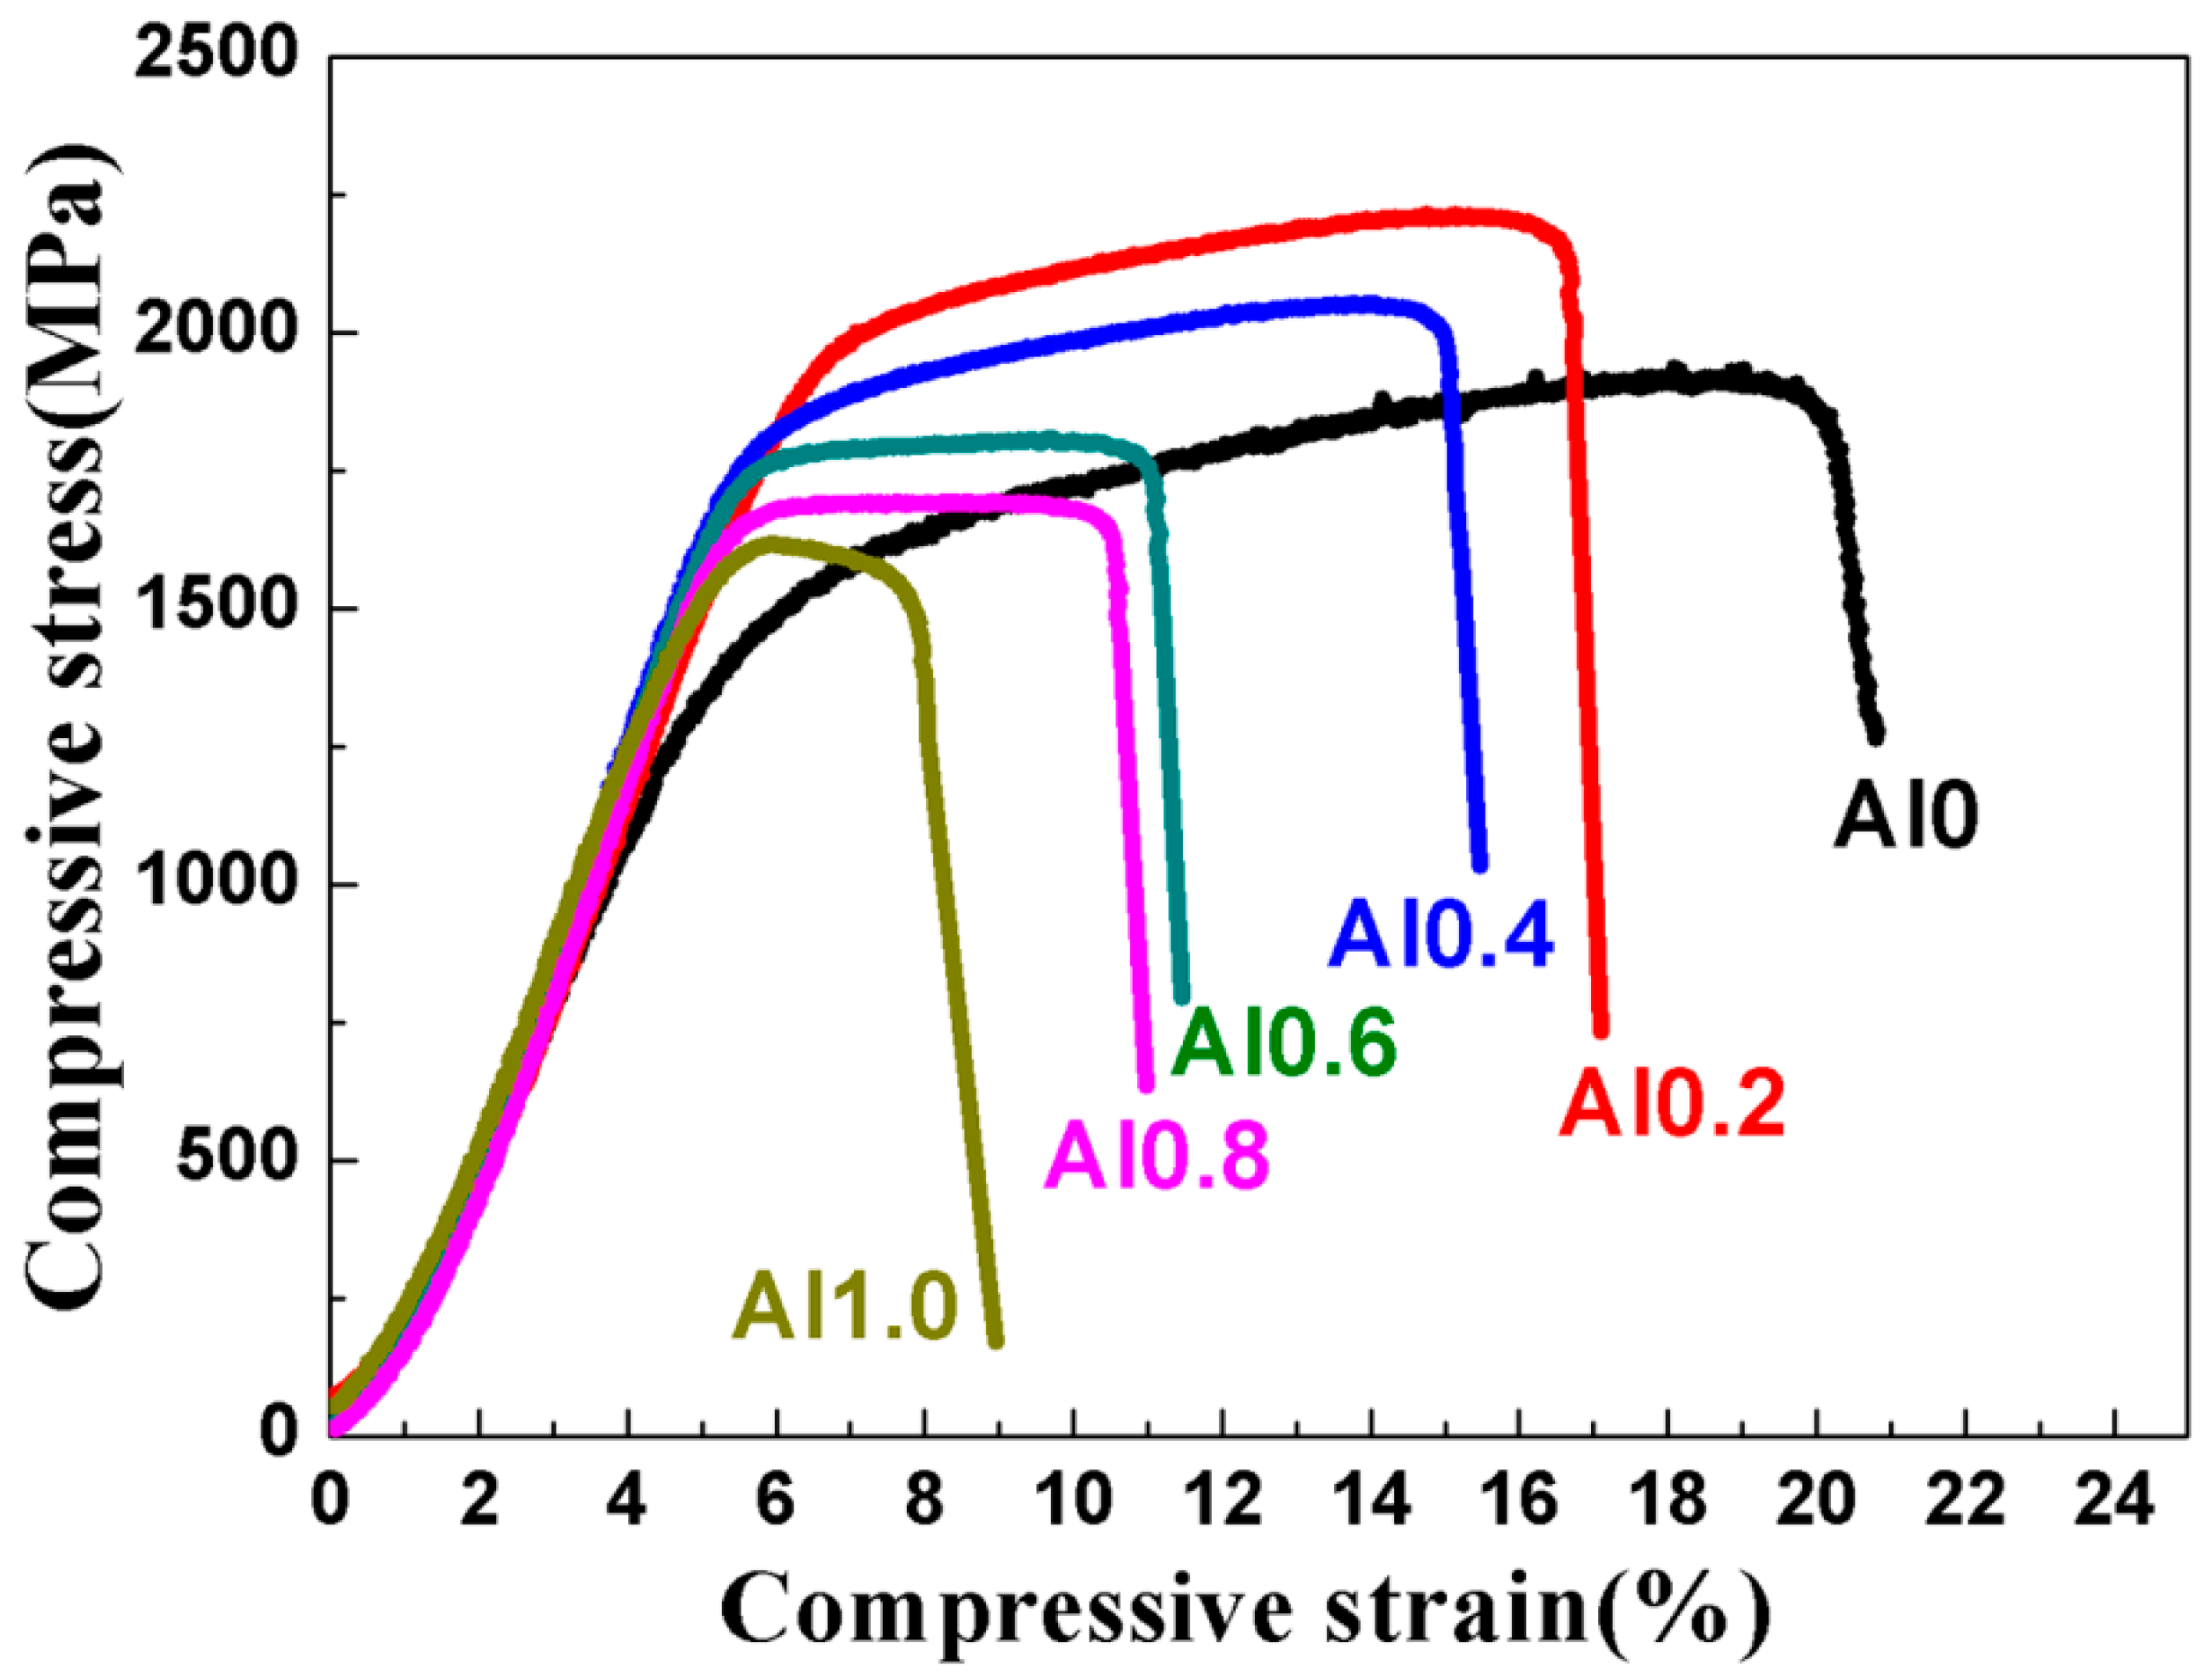
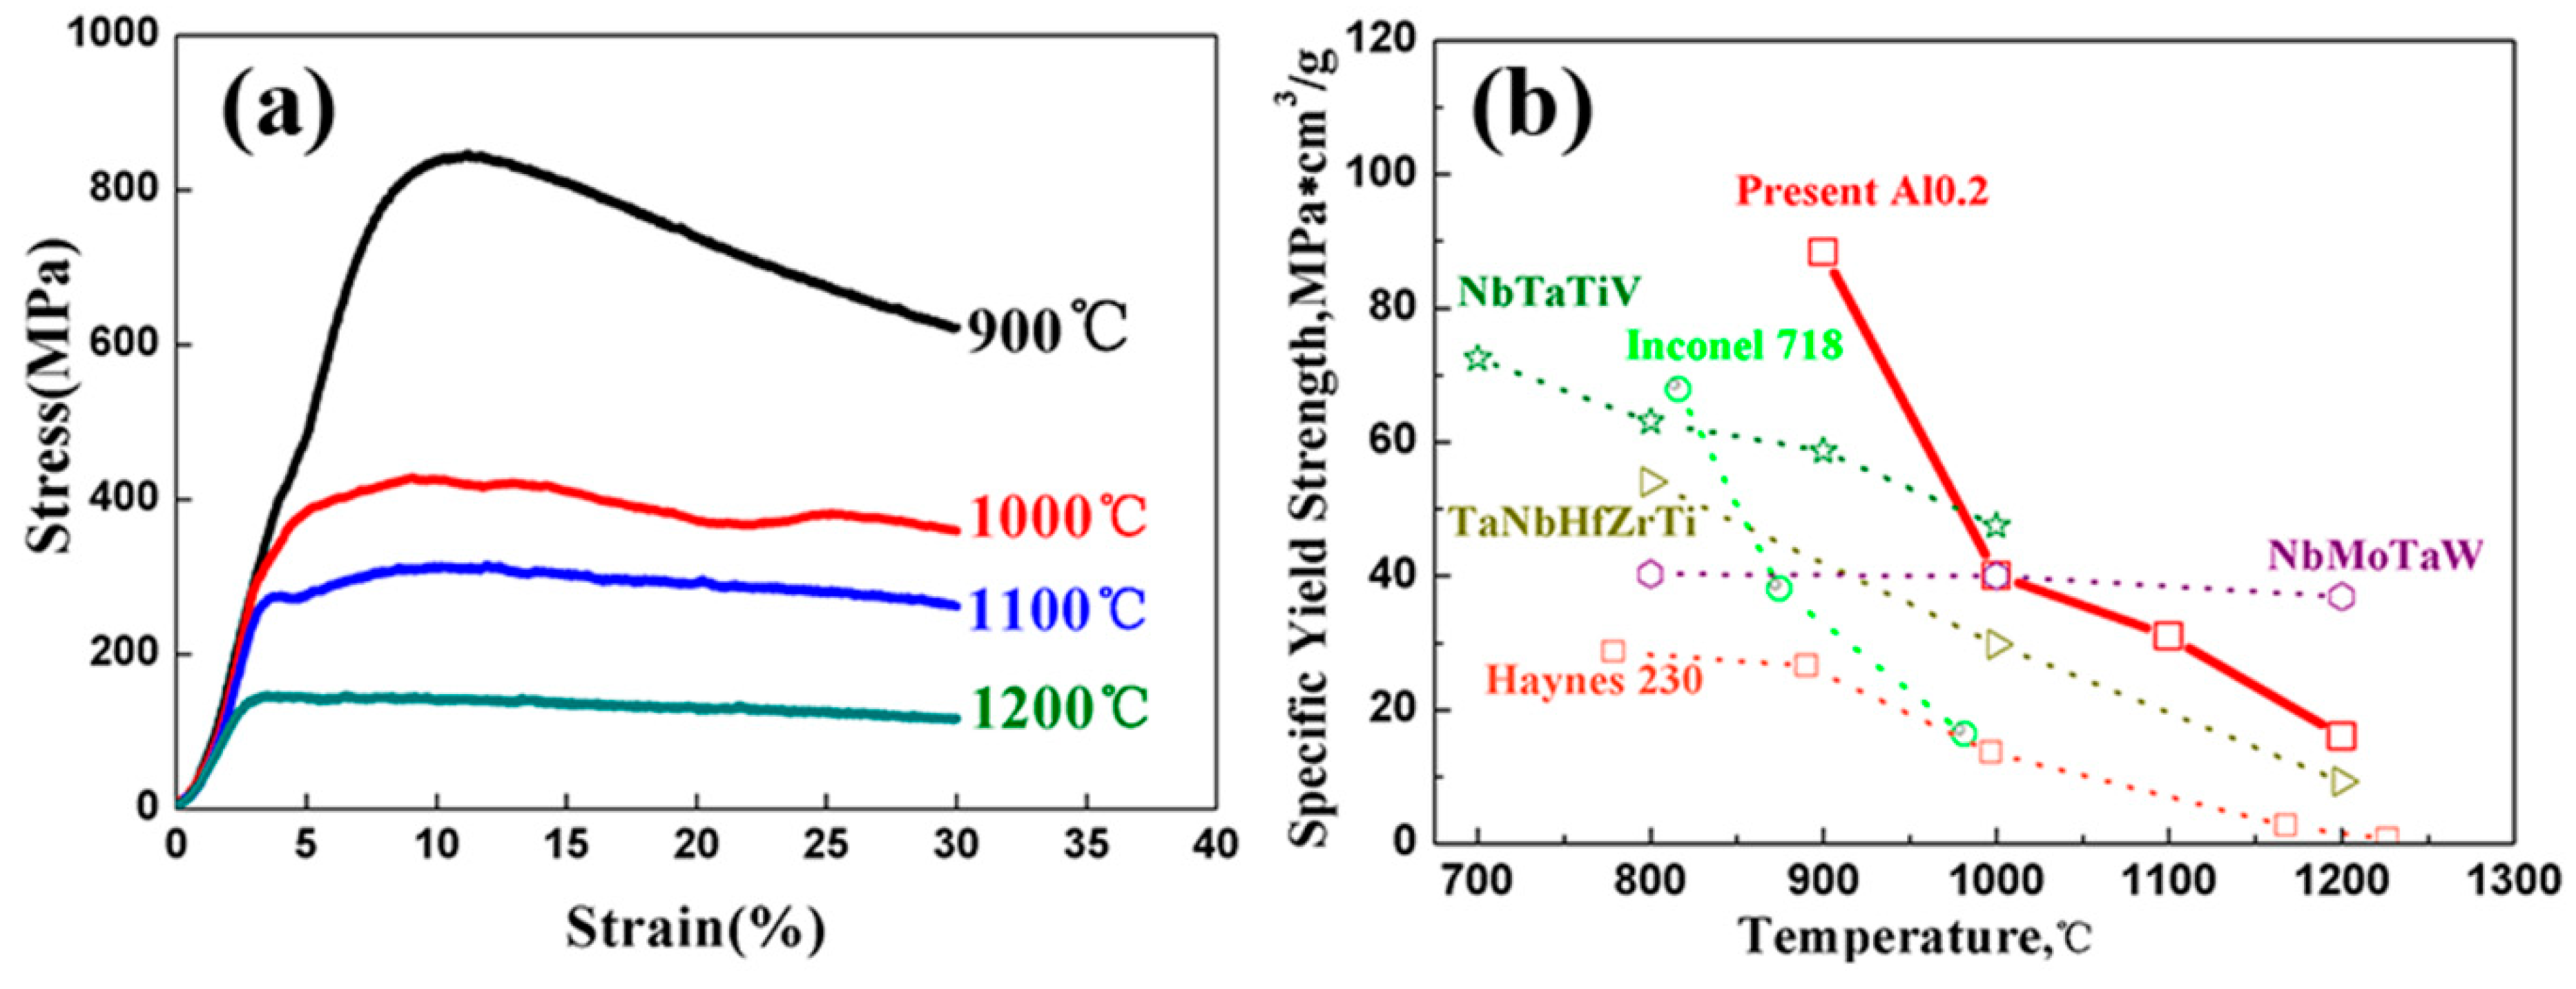
3.2. Mechanical Properties of the TaNbVTiAlx RHEAs

Figure 5 illustrates the room-temperature compressive stress–strain curves of the TaNbVTiAlx RHEAs. The yield strength, compressive strength, and plastic strain of the Al0 alloy were 1391 MPa, 1932 MPa, and 15%, respectively. With an increase in the Al content to Al0.2, the yield strength and compressive strength increased to 1835 MPa and 2217 MPa, indicating that the addition of Al alloy elements significantly improved the strength, while the compressive strain decreased to about 10%. With the further increase of Al content, a gradual decrease in compressive strength occurred, while the plasticity continued to decrease. When x = 1.0, the yield strength, compressive strength, and plastic strain decreased to only 1450 MPa, 1619 MPa, and 2.5%, respectively. Table 4 lists the mechanical properties of the typical RHEAs reported in the literature and this work. It is shown that the Al0.2 RHEA had the highest specific yield strength, which is higher than most of the RHEAs, such as NbMoTaW [3], TaNbHfZr [23], TiZrNbTa [19], TaNbHfZrTi [24], Al0.4Hf0.6NbTaTiZr [12], and Al0.21HfNbTiZr [25] RHEAs, with reasonable compressive plasticity of about 10%. Compared with NbTiVTaAlx [15] prepared by arc melting, the specific strength was greatly improved. Figure 6 shows the morphologies of the fracture surface of the TaNbVTiAlx RHEAs. The fracture surfaces of all the RHEAs show classic rivers and step shapes, suggesting that the fracture mode was a typical brittle cleavage fracture.
Figure 7 shows the high-temperature compressive properties of the Al0.2 RHEA. It is shown that the Al0.2 alloy had a yield strength of 783 MPa at 900 °C (specific yield strength was about 88.37 MPa*cm3/g). As can be seen from Figure 7b, the high-temperature (<1000 °C) specific strength was better than that of the typical NbMoTaW RHEA [3], TaNbHfZrTi RHEA [26], NbTaTiV RHEA [11], Ni-based IN718 alloy, and Haynes 230 alloy [3]. This is because the single-phase BCC structure with multiple components and melting elements had slower element diffusion at higher temperatures [27]. Therefore, the high-temperature softening resistance of the alloy could be improved. At 1200 °C, the Al0.2 RHEA still kept a yield strength of 142 MPa, suggesting that the material has the possibility for use at high temperatures (>1200 °C).

4. Discussion

4.1. Phase Prediction

Predicting the phase structure of high-entropy alloys (HEAs) is a challenging task. At present, researchers have found a semiempirical method to determine the generation of a solid solution in HEAs [28]. According to the literature, the main factors affecting structures are as follows: the enthalpy of mixing (−15 kJ/mol ≤ ΔHmix ≤ 5 kJ/mol), radius asymmetry (δ < 6.6%) and entropy/enthalpy ratio (Ω > 1.1) [29,30]. Studies have [31,32] calculated the valence electron concentration (VEC) values through the relevant parameters of the HEAs, thereby obtaining the structure type of the solid solution. When the VEC ≤ 6.87, the HEAs generally exhibit BCC solid solution structure. If the VEC is between 6.78 and 8, they usually show a BCC + FCC two-phase solid solution structure. While when the VEC ≥ 8, the HEAs are mainly FCC solid solution phase. The calculation formula for the main parameters is as follows [33]:
Ideal   entropy   of   mixing ,   Δ S mix = R i = 1 N c i lnc i
Enthalpy   of   mixing ,   Δ H mix = 4 i = 1 , j i N ( Δ H mix ) ij c i c j
Mean   melting   temperature ,   T m = i = 1 N c i ( T m ) i
Entropy / enthalpy   ratio ,   Ω = T m Δ S mix | Δ H mix |
Valence   electron   concentration ,   VEC = i = 1 N c i VEC i
Radius   asymmetry ,   δ = i = 1 N c i ( 1 r i   r ¯ ) 2
where i and j represent different component elements; R is expressed as the gas constant (8.314 J/(K*mol)); ci and cj are the atomic fraction of the i and j component in the alloy; (ΔHmix)ij is the enthalpy of mixing of the two elements i and j [34]; (Tm)i is the theoretical melting temperature of the i component element; VECi is the valence electron concentration of the i component element [31].
Referring to the above semiempirical criteria, the calculation results of TaNbVTiAlx RHEAs are shown in Table 5. It is shown that all the TaNbVTiAlx RHEAs were located in the region of BCC solid solution. The prediction results were basically consistent with the conclusions of this study.

4.2. Strengthening Mechanism

The TaNbVTiAlx RHEAs prepared by a P/M method exhibited high specific strength and reasonable plasticity both at room temperature and high temperature. The high yield strength of the RHEAs may have come from the uniform microstructure and the solid solution strengthening effect, while the reasonable plasticity may have resulted from the ductile TaNbVTi matrix, which has similar BCC microstructure.
The yield strength and compressive strength of the TaNbVTiAlx RHEAs first increased and then decreased with the increase of Al content. Compression plasticity was decreasing. The Al0.2 RHEA had the highest yield strength and compressive strength. According to the traditional theory of solution strengthening [15], the yield strength should increase with the increase of Al content, but the actual situation was different. This shows that the traditional solid solution strengthening theory cannot fully explain the relationship between strength and solute Al. Moreover, Al atoms formed covalent bonds with other alloy atoms, which made the strengthening method more complex.
In addition to solution strengthening, the effect of grain size should also be considered. Fine grains can produce fine grain strengthening benefits. With the increase of Al content, the grain size increased from 69 μm to 187 μm. This is one reason for the decrease in strength and plasticity. This change in compressive strength may have been caused by the change in lattice constant, which resulted from the addition of element Al. The higher the Al content, the smaller the lattice constant of TaNbVTiAlx RHEAs. With the increase of Al content, the effect of covalent bond formed by the hybridization of p-layer saturated electron orbit and d-layer orbit of transition metal was more obvious. The covalent bond had a small length, which led to the decrease of the lattice constant. The change trend of the lattice constant was consistent with that of crystal surface spacing. As the Al content increased, the lattice constant decreased, so the interplanar spacing became smaller and the dislocation became more difficult to slip, making the yield strength increase [35,36]. When the Al content exceeded Al0.2, continuing to increase the Al content and lowering the interplanar spacing may have made the dislocations difficult to move, and thus generated dislocation accumulation and local stress concentration. When the stress concentration cannot be released, the alloy will break. This may be the main reason why the compressive strength and compression plasticity of TaNbVTiAlx RHEAs decreased when the Al content exceeded Al0.2. These results are highly consistent with the as-cast TaNbVTiAlx [15] and NbTiMoVAlx [18] RHEAs.

5. Conclusions

  • The P/M TaNbVTiAlx RHEAs showed a simple BCC microstructure with no obvious segregation. The average grain sizes were 69, 101, 106, 135, 147, and 187 μm for the Al0, Al0.2, Al0.4, Al0.6, Al0.8, and Al1.0 RHEAs, respectively.
  • The P/M TaNbVTiAlx RHEAs showed excellent room-temperature specific strength (207.11 MPa*cm3/g) and high-temperature specific strength (88.37 MPa*cm3/g at 900 °C and 16.03 MPa*cm3/g at 1200 °C) with reasonable plasticity, suggesting that the material has the possibility for use at high temperatures > 1200 °C.
  • The reasons for the excellent mechanical properties of the P/M TaNbVTiAl0.2 RHEA were the uniform microstructure and solid solution strengthening effect.

Author Contributions

Conceptualization, W.G., B.L., and J.L.; methodology, L.X., A.F., and Q.F.; validation, L.X., W.G., A.F., and Q.F.; formal analysis, L.X., B.L., and J.L.; investigation, L.X.; resources, L.X., B.L., and Y.L.; data curation, L.X.; writing—original draft preparation, L.X., W.G., and B.L.; writing—review and editing, L.X., W.G., and B.L.; visualization, L.X. and Q.F.; supervision, B.L. and J.L.; project administration, B.L.; funding acquisition, B.L. and Y.L. All authors have read and agreed to the published version of the manuscript.

Funding

This research received no external funding.

Acknowledgments

The authors would like to thank financial supports from National Natural Science Foundation of China (51771232), National Key Research and Development Plan of China (2016YFB0700302), Hunan Natural Science Foundation of China (2018JJ3477), and Research Foundation of Education Bureau of Hunan Province (17B237).

Conflicts of Interest

The authors declare no conflict of interest.

References

  1. Chen, J.; Zhou, X.; Wang, W.; Liu, B.; Lv, Y.; Yang, W.; Xu, D.; Liu, Y. A review on fundamental of high entropy alloys with promising high–temperature properties. J. Alloys Compd. 2018, 760, 15–30. [Google Scholar] [CrossRef]
  2. Yeh, J.-W.; Chen, S.-K.; Lin, S.-J.; Gan, J.-Y.; Chin, T.-S.; Shun, T.-T.; Tsau, C.-H.; Chang, S.-Y. Nanostructured High-Entropy Alloys with Multiple Principal Elements: Novel Alloy Design Concepts and Outcomes. Adv. Eng. Mater. 2004, 6, 299–303. [Google Scholar] [CrossRef]
  3. Senkov, O.N.; Wilks, G.B.; Scott, J.M.; Miracle, D.B. Mechanical properties of Nb25Mo25Ta25W25 and V20Nb20Mo20Ta20W20 refractory high entropy alloys. Intermetallics 2011, 19, 698–706. [Google Scholar] [CrossRef]
  4. Yao, H.; Qiao, J.-W.; Gao, M.; Hawk, J.; Ma, S.-G.; Zhou, H.; Yao, H.; Qiao, J.-W.; Gao, M.C.; Hawk, J.A.; et al. MoNbTaV Medium-Entropy Alloy. Entropy 2016, 18, 189. [Google Scholar] [CrossRef] [Green Version]
  5. Han, Z.D.; Luan, H.W.; Liu, X.; Chen, N.; Li, X.Y.; Shao, Y.; Yao, K.F. Microstructures and mechanical properties of TixNbMoTaW refractory high-entropy alloys. Mater. Sci. Eng. A 2018, 712, 380–385. [Google Scholar] [CrossRef]
  6. Fu, A.; Guo, W.; Liu, B.; Cao, Y.; Xu, L.; Fang, Q.; Yang, H.; Liu, Y. A particle reinforced NbTaTiV refractory high entropy alloy based composite with attractive mechanical properties. J. Alloys Compd. 2020, 815, 152466. [Google Scholar] [CrossRef]
  7. Li, T.; Liu, B.; Liu, Y.; Guo, W.; Fu, A.; Li, L.; Yan, N.; Fang, Q. Microstructure and Mechanical Properties of Particulate Reinforced NbMoCrTiAl High Entropy Based Composite. Entropy 2018, 20, 517. [Google Scholar] [CrossRef] [Green Version]
  8. Han, Z.; Liu, X.; Zhao, S.; Shao, Y.; Li, J.; Yao, K. Microstructure, phase stability and mechanical properties of Nb–Ni–Ti–Co–Zr and Nb–Ni–Ti–Co–Zr–Hf high entropy alloys. Prog. Nat. Sci. Mater. Int. 2015, 25, 365–369. [Google Scholar] [CrossRef] [Green Version]
  9. Chen, R.; Qin, G.; Zheng, H.; Wang, L.; Su, Y.; Chiu, Y.; Ding, H.; Guo, J.; Fu, H. Composition design of high entropy alloys using the valence electron concentration to balance strength and ductility. Acta Mater. 2018, 144, 129–137. [Google Scholar] [CrossRef]
  10. Sheikh, S.; Shafeie, S.; Hu, Q.; Ahlström, J.; Persson, C.; Veselý, J.; Zýka, J.; Klement, U.; Guo, S. Alloy design for intrinsically ductile refractory high-entropy alloys. J. Appl. Phys. 2016, 120, 164902. [Google Scholar] [CrossRef] [Green Version]
  11. Guo, W.; Liu, B.; Liu, Y.; Li, T.; Fu, A.; Fang, Q.; Nie, Y. Microstructures and mechanical properties of ductile NbTaTiV refractory high entropy alloy prepared by powder metallurgy. J. Alloys Compd. 2019, 776, 428–436. [Google Scholar] [CrossRef]
  12. Senkov, O.N.; Senkova, S.V.; Woodward, C. Effect of aluminum on the microstructure and properties of two refractory high-entropy alloys. Acta Mater. 2014, 68, 214–228. [Google Scholar] [CrossRef]
  13. Yurchenko, N.Y.; Stepanov, N.D.; Shaysultanov, D.G.; Tikhonovsky, M.A.; Salishchev, G.A. Effect of Al content on structure and mechanical properties of the AlxCrNbTiVZr (x=0; 0.25; 0.5; 1) high-entropy alloys. Mater. Charact. 2016, 121, 125–134. [Google Scholar] [CrossRef]
  14. Xu, Z.Q.; Ma, Z.L.; Wang, M.; Chen, Y.W.; Tan, Y.D.; Cheng, X.W. Design of novel low-density refractory high entropy alloys for high-temperature applications. Mater. Sci. Eng. A 2019, 755, 318–322. [Google Scholar] [CrossRef]
  15. Yang, X.; Zhang, Y.; Liaw, P.K. Microstructure and Compressive Properties of NbTiVTaAlx High Entropy Alloys. Procedia Eng. 2012, 36, 292–298. [Google Scholar] [CrossRef] [Green Version]
  16. Cao, Y.; Liu, Y.; Liu, B.; Zhang, W. Precipitation behavior during hot deformation of powder metallurgy Ti-Nb-Ta-Zr-Al high entropy alloys. Intermetallics 2018, 100, 95–103. [Google Scholar] [CrossRef]
  17. Kang, B.; Lee, J.; Ryu, H.J.; Hong, S.H. Microstructure, mechanical property and Hall-Petch relationship of a light-weight refractory Al0.1CrNbVMo high entropy alloy fabricated by powder metallurgical process. J. Alloys Compd. 2018, 767, 1012–1021. [Google Scholar] [CrossRef]
  18. Chen, S.; Yang, X.; Dahmen, K.; Liaw, P.; Zhang, Y. Microstructures and Crackling Noise of AlxNbTiMoV High Entropy Alloys. Entropy 2014, 16, 870–884. [Google Scholar] [CrossRef] [Green Version]
  19. Nguyen, V.T.; Qian, M.; Shi, Z.; Song, T.; Huang, L.; Zou, J. A novel quaternary equiatomic Ti-Zr-Nb-Ta medium entropy alloy (MEA). Intermetallics 2018, 101, 39–43. [Google Scholar] [CrossRef]
  20. Lin, C.M.; Juan, C.C.; Chang, C.H.; Tsai, C.W.; Yeh, J.W. Effect of Al addition on mechanical properties and microstructure of refractory AlxHfNbTaTiZr alloys. J. Alloys Compd. 2015, 624, 100–107. [Google Scholar] [CrossRef]
  21. Senkov, O.N.; Wilks, G.B.; Miracle, D.B.; Chuang, C.P.; Liaw, P.K. Refractory high-entropy alloys. Intermetallics 2010, 18, 1758–1765. [Google Scholar] [CrossRef]
  22. Wu, H.; Zhuang, X.; Nie, Y.; Li, Y.; Jiang, L. Effect of heat treatment on mechanical property and microstructure of a powder metallurgy nickel-based superalloy. Mater. Sci. Eng. A 2019, 754, 29–37. [Google Scholar] [CrossRef]
  23. Maiti, S.; Steurer, W. Structural-disorder and its effect on mechanical properties in single-phase TaNbHfZr high-entropy alloy. Acta Mater. 2016, 106, 87–97. [Google Scholar] [CrossRef]
  24. Senkov, O.N.; Scott, J.M.; Senkova, S.V.; Miracle, D.B.; Woodward, C.F. Microstructure and room temperature properties of a high-entropy TaNbHfZrTi alloy. J. Alloys Compd. 2011, 509, 6043–6048. [Google Scholar] [CrossRef]
  25. Wu, Y.; Si, J.; Lin, D.; Wang, T.; Wang, W.Y.; Wang, Y.; Liu, Z.; Hui, X. Phase stability and mechanical properties of AlHfNbTiZr high-entropy alloys. Mater. Sci. Eng. A 2018, 724, 249–259. [Google Scholar] [CrossRef]
  26. Senkov, O.N.; Scott, J.M.; Senkova, S.V.; Meisenkothen, F.; Miracle, D.B.; Woodward, C.F. Microstructure and elevated temperature properties of a refractory TaNbHfZrTi alloy. J. Mater. Sci. 2012, 47, 4062–4074. [Google Scholar] [CrossRef]
  27. Lee, C.; Song, G.; Gao, M.C.; Feng, R.; Chen, P.; Brechtl, J.; Chen, Y.; An, K.; Guo, W.; Poplawsky, J.D.; et al. Lattice distortion in a strong and ductile refractory high-entropy alloy. Acta Mater. 2018, 160, 158–172. [Google Scholar] [CrossRef]
  28. Dong, Y.; Lu, Y.; Jiang, L.; Wang, T.; Li, T. Effects of electro-negativity on the stability of topologically close-packed phase in high entropy alloys. Intermetallics 2014, 52, 105–109. [Google Scholar] [CrossRef]
  29. Zhang, Y.; Zhou, Y.J.; Lin, J.P.; Chen, G.L.; Liaw, P.K. Solid-Solution Phase Formation Rules for Multi-component Alloys. Adv. Eng. Mater. 2008, 10, 534–538. [Google Scholar] [CrossRef]
  30. Zhang, Y.; Yang, X.; Liaw, P.K. Alloy Design and Properties Optimization of High-Entropy Alloys. JOM 2012, 64, 830–838. [Google Scholar] [CrossRef]
  31. Guo, S.; Ng, C.; Lu, J.; Liu, C.T. Effect of valence electron concentration on stability of fcc or bcc phase in high entropy alloys. J. Appl. Phys. 2011, 109, 103505. [Google Scholar] [CrossRef] [Green Version]
  32. Guo, S.; Liu, C.T. Phase stability in high entropy alloys: Formation of solid-solution phase or amorphous phase. Prog. Nat. Sci. Mater. Int. 2011, 21, 433–446. [Google Scholar] [CrossRef] [Green Version]
  33. Rickman, J.M.; Chan, H.M.; Harmer, M.P.; Smeltzer, J.A.; Marvel, C.J.; Roy, A.; Balasubramanian, G. Materials informatics for the screening of multi-principal elements and high-entropy alloys. Nat. Commun. 2019, 10, 2618. [Google Scholar] [CrossRef] [PubMed] [Green Version]
  34. Takeuchi, A.; Inoue, A. Classification of Bulk Metallic Glasses by Atomic Size Difference, Heat of Mixing and Period of Constituent Elements and Its Application to Characterization of the Main Alloying Element. Mater. Trans. 2005, 46, 2817–2829. [Google Scholar] [CrossRef] [Green Version]
  35. Lu, G. The Peierls—Nabarro Model of Dislocations: A Venerable Theory and its Current Development. Handb. Mater. Model. 2005, 1, 1–19. [Google Scholar]
  36. Liu, J.; Chen, C.; Xu, Y.; Wu, S.; Wang, G.; Wang, H.; Fang, Y.; Meng, L. Deformation twinning behaviors of the low stacking fault energy high-entropy alloy: An in-situ TEM study. Scr. Mater. 2017, 137, 9–12. [Google Scholar] [CrossRef]
Figure 1. Morphologies of the raw powders. (a) Ta, (b) Nb, (c) V, (d) Ti, and (e) Al.
Entropy 22 00282 g001
Figure 2. (a) XRD patterns of the TaNbVTiAlx RHEAs; (b) the enlarged (110) peaks.
Entropy 22 00282 g002
Figure 3. Inverse pole figure (IPF) and grain size distribution maps of the TaNbVTiAlx RHEAs: (a) Al0, (b) Al0.2, (c) Al0.4, (d) Al0.6, (e) Al0.8, and (f) Al1.0.
Entropy 22 00282 g003
Figure 4. Electron probe microanalysis (EPMA) results of the sintered Al1.0 RHEA: (a) SEM image, (b) Ta, (c) Nb, (d) V, (e) Ti, and (f) Al.
Entropy 22 00282 g004
Figure 5. Room-temperature compressive stress–strain curves of the TaNbVTiAlx RHEAs.
Entropy 22 00282 g005
Figure 6. Fracture morphologies of the TaNbVTiAlx RHEAs at room temperature: (a) Al0, (b) Al0.2, (c) Al0.4, (d) Al0.6, (e) Al0.8, and (f) Al1.0.
Entropy 22 00282 g006
Figure 7. (a) High-temperature compressive stress–strain curves of Al0.2 RHEA at 900 °C–1200 °C and (b) comparison of high-temperature mechanical properties of several typical high-temperature alloys and the present Al0.2 RHEA.
Entropy 22 00282 g007
Table 1. The theoretical composition of the TaNbVTiAlx refractory high-entropy alloys (RHEAs) (in at.%).
AlloysTa (at.%)Nb (at.%)V (at.%)Ti (at.%)Al (at.%)
Al0252525250
Al0.223.8123.8123.8123.814.76
Al0.422.7322.7322.7322.739.09
Al0.621.7421.7421.7421.7413.04
Al0.820.8320.8320.8320.8316.67
Al1.02020202020
Table 2. The characteristics of the raw powders.
Raw PowderAverage Particle Size (μm)O (wt.%)C (wt.%)H (wt.%)
Ta24.50.130.00640.0008
Nb26.10.340.02200.0015
V22.60.290.00960.0014
Ti29.00.280.01500.0147
Al18.60.270.02500.0017
Table 3. Crystal structures, calculated lattice parameters, theoretical lattice parameters, atomic radiuses, calculated melting temperatures, and theoretical densities of the TaNbVTiAlx RHEAs.
TaNbVTiAlAl0Al0.2Al0.4Al0.6Al0.8Al1.0
Crystal structureBCCBCCBCCHCPFCCBCCBCCBCCBCCBCCBCC
Calculated lattice parameter (Å)-----3.2433.2363.2283.2273.2133.210
Theoretical lattice parameter (Å)3.3033.3013.0393.2764.0503.2303.2693.3043.3373.3663.394
Atomic radius (Å)1.471.471.351.461.43------
Tm (K)3293275022021946933.5254824712401233722782225
ρ(g/cm3)16.658.576.114.512.709.168.868.588.338.107.89
Table 4. Room-temperature compressive properties of the RHEAs in the references and the present work.
MaterialsDensity (g/cm3)Preparation MethodsPhase StructureYield Strength (MPa)Fracture Strength (MPa)Plastic StrainSpecific Yield Strength (MPa*cm3/g)
NbMoTaW [3]13.7As-castBCC105812111.5%77.23
TaNbHfZr [23]11.1As-castBCC1315188521.6%118.47
TiZrNbTa [19]9.94As-castBCC1100-48%110.66
TaNbHfZrTi [24]9.9As-castBCC929->50%93.84
Al0.4Hf0.6NbTaTiZr [12]9.05As-castBCC18412269~5%203.43
Al0.21HfNbTiZr [25]8.12As-castBCC831915.2~20%102.34
NbTiVTa [15]9.16As-castBCC1092->50%119.21
NbTiVTaAl0.25 [15]8.78As-castBCC1330->50%151.48
NbTiVTa0.5 [15]8.45As-castBCC1012->50%119.76
NbTiVTa1.0 [15]7.89As-castBCC991->50%125.60
TaNbVTi9.16PMBCC1391193215%151.86
TaNbVTiAl0.28.86PMBCC1835221710%207.11
TaNbVTiAl0.48.58PMBCC171920549%200.35
TaNbVTiAl0.68.33PMBCC169718105.5%203.72
TaNbVTiAl0.88.10PMBCC160616955%198.27
TaNbVTiAl1.07.89PMBCC145016192.5%183.78
Table 5. The calculated values of ΔSmix, ΔHmix, Tm, Ω, valence electron concentration (VEC), and δ of the TaNbVTiAlx RHEAs.
AlloysΔSmix (J/K·mol)ΔHmix (kJ/mol)Tm(K)ΩVECδ (%)
Al011.53−0.252548117.514.753.53
Al0.212.57−3.9924717.784.673.44
Al0.413.01−7.0724014.424.593.37
Al0.613.24−9.6023373.224.523.29
Al0.813.35−11.7022782.604.463.23
Al1.013.38−13.4422252.224.403.16

