3.2. Elderly Group Exhibited Lower Modularity Values, Less Dense Modules, and More Separated Networks
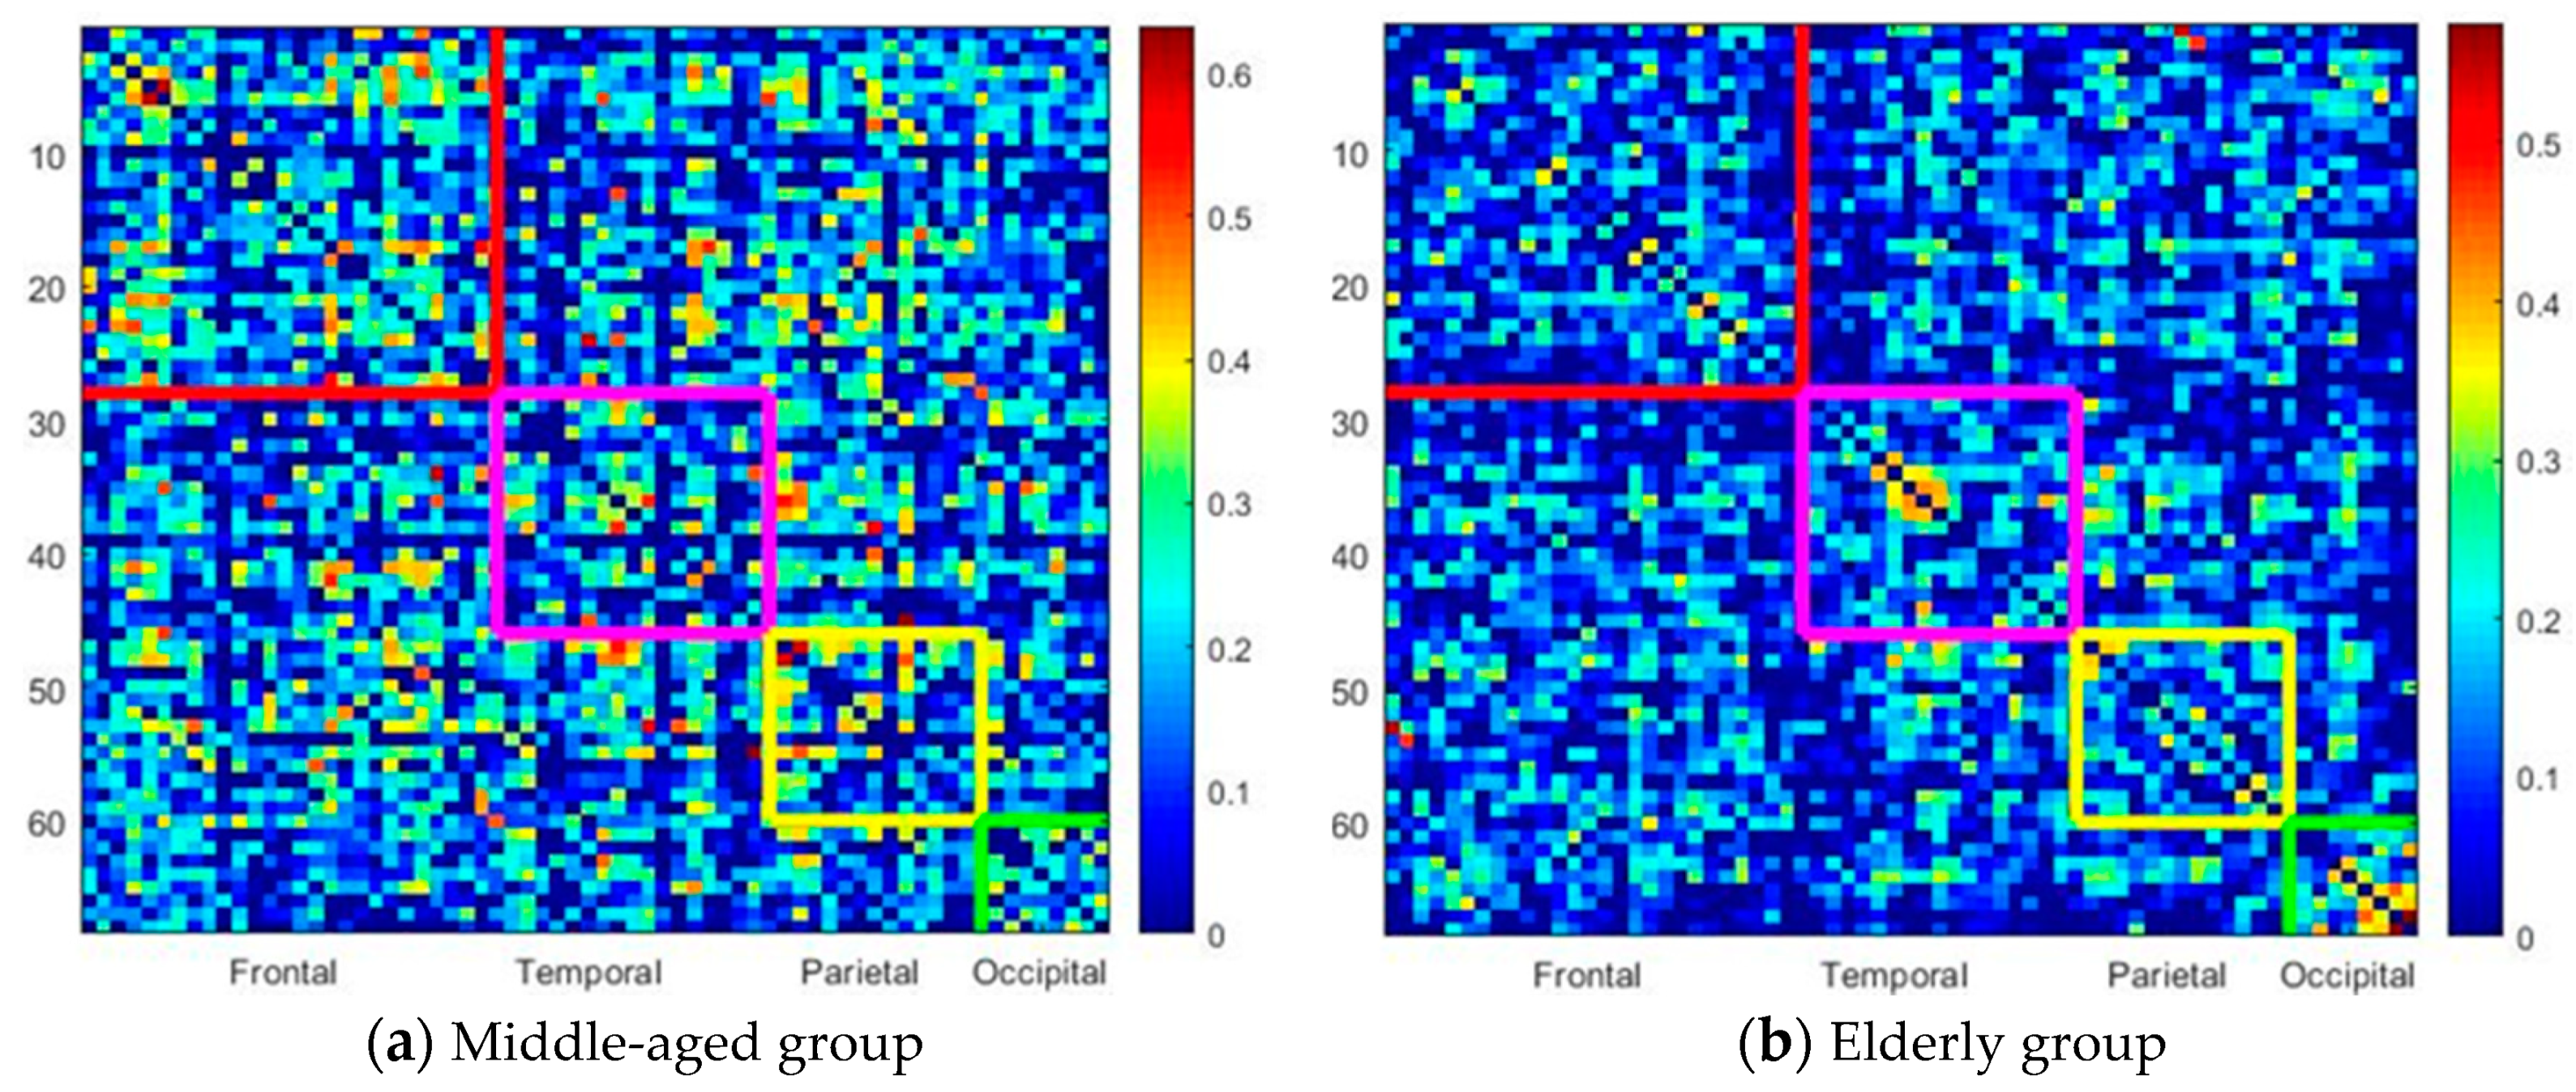
Figure 2 illustrates the correlation map of the rearranged Desikan–Killiany atlas between different lobes for the middle-aged (
Figure 2a) and elderly groups (
Figure 2b). The color bar indicates the intensity of the correlation, ranging from 0 (blue) to 1 (red). The subregions (ROIs) of frontal lobe regions are illustrated from 1 to 28 on the
x-axis and
y-axis (odd numbers denote ROIs in the left hemisphere and even numbers denote ROIs in the right hemisphere) and marked within the red squares. The temporal lobes are within the purple squares (
x-axis, 29:46;
y-axis, 29:46), the parietal lobes are within the blue squares (
x-axis, 47:60;
y-axis, 47:60), and the occipital lobes are within the green squares (
x-axis, 61:68;
y-axis, 61:68). Clearly, the elderly group has a sparse, less dense correlation map. The correlation ratios of each lobe in the elderly group are smaller than those in the middle-aged group. Compared with the middle-aged group, the elderly group reveals much sparser links (lower correlation ratio) between lobes, which may imply functional dissociation between lobes in the elderly group.
The brain modular networks for the middle-aged and elderly groups are summarized in
Table 3 and
Table 4, respectively. Both groups have five modules in the brain structural network. The brain structural network of the middle-aged group contained larger module (module 1, 22 nodes), three medium-sized modules (module 2, 14 nodes; module 3, 13 nodes; and module 4, 11 nodes), and one small module (module 5, 8 nodes). The elderly group exhibited network patterns differing from those of the middle-aged group. Their brain connecting links were less dense and could be grouped into one larger module (module 1, 19 nodes), two medium-sized modules (module 2 and module 3, 17 nodes), and two smaller modules (module 4, 8 nodes; module 5, 7 nodes). For each group, module 1 was the largest and the dominant module of the brain network.
3.3. Modular Structures of the Middle-Aged Adult Brain Network
The brain structural network in the middle-aged group has five functionally oriented modules. Module 1 in the middle-aged group contains 14 frontal nodes, 3 temporal nodes, 3 parietal nodes, and 2 occipital nodes. Module 1 contained four bilateral nodes (highlighted with underlining in
Table 3) of the frontal lobe (CACg(L,R), CMF(L,R), Tr(L,R) and PreC(L,R)) which mainly correspond to regions associated with cognitive and executive functions [
26,
34]. Module 2 comprises 14 regions, including the frontal, temporal, parietal, and occipital lobes, which are mainly related to sensorimotor, visual, and spatial functions. Module 3 comprises 13 nodes in the frontal, temporal, and parietal lobes, including parahippocampal (PaH), superior temporal (SM), and supramarginal (SM) regions, which may be related to mnemonic and emotional functions [
26]. We found that modules 1, 2, and 4 have at least one pair of bilateral node links, and the network modularity (
Q) value for the middle-aged group was 0.2307.
The elderly group exhibited network patterns different from those of the middle-aged group. Their brain connecting links were less dense, although after analysis of 1000 permutations, the parcellated cerebral regions of the elderly group could be grouped into five network modules, similarly to the middle-aged group. A reorganized structural network occurred in the elderly group. The elderly group revealed segregation in the module component size and a lower modularity value (Q) of 0.2234 (p < 0.01). The lower modularity value suggested that its networks are comparatively sparse and inefficient. Module 1 contains 19 nodes (ROIs), including 8 frontal nodes, 3 temporal nodes, 5 parietal nodes, and 3 occipital nodes. The frontal and parietal lobes are the major component nodes in module 1, and these nodes are functionally related to cognitive and executive functions. Module 2 comprises six frontal nodes, six temporal nodes, four parietal nodes, and one occipital node. We found that module 2 contains major temporal lobe nodes, which are associated with auditory, language, and mnemonic functions. The six frontal nodes in module 2 include PreC(L), PreC(R), and CACg(R), which are associated with cognitive and executive functions.
After permutation analysis, we found re-modularization of network modules in the elderly group. The elderly group showed decreased component size of the modules in their brain structural network. One larger module (19 nodes), two medium-sized modules (17 nodes), and two smaller modules (8 nodes and 7 nodes) were grouped in the brain structural network of the elderly group. The nodes contained in each module were reorganized and less overlapped than the ones contained in the module of the middle-aged group. For instance, only four frontal nodes (Or(L), RoACg(R), Ins(L), and CMF(R)) in module 1 of the middle-aged group were included in module 1 of the elderly group. Nodes in module 1 of the middle-aged group were remodularized and separated into modules 1, 2, and 3 in the elderly group. Seven nodes (CMF(L),PreC(L) PreC(R),CACg(R),Tr(R), MT(L), PoCg(R), and PerCa(L)) in module 1 of the middle-aged group were grouped to module 2 of the elderly group. Another six nodes (CACg(L), LOrF(L), PaC(L), Tr(L), MT(L), and Lg(L)) in module 1 of the middle-aged group were grouped into module 3 of the elderly group. We further found only two modules (modules 1 and 2) in the elderly group to have at least one pair of bilateral nodes. The network modularity (Q) for the middle-aged group was 0.2307, whereas it was lower in the elderly group (0.2234; p < 0.01), suggesting that the networks in the elderly group were comparatively less dense and efficient.
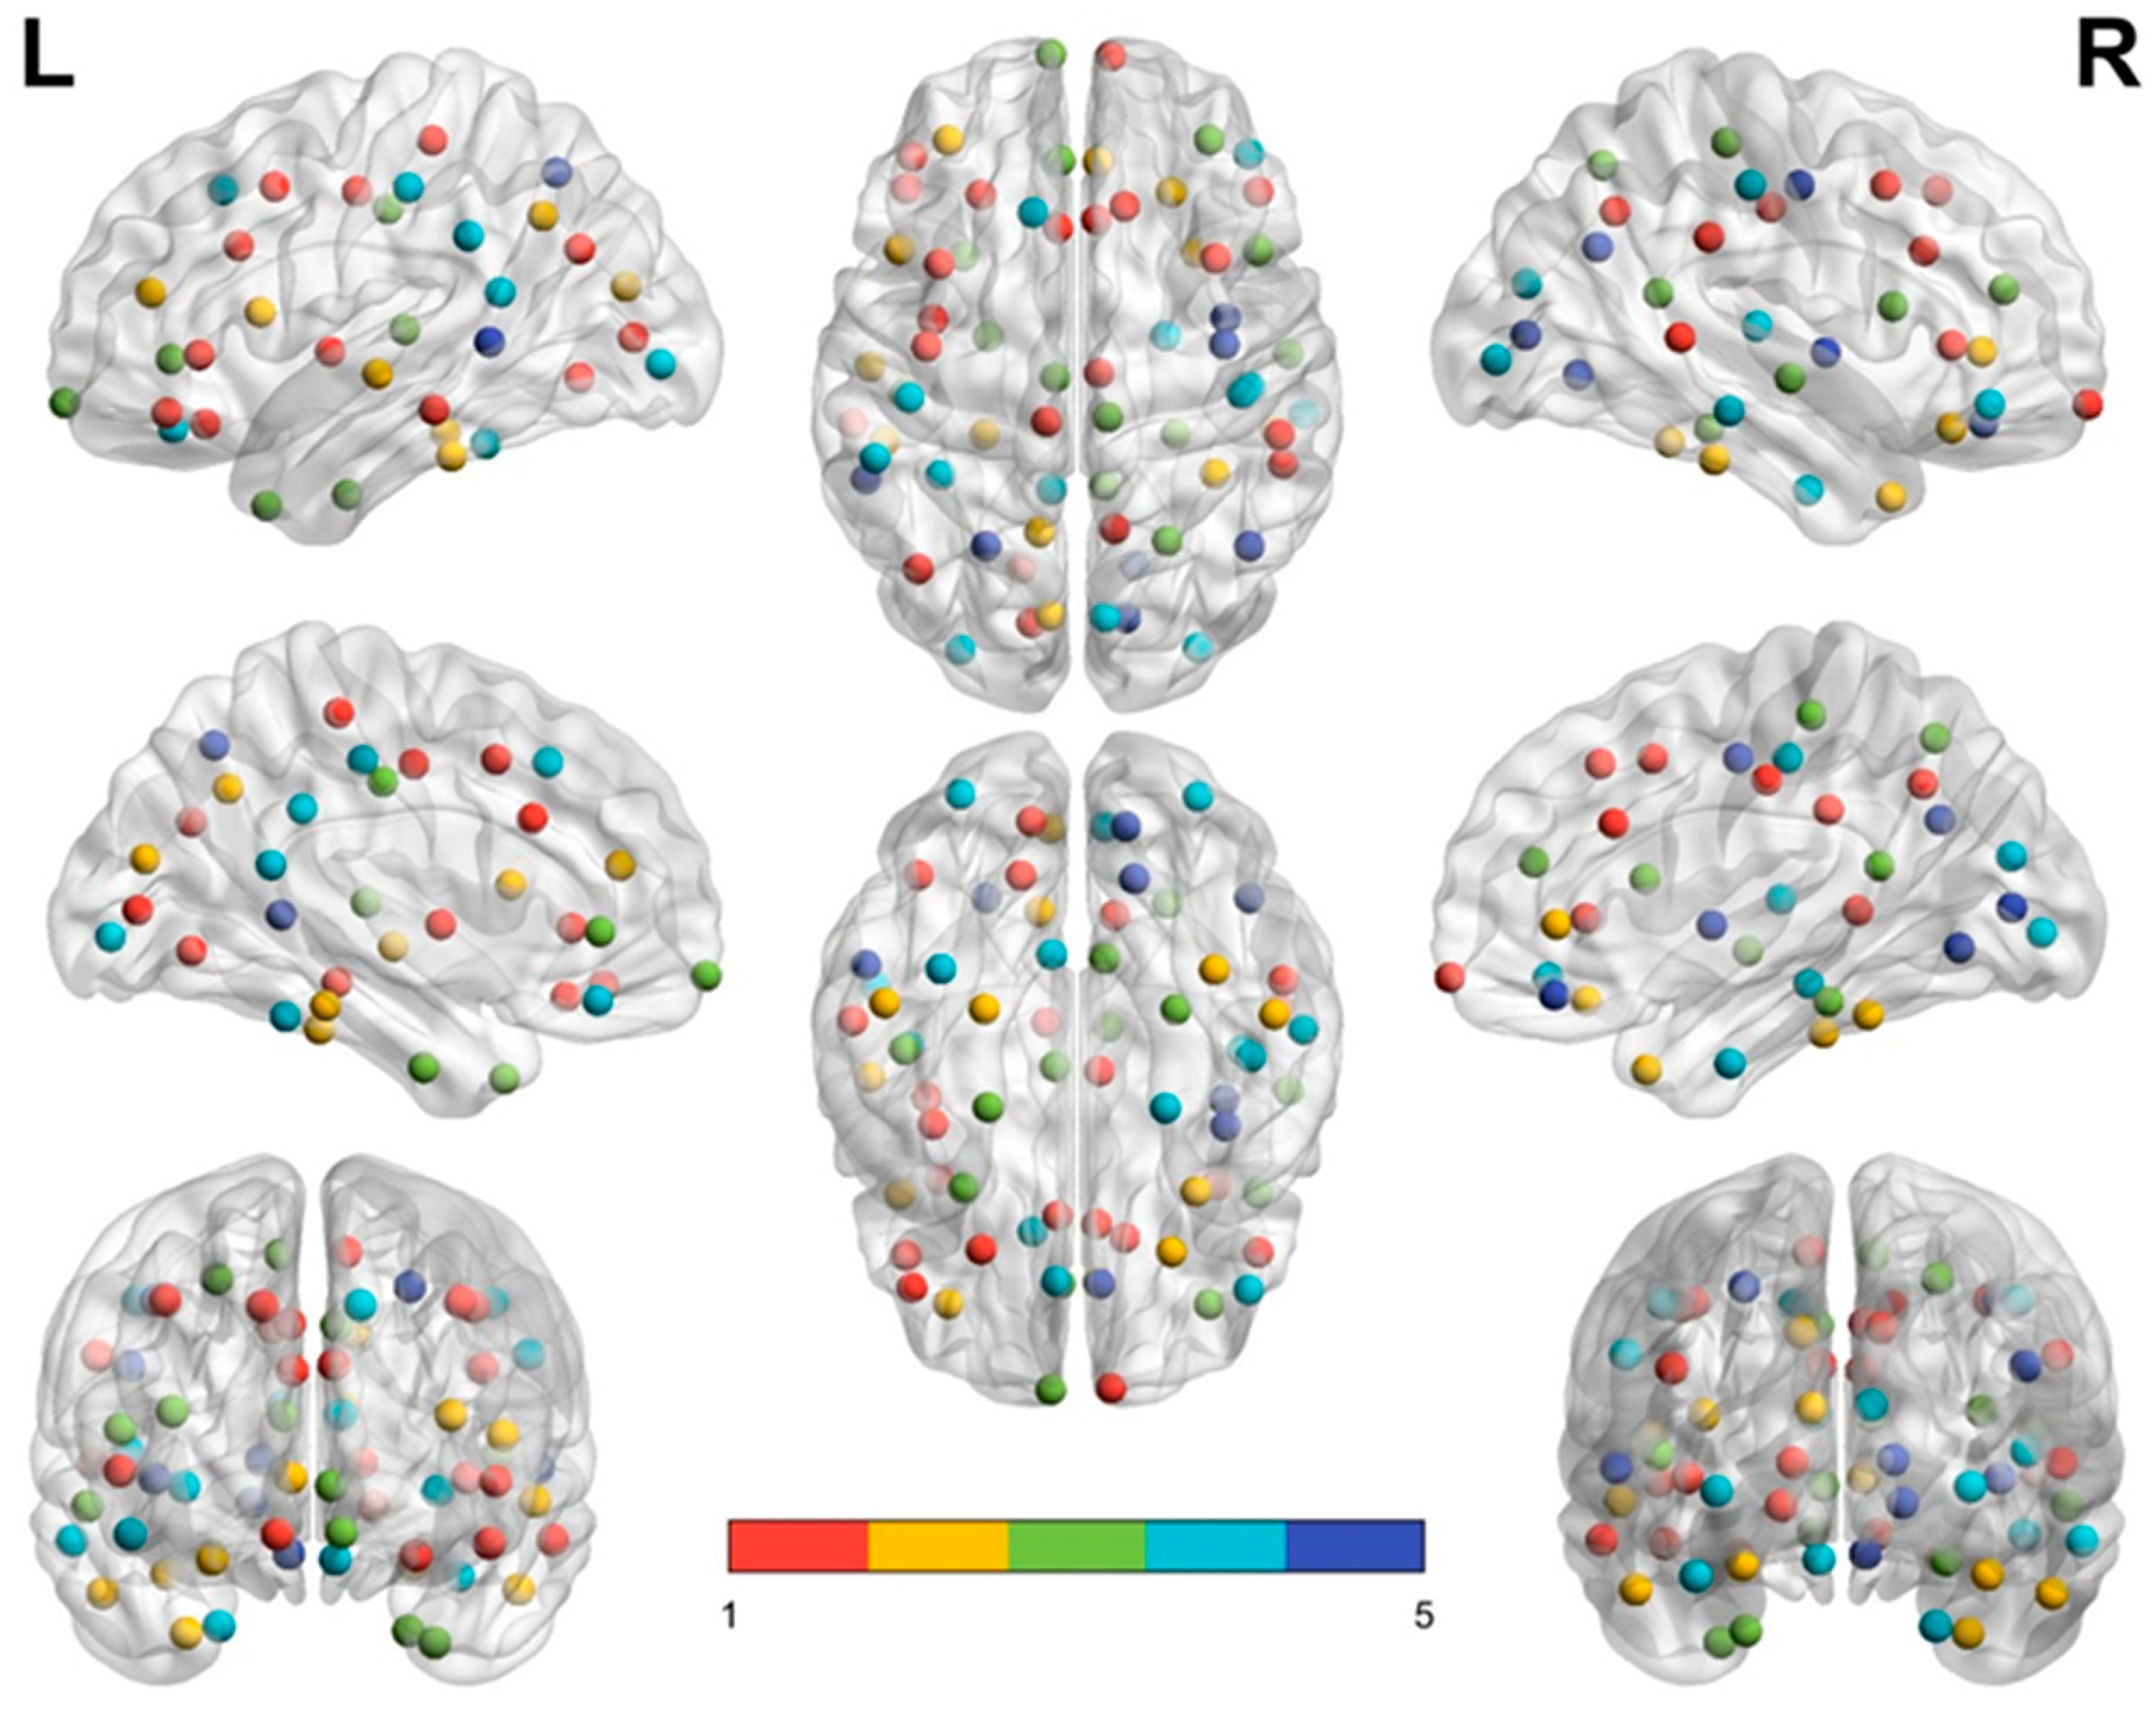
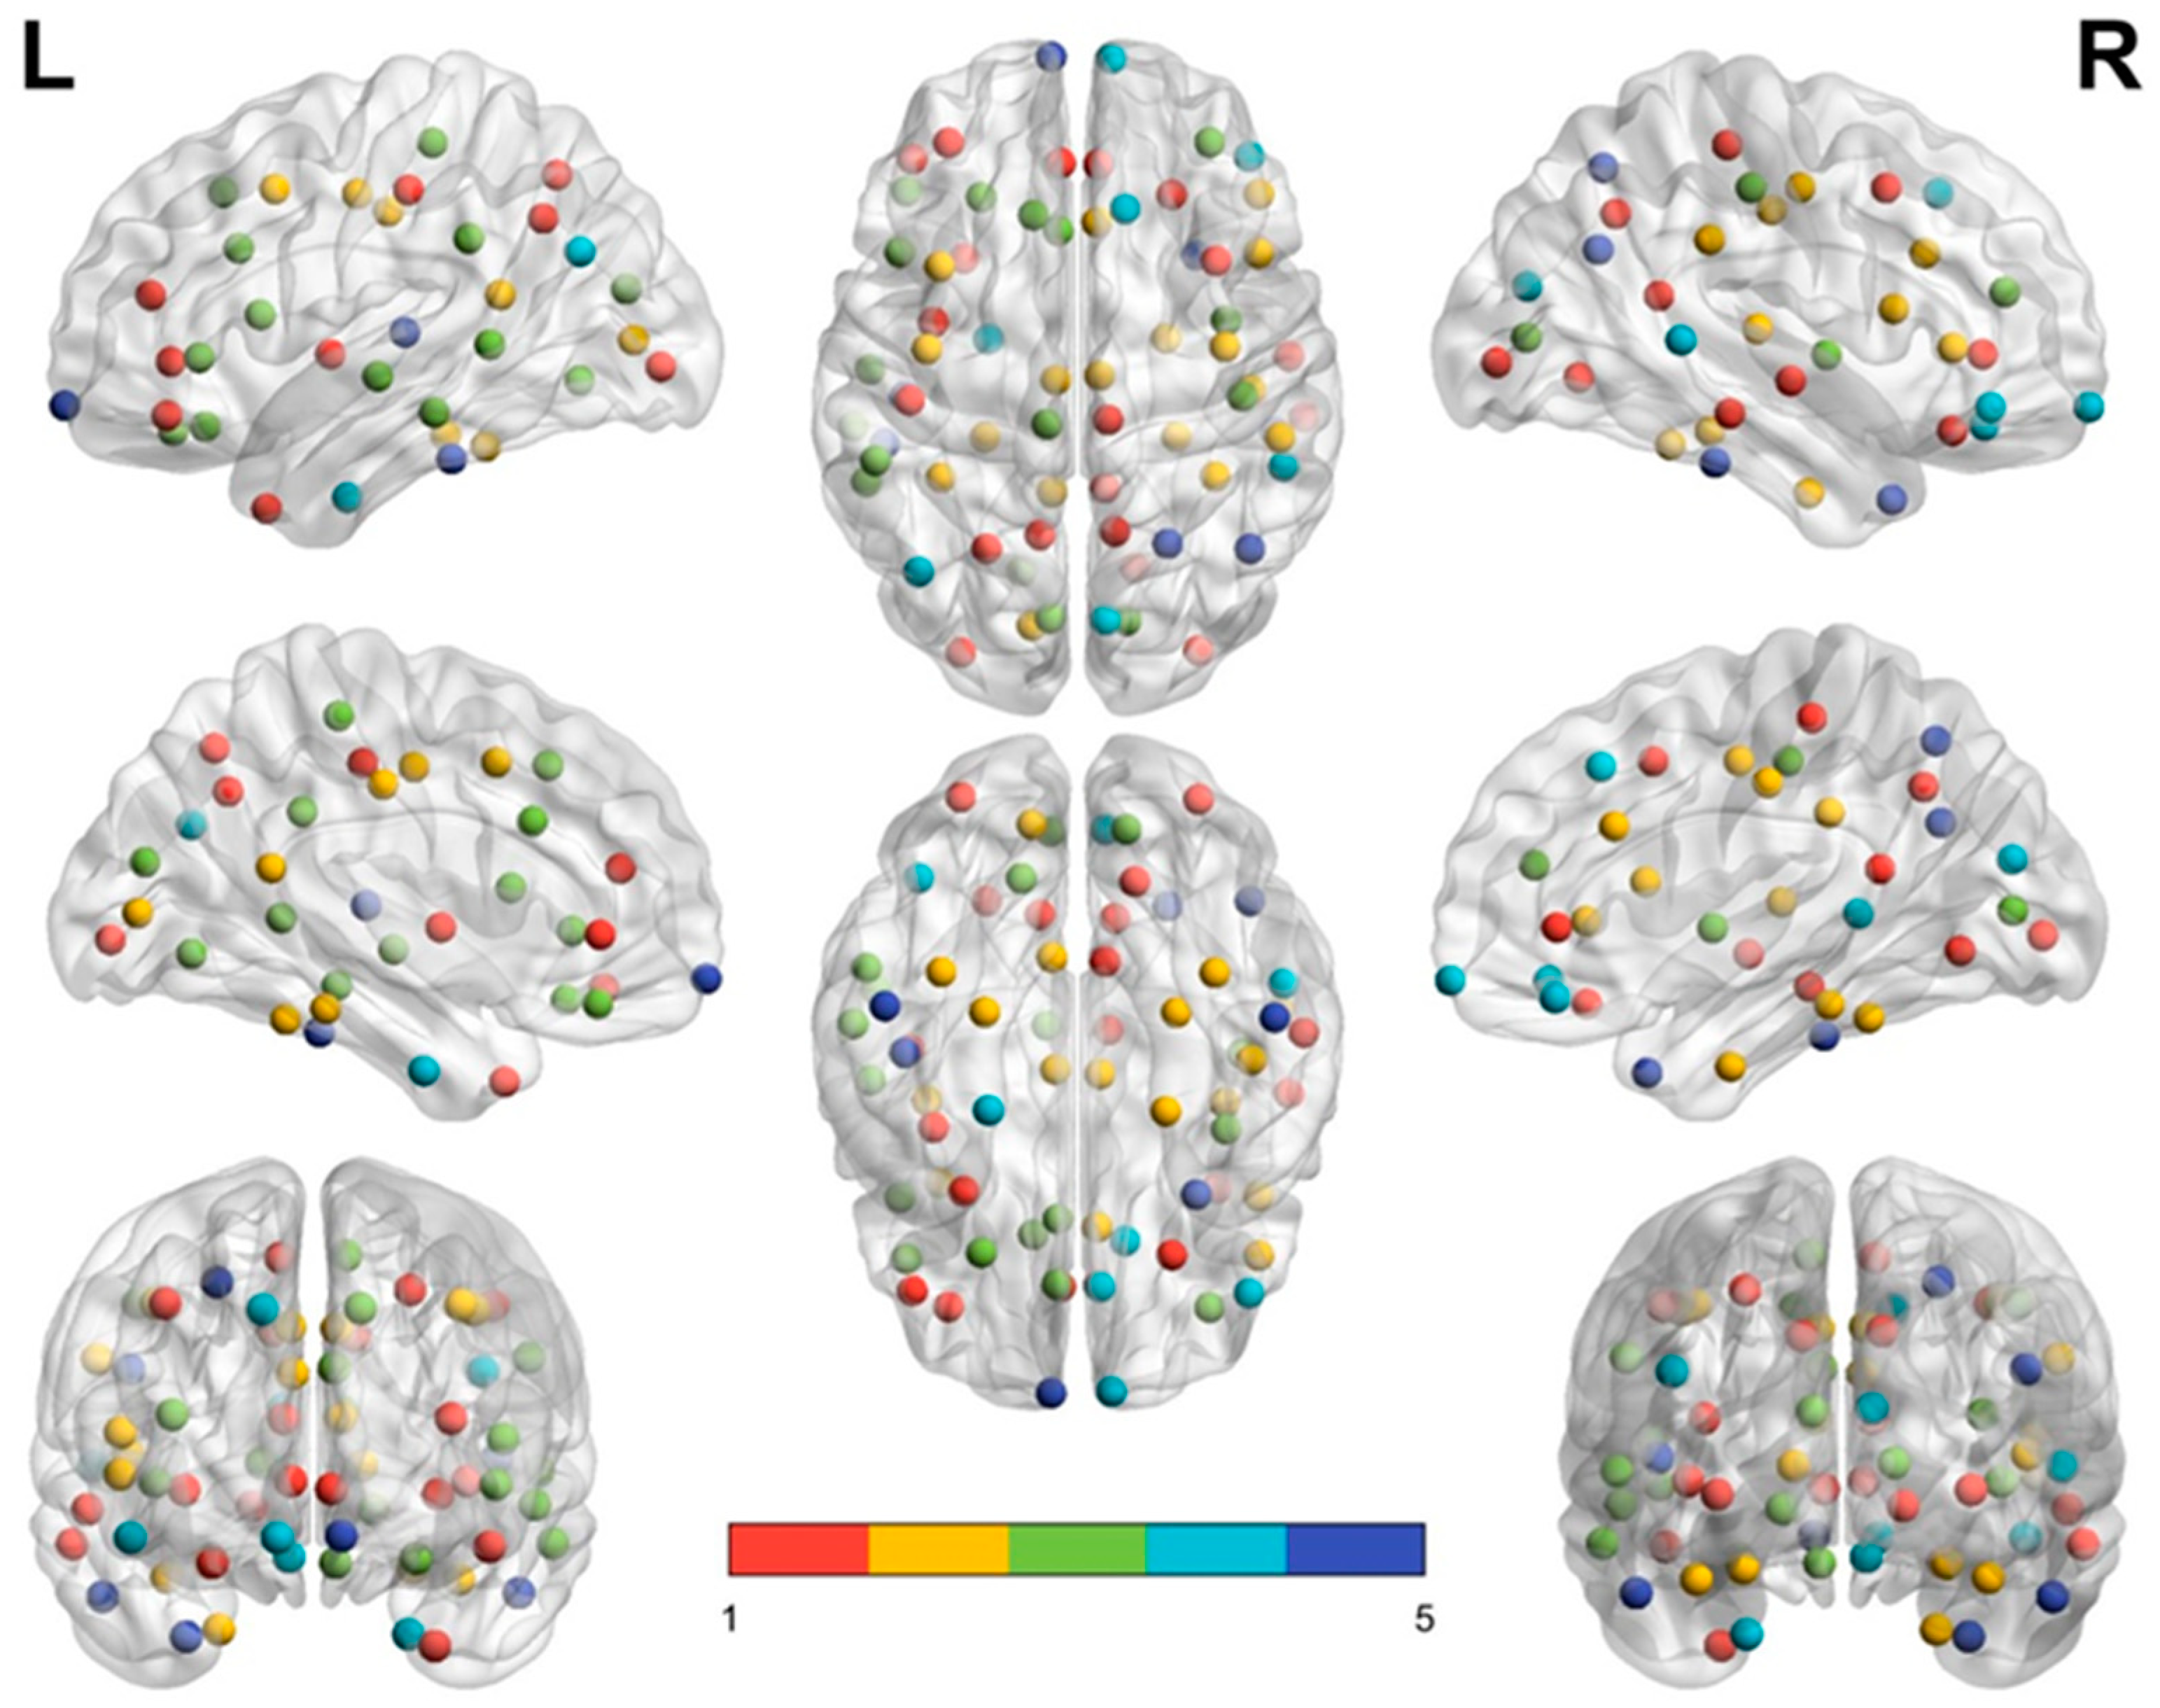
Figure 3 and
Figure 4 demonstrate the distribution of nodes in each module in the middle-aged group (
Figure 3) and the elderly group (
Figure 4) by using BrainNet Viewer software [
35]. In each subfigure, module 1 is labeled with red dots, module 2 with yellow dots, module 3 with green dots, module 4 with turquoise dots, and module 5 with royal blue dots. In the left and right upper subfigures of the two groups, the red dots (module 1) of the middle-aged group are scattered in a larger area and reveal a denser connection between each node than in the elderly group. By contrast, module 2 (yellow dots) and module 3 (green dots) in the elderly group reveal a wider distribution and denser connection than module 2 and module 3 in the middle-aged group.
3.4. Elderly Group Revealed Significantly Decreased Intra-Modular Connectivity in Frontal and Parietal Lobes and Increased Intra-Modular Connectivity in Temporal and Occipital lobes
Figure 5 presents the intra-modular connectivity of each lobe in the middle-aged group (
Figure 5a–d) and the elderly group (
Figure 5e–h). In this study, we termed the intra-modular connectivity of each lobe as the intra-lobe connectivity. In each figure, the left half depicts the ROIs of each lobe in the left hemisphere, while the right half depicts those of each lobe in the right hemisphere. The blue lines depict the short association fibers of the left cerebral hemisphere, while the green lines depict the short association fibers of the right cerebral hemisphere. The commissural fibers (transverse fibers) between bilateral hemispheres are depicted by red lines. The width of the connecting line indicates the strength of the connectivity coefficient; a wider line implies a higher connecting strength between nodes.
Table 5 summarizes the intra-lobe connectivity of the total lobe and each hemisphere lobe for the two groups.
First, both groups showed similar connecting patterns in all lobes. The middle-aged group demonstrated a lateralized effect of intra-lobe connectivity. They showed significantly higher intra-lobe connectivity in the left frontal and parietal lobes, but significantly lower intra-lobe connectivity in the left temporal and occipital lobes. Compared with the middle-aged group, the elderly group revealed fewer short association fibers bilaterally in the frontal and parietal lobes. The elderly group also revealed decreased commissural fibers in their frontal and parietal lobes. The elderly group had significantly lower intra-lobe connectivity in the frontal and parietal lobes and increased intra-lobe connectivity in the temporal and occipital lobes. In the temporal lobe, the elderly group had a higher intra-lobe connectivity of 0.4239, whereas the middle-aged group had a lower intra-lobe connectivity ratio of 0.3351. Comparing
Figure 5b with
Figure 5f, we found that the temporal lobe in the elderly group exhibited many more links of commissural fibers (B, En, Fu, IT, PaH, Pol, and TrT) than did those in the middle-aged group (B, ST, TrT); hence, increased intra-lobe connectivity in the temporal lobe may be anticipated in the elderly group. In the parietal lobe, as
Figure 5g illustrates, the elderly group had fewer short association and commissural fibers and a lower intra-lobe connectivity ratio of 0.3378, whereas the middle-aged group had a higher intra-lobe connectivity of 0.3779 (
p < 0.05) in the parietal lobe. Similar to the results related to temporal lobes, the elderly group exhibited increased intra-lobe connectivity in their occipital lobe, with a connectivity of 0.4642, whereas the middle-aged group had a lower connectivity of 0.3876 (
p < 0.05). Similarly, the occipital lobe of the elderly group revealed denser links of short association and commissural fibers (PerCa, Lg) than the middle-aged group (PreCa).
3.5. Elderly Group Revealed Significantly Decreased Inter-Lobe Connectivity in All Lobes
The measured inter-lobe connectivity of all lobes and each hemisphere in the two groups is summarized in
Table 6. The elderly group revealed significantly decreased inter-lobe connectivity in all lobes, especially in the parietal lobe of the right hemisphere (86.1%;
p < 0.01).
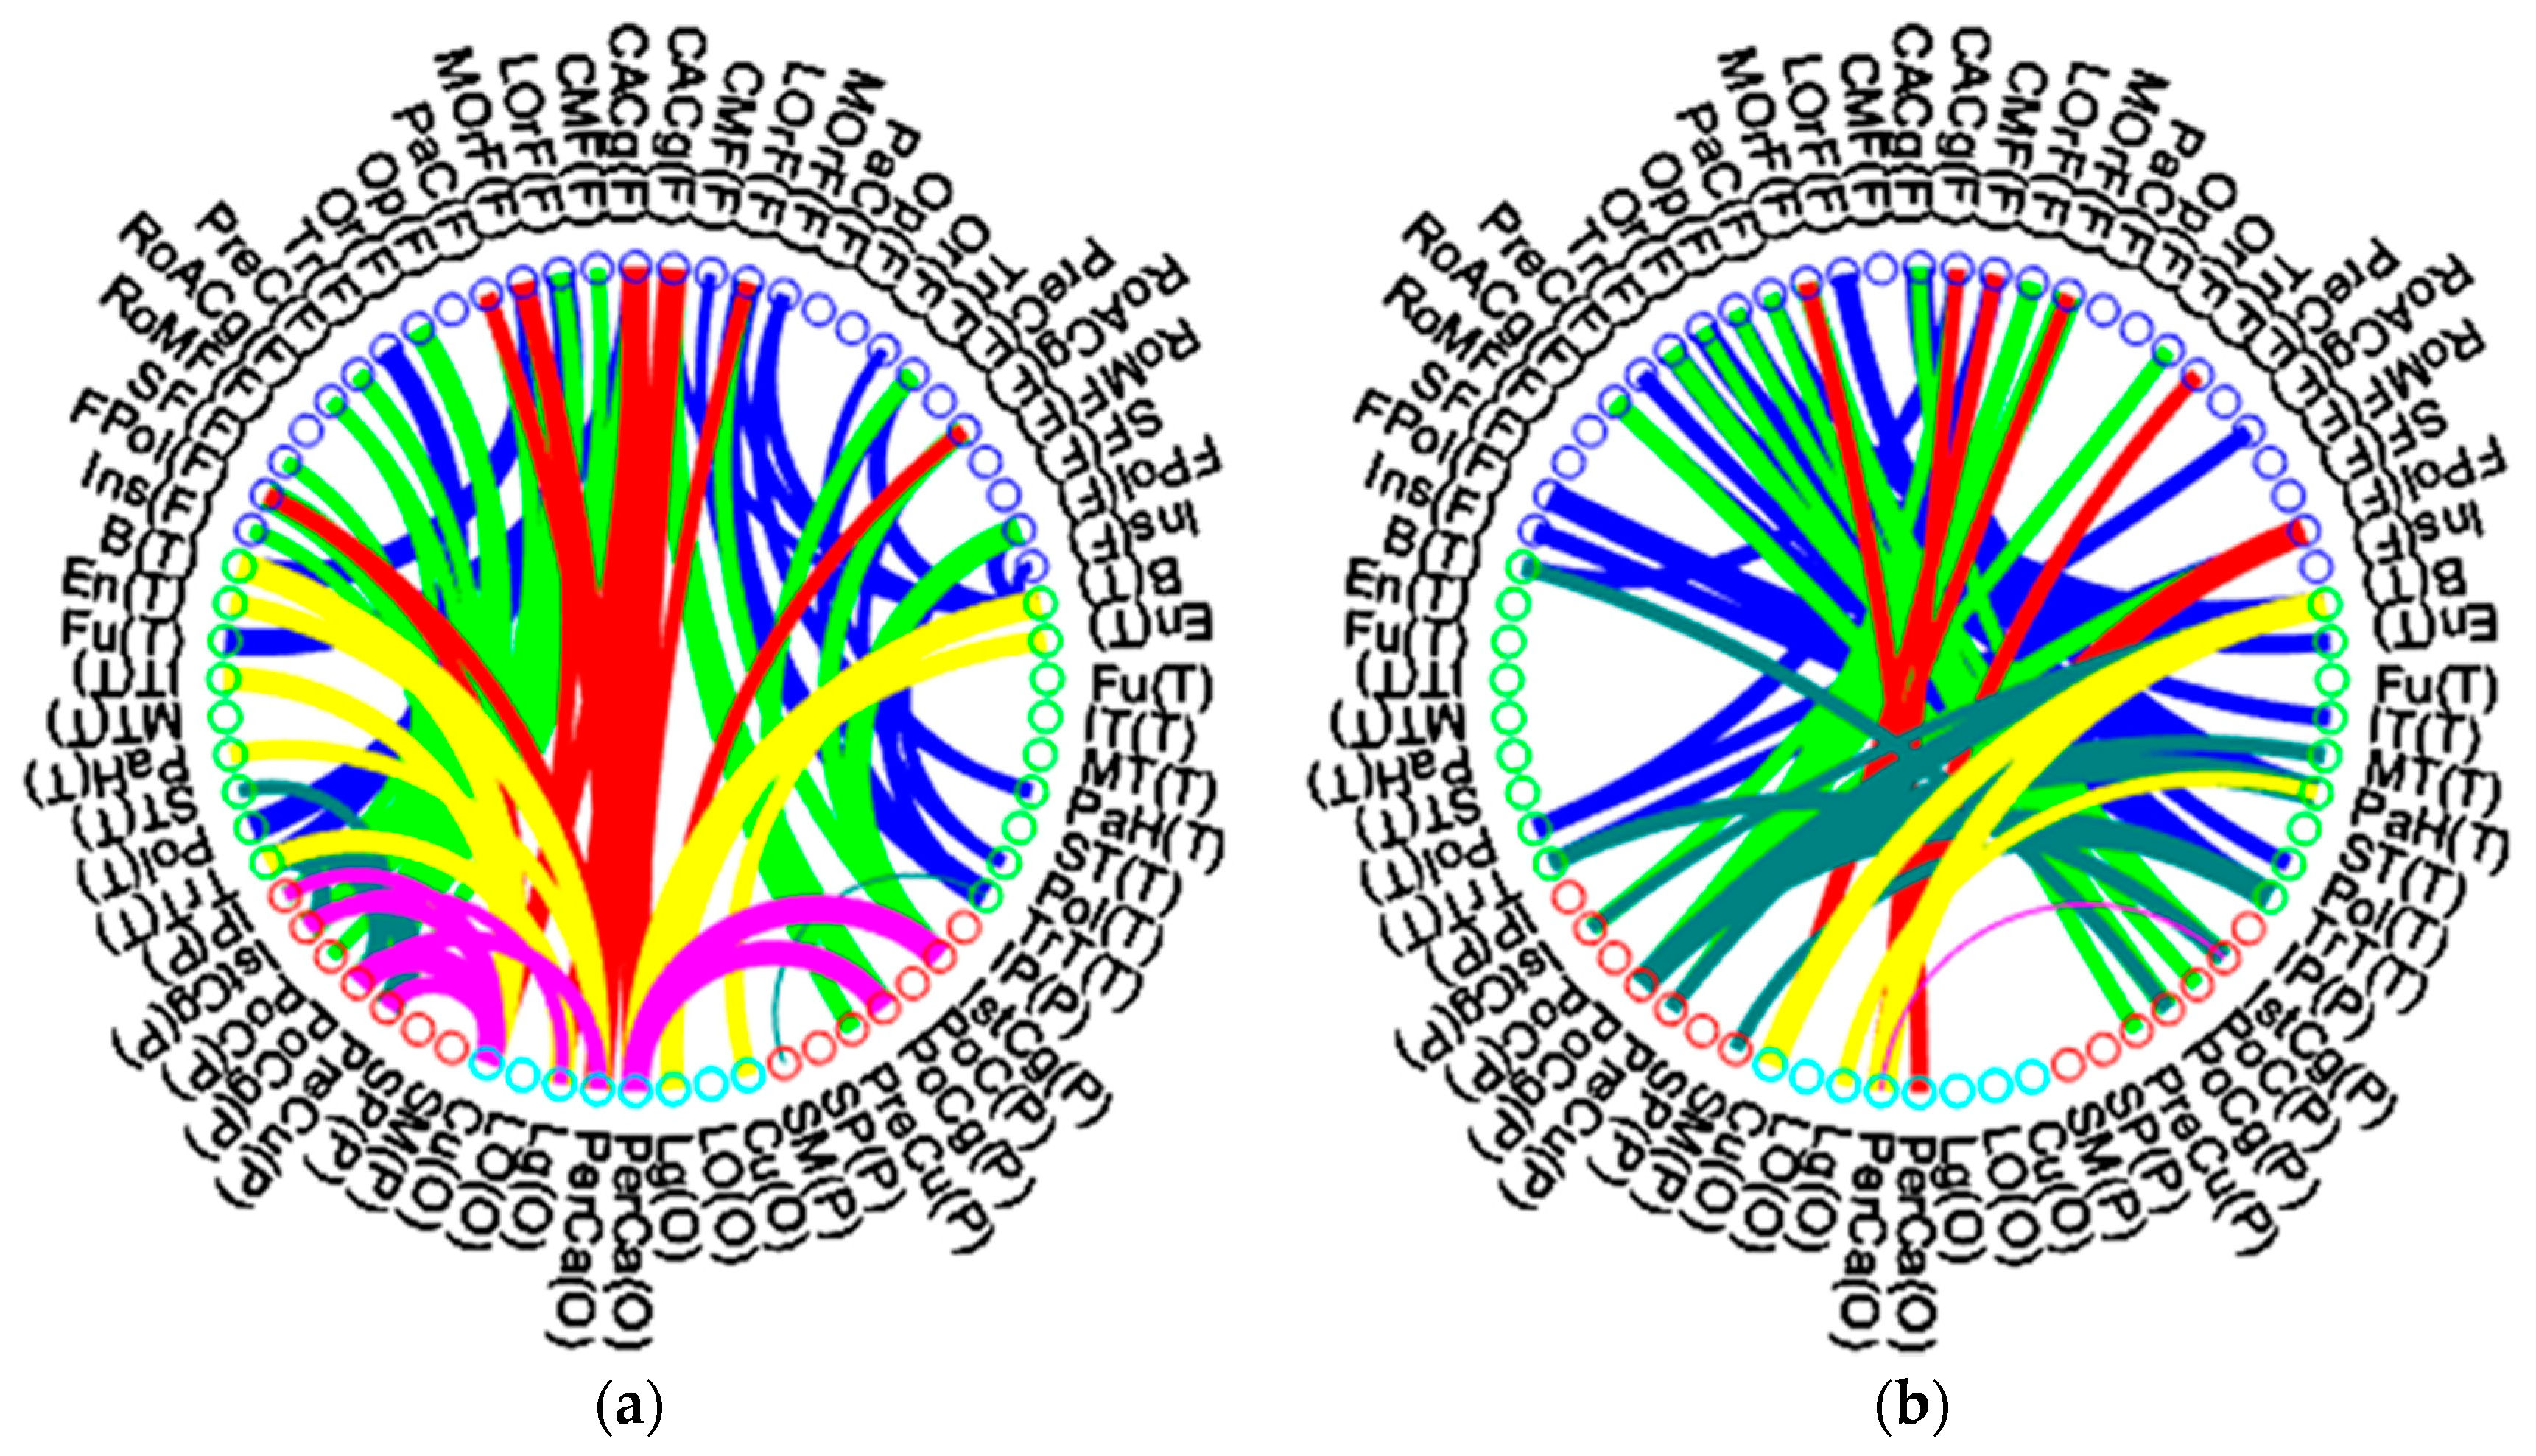
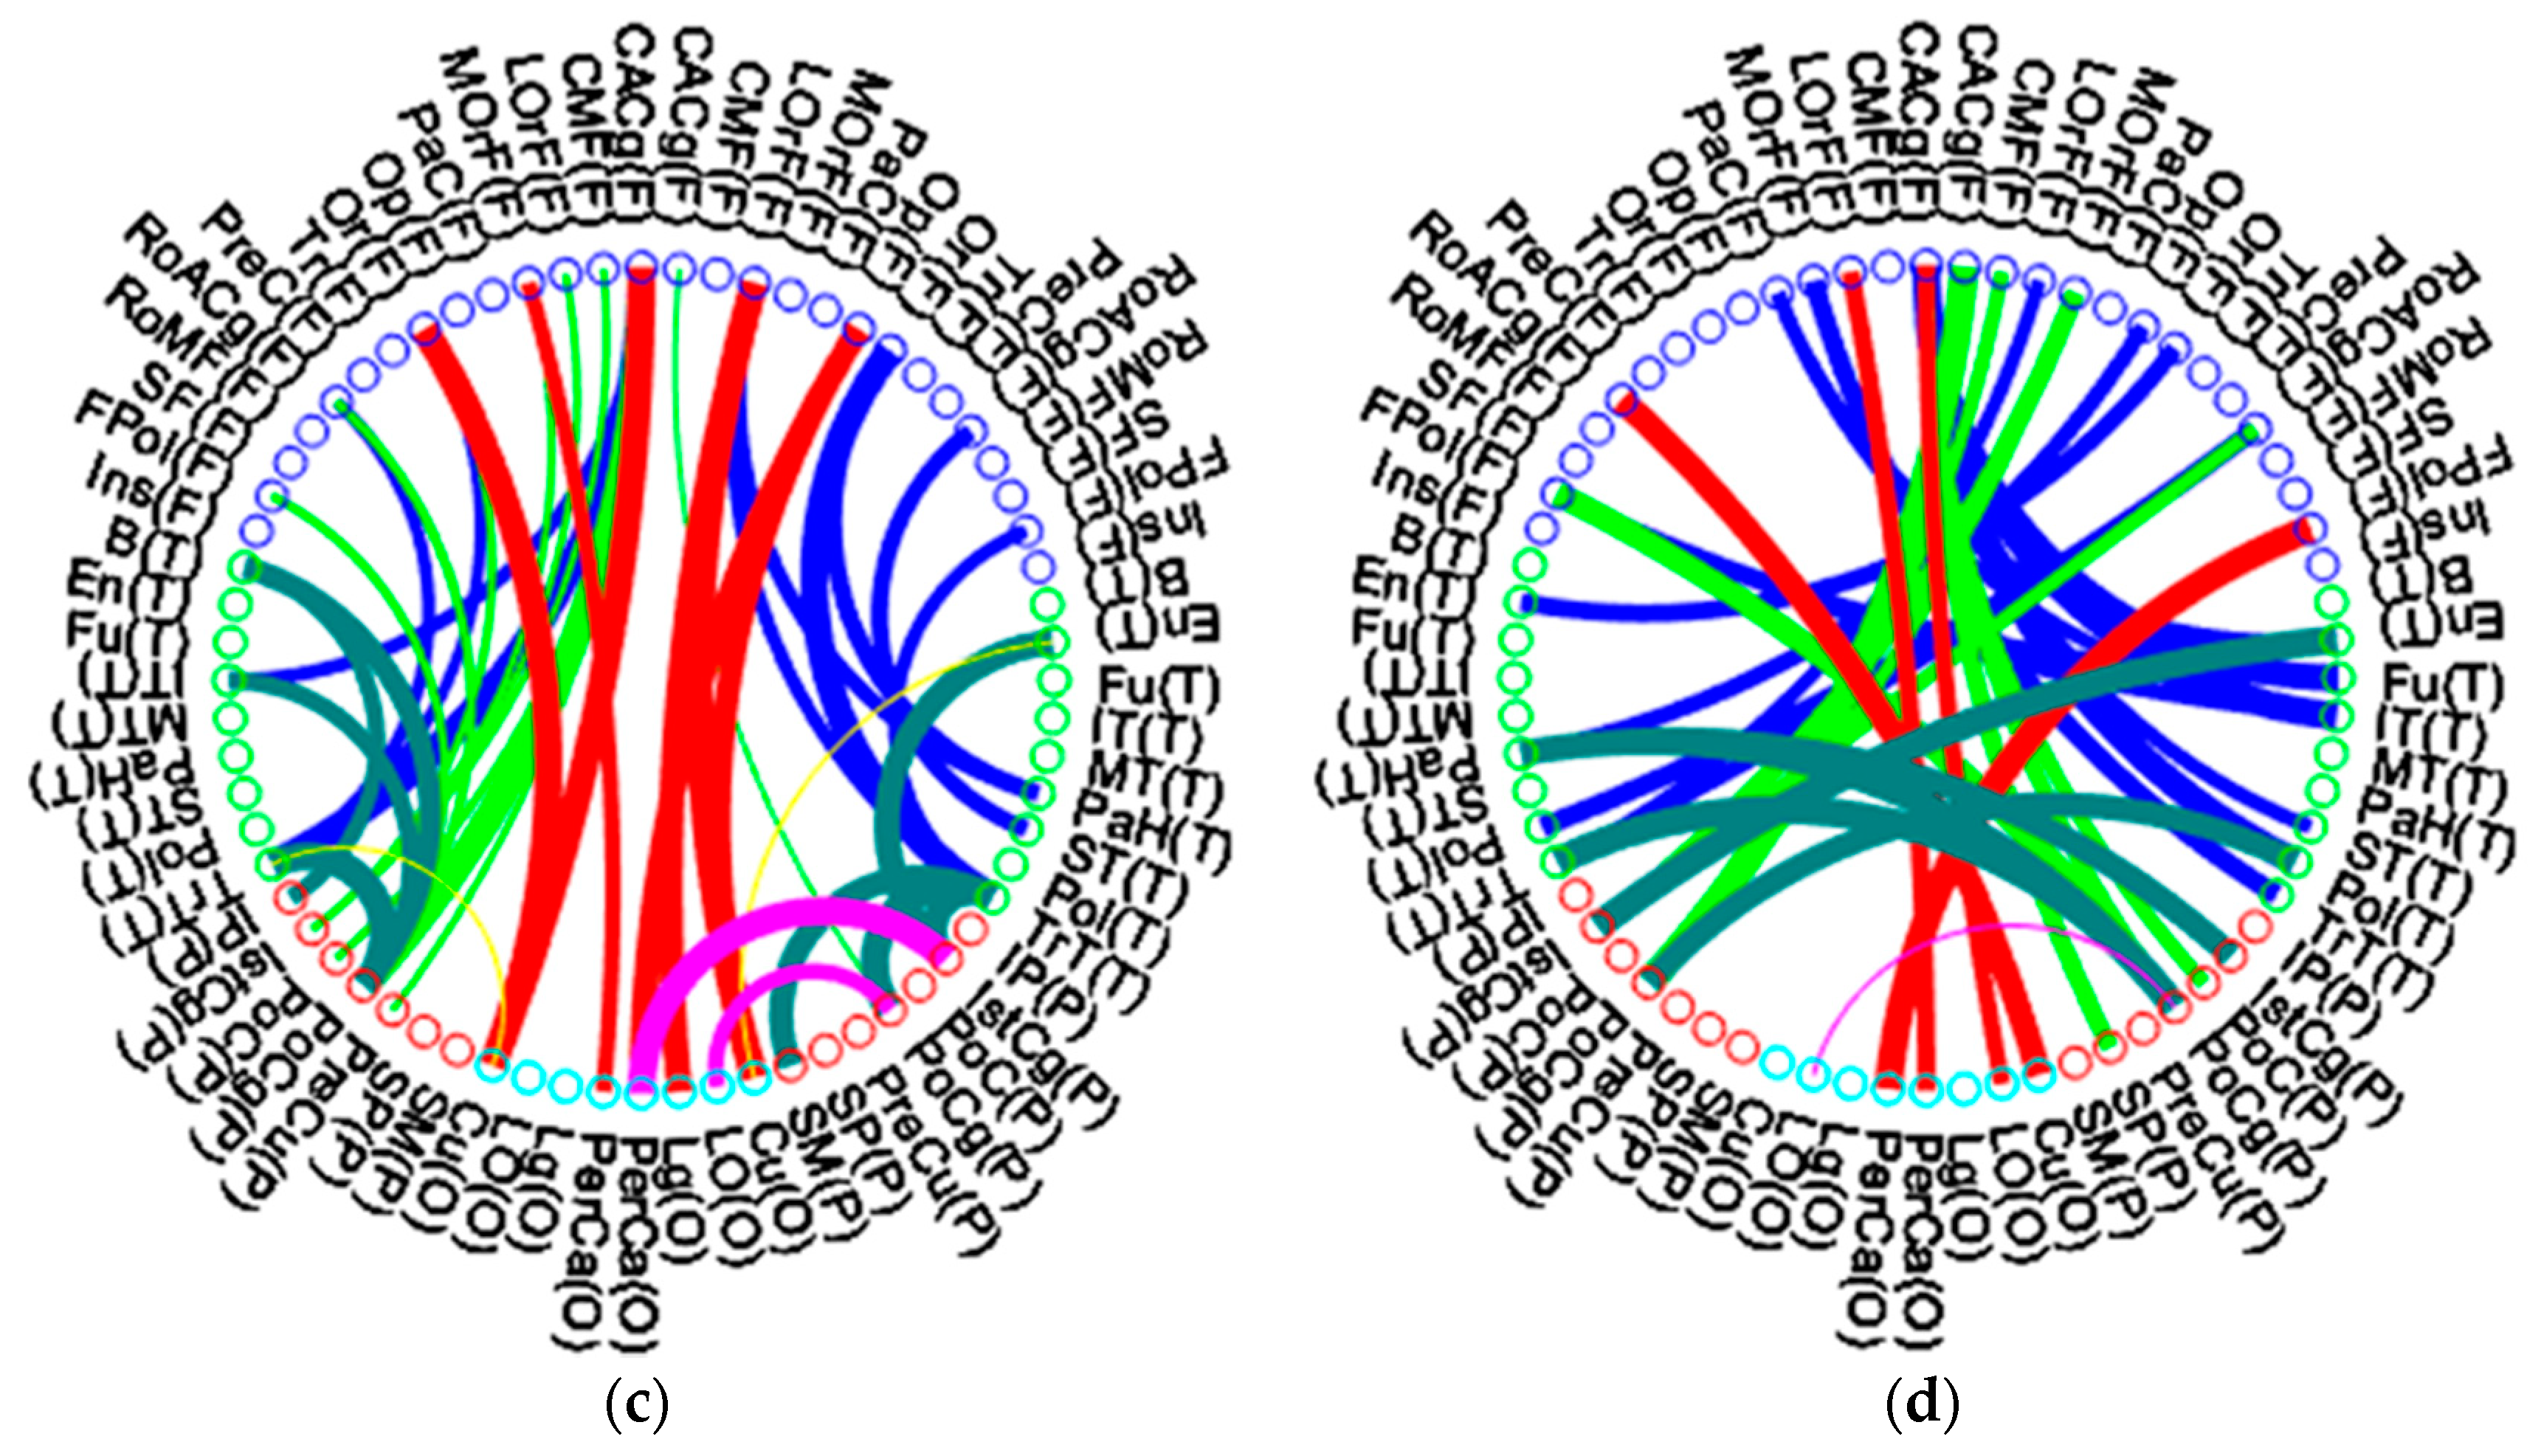
Figure 6 illustrates the inter-modular connectivity between lobes of the middle-aged group and the elderly group.
Figure 6a,c illustrate the long association fiber of each lobe, while
Figure 6b,d illustrate the commissural fibers (transverse fibers) crossing bilateral hemispheres. In each figure, the left half depicts the left hemisphere, while the right half depicts the right hemisphere. The hemispheres are further broken down into the frontal lobe, temporal lobe, parietal lobe, and occipital lobe. Each ROI of the frontal lobe is labeled with blue circles and abbreviations, the temporal lobes are indicated by green circles, red circles denote the parietal lobes, and occipital lobes are illustrated by green-blue circles. The width of the connecting line in each figure indicates the connectivity coefficient strength between nodes, and a wider line implies a higher connectivity between nodes. The blue lines indicate the uncinate and arcuate fibers (frontal lobe to temporal lobe)—frontoparietal connections are illustrated by chartreuse green lines, while the superior longitudinal fasciculus and occipitofrontal fasciculus (frontal lobe to occipital lobe and occipital lobe to frontal lobe) are illustrated by red lines. The yellow lines indicate the inferior longitudinal fasciculus fibers (occipital lobe to temporal lobe)—the temporal lobe and parietal lobe connecting fibers are indicated by moss green lines, while the purple lines indicate the connecting fibers between the occipital lobe and the parietal lobe.
A comparison of
Figure 6a and
Figure 6c shows that the elderly group had a connecting pattern almost similar to that of the middle-aged group, but it had thinner and fewer connecting lines between nodes. We found that the temporal lobe to occipital lobe (yellow lines in
Figure 6c) and parietal lobe to occipital lobe (purple lines in
Figure 6c) showed the highest decrease in connecting fibers during aging, including in long association fibers of lateral hemispheres and commissural fibers of bilateral hemispheres. The association fiber of the frontal lobe to parietal lobe in the right hemisphere (green line of right hemisphere in
Figure 6c) also demonstrated the most decreased connectivity. These results may imply that the elderly group had a lateral long association connectivity loss effect, mainly in the right hemisphere. Interestingly, the elderly group had fewer long association and commissural fibers from the temporal lobe to the occipital lobe but more connectivity fibers from the temporal lobe to the parietal lobe in bilateral hemispheres, especially in the right hemisphere. The ratio of inter-lobe connectivity of the elderly group to the middle-aged group for the frontal lobe was 89.12%; for the temporal lobe, it was 92.3%; for the parietal lobe, it was 88.1%; and for the occipital lobe, it was 88.8%. In the elderly group, the temporal lobe had the least aging effect on inter-lobe connectivity alteration.


