Article

Gene Network Analysis of Alzheimer’s Disease Based on Network and Statistical Methods

School of Mathematical Sciences, Tiangong University, Tianjin 300382, China
*
Author to whom correspondence should be addressed.
Entropy 2021, 23(10), 1365; https://doi.org/10.3390/e23101365
Submission received: 1 September 2021 / Revised: 9 October 2021 / Accepted: 12 October 2021 / Published: 19 October 2021

Abstract

:
Gene network associated with Alzheimer’s disease (AD) is constructed from multiple data sources by considering gene co-expression and other factors. The AD gene network is divided into modules by Cluster one, Markov Clustering (MCL), Community Clustering (Glay) and Molecular Complex Detection (MCODE). Then these division methods are evaluated by network structure entropy, and optimal division method, MCODE. Through functional enrichment analysis, the functional module is identified. Furthermore, we use network topology properties to predict essential genes. In addition, the logical regression algorithm under Bayesian framework is used to predict essential genes of AD. Based on network pharmacology, four kinds of AD’s herb-active compounds-active compound targets network and AD common core network are visualized, then the better herbs and herb compounds of AD are selected through enrichment analysis.

1. Introduction

Alzheimer’s disease (AD) is a chronic age-associated neurodegenerative disorder, and there are no definitive treatments or prophylactic agents. Its pathological features include senile plaque, nerve fiber tangles, and massive loss of neurons [1]. As its pathogenesis is not clear, clinical drugs used commonly can only relieve symptoms within a certain period of time but cannot improve the disease fundamentally.
Network pharmacology is associated with drug targets and human disease genes. On the basis of understanding the “drug-target gene-disease gene” network, the effects of different drugs on different target proteins are evaluated by using network analysis methods [2,3].
Many different computational methods have been employed for the different application fields. Gianni D’Angelo and Francesco Palmieri proposed a novel autoencoder-based deep neural network architecture, where multiple autoencoders are embedded with convolutional and recurrent neural networks to elicit relevant knowledge about the relations existing among the basic features (spatial-features) and their evolution over time [4]. Gianni D’Angelo and Francesco Palmieri described the use of Genetic Programming for the diagnosis and modeling of aerospace structural defects. The resulting approach aims at extracting such knowledge by providing a mathematical model of the considered defects, which can be used for recognizing other similar ones [5]. Zhang et al. proposed a Bayesian regression approach to explain similarities of disease phenotypes by using diffusion kernels of one or several protein-protein interaction (PPI) networks [6]. Chen et al. proposed two improved Markov random field (MRF) algorithms, which can automatically assign weights to different data sources, using Gibbs sampling processes [7,8]. Chen et al. proposed a fast and high-performance multiple data integration algorithm [9] for identifying human disease genes, the logistic regression based algorithm is extended to the multiple data integration case, where the parameters (weights) of different data sources can be tuned automatically.
In this paper, AD genes are collected from multiple databases, and the gene network of AD is constructed by considering some factors such as gene co-expression and metabolic relationship. The gene network is divided into modules by Cluster one [10], MCL [11], Glay [11] and MCODE [11,12]. Then these division methods are evaluated by network structure entropy, and the optimal division method, MCODE. Through functional enrichment analysis, the functional modules are identified. Furthermore, essential genes can be predicted by the analysis of network topology characteristics of these functional modules. In addition, the integrated algorithm (logical regression algorithm under Bayesian framework) is used to predict AD’s essential genes. The final predicted essential genes are obtained by analyzing these two results above.
AD is located in the brain, but it is closely associated to the kidneys, liver, heart, spleen, and other viscera, according to traditional Chinese medicine [13,14]. Compound herbs have the characteristics of multi-components and multi-targets. In this study, we screen out the effective herb compounds for the treatment of AD by identifying the essential genes of AD, the herb-active compound-active target genes network, and the common core network of AD [15,16].

2. Materials and Methods

2.1. Data Preparation

Data Sources

Some common herbs for treating AD are KXS (Kaixinsan), DYSYS (Dangguishaoyaosan), YGS (Yigansan) and YQTYT (Yiqitongyutang). The compounds of these four herbs are obtained [17,18] (see Supplementary Table S1). Their active targets were obtained from the Traditional Chinese Medicine Systems Pharmacology (TCMSP) Database [19]. The AD-associated genes were collected from the database of National Center for Biotechnology Information (NCBI) database [20], Online Mendelian Inheritance in Man (OMIM) database [21], and Therapeutic Target Database (TTD) [22]. The PPI dataset is derived from the database of IntAct Molecular Interaction Database (IntAct) [23]. The human gene expression profiles are obtained from the Gene Expression Omnibus (GEO) database [24]. The pathway datasets are obtained from the Kyoto Encyclopedia of Genes and Genomes (KEGG) database [25]. The human protein complexes are from the database of Comprehensive Resource of Mammalian protein complexes (CORUM) database [26].

2.2. Methods

2.2.1. Prediction of Essential Genes based on Modular Network

Network Module Partition Method

According to the distribution of network nodes in the module, the module division method can be divided into overlapping modules and non-overlapping modules. The common algorithms, MCODE, MCL, Glay, and cluster one, are used to divide the network. The first three algorithms are non-overlapping algorithms, while the last one is an overlapping algorithm. In this paper, the above four-module partition methods are used to divide AD networks.

Entropy

Recently, “Shannon entropy” has been introduced to measure some properties of networks, also known as “network entropy”. Its value can effectively assess the stability of the network. The smaller numerical value of network entropy, the more stable the network [27]. Network structure entropy is used as the evaluation method. Let N and k i denote the number of nodes, the degree of the i-th node, respectively. The entropy of a network [28] is defined as follows:
E = i = 1 N I i ln I i     w h e r e         I i = k i i = 1 N k i

Prediction of Functional Gene Modules

The correlation between AD original network and divided module network is discussed based on gene function enrichment analysis and association indices [29,30]. Jaccard association index is often used to evaluate the functional correlation between each module and the original network [29]. In addition, Fuxman Bass Juan et al. survey many association indices, such as Simpson, Geometric, Cosine, PCC (Pearson Correlation Coefficient) [31]. Zhu and Qiao et al. further extend the PCC association index to measure the correlation between each module and the function of the original network [32], as shown in Table 1.

Screening of Essential Genes

Research on the essential genes can help us to understand the biology of the disease. Various tools have been developed to predict and judge the essential genes in the network [33]. In this paper, the network topology attributes of functional modules are analyzed by 11 indexes of Cyto-Hubba [33], such as degree centrality (DC), betweenness centrality (BC), closeness centrality (CC), density of maximum neighborhood component (DMNC), maximum neighborhood component (MNC), bottleneck (BN), edge percolated component (EPC), maximum clique centrality (MCC), edge clustering coefficient (ECC), radiality and clustering coefficient.

2.2.2. Integrated Algorithm for Predicting Essential Genes

Chen et al. proposed a fast and high-performance multiple data integration algorithm for identifying human disease genes [9]. The disease gene identification problem was first expressed as a two-classification problem, and the feature vectors of each gene were extracted from the integrated network. Combined with the binary logistic regression model, maximum likelihood estimation and Bayesian idea, the model parameters are estimated, and the posterior probability of each gene was calculated. The final decision score was obtained by calculating the percentage of individual posterior probability.

Acquisition of Priori Probability of Genes

Suppose the integrated network contains genes g 1 g n + m , in which g 1 g n are the unknown ones and g n + 1 g n + m are the known ones in the OMIM database. Similar to the method used in references [8,9], for i = 1 n , if g i belongs to the protein complex, then let its prior probability be:
P i = A B
where A denotes the number of AD genes in the complex and B denotes the number of all disease genes in the complex. If g i does not belong to the protein complex, then let its prior probability be:
P i = C D
where C is the number of all known genes of AD and D is the total number of human genes.
Then, generate a random number following the standard uniform distribution U ( 0 , 1 ) . If the numerical value of the random number is larger than P i , then assign 0 as the prior label for g i . Otherwise, assign 1 as the prior label for g i . The prior probability of AD genes in the OMIM database are P ^ n + i = 1 , i = 1 m .

Binary Label Assignment

Assign binary labels according to the prior probability calculated in 2.2.2.1, if P ^ i = 1 , i = 1 n + m , then the binary label is x ^ = 1 . If P ^ i = 0 , i = 1 n + m , then the binary label is x ^ = 0 .

Obtain Feature Vectors according to the Integrated Network and Binary Labels

Only considering direct neighbors to construct feature vectors limits the capability of the method to use other topological attributes in a biological network. Therefore, the number of second order neighbors (indirectly connected) are employed to construct the feature vector [9] as:
φ i = ( 1 , φ i 1 , φ i 0 , φ i 1 , φ i 0 ) T
where, φ i 1 and φ i 0 are the number of direct neighbors of g i that are connected to vertices with labels 1 and 0, φ i 1 and φ i 0 are the numbers of the second-order neighbors of g i that are connected to vertices with labels 1 and 0. All feature vectors of individual genes together form a feature matrix as:
F 1 = [ 1 φ 11 φ 10 φ 11 φ 10 1 φ 21 φ 20 φ 21 φ 20 1 φ N 1 φ N 0 φ N 1 φ N 0 ] N × 5

Estimate Parameters and Calculate the Posterior Probability

Given a prior configuration X ^ for all vertices, a maximum likelihood estimation (MLE) method can be used to estimate the parameter vector ω .
Parameter vector can be written as:
ω = ( ω 0 , ω 1 , ω 2 , ω 3 , ω 4 ) T .
The likelihood function can be written as:
L ( ω ; x 1 , x 2 x N ) = i = 1 N P ( x i | φ i , f ) .
The logistic sigmoid function can be written as:
{ P ( x i = 1 | φ i , f ) = e f ( φ i ) e f ( φ i ) + 1 P ( x i = 0 | φ i , f ) = 1 e f ( φ i ) + 1 .
Among them, the linear function
f ( φ i ) = ω T φ i .
The log likelihood function of (7) can be written as:
ln L ( ω ; x 1 , x 2 x N ) = i = 1 N ln P ( x i | φ i , f ) .
From (8) and (10), we get
ln L ( ω ; x 1 , x 2 x N ) = i = 1 N [ x i ω T φ i ln ( 1 + e ω T φ i ) ] .
Then, a unique global optimal solution can be found by solving a convex optimization problem. The parameter vector ω is obtained by calculating the maximum value of (11). Then calculate the posterior probability of each gene from (8) and (9).

Get Decision Score

Considering that a gene has a higher decision score than most genes, it is more likely to be associated with the disease. Therefore, the final decision score is obtained by using the percentage value of the posterior probability [9]. The decision score is calculated as follows:
q i = | { j | P i P j } | n
where P i is the posterior probabilities of each gene and q i is the top percentage value of P i among all those posterior probabilities.

3. Results and Discussion

3.1. Network Construction

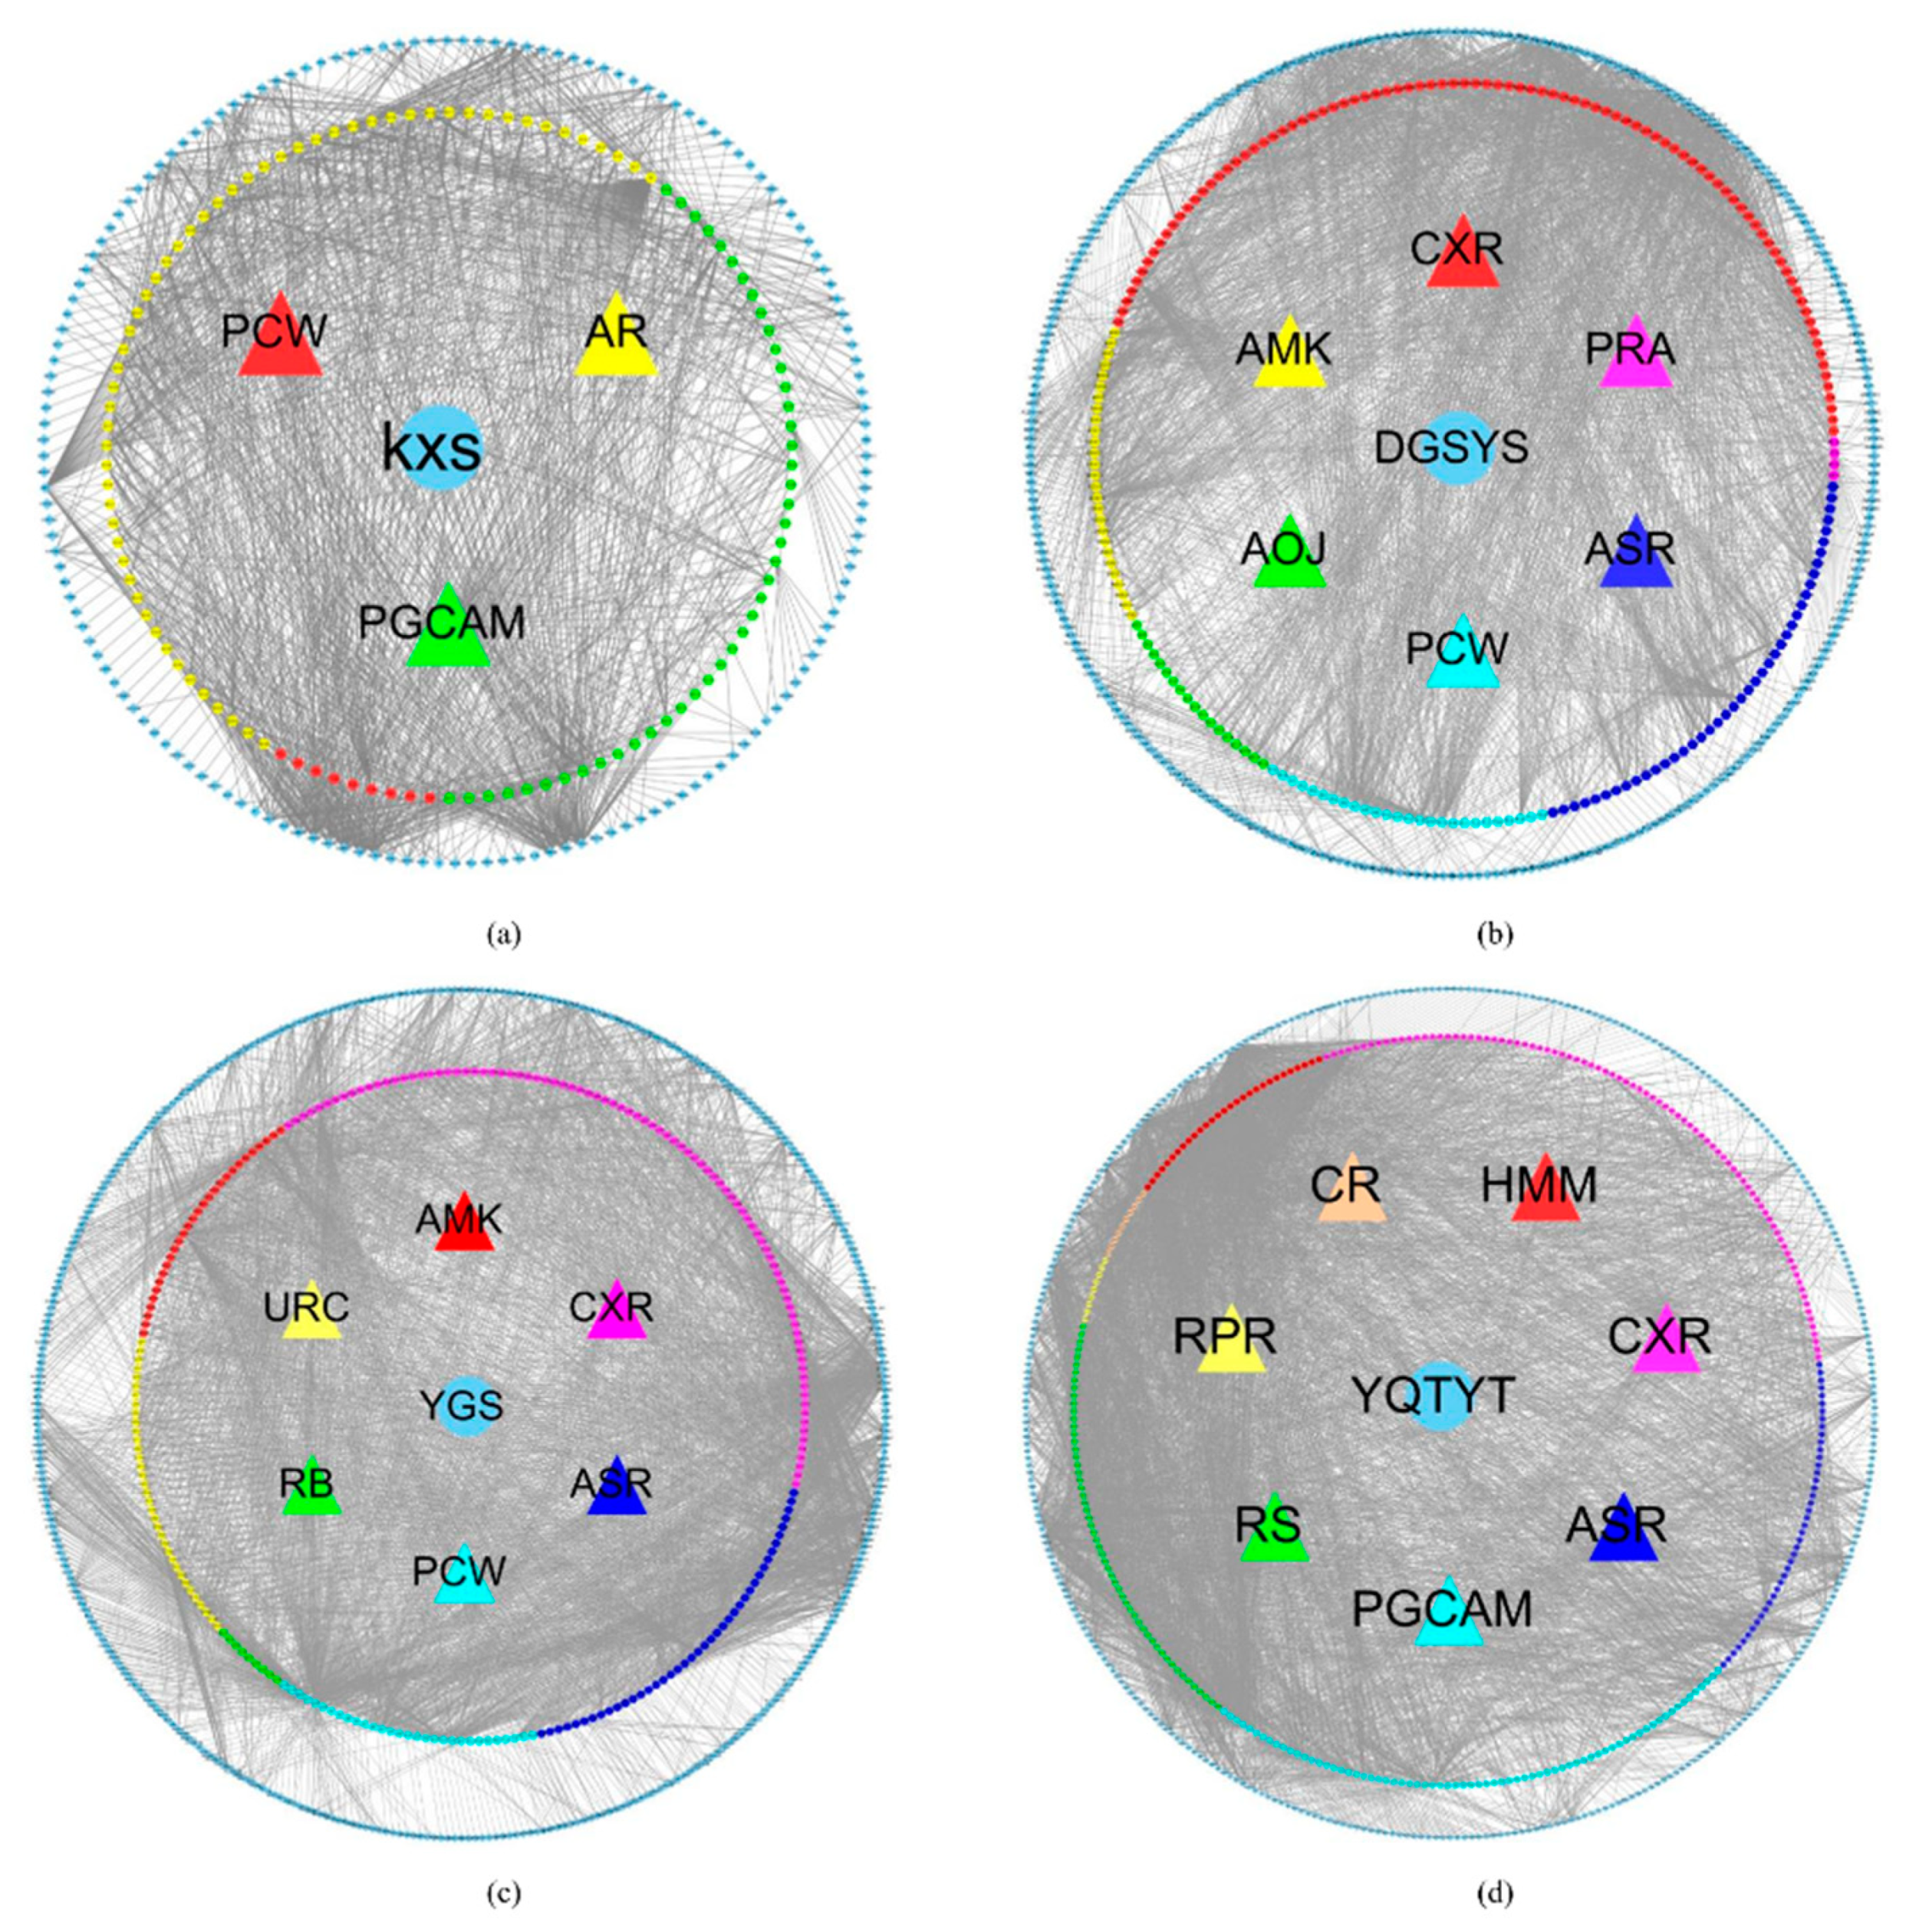
3.1.1. Herb-Active Compound-Target Network

In Supplementary Table S2, 14 kinds of herb compound targets are described. Figure 1 shows the network of four herb-active compounds-target genes. In each sub-image, from the inside to the outside, there are herbs, active compounds, ingredients of the active compound and associated target genes. These active compounds and their ingredients are represented by the same color. In Figure 1a, the blue circle stands for herb KXS. The red triangle, green triangle, and yellow triangle stand for KXS’ active compounds Poria Cocos(Schw.) Wolf. (PCW), Panax Ginseng C. A. Mey. (PGCAM), Acoritataninowii Rhizoma (AR), respectively. The red hexagon, green hexagon, and yellow hexagon stand for ingredients of PCW, ingredients of PGCAM, ingredients of AR, respectively. Blue diamond stands for target genes associated with these ingredients. In Figure 1b, blue circle stands for herb DGSYS. Red triangle, purple triangle, navy blue triangle, wathet blue triangle, green triangle, yellow triangle stand for DGSYS’ active compounds Chuanxiong Rhizoma (CXR), Paeoniae Radix Alba (PRA), Angelicae Sinensis Radix (ASR), PCW, Alisma Orientale(Sam.) Juz. (AOJ), Atractylodes Macrocephala Koidz. (AMK), respectively. Red hexagon, purple hexagon, navy blue hexagon, wathet blue hexagon, green hexagon, yellow hexagon stand for ingredients of CXR, ingredients of PRA, ingredients of ASR, ingredients of PCW, ingredients of AOJ, and ingredients of AMK, respectively. Blue diamond stands for target genes. In Figure 1C, blue circle stands for herb YGS. Red triangle, purple triangle, navy blue triangle, wathet blue triangle, green triangle, and yellow triangle stands for YGS’ active compounds AMK, CXR, ASR, PCW, Radix Bupleuri (RB), Uncariae Ramulus Cumuncis (URC), respectively. Red hexagon, purple hexagon, navy blue hexagon, wathet blue hexagon, green hexagon, and yellow hexagon stand for ingredients of AMK, ingredients of CXR, ingredients of ASR, ingredients of PCW, ingredients of RB, ingredients of URC, respectively. Blue diamond stand for target genes. In Figure 1d, blue circle stands for herb YQTYT. Red triangle, purple triangle, navy blue triangle, wathet blue triangle, green triangle, yellow triangle, and orange triangle stands for YQTYT’ active compounds Hedysarum Multijugum Maxim. (HMM), CXR, ASR, PGCAM, Radix Salviae (RS), Radix Paeoniae Rubra (RPR), Codonopsis Radix (CR), respectively. Red hexagon, purple hexagon, navy blue hexagon, wathet blue hexagon, green hexagon, yellow hexagon, and orange hexagon stand for ingredients of HMM, ingredients of CXR, ingredients of ASR, ingredients of PGCAM, ingredients of RS, ingredients of RPR, ingredients of CR, respectively. Blue diamond stands for target genes.

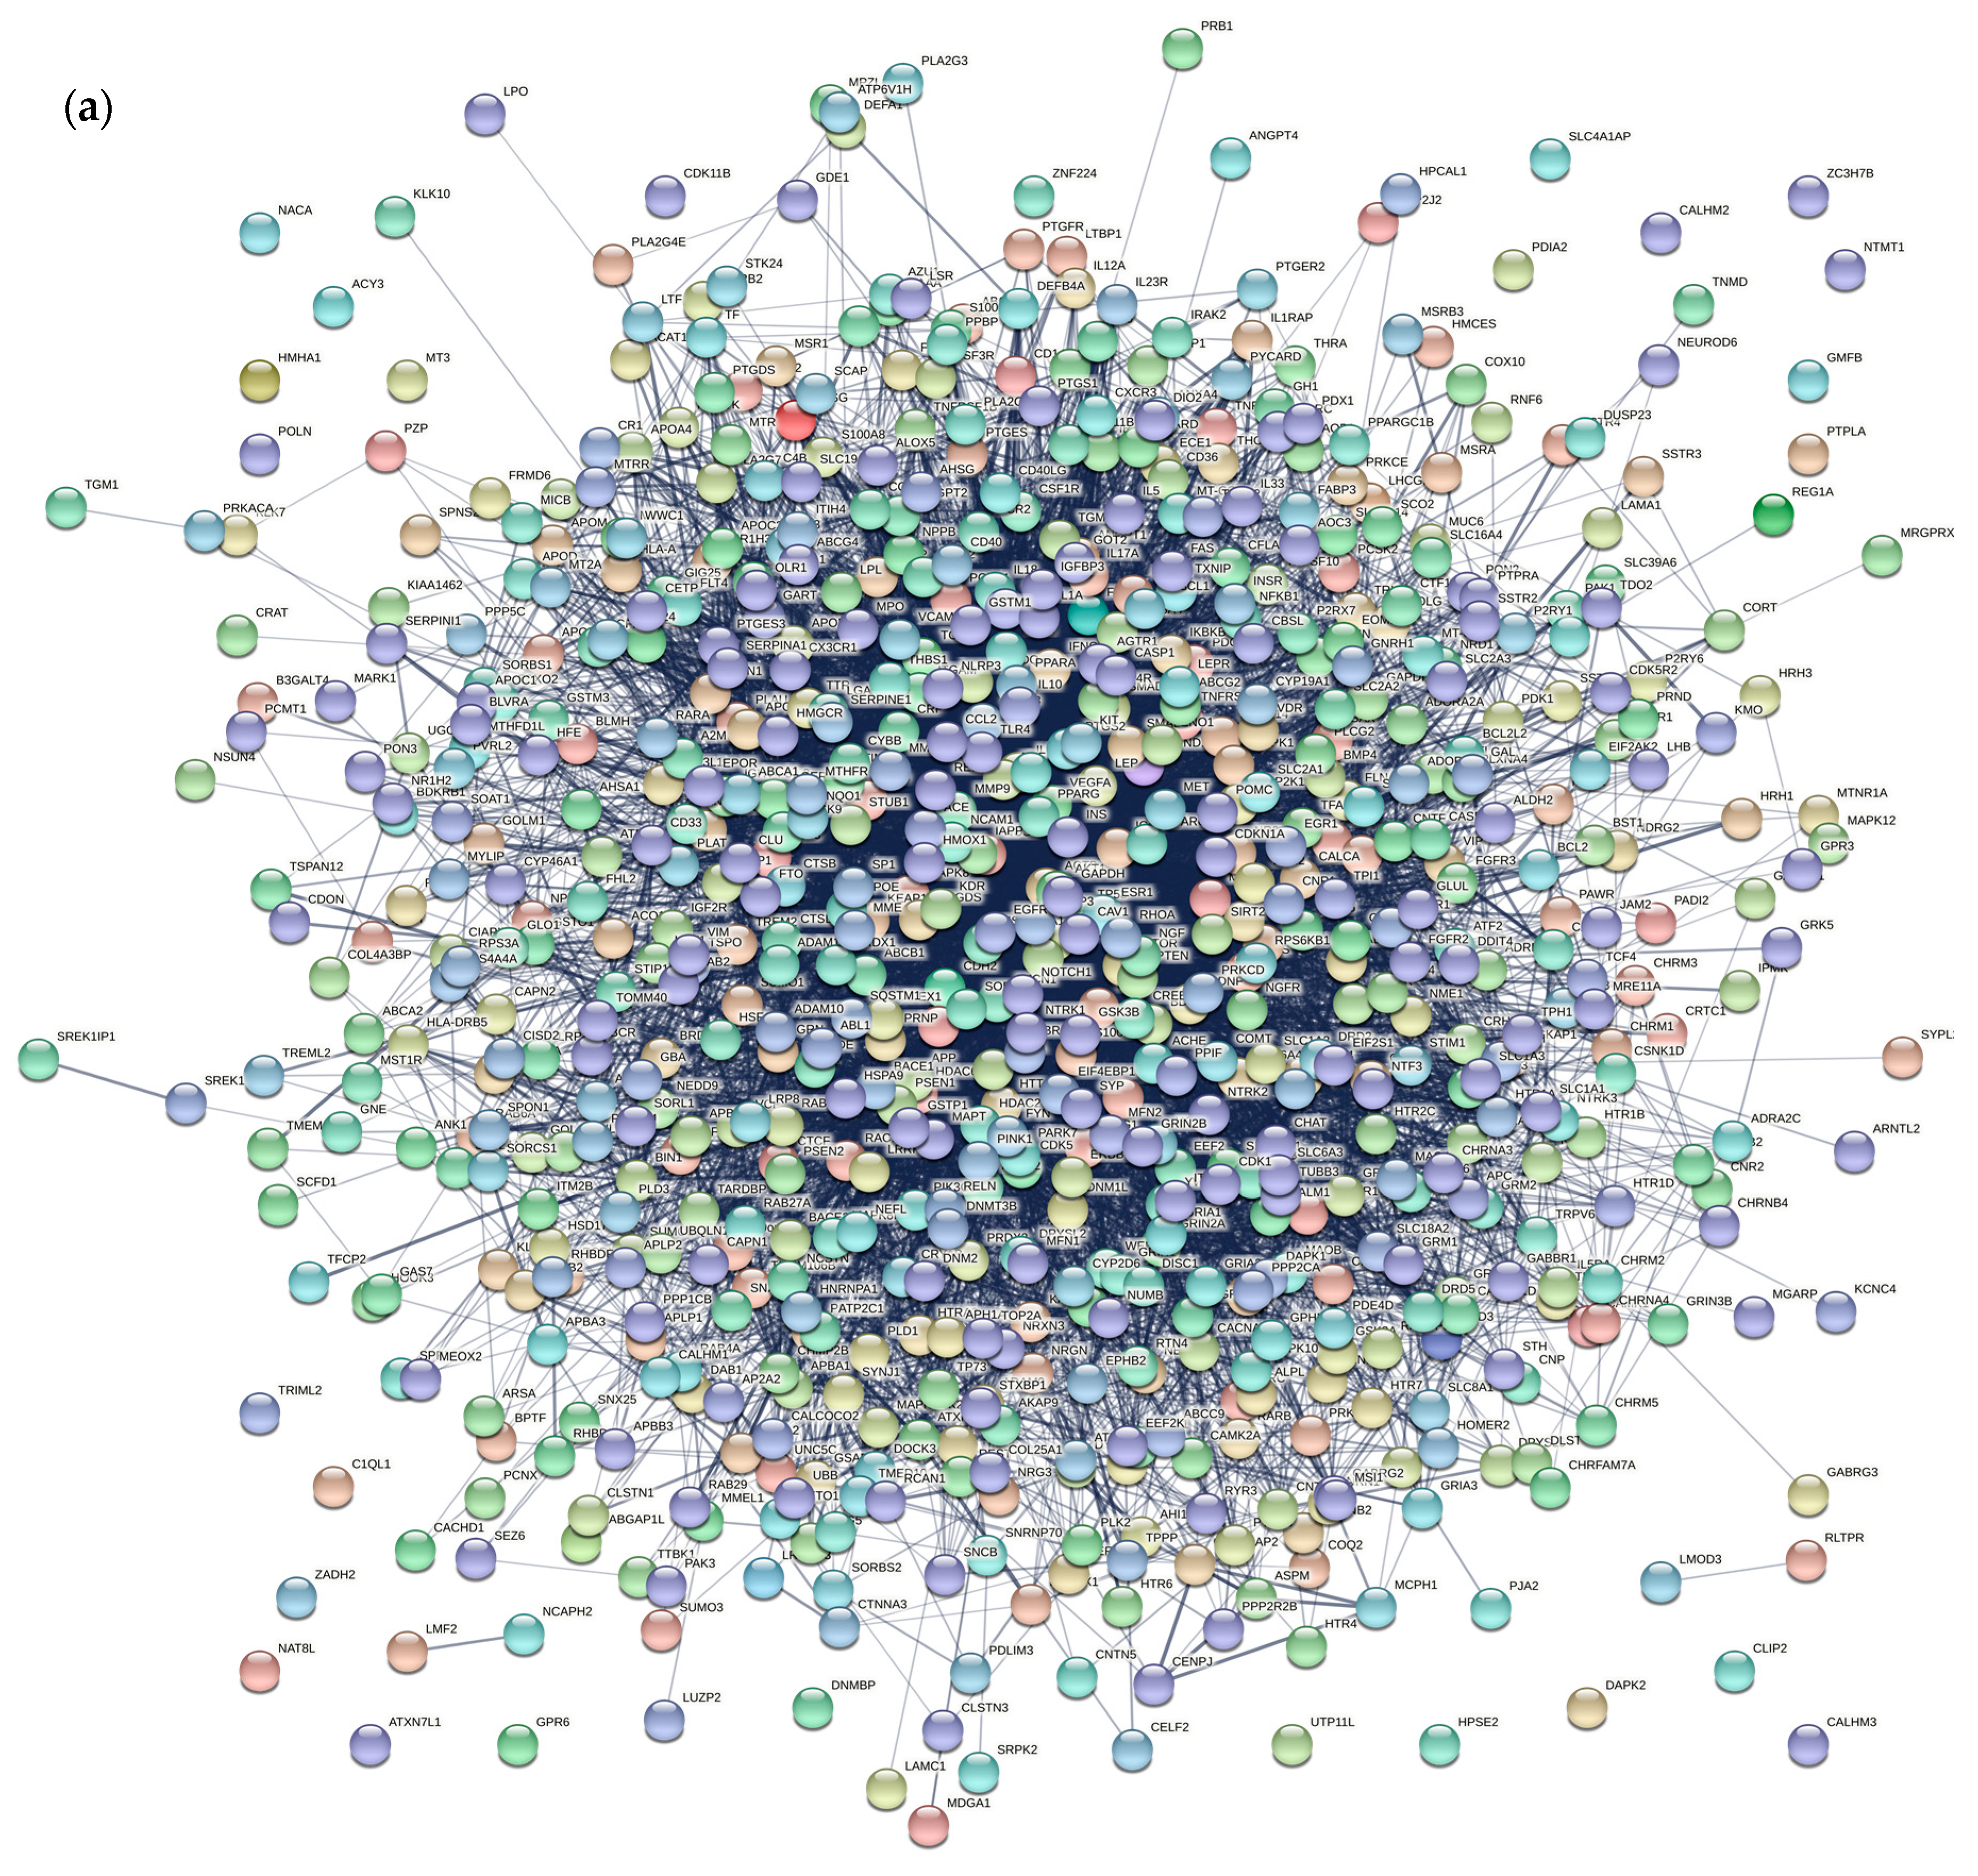
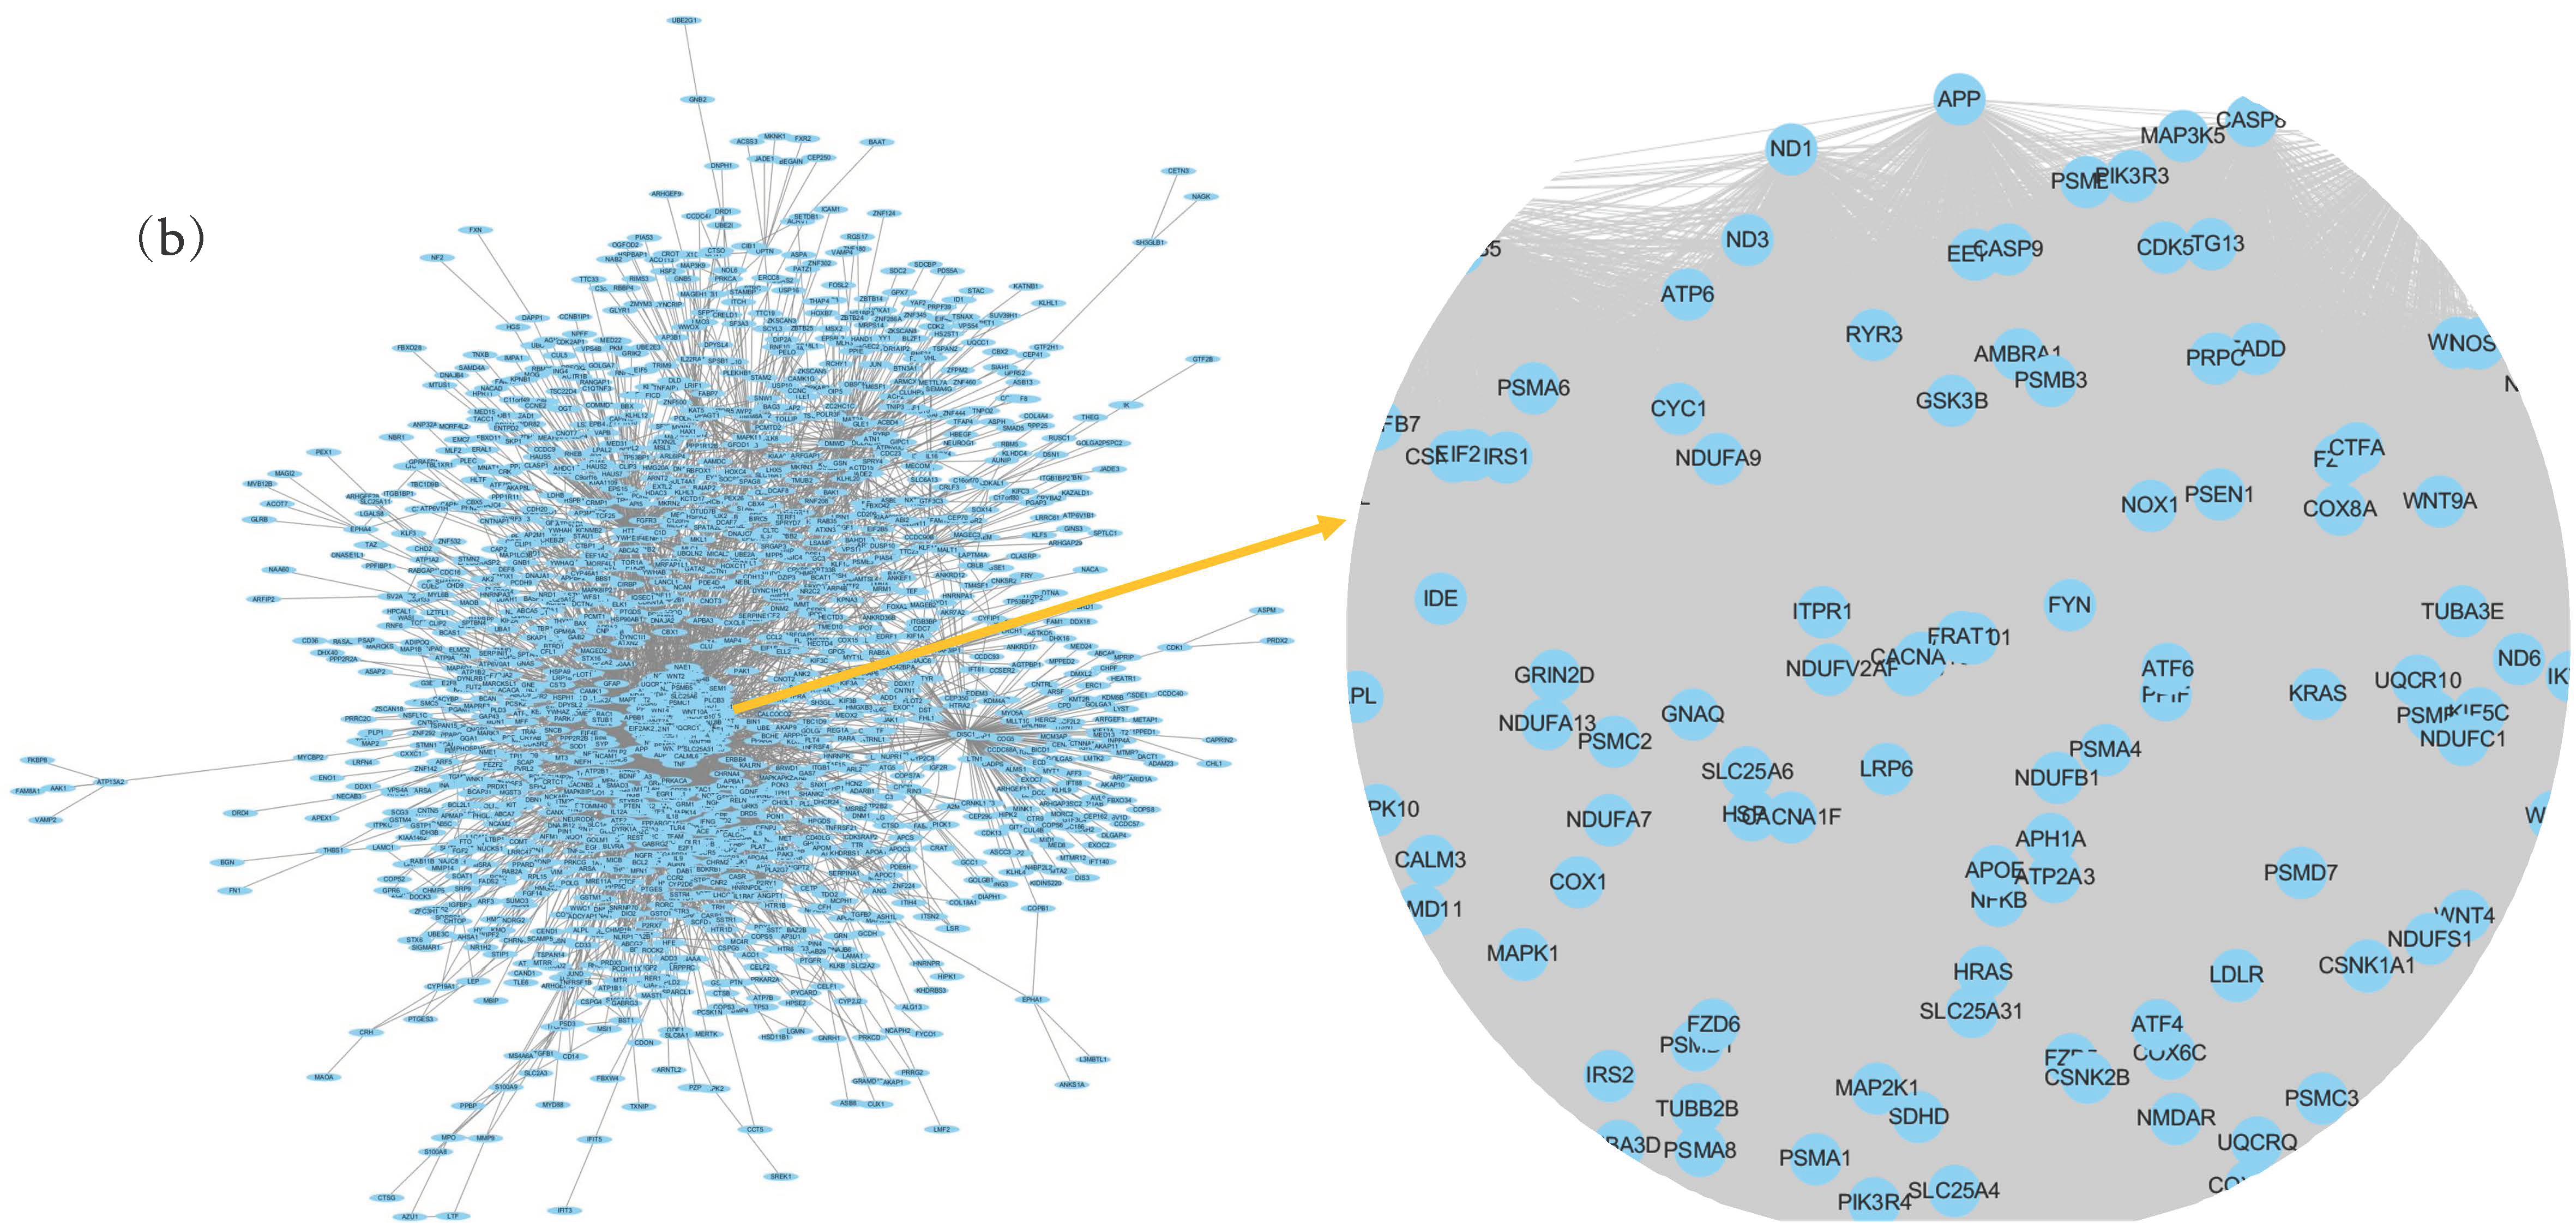
3.1.2. AD Gene Network Construction

First, we collect AD-associated genes from NCBI database, OMIM database, and TTD database, and eliminated data duplications. Then 859 AD-associated genes are obtained. A disease gene network was constructed using the STRING database (input the above genes and select Homo sapiens, Figure 2a), which consists of 746 genes and 10,920 edges. In addition, another PPI network is obtained from the IntAct database. Then, an initial integrated network, which includes 4210 genes and 21,664 edges, is generated by merging the above interaction networks.
Similar to the method used in reference [9], considering the expression status of 13,416 human gene products and containing 79 human tissues in the GEO database (GSE1133), the PCC value between genes is calculated. A pair of genes are linked by an edge if the PCC value is larger than 0.5. Therefore, the gene co-expression network is constructed. Then, we select those genes and edges that appeared in two biological networks (an initial integrated network and a gene co-expression network). The information of AD pathway is added to the integrated network. Pathway datasets are obtained from the database of KEGG and another AD network generated based on three mini metabolic networks [34]. A pair of genes are linked by an edge if they co-exist in any pathway or network. Finally, a multi-database integrated network includes 2017 genes, and 85,152 edges is obtained (Figure 2b). In Figure 2, nodes stand for AD-associated genes from multiple databases, edge of a pair of nodes stand for interaction between nodes.

3.2. Prediction of Essential Genes based on Modular Network

3.2.1. Module Partition

The integrated network is divided into modules by Cluster one, MCL, Glay and MCODE. The gene network modules under different division methods are obtained, the corresponding network entropy is calculated (Table 2).
The AD network is divided into 18 modules by MCODE method, its network entropy is 6.05, which is the lowest. Therefore, MCODE is the optional division method. The score of each module based on MCODE method is defined as the product of the density of the subgraph and the number of vertices (genes) in the sub-graph ( D C × | V | ), which reflects the density of each node in the modules [12]. The number of genes and score of each module are shown in Table 3 (ignoring a single gene).

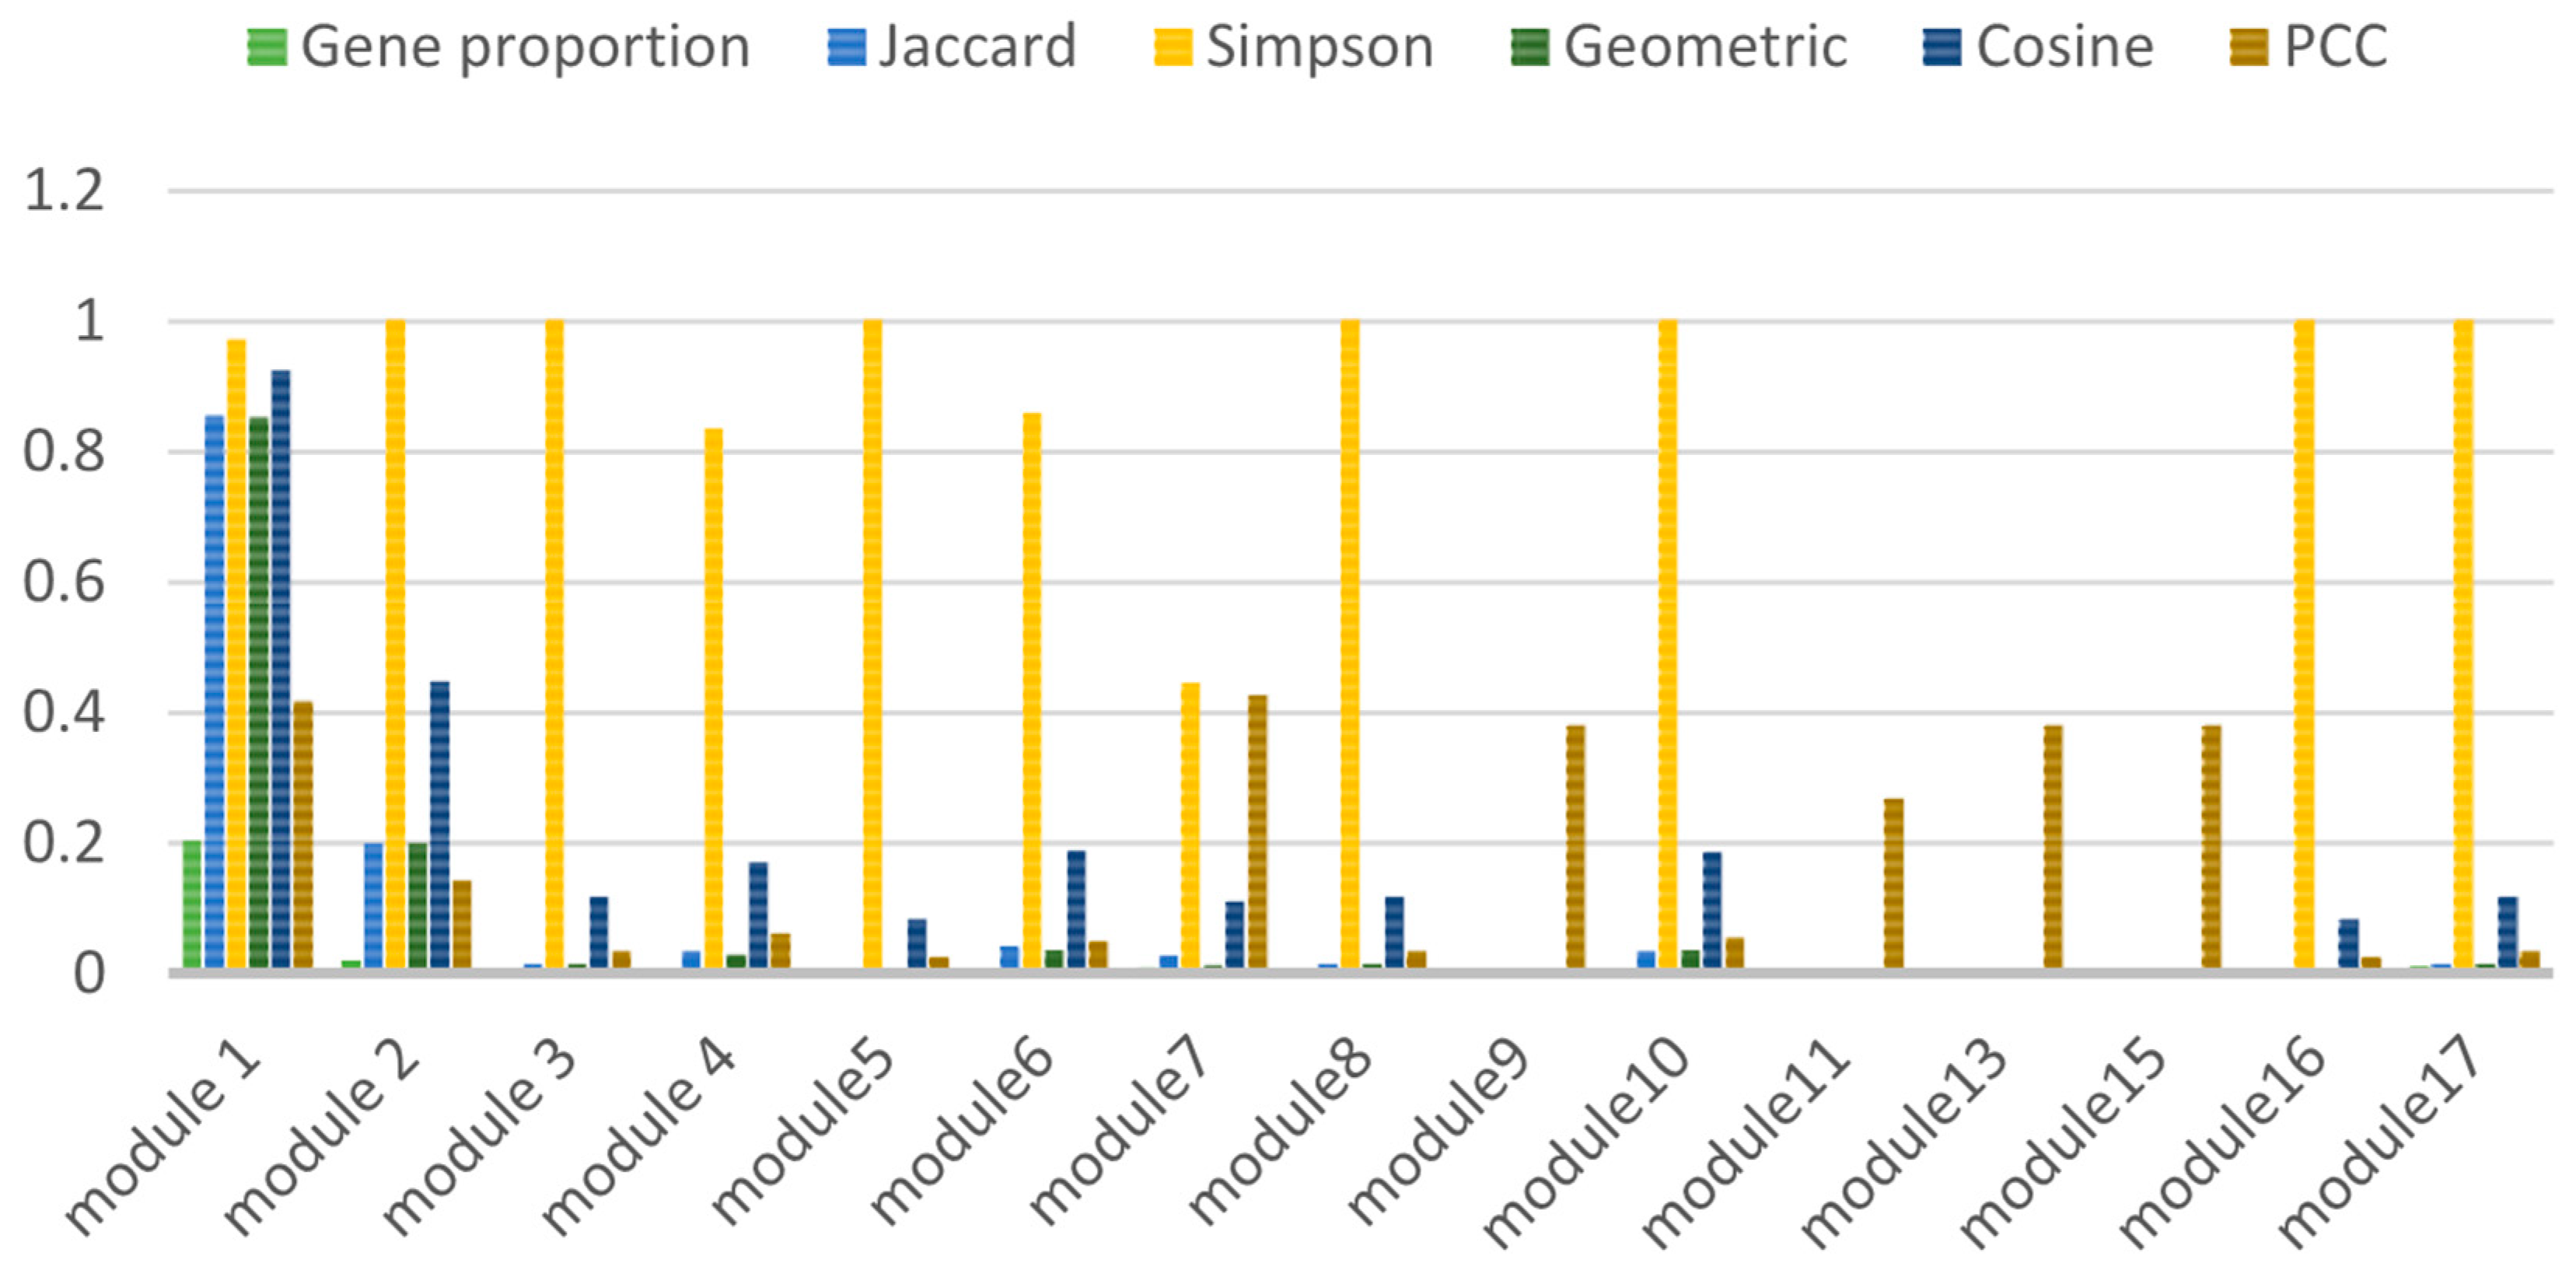
3.2.2. Calculation of Association Indices

In order to explore the correlation between the original network and the divided module network in biological function, KEGG enrichment analysis is carried out on the original AD network and module networks. The final results show that there are 146 pathways involved in the original AD network. These modules, divided by MCODE method, cover 136 pathways with a coverage rate of 93.16%. It shows that these divided modules can express most of the functions of the original AD network.
We count pathway numbers of each module by enrichment analysis, intersection numbers of pathway numbers between original network and each module, union numbers of pathway numbers between original network and each module, the gene proportion of each module in original network, shown in Table 4. Some modules (12, 14 and 18) are enriched to 0 pathways, so they are ignored. Module 1 contains 400 genes, accounting for 20.04% of the total number of genes, and it can be enriched to 132 pathways, 128 of them are consistent with the original network pathways.
Some association indices (Jaccard, Simpson, Geometry, Cosine and PCC), are calculated shown in Figure 3. Module 1 is key module in the AD gene network.

3.2.3. Prediction of Essential Genes

Essential genes can perform their function to a greater extent than other genes in the disease gene network. Module 1 is most representative in AD division modules by MCODE. We use 11 network ranking indexes in Cyto-Hubba to sort the genes in module 1 and select the top 100 genes in each index. Those genes that appear more than six times in the top 100 genes are selected as essential genes of AD. Table 5 shows the repetition times of the genes in module 1 by 11 algorithms.
These genes contain many known AD disease genes: APP, ACHE, ADAM10, APOE, CHRM1, CHRM3, PSEN1, PSEN2 and so on. In addition, CHAT, DR6, NFKB, BACE1, IDE, PP2A, GSK3B appear in the metabolic network of AD [34] (Table 5), which shows that module 1 is a key module and can be used to predict essential genes instead of the original network.

3.3. Integrated Algorithm for Predicting Essential Genes

The posterior probability of candidate genes in AD disease network are calculated by an integrated algorithm. Table 6 shows the relevant information of the top 30 candidate genes (2017 candidate genes in total).
Table 6 shows that the known AD genes APP, ADAM10, ACHE and APOE are in the prediction results. Further, the receiver operating characteristic (ROC) analysis is employed as the evaluation criteria to confirm the performance advantage of Integrated algorithm by varying a threshold for determining positives. The first positive control genes are those known AD disease genes from the pathway of KEGG (hsa05010: Alzheimer’s disease), the negative control genes are selected from leukemia genes and diabetes genes that do not associate with AD genes in an integrated network. The relationship between the true positive rate (TPR) and the false positive rate (FPR) is shown with a blue line in Figure 4; the area under the ROC curve (AUC) is 0.984. The second positive control genes are those disease genes from the AD network generated based on three mini metabolic networks [34], the negative control genes are selected from leukemia genes and diabetes genes that do not associate with AD genes in an integrated network, the relationship between TPR and FPR is shown with a green line in Figure 4, the AUC is 0.916. These results demonstrate that Integrated algorithm can identify essential genes of AD.

3.4. Screening of Essential Genes of AD

The essential genes are obtained by using the modular network algorithm and integrated algorithm. The common genes between the above two algorithms as final essential genes of AD (Table 7).

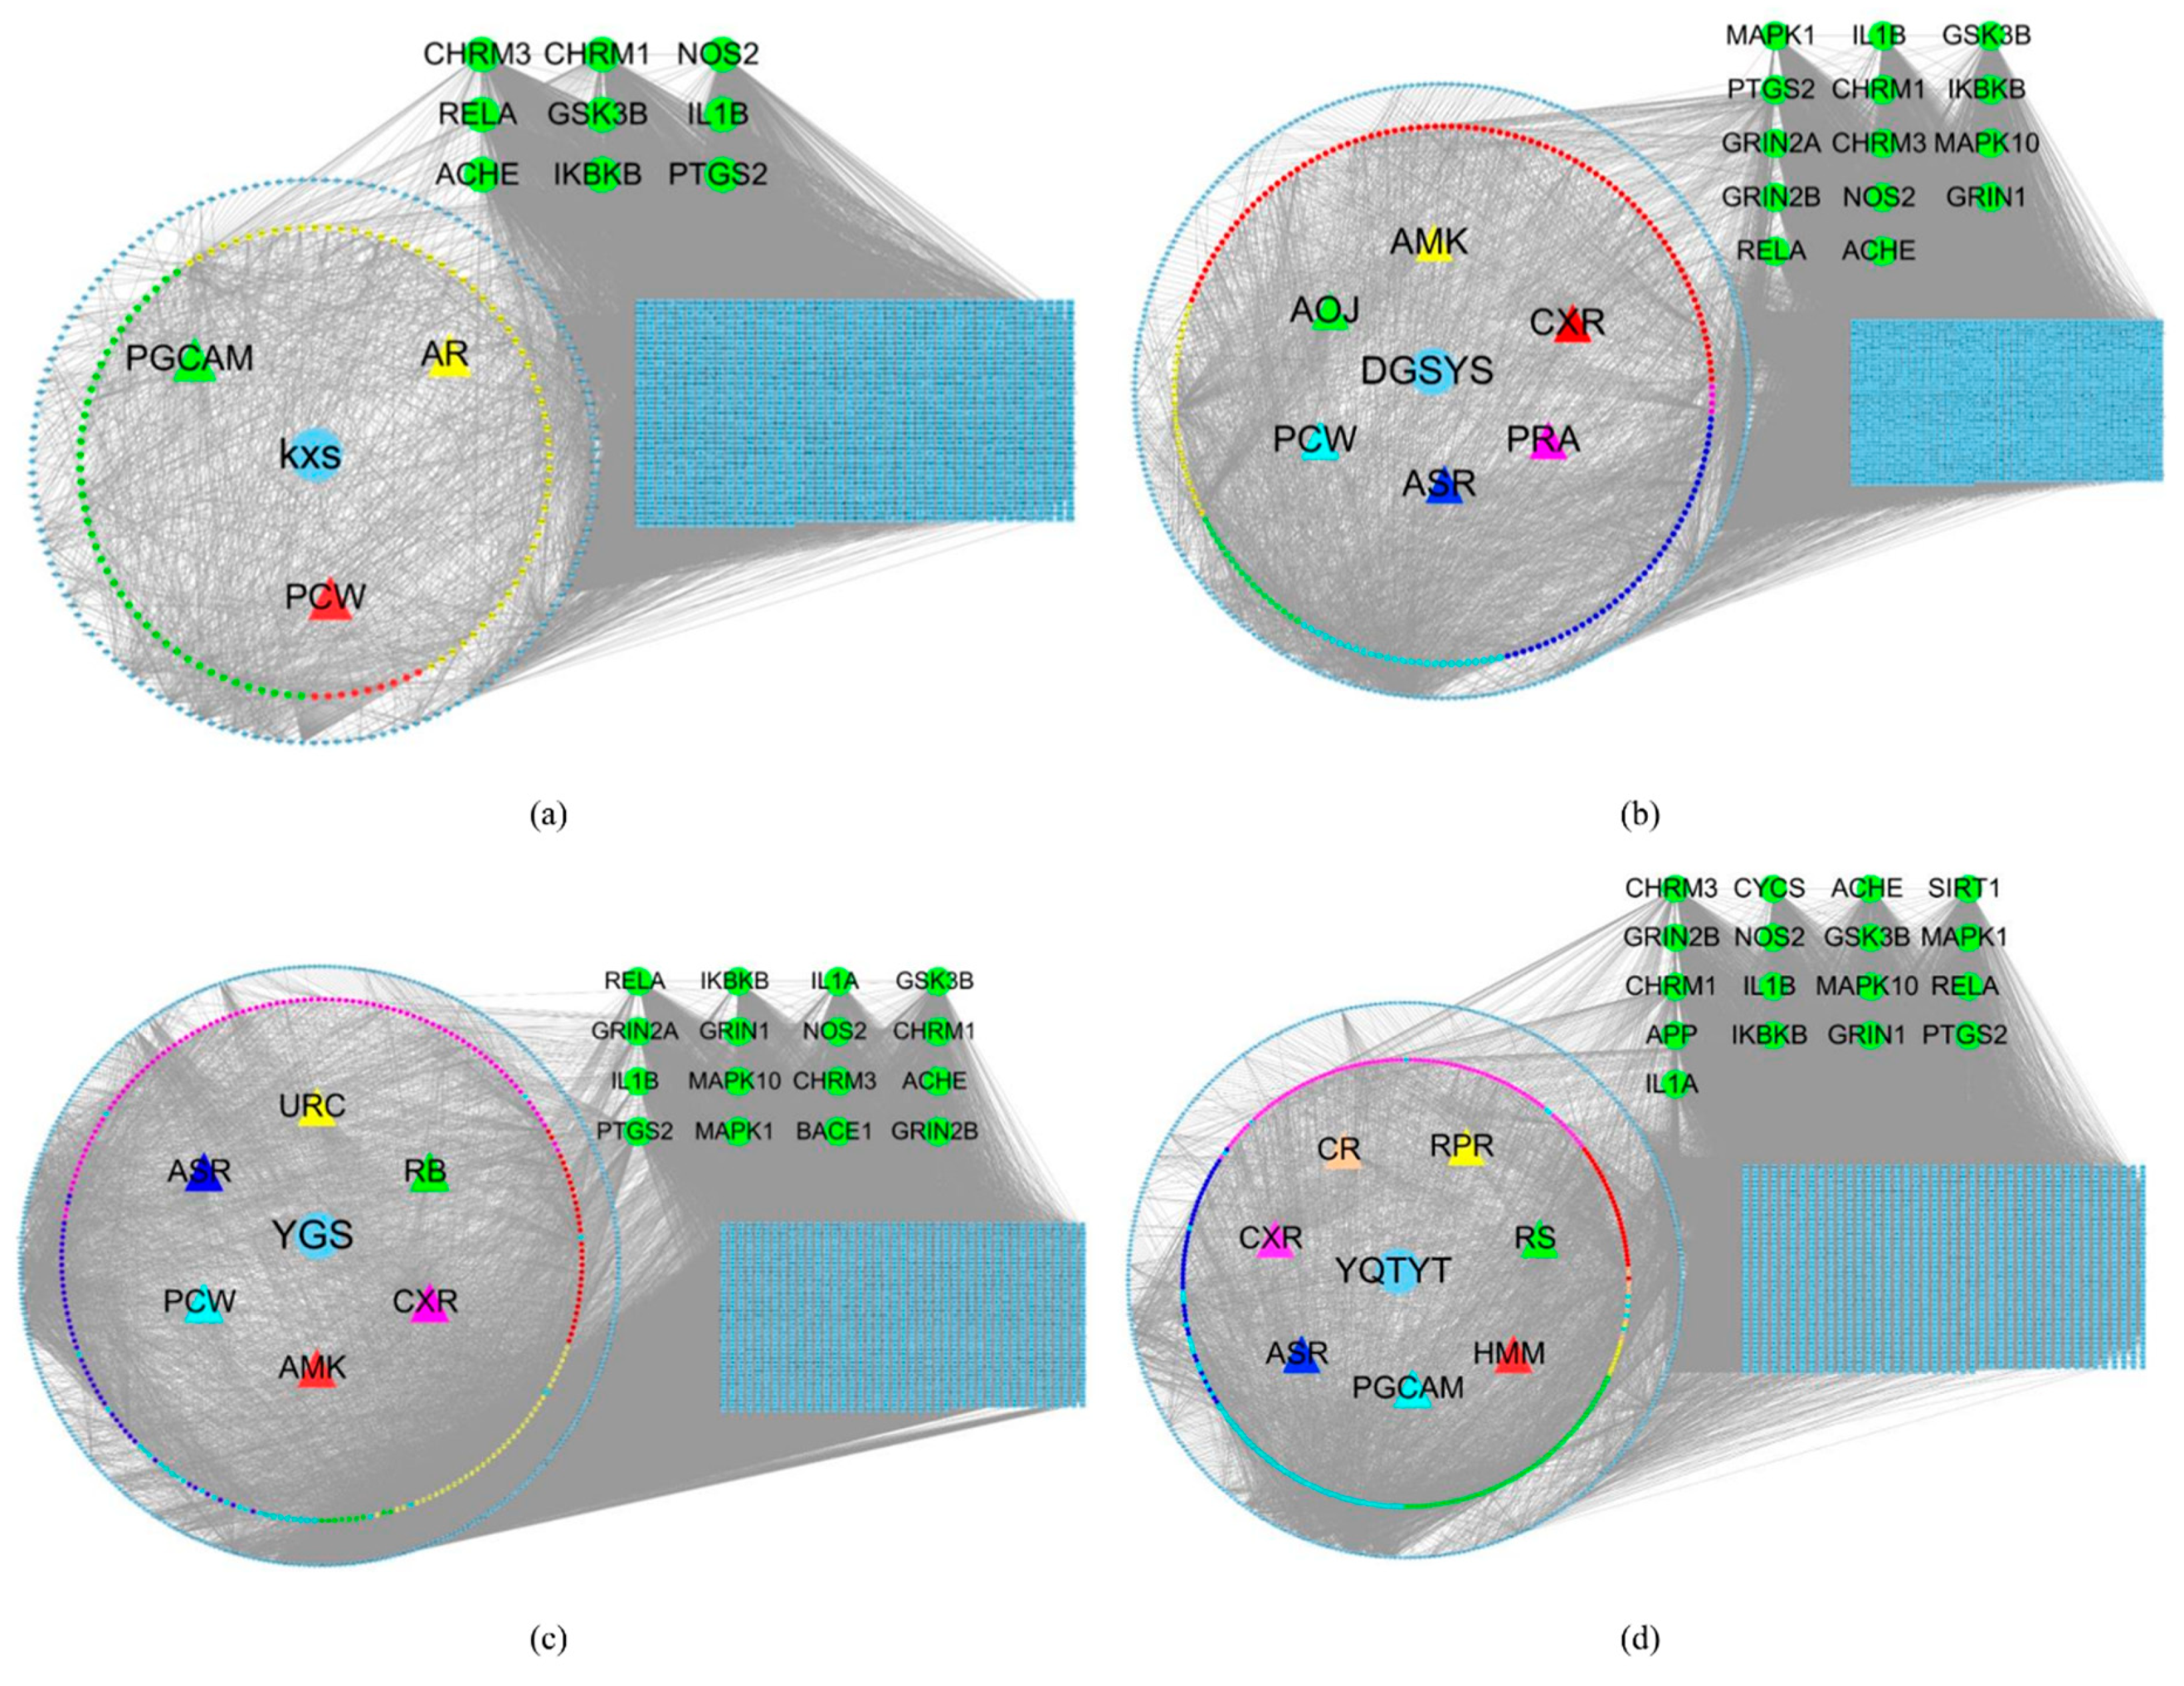
3.5. Herb- Active Compounds-Target Genes-Essential Genes Network

There are many similar genes between the target genes of the herb compound and the essential genes of AD (Table 8), which indicates that herbs may act on compound targets to regulate disease-related proteins indirectly, whereas herbs can act on these AD proteins directly. AD’s herb (KXS, DYSYS, YGS, YQTYT)-active compound-active compound targets-AD gene network and similar genes are visualized (Figure 5).

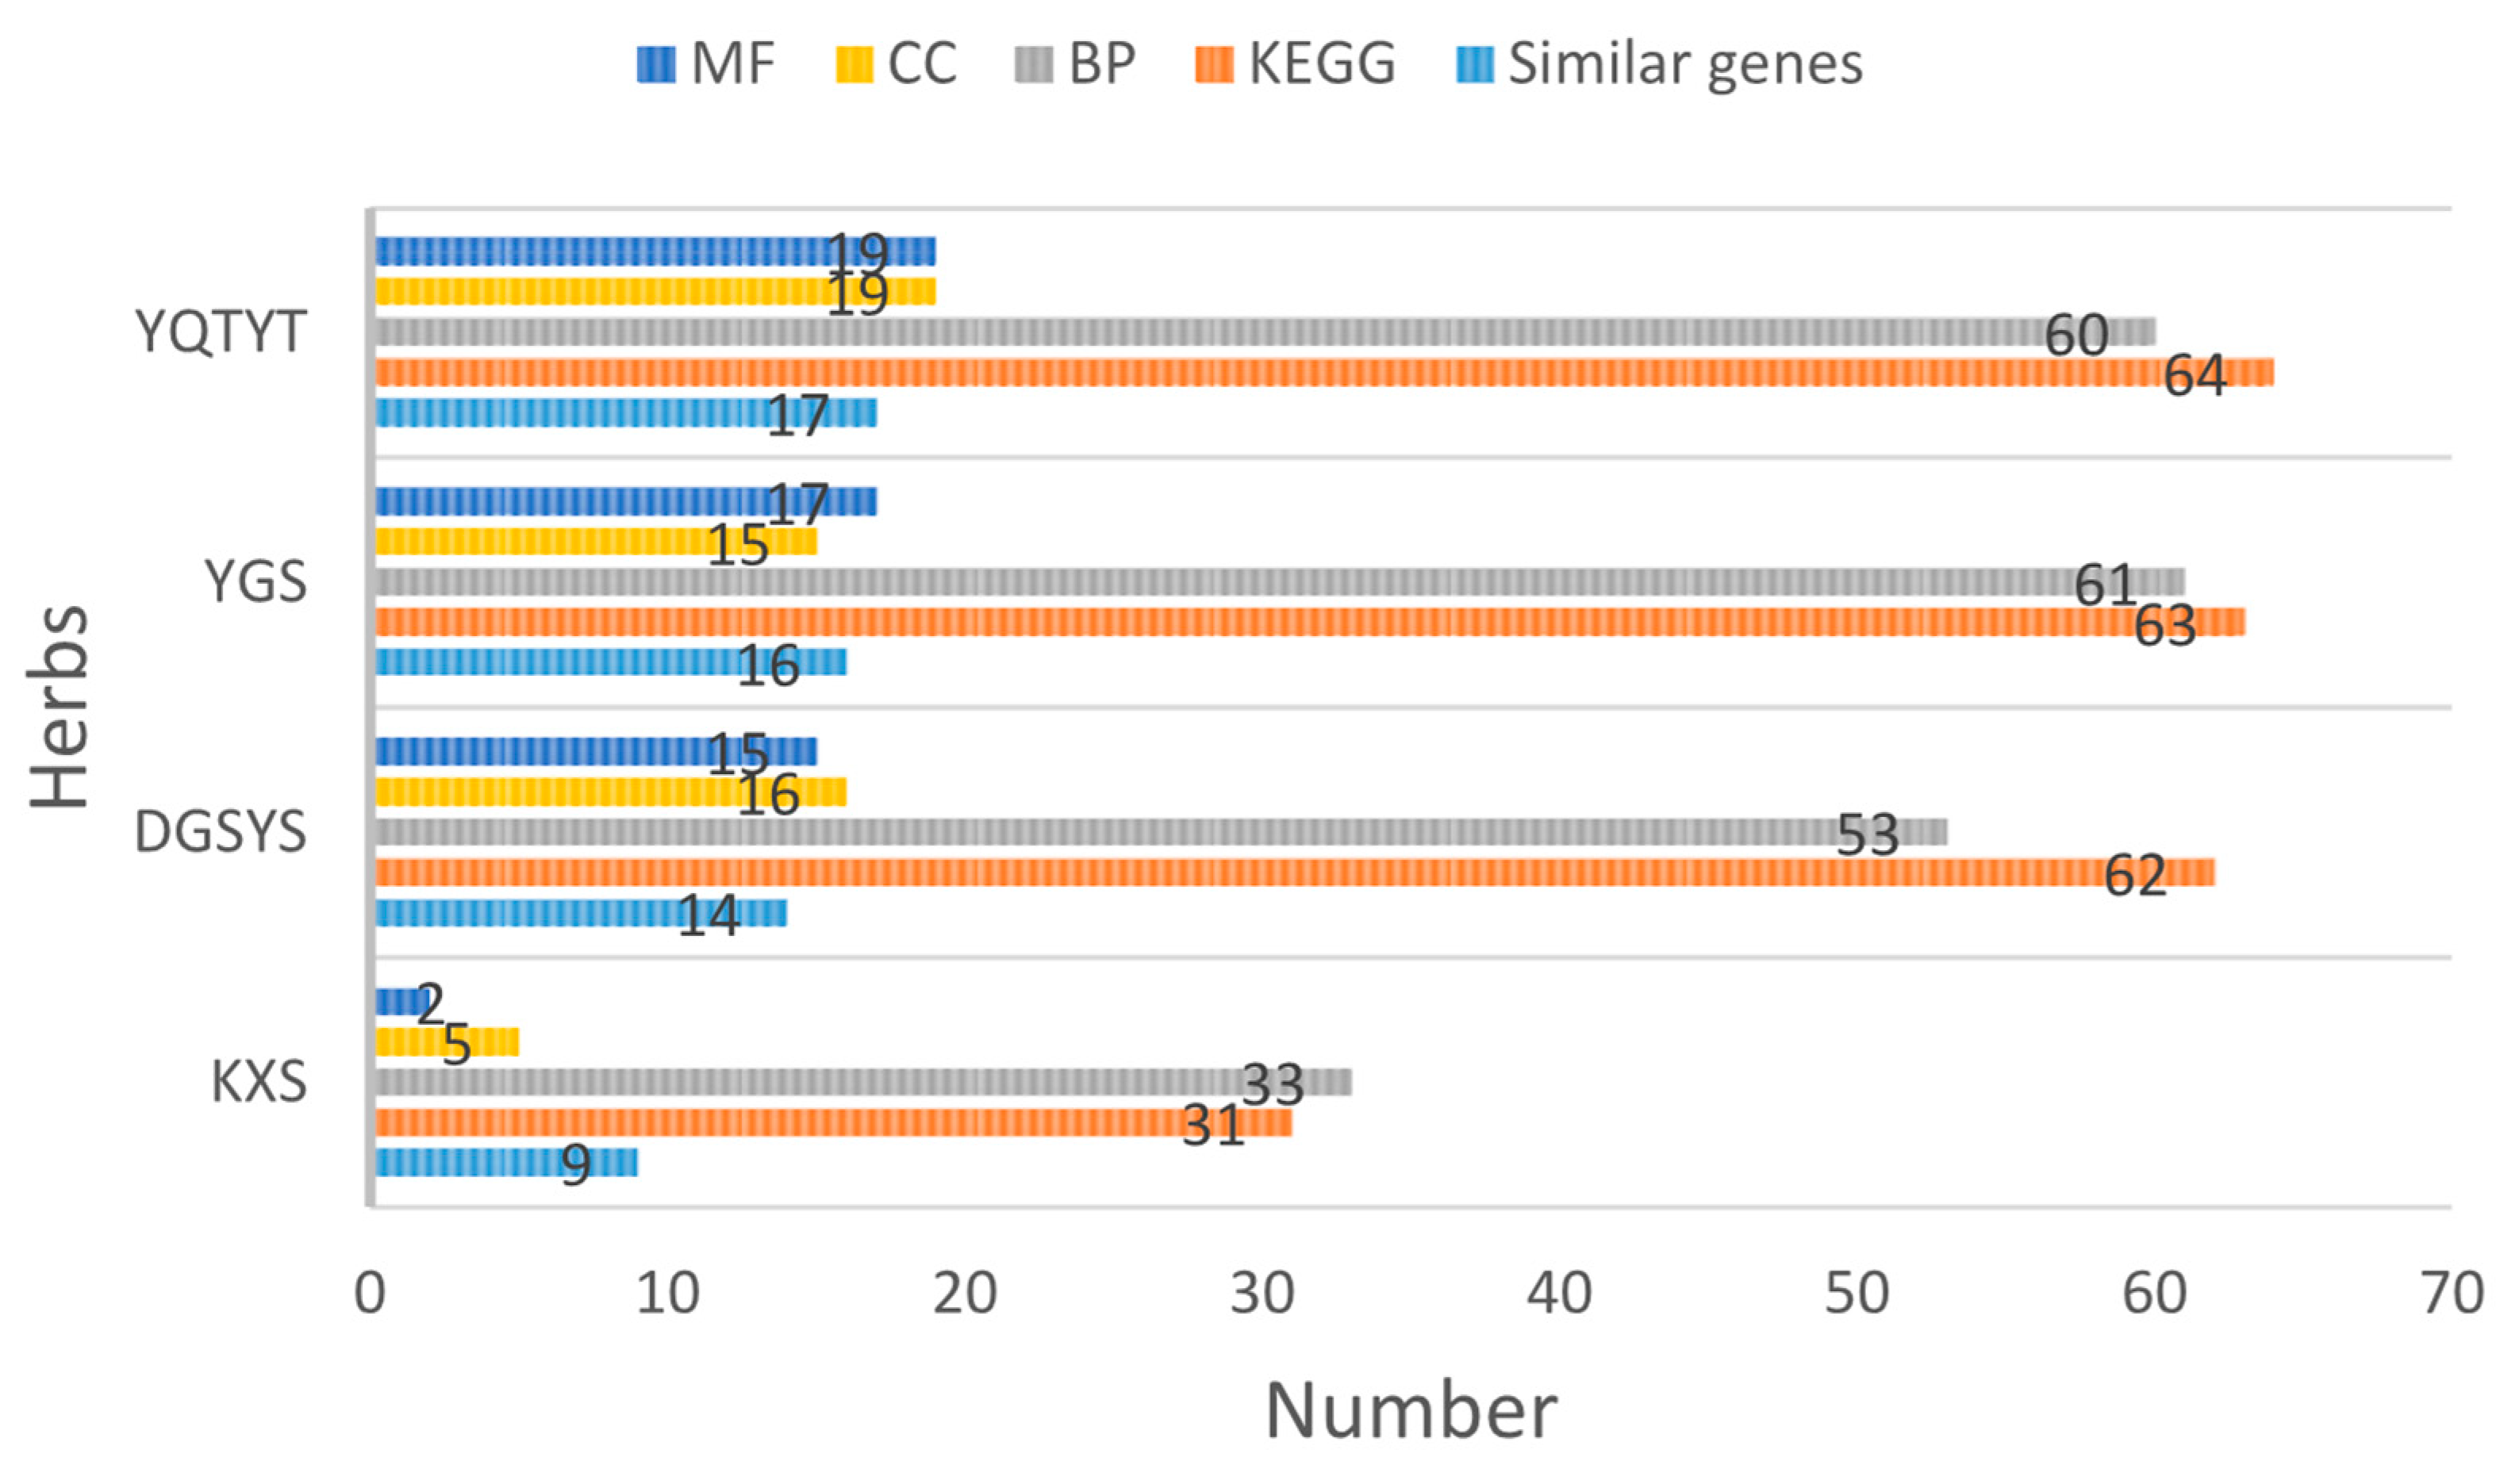
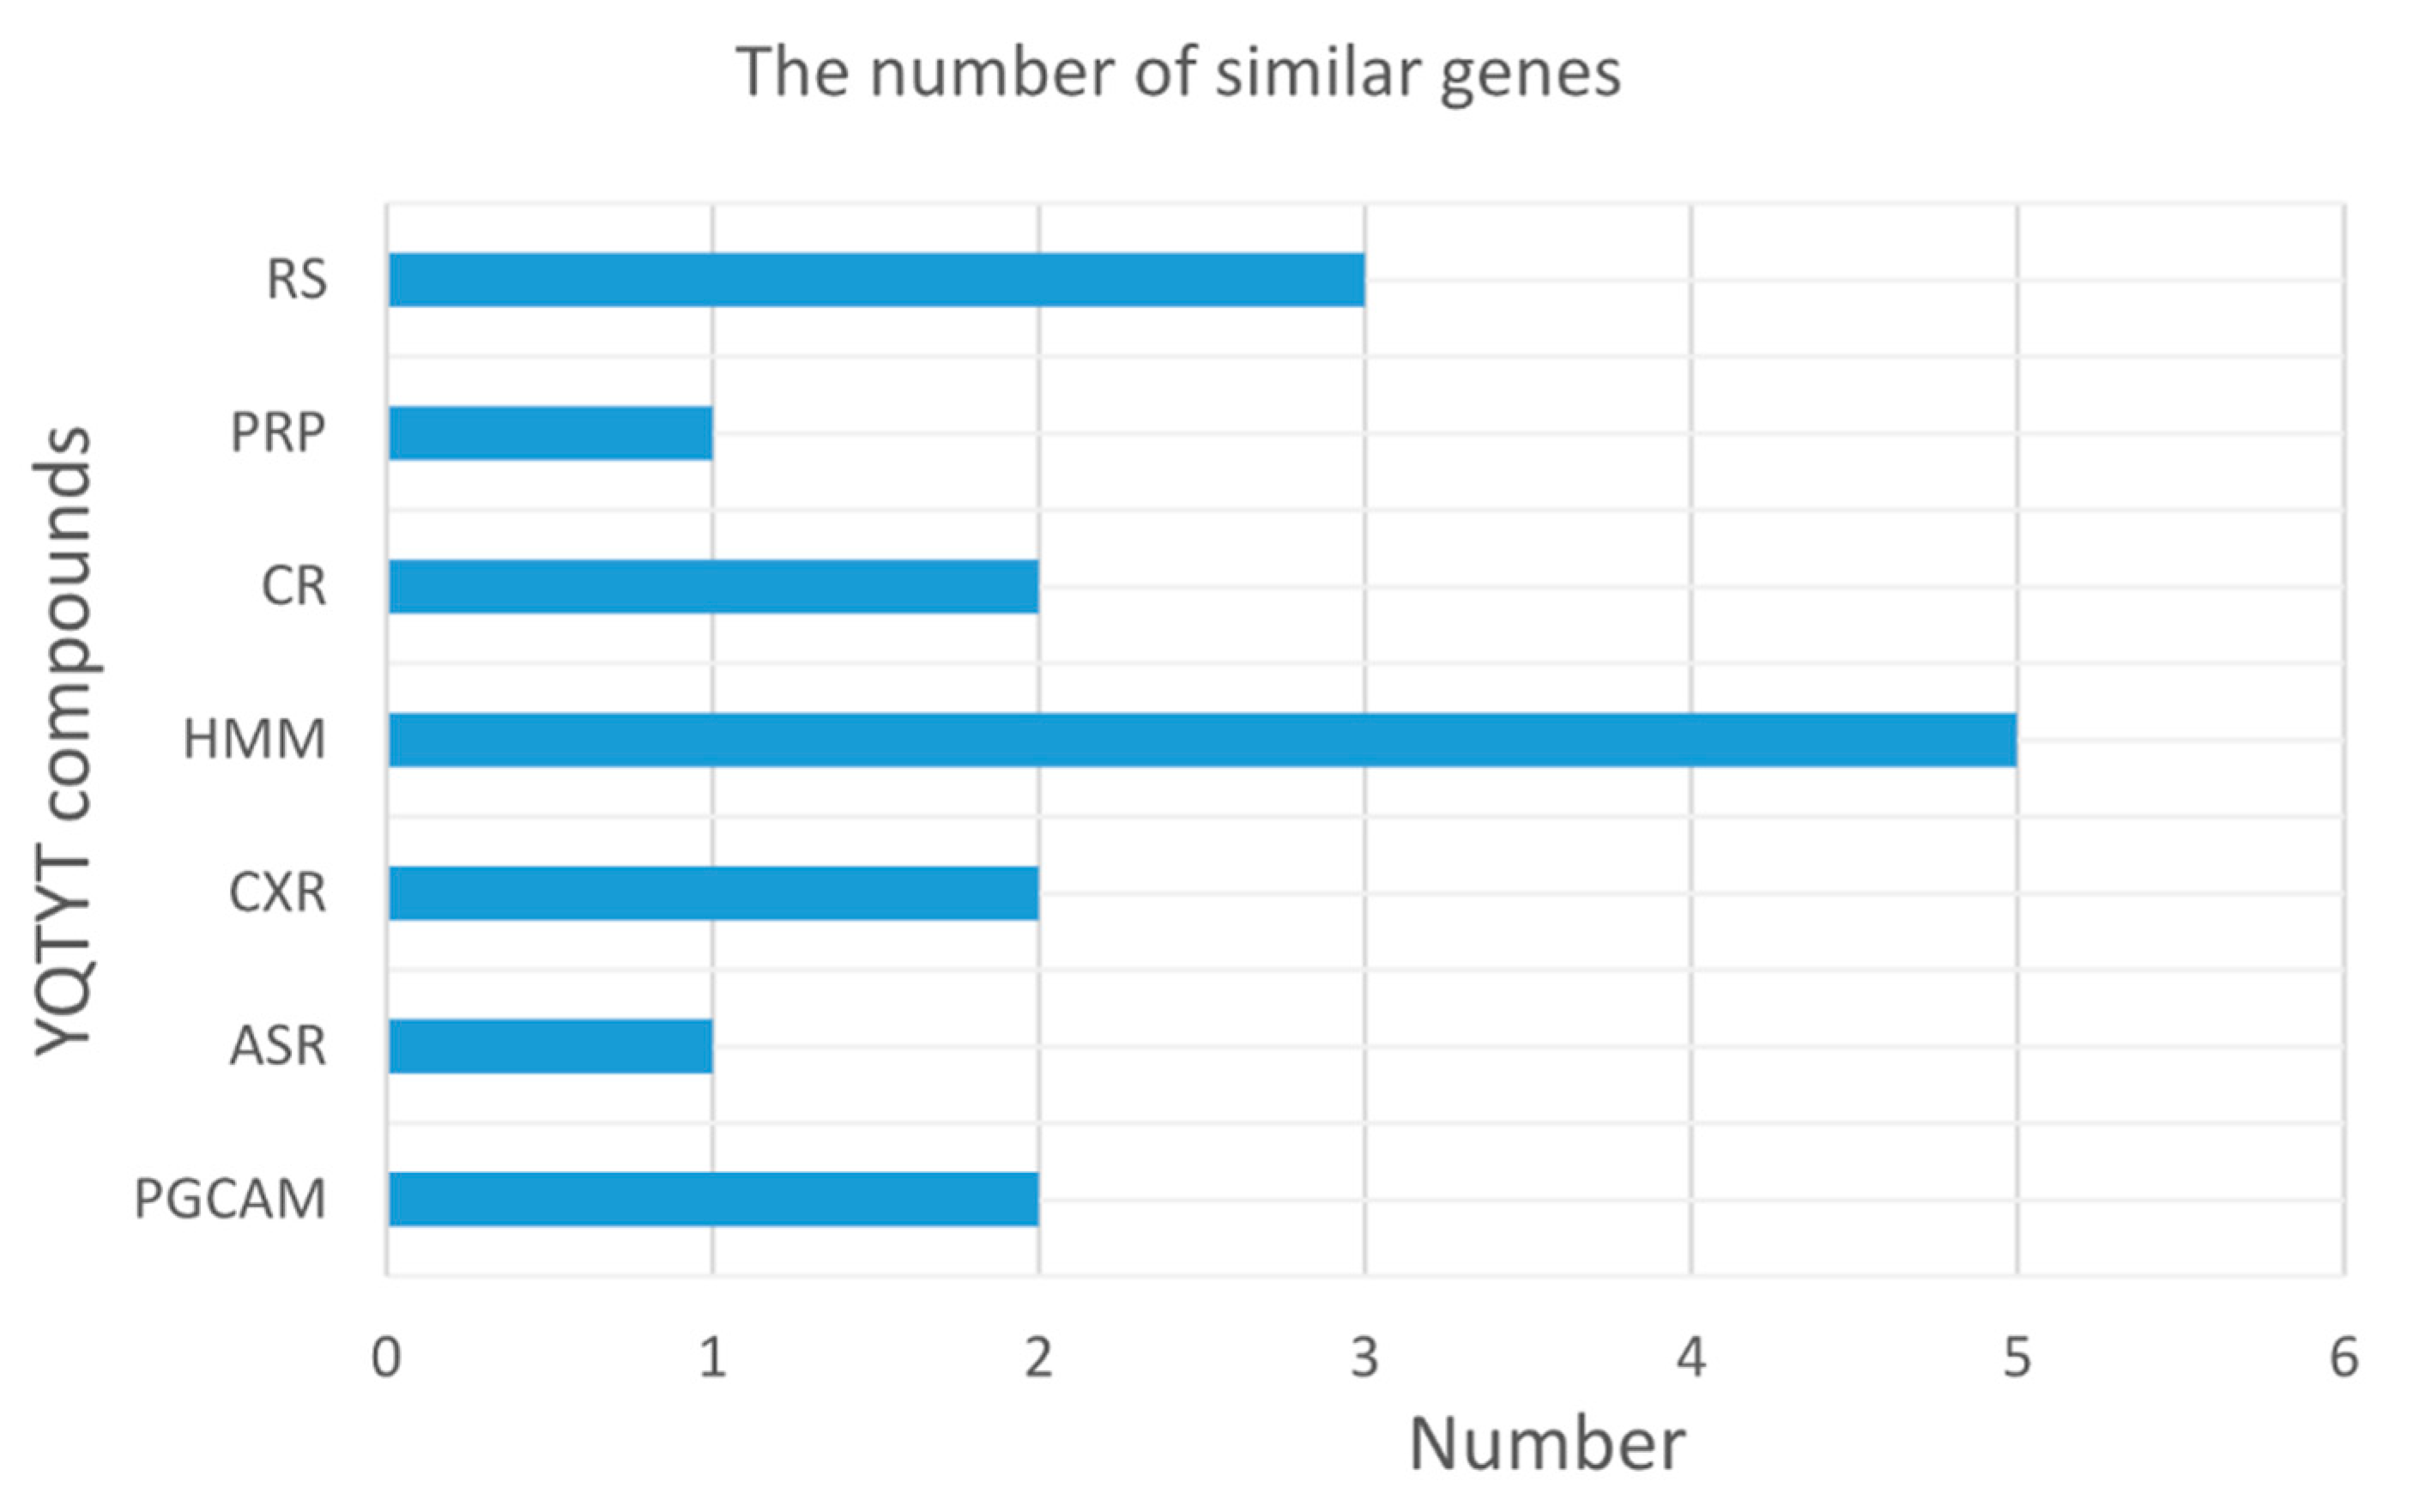
3.6. Enrichment Analysis of Herb Compound Target

The Gene Ontology (GO) enrichment analysis (including Biological Process (BP), Cell Component (CC), Molecular Function (MF)) and KEGG pathway enrichment analysis are described in Supplementary Tables S3–S6, these similar genes can be enriched into AD-associated pathways, which indicates that these similar genes are significantly associated with a response to AD.
We count the number of similar genes between the target genes of the herb compound and essential genes of AD, the number of GO enrichment analysis items and the number of KEGG pathway enrichment analysis items, as shown in Figure 6.
We can see from Figure 6 that YQTYT achieves the best performance in GO enrichment analysis items and KEGG pathway enrichment analysis items, while the number of similar genes between YQTYT and essential genes of AD is 17, which indicates that YQTYT is the best herb in four kinds of AD herbs, and YQTYT may have a better therapeutic effect on AD.
Furthermore, we count the number of similar genes between the target genes of YQTYT compound and genes of AD pathway in the KEGG (hsa05010: Alzheimer’s disease), compound HMM has the largest number of similar genes, followed by compound RS (Figure 7), so HMM and RS are both contributive to the treatment of AD.

4. Conclusions

Currently, herbs have an effect on some diseases such as AD, nephropathy. Herbs are more systematic and holistic. However, some studies are still applying the traditional research idea, “one drug-one target-one illness”, which ignores the multi-target and multi-component characteristic of herbs. In this paper, the gene network of AD is constructed by considering some factors such as gene co-expression and metabolic relationship. The modular network algorithm, the logical regression algorithm under Bayesian framework and maximum likelihood estimation, which simplify the gene network and find essential genes highly associated with the AD. By using the idea of network pharmacology, YQTYT is the best herb in four kinds of AD herbs, and YQTYT may have a better therapeutic effect on AD. In addition, HMM and RS are selected as the better herb compounds for AD based on gene function enrichment analysis. Which means the herb compounds may play a major role in the treatment of AD.
Therefore, network pharmacology, network science, machine learning and statistical strategy are expected to find multi-target herb and herb components for the treatment of AD. Theoretical knowledge is provided for the follow-up study of herbs in the treatment of AD, and a feasible scheme is provided for the study of “drug-target-disease”.

Supplementary Materials

The following are available online at https://www.mdpi.com/article/10.3390/e23101365/s1, Table S1: Herb compounds; Table S2: Information of herb compound target genes; Table S3-1: KEGG Enrichment analysis of similar genes between target genes of KXS compound and essential genes of AD, Table S3-2: GO Enrichment analysis (BP) of similar genes between target genes of KXS compound and essential genes of AD, Table S3-3: GO Enrichment analysis (CC) of similar genes between target genes of KXS compound and essential genes of AD, Table S3-4: GO Enrichment analysis (MF) of similar genes between target genes of KXS compound and essential genes of AD; Table S4-1: KEGG Enrichment analysis of similar genes between target genes of DGSYS compound and essential genes of AD, Table S4-2: GO Enrichment analysis (BP) of similar genes between target genes of DGSYS compound and essential genes of AD, Table S4-3: GO Enrichment analysis (CC) of similar genes between target genes of DGSYS compound and essential genes of AD, Table S4-4: GO Enrichment analysis (MF) of similar genes between target genes of DGSYS compound and essential genes of AD; Table S5-1: KEGG Enrichment analysis of similar genes between target genes of YGS compound and essential genes of AD, Table S5-2: GO Enrichment analysis (BP) of similar genes between target genes of YGS compound and essential genes of AD, Table S5-3: GO Enrichment analysis (CC) of similar genes between target genes of YGS compound and essential genes of AD, Table S5-4: GO Enrichment analysis (MF) of similar genes between target genes of YGS compound and essential genes of AD; Table S6-1: KEGG Enrichment analysis of similar genes between target genes of YQTYT compound and essential genes of AD, Table S6-2: GO Enrichment analysis (BP) of similar genes between target genes of YQTYT compound and essential genes of AD, Table S6-3: GO Enrichment analysis (CC) of similar genes between target genes of YQTYT compound and essential genes of AD, Table S6-4: GO Enrichment analysis (MF) of similar genes between target genes of YQTYT compound and essential genes of AD.

Author Contributions

Writing—original draft preparation, C.Z. and S.C.; methodology, C.Z.; software, C.Z.; validation, H.G.; writing—review and editing, C.Z. and S.C.; supervision, S.C. All authors have read and agreed to the published version of the manuscript.

Funding

This research was funded by The National Natural Science Foundation of China, grant number 11801412, The Science Fund of Tianjin Education Commission for Higher Education, grant number 2019KJ025 and Natural Science Foundation Project of Hebei, grant number F2019402078.

Institutional Review Board Statement

Not applicable.

Informed Consent Statement

Not applicable.

Data Availability Statement

The data used to support the findings of this study are available from the corresponding author upon request.

Conflicts of Interest

The authors declare no conflict of interest.

Abbreviations

ADAlzheimer’s disease
MCLMarkov Clustering
MCODEMolecular Complex Detection
GlayCommunity Clustering
PPIprotein-protein interaction
PCCPearson Correlation Coefficient
TCMSPTraditional Chinese Medicine Systems Pharmacology
NCBINational Center for Biotechnology Information
OMIMOnline Mendelian Inheritance in Man
TTDTherapeutic Target Database
IntActIntAct Molecular Interaction Database
GEOGene Expression Omnibus
KEGGKyoto Encyclopedia of Genes and Genomes
CORUMComprehensive Resource of Mammalian protein complexes
KXSKaixinsan (herb)
DGSYSDangguishaoyaosan (herb)
YGSYigansan (herb)
YQTYTYiqitongyutang (herb)
PGCAMPanax Ginseng C. A. Mey. (compound of KXS and YQTYT)
ARAcoritataninowii Rhizoma (compound of KXS)
PCWPoria Cocos(Schw.) Wolf. (compound of KXS, DGSYS and YGS)
ASRAngelicae Sinensis Radix (compound of DGSYS, YGS and YQTYT)
PRAPaeoniae Radix Alba (compound of DGSYS)
CXRChuanxiong Rhizoma (compound of DGSYS, YGS and YQTYT)
AMKAtractylodes Macrocephala Koidz. (compound of DGSYS and YGS)
AOJAlisma Orientale (Sam.) Juz. (compound of DGSYS)
RBRadix Bupleuri (compound of YGS)
URCUncariae Ramulus Cumuncis (compound of YGS)
RSRadix Salviae (compound of YQTYT)
CRCodonopsis Radix (compound of YQTYT)
RPRRadix Paeoniae Rubra (compound of YQTYT)
HMMHedysarum Multijugum Maxim. (compound of YQTYT)
ROCReceiver Operating Characteristic
AUCArea Under Curve
TPRTrue Positive Rate
FPRFalse Positive Rate

References

  1. Yao, X.; Li, X.; Zhou, J.; Wang, Q.; Liu, G.Z.; Zhou, Y.Y. Experimental Research Progress on Traditional Chinese Medicine in Treatment of Alzheimer’s Disease by Regulating and Controlling Calcium Ions in SteadyState. Chin. Arch. Tradit. Chin. Med. 2018, 36, 49–52. [Google Scholar] [CrossRef]
  2. Hopkins, A.L. Network pharmacology. Nat. Biotechnol. 2007, 25, 1110–1111. [Google Scholar] [CrossRef] [PubMed]
  3. Hopkins, A.L. Network pharmacology: The next paradigm in drug discovery. Nat. Chem. Biol. 2008, 4, 682–690. [Google Scholar] [CrossRef] [PubMed]
  4. D’Angelo, G.; Palmieri, F. Network traffic classification using deep convolutional recurrent autoencoder neural networks for spatial—Temporal features extraction. J. Netw. Comput. Appl. 2021, 173, 102890. [Google Scholar] [CrossRef]
  5. D’Angelo, G.; Palmieri, F. Knowledge elicitation based on genetic programming for non destructive testing of critical aerospace systems. Future Gener. Comput. Syst. 2020, 102, 633–642. [Google Scholar] [CrossRef]
  6. Zhang, W.; Sun, F.; Jiang, R. Integrating multiple protein-protein interaction networks to prioritize disease genes: A Bayesian regression approach. BMC Bioinform. 2011, 12, 1–11. [Google Scholar] [CrossRef] [PubMed] [Green Version]
  7. Chen, B.L.; Wang, J.X.; Li, M.; Wu, F.X. Identifying disease genes by integrating multiple data sources. BMC Med. Genom. 2014, 7 (Suppl. 2), S2. [Google Scholar] [CrossRef] [PubMed] [Green Version]
  8. Chen, B.L.; Li, M.; Wang, J.X.; Wu, F.X. Disease gene identification by using graph kernels and Markov random fields. Sci China Life Sci. 2014, 57, 1054–1063. [Google Scholar] [CrossRef] [PubMed] [Green Version]
  9. Chen, B.L.; Li, M.; Wang, J.X.; Shang, X.Q.; Wu, F.X. A Fast and high performance multiple data integration algorithm for identifying human disease genes. BMC Med. Genom. 2015, 8, 1–11. [Google Scholar] [CrossRef] [PubMed] [Green Version]
  10. Sun, P.G.; Gao, L.; Han, S.S. Identification of overlapping and non-overlapping community structure by fuzzy clustering in complex networks. Inf. Sci. 2010, 181, 1060–1071. [Google Scholar] [CrossRef]
  11. Bader, G.D.; Hogue, C.W. An automated method for finding molecular complexes in large protein interaction networks. BioMed Cent. 2003, 4, 1–27. [Google Scholar] [CrossRef] [Green Version]
  12. Lancichinetti, A.; Fortunato, S.; Kertesz, J. Detecting the overlapping and hierarchical community structure in complex networks. New J. Phys. 2009, 11, 33015. [Google Scholar] [CrossRef]
  13. Xia, J.; Zhang, R.C.; Cheng, S.J. Discussion on Treatment of Senile Dementia with Traditional Chinese Medicine. J. Sichuan Tradit. Chin. Med. 2008, 36, 40–42. [Google Scholar]
  14. Qiu, X.F.; Yuan, D.P.; Wang, P.; Zhang, L.T.; Hu, Y.G. The Basic Pathogenesis of Alzheimer’s Disease (AD) Being Deficiency of Kidney and Debility of Marrow Blockage of Brain Collateral. J. Henan Univ. Chin. Med. 2006, 21, 11–13. [Google Scholar] [CrossRef]
  15. Yildirim, M.A.; Goh, K.I.; Cusick, M.E.; Barabasi, A.L.; Vidal, M. Drug-target network. Nat. Biotechnol. 2007, 25, 1119–1126. [Google Scholar] [CrossRef] [PubMed]
  16. Pan, J.H. New paradigm for drug discovery based on network pharmacology. Chin. J. New Drugs Clin. Rem. 2009, 28, 721–726. [Google Scholar]
  17. Liu, C.; Zhang, A.; Wang, X.J. Recent research on Kaixin San. Acta Chin. Med. Pharmacol. 2014, 42, 164–165. [Google Scholar] [CrossRef]
  18. Xie, J. Formulating Rules of Senile Dementiabased on Statistical Analysis. Ph.D. Thesis, Nanjing University of Traditional Chinese Medicine, Nanjing, China, 2009. [Google Scholar]
  19. Ru, J.L.; Li, P.; Wang, J.A.; Zhou, W.; Li, C.; Huang, P.; Li, P.D.; Guo, Z.H.; TAO, W.H.; Yang, Y.F.; et al. TCMSP: A database of systems pharmacology for drug discovery from herbal medicines. J. Cheminform. 2014, 6, 13. [Google Scholar] [CrossRef] [Green Version]
  20. Federhen, S. The NCBI Taxonomy database. Nucleic Acids Res. 2012, 40, D136–D143. [Google Scholar] [CrossRef] [Green Version]
  21. McKusick, V.A. Mendelian Inheritance in Man and its online version, OMIM. Am. J. Hum. Genet. 2007, 80, 588–604. [Google Scholar] [CrossRef] [Green Version]
  22. Chen, X.; Ji, Z.L.; Chen, Y.Z. TTD: Therapeutic Target Database. Nucleic Acids Res. 2002, 30, 412–415. [Google Scholar] [CrossRef] [PubMed] [Green Version]
  23. Kerrien, S.; Alam-Faruque, Y.; Aranda, B.; Bancarz, I.; Bridge, A.; Derow, C.; Dimmer, E.; Feuermann, M.; Friedrichsen, A.; Huntley, R.; et al. IntAct—Open source resource for molecular interaction data. Nucleic Acids Res. 2007, 35, D561–D565. [Google Scholar] [CrossRef]
  24. Barrett, T.; Wilhite, S.E.; Ledoux, P.; Evangelista, C.; Kim, I.F.; Tomashevsky, M.; Marshall, K.A.; Phillippy, K.H.; Sherman, P.M.; Holko, M.; et al. NCBI GEO: Archive for functional genomics data sets—Update. Nucleic Acids Res. 2013, 41, D991–D9955. [Google Scholar] [CrossRef] [PubMed] [Green Version]
  25. Ogata, H.; Goto, S.; Sato, K.; Fujibuchi, W.; Bono, H.; Kanehisa, M. KEGG: Kyoto Encyclopedia of Genes and Genomes. Nucleic Acids Res. 1999, 27, 29–34. [Google Scholar] [CrossRef] [Green Version]
  26. Ruepp, A.; Waegele, B.; Lechner, M.; Brauner, B.; Dunger-Kaltenbach, I.; Fobo, G.; Frishman, G.; Montrone, C.; Mewes, H. CORUM: The comprehensive resource of mammalian protein complexes—2009. Nucleic Acids Res. 2010, 38, D497–D501. [Google Scholar] [CrossRef] [PubMed] [Green Version]
  27. Chen, Z.Q.; Lei, H.; Shi, Y.T. Measurement Analysis and Application in Network Science; Chemical Industry Press: Beijing, China, 2019; ISBN 978-7-122-33221-9. [Google Scholar]
  28. Chen, Y.Y. A Multidimensional Comparison of Pharmacological Mechanisms of Different Compound Treatments on Cerebral Ischemia Models. Ph.D. Thesis, China Academy of Chinese Medical Sciences, Beijing, China, 2013. [Google Scholar]
  29. Gu, H.; Chen, Y.Y.; Wang, P.Q.; Wang, Z. Comparison of different methods of module division by entropyand functional similarity of gene network and its modules forcoronary heart disease. Chin. J. Pharm. Toxicol. 2018, 32, 377–384. [Google Scholar]
  30. Liu, Q.; Gu, H.; Liu, J.; Chen, Y.Y.; Li, B.; Wang, Z. Module Partition and Biological Mechanism Analysis of Genetic Network of Urinary Tract Infection Based on Entropy. Genom. Appl. Biol. 2018, 37, 4676–4681. [Google Scholar]
  31. Bass, J.I.F.; Diallo, A.; Nelson, J.; Soto, J.M.; Myers, C.L.; Walhout, A.J.M. Using networks to measure similarity between genes: Association index selection. Nat. Methods Tech. Life Sci. Chem. 2013, 10, 1169–1176. [Google Scholar] [CrossRef] [Green Version]
  32. Zhu, W.H.; Qiao, Z.H.; Chen, Y.J.; Zeng, P.G.; Cao, S.J.; Zhou, C.; Peng, S.Y.; Zou, Y.M. Module partition and analysis of gene network of Alzheimer’s disease based on graph entropy. Pure and Applied Mathematics. Be published in 2023.
  33. Lin, C.Y.; Chin, C.H.; Wu, H.H.; Chen, S.H.; Ho, C.W.; Ko, M.T. Hubba: Hub objects analyzer—A framework of interactome hubs identification for network biology. Nucleic Acids Res. 2008, 36, W438–W443. [Google Scholar] [CrossRef]
  34. Cao, S.J.; Yu, L.; Mao, j.Y.; Wang, Q.; Ruan, J.S. Uncovering the Molecular Mechanism of Actions between Pharmaceuticals and Proteins on the AD Network. PLoS ONE 2017, 10, e0144387. [Google Scholar] [CrossRef] [PubMed] [Green Version]
Figure 1. (a) KXS-compounds-target genes network. (b) DYSYS-compounds-target genes network. (c) YGS-compounds-target genes network. (d) YQTYT-compounds-target genes network. Blue circle stands for herbs; triangles stand for active compounds; hexagons stand for ingredients; blue diamond stands for target genes.
Entropy 23 01365 g001
Figure 2. (a) The AD disease gene network includes 746 genes and 10,920 edges. (b) The integrated network includes 2017 genes and 85,152 edges.
Entropy 23 01365 g002aEntropy 23 01365 g002b
Figure 3. Calculation result of correlation index.
Entropy 23 01365 g003
Figure 4. The ROC curve of the Integrated algorithm.
Entropy 23 01365 g004
Figure 5. (a) KXS-compounds-target genes-AD gene network. (b) DYSYS-compounds-target genes-AD gene network. (c) YGS-compounds-target genes-AD gene network. (d) YQTYT-compounds-target genes-AD gene network. Blue diamond stands for target genes of herb compounds. Green circles stand for similar genes between target genes of herb compounds and essential genes of AD. Blue rectangles stand for genes of AD.
Entropy 23 01365 g005
Figure 6. Enrichment analysis results of herb compounds.
Entropy 23 01365 g006
Figure 7. The number of similar genes between target genes of YQTYT compound and genes of AD pathway in the KEGG.
Entropy 23 01365 g007
Table 1. Correlation index.
Correlation IndexFormulaMeaning
Jaccard J O C = | O     C i | | O   C i | The range of values is [0, 1], and the closer it is to 1, the stronger the correlation.
Simpson S O C = | O     C i | | m i n ( O , C i ) |
Geometric G O C = | O     C i | 2 | O | | C i |
Cosine C O C = | O     C i | | O | | C i |
PCC P C C O C = | O     C i | n | O | | C i | | O | | C i | ( n | O | ) ( n | C i | )
Where, O represents the set of the original network pathways; C i represents the set of the i-th module pathways after partition.
Table 2. Division results.
Division MethodsNumber of ModulesEntropy Value
MCODE186.05
MCL896.19
Glay176.20
Cluster one896.22
Table 3. MCODE obtains the division and score of each module.
ModuleThe Number of GenesModule ScoreModuleThe Number of GenesModule Score
1400400.0001063.200
2386.5851133.000
375.6671233.000
454.5001333.000
554.0001433.000
6103.7781533.000
7153.5711633.000
84333717202.947
973.3331842.667
Table 4. Pathway results of each module.
ModuleThe Number of PathwaysIntersectionUnionGene ProportionModuleThe Number of PathwaysIntersectionUnionGene Proportion
113212815020.04%9201460.35%
229291461.90%10551480.30%
3221460.35%11101460.15%
4651470.25%13201470.15%
5111460.25%15201480.15%
6761470.50%16111460.15%
7941470.75%17221461.00%
8221510.20%
Table 5. Essential genes of AD.
GeneRepetitionsGeneRepetitionsGeneRepetitionsGeneRepetitions
ABCA110NFKB10WNT9A10WNT39
ACHE10NMDAR10WNT9B10WNT49
CASP610PKC10XBP110APBB18
CHAT10PP2A10ADAM109APH1B7
CTFA10PRPC10APP9APOE7
CYLD10PSD9510BACE19BECN17
DAG110SIRT110CHRM59CALM17
DR610SPS10GRIN19CAPN27
EETS10UCHL110IDE9CDK57
EPHB210UQCRB10LRP19CHRM17
FYN10VLDLR10MAPT9CHRM37
GRIN3A10WNT110PSEN19CYCS7
HPETE10WNT3A10PSEN29DVL27
HSPG10WNT5A10RELA9GNAQ7
IKKA10WNT5B10TNF9GRIN2A7
IKKB10WNT610WNT10B9GRIN2B7
INSP3R10WNT7A10WNT119GRM57
LDLR10WNT7B10WNT169GSK3B7
LILRB210WNT8A10WNT29HRAS7
MAPK10WNT8B10WNT2B9IKBKB7
Table 6. Information of the top 30 candidate genes by integrated algorithm.
GenePosterior ProbabilityScoreGenePosterior ProbabilityScore
APP0.99981GRIN10.99270.992481
ADAM100.99910.999499CDK5R10.99260.99198
MAPK10.99890.998997CDK50.99190.991479
MAPT0.99860.998496MAP2K10.99180.990977
RELA0.99560.997995AKT20.99150.990476
ACHE0.99550.997494MTOR0.99150.990476
MAPK100.99520.996992GRIN2C0.99130.989474
APOE0.9950.996491SIRT10.99130.989474
KIF5A0.99450.99599CALM10.99120.988471
NFKB10.99440.995489CACNA1D0.99110.98797
GRIN2A0.9940.994987ITPR10.99110.98797
GNAQ0.99370.994486ATP2A20.9910.986967
HRAS0.99350.993985CASP70.9910.986967
GRIN2B0.99330.993484DVL10.9910.986967
APBB10.99290.992982INS0.9910.986967
Table 7. Predicted essential genes for AD.
GeneGeneGeneGeneGene
ACHEDVL2ITPR1NOX1WNT11
ADAM10EPHB2KLC1NOX4WNT16
APBB1GNAQLILRB2NRASWNT2
APH1BGRIN1LRP1PPP3R1WNT2B
APOEGRIN2AMAP2K1PSEN1WNT3
APPGRIN2BMAP2K2PTGS2WNT3A
BACE1GSK3BMAPK1RELAWNT4
CALM1HRASMAPK10SIRT1WNT5A
CDK5IDEMAPK3UCHL1WNT5B
CHRM1IKBKBMAPK9UQCRBWNT6
CHRM3IL1AMAPTWNT1WNT7A
CYCSIL1BNOS2WNT10BXBP1
Table 8. Information of similar genes.
HerbSimilar Genes
KXSACHE, CHRM1, CHRM3, GSK3B, IKBKB, IL1B, NOS2, PTGS2, RELA
DGYSYACHE, CHRM1, CHRM3, GRIN1, GRIN2A, GRIN2B, GSK3B, IKBKB, IL1B, MAPK1, MAPK10, NOS2, PTGS2, RELA
YGSACHE, BACE1, CHRM1, CHRM3, GRIN1, GRIN2A, GRIN2B, GSK3B, IKBKB, IL1A, IL1B, MAPK1, MAPK10, NOS2, PTGS2, RELA
YQTYTACHE, APP, CHRM1, CHRM3, CYCS, GRIN1, GRIN2B, GSK3B, IKBKB, IL1A, IL1B, MAPK1, MAPK10, NOS2, PTGS2, RELA, SIRT1,
Publisher’s Note: MDPI stays neutral with regard to jurisdictional claims in published maps and institutional affiliations.

