1. Introduction
Species evolve across generations. For quantitative-trait evolution, scientists apply phylogenetic comparative methods (PCMs) to study the evolutionary relationship of a group of related species where a phylogenetic tree is incorporated for describing affinity among species [
1,
2,
3,
4,
5,
6,
7,
8]. Most current regression models in PCMs assume that the response trait variable
y is linear with its covariates
xs where the estimated line equation (e.g.,
) is used to predict the response trait [
8,
9,
10]. However, the allometric relationship between body mass and other organisms is also often observed in nonlinear form (i.e.,
). Logarithm transformation (
) is usually considered as a regular procedure prior to analysis [
11]. From a statistical perspective, log transformation on the data reduces skewness, decreasing the variability, conforming data close to the normal distribution, and placing dependent variable and covariates in a linear-like relationship [
12,
13,
14]. From an evolutionary perspective, because most traits of particular species fall within a certain range, interpreting trait changes using raw scales may produce unreasonable results. Hence, convex transformation by the logarithm function is often applied to convert the raw data of the interval type into the ratio type. This has particular advantages, for example, a change in body mass of
kg might not be important for a male red kangaroo with a weight from 55 to 90 kg, but probably matters substantially for a wallaby with a weight of about
kg; a
% change in body mass for both species is interpretable under log-transformed data.
Nevertheless, even the log transformation helps to convert the trait relationship from nonlinear into a moderate linear type, and there exists a nonlinear relationship among some log-transformed data [
15]. The trait relationship shown in
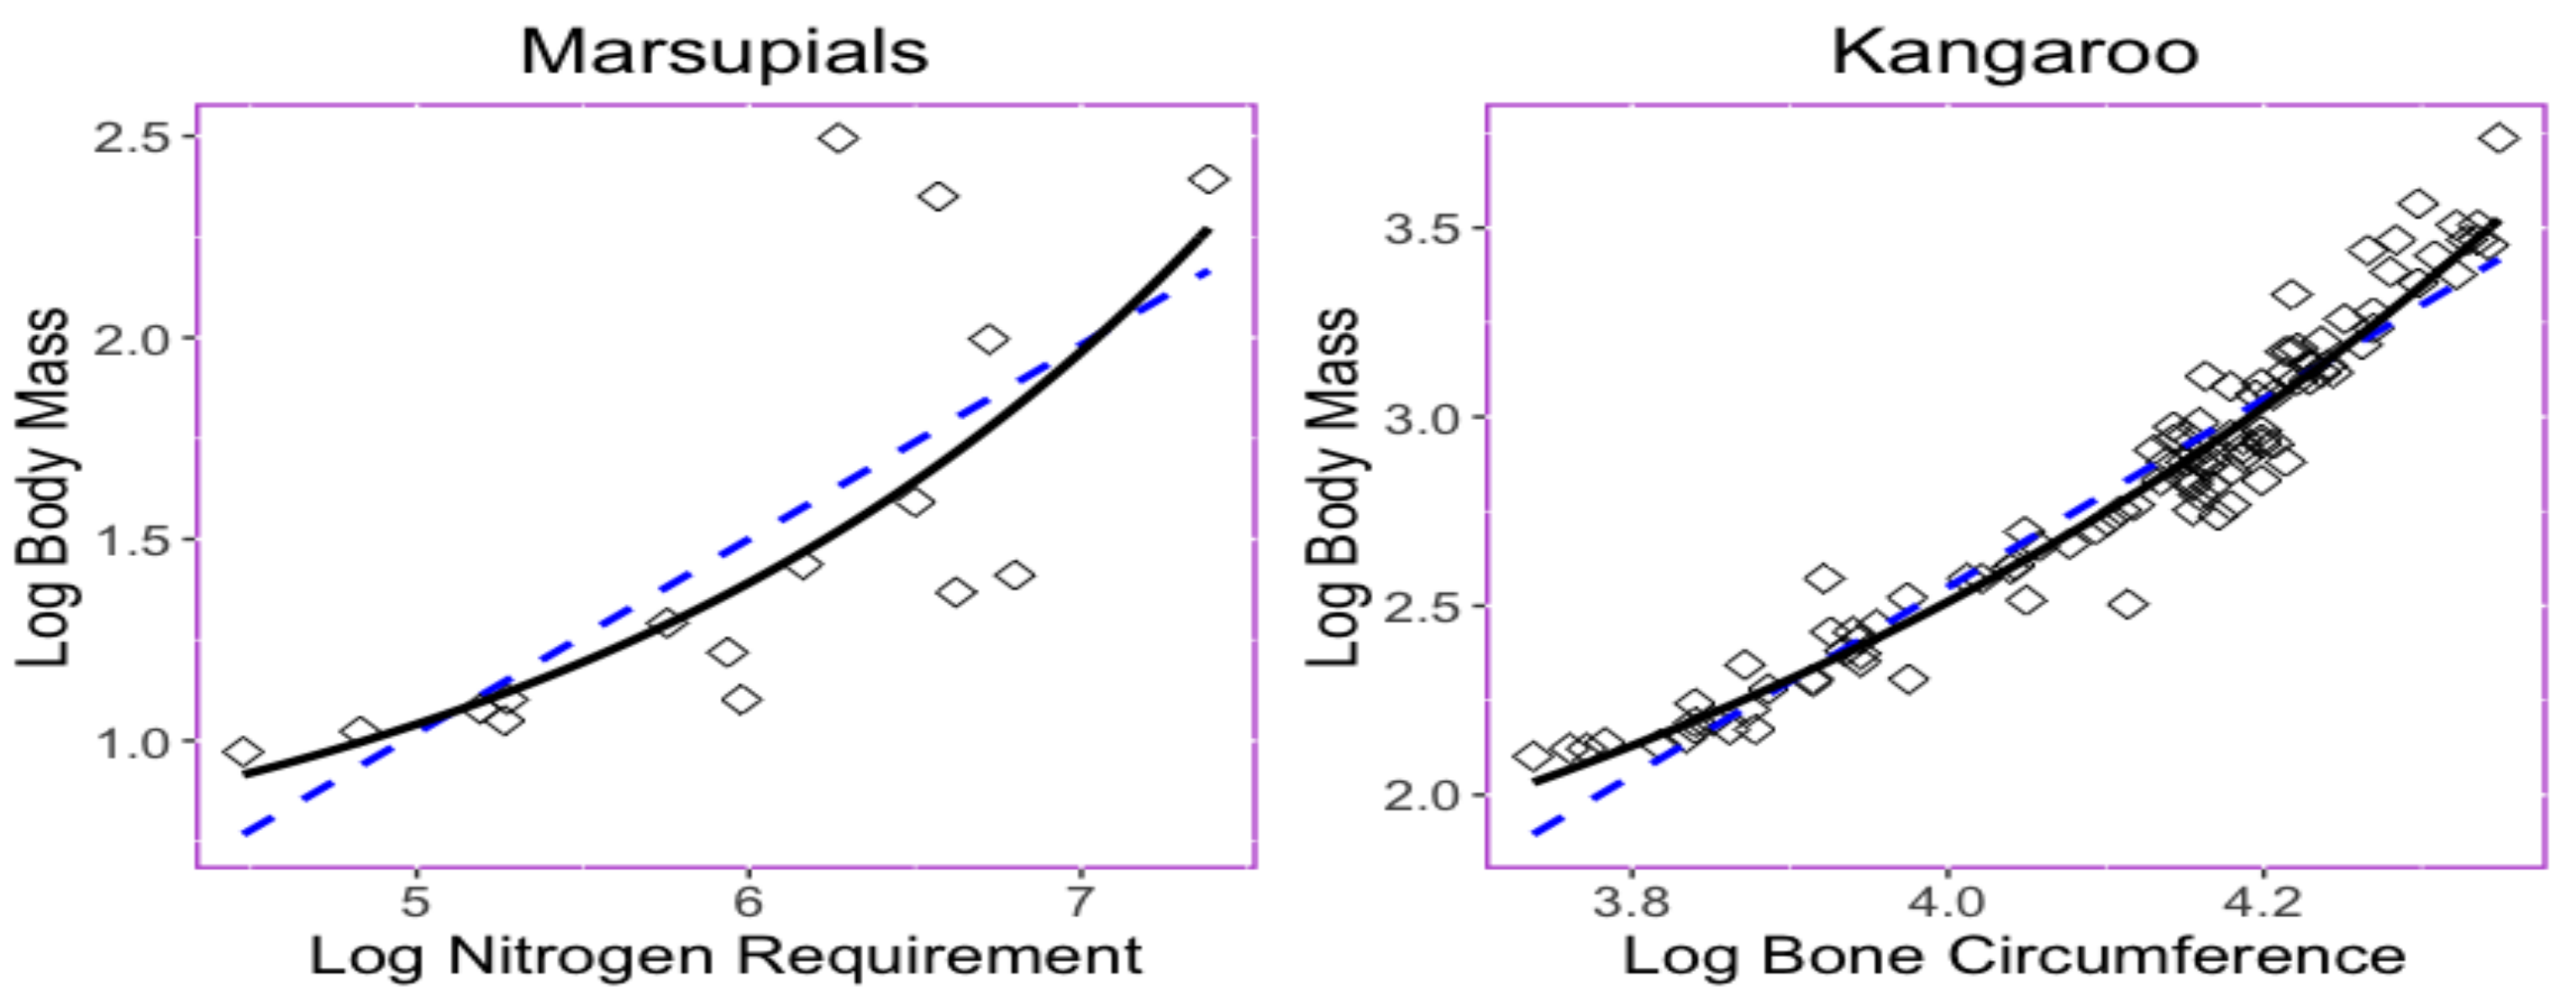
Figure 1 provides two examples in which nonlinear exponential regressions could provide a better fit with less predicted errors than those obtained when using linear regression. The left panel in
Figure 1 displays the bivariate relationship between the body mass (
x) and the maintenance nitrogen requirement (
y) in the log scale of the marsupial species [
16,
17]. The exponential equation
has a root mean square deviation with a value of
, while the linear regression model
has a root mean square deviation
.
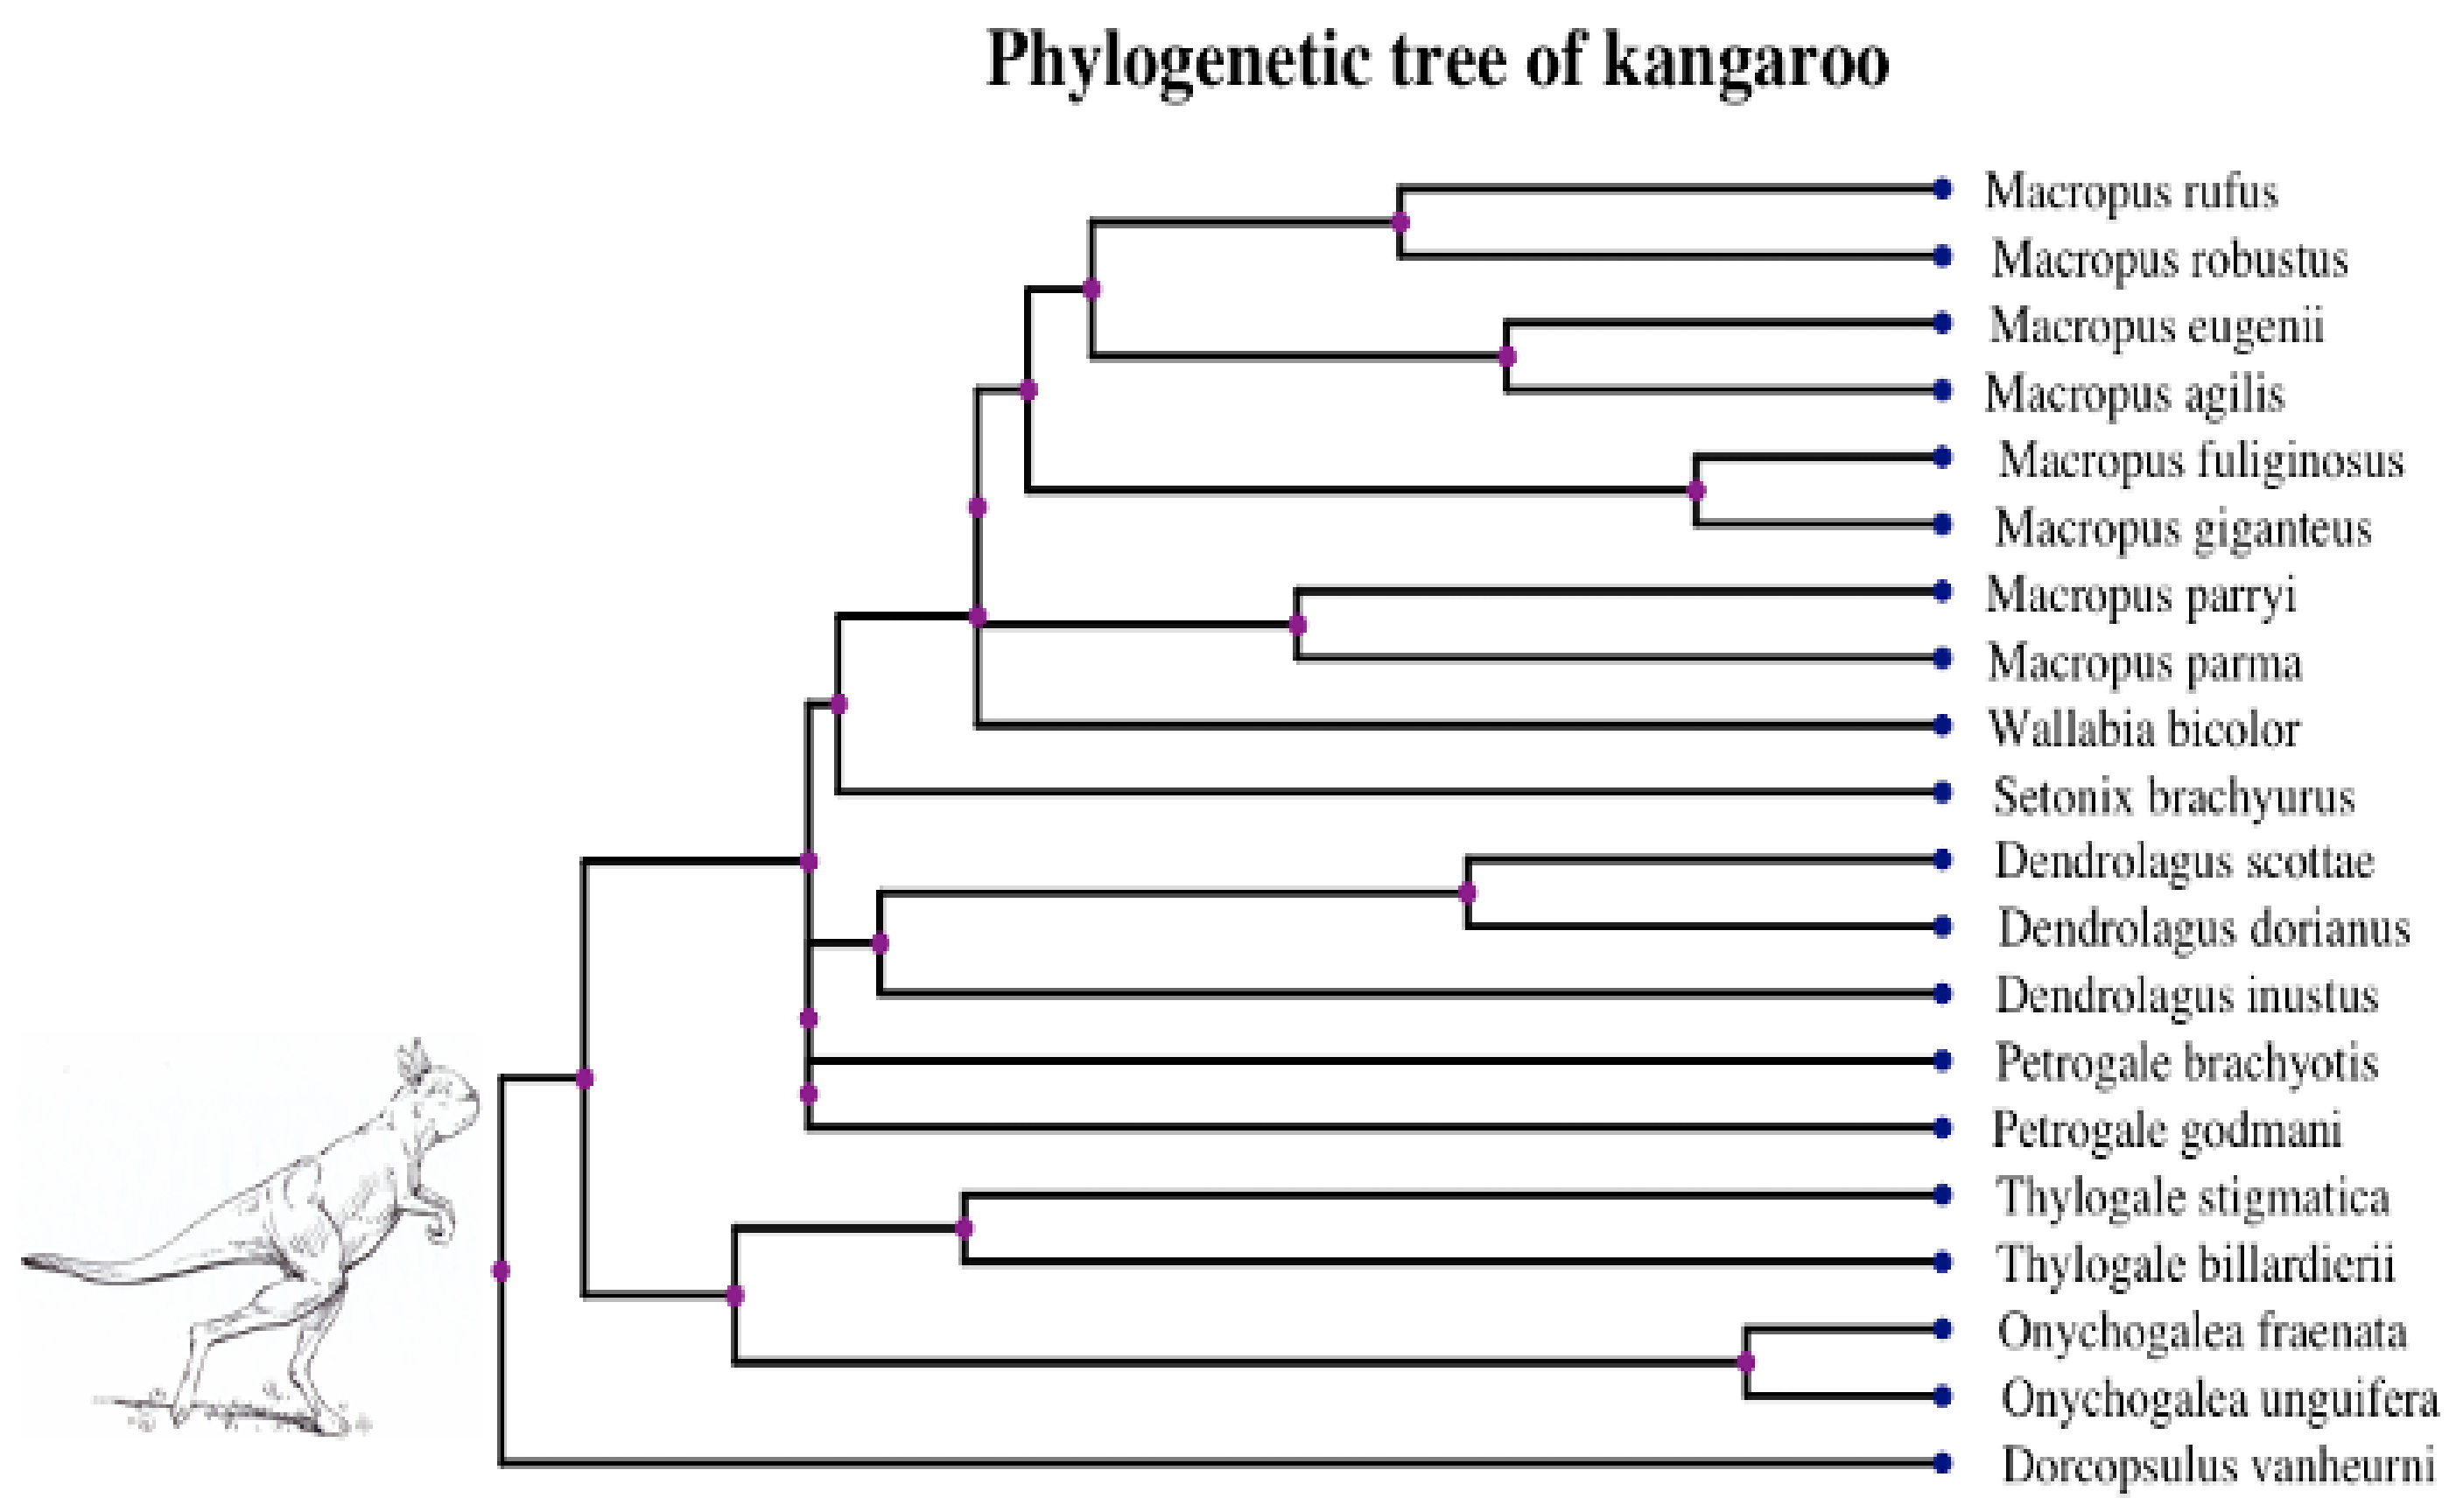
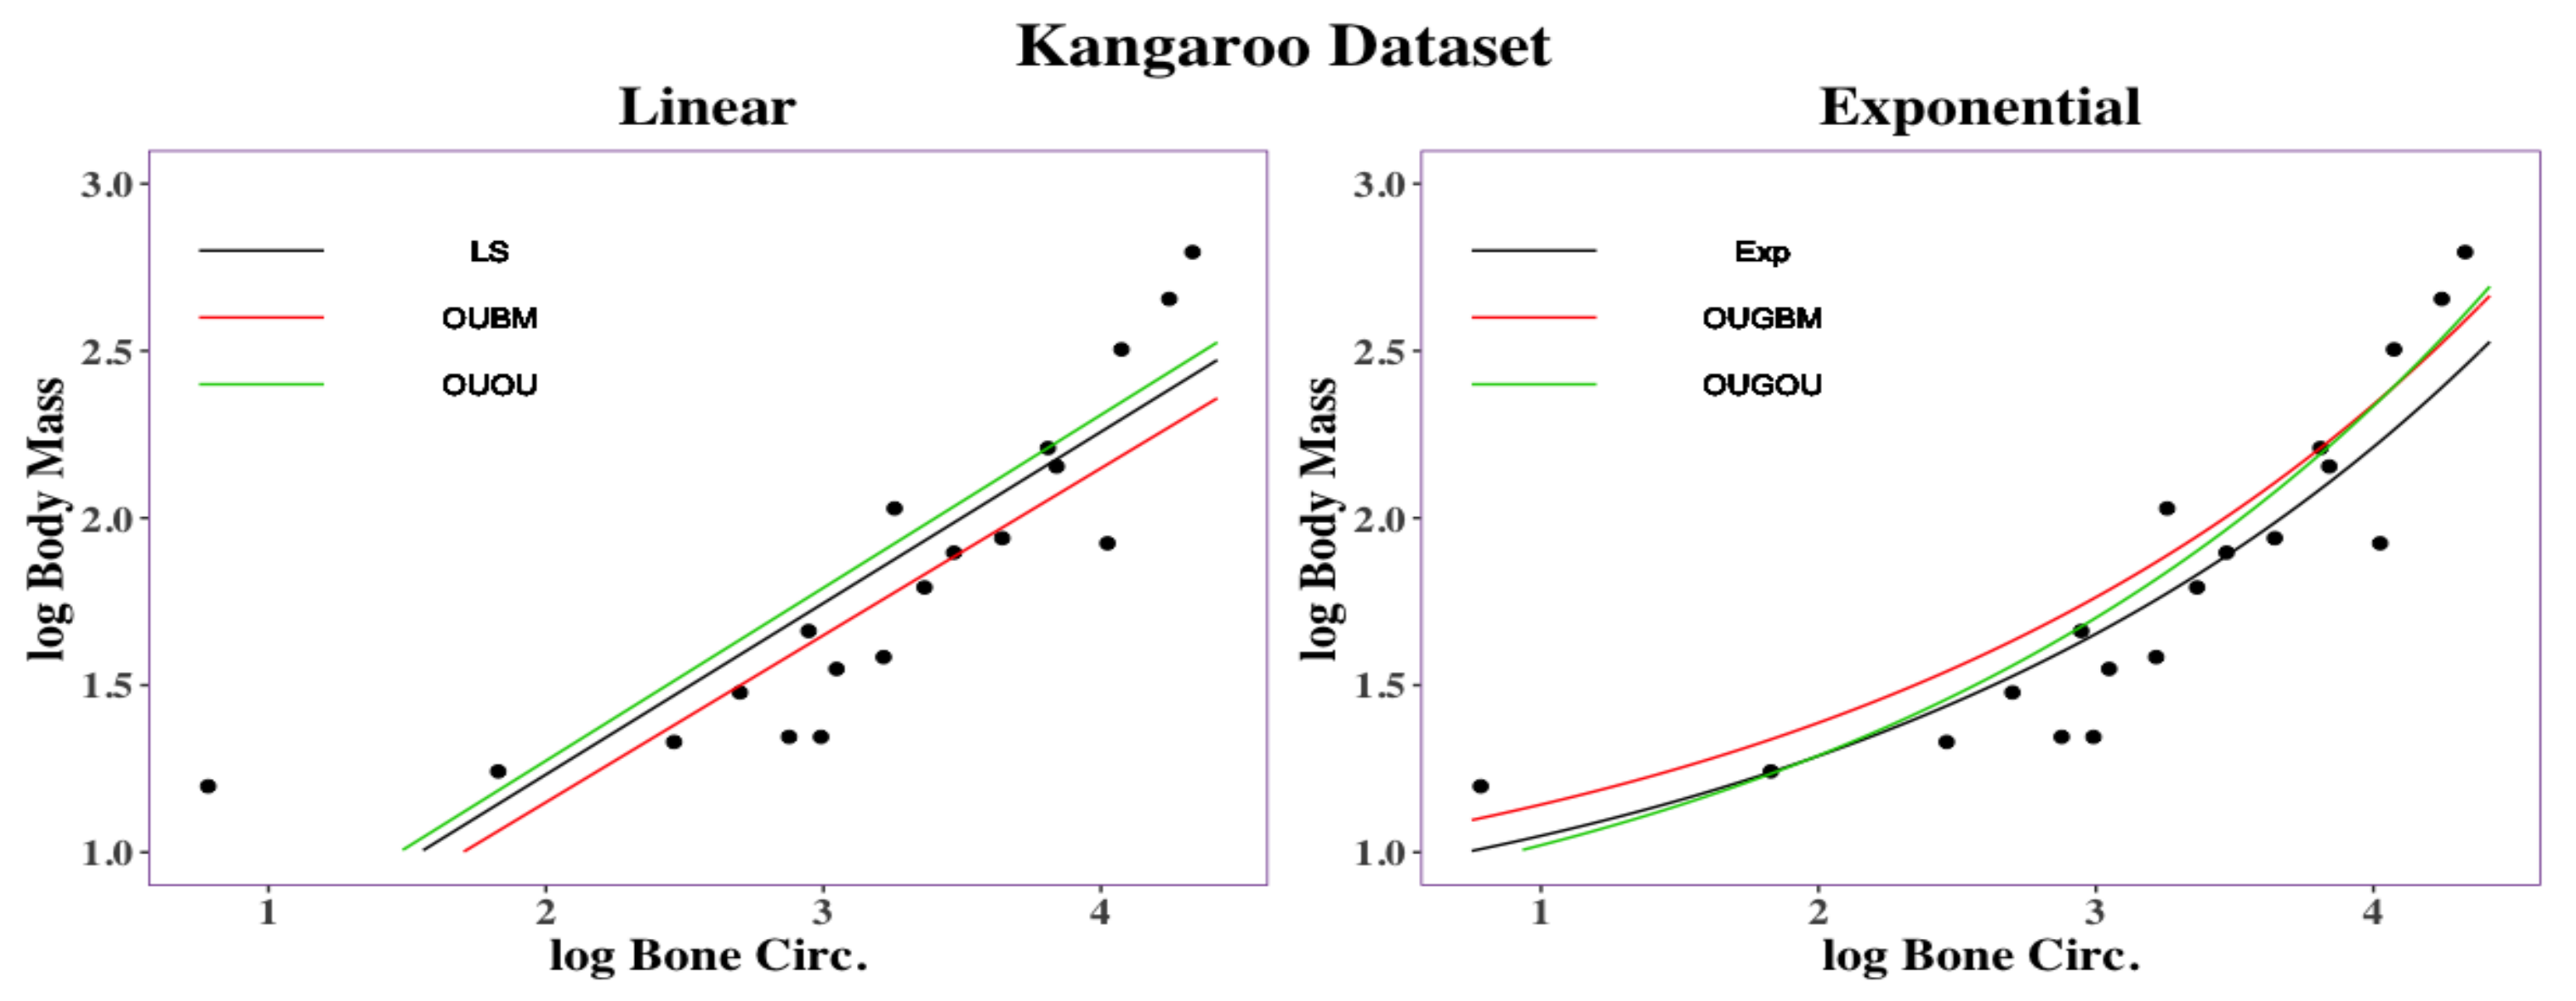
The right panel in
Figure 1 displays relationship between the thigh-bone (femoral) circumference (
x) and body mass (
y) of the kangaroo species [
18] is shown
Figure 1. The exponential equation
has a root mean square deviation with a value of
, while the linear regression model
has a root mean square deviation of
. Parameters
in the exponential curve
were estimated under a least-squares method performed using the following step. Since
adds to the complexity of the model, an estimate of
is established by using the half value of the minimum of the responses; then, traits are subtracted from this value, which yields the model
. Parameters
and
are estimated through the least-squares method for the model
.
In the marsupial and kangaroo datasets, exponential regression models yield to smaller RMSD than those in linear regression models. Conceiving that the potential use of exponential regression models to study phylogenetic-traits relationships, the empirical datasets in
Figure 1 call for novel phylogenetic comparative methods. In this framework, we developed models for adaptive trait evolution where the optimum of the trait undergoes stabilizing selection and has an exponential relationship with the predictor trait. Our work is distinguished from the work in [
19], which mainly makes use of multiple linear regression. Our ultimate goal was to provide feasible models for scientists to analyze their valuable data for research.
Prior to developing new models, the background of phylogenetic adaptive trait evolution was introduced follows. Hansen et al. [
20] developed a popular model (OUBM model) for phylogenetic adaptive trait evolution where the response trait variable is assumed following an Ornstein–Uhlenbeck (OU) process dynamic where the optimum of the response trait is assumed with a linear relationship with Brownian motion (BM) covariates. Later, various scientists made further efforts to expand the OUBM model of Hansen et al. via considering an Ornstein–Uhlenbeck process covariates (OUOU model) [
21,
22], a Cox–Ingersoll–Ross process for rate evolution [
19], or extending the OUBM model to the multivariate case [
23,
24,
25].
In general, the generalized model for phylogenetic adaptive trait evolution assumes that trait variable
solves stochastic differential equation (SDE) in Equation (
1):
where parameter
is the force that pulled the trait back to its optimum
, parameter
is called the evolutionary rate for the trait variable
, and
is a Wiener process with independent Gaussian increment, with mean 0 and variance
t. Let
and
be constants. By multiplying the integrating factor
and then integrating on both sides of Equation (
1),
can be expressed explicitly, as shown in Equation (
2)
where
is a deterministic term with initial condition
at
, and term
is a stochastic integral with respect to
, and is, again, a Gaussian variable with mean 0 and variance
(obtained by applying Itô isometry [
26]) and
is an integral with respect to time.
Optimal
, has a functional relationship with the covariate
represented in Equation (
4)
where
is the vector of regression parameters.
In Equation (
4), when optimum
and covariate trait variable
are in a linear relationship (i.e.,
where
are identical independently distributed continuous stochastic random variables), the dynamics of
can be characterized through identifying the dynamics of the linear combination of identical independent distributed covariates
. For Gaussian process covariates
s, optimal
follows a Brownian motion if covariates
s follows Brownian motion (i.e.,
), called the OUBM model [
20]. On the other hand,
is an OU process if
s are OU processes (i.e.,
), called the OUOU model [
21].
In this work, we assumed that an exponential relationship existed between trait optimum
and its covariate
. The development of the new models is described as follows. When assuming an exponential relationship between the optimum
and a Brownian motion covariate
, the optimum
follows a well known geometric Brownian motion [
27]. By assuming an exponential relationship between optimum
and its Ornstein–Uhlenbeck process-type covariate
, the optimum
follows a geometric Ornstein–Uhlenbeck process [
28].
We assumed that the covariate trait variable
evolved under Gaussian processes (e.g., Brownian motion or Ornstein–Uhlenbeck process); hence, the analytic expression of Ⓐ in Equation (
3) depends on the expression between
and its covariate
. Both evolutionary rate (
) and force
in Equation (
1) are assumed to be positive constants throughout this work (i.e.,
). Hence, we focused on developing of models by implementing the curved relationship between optimum
and its covariate
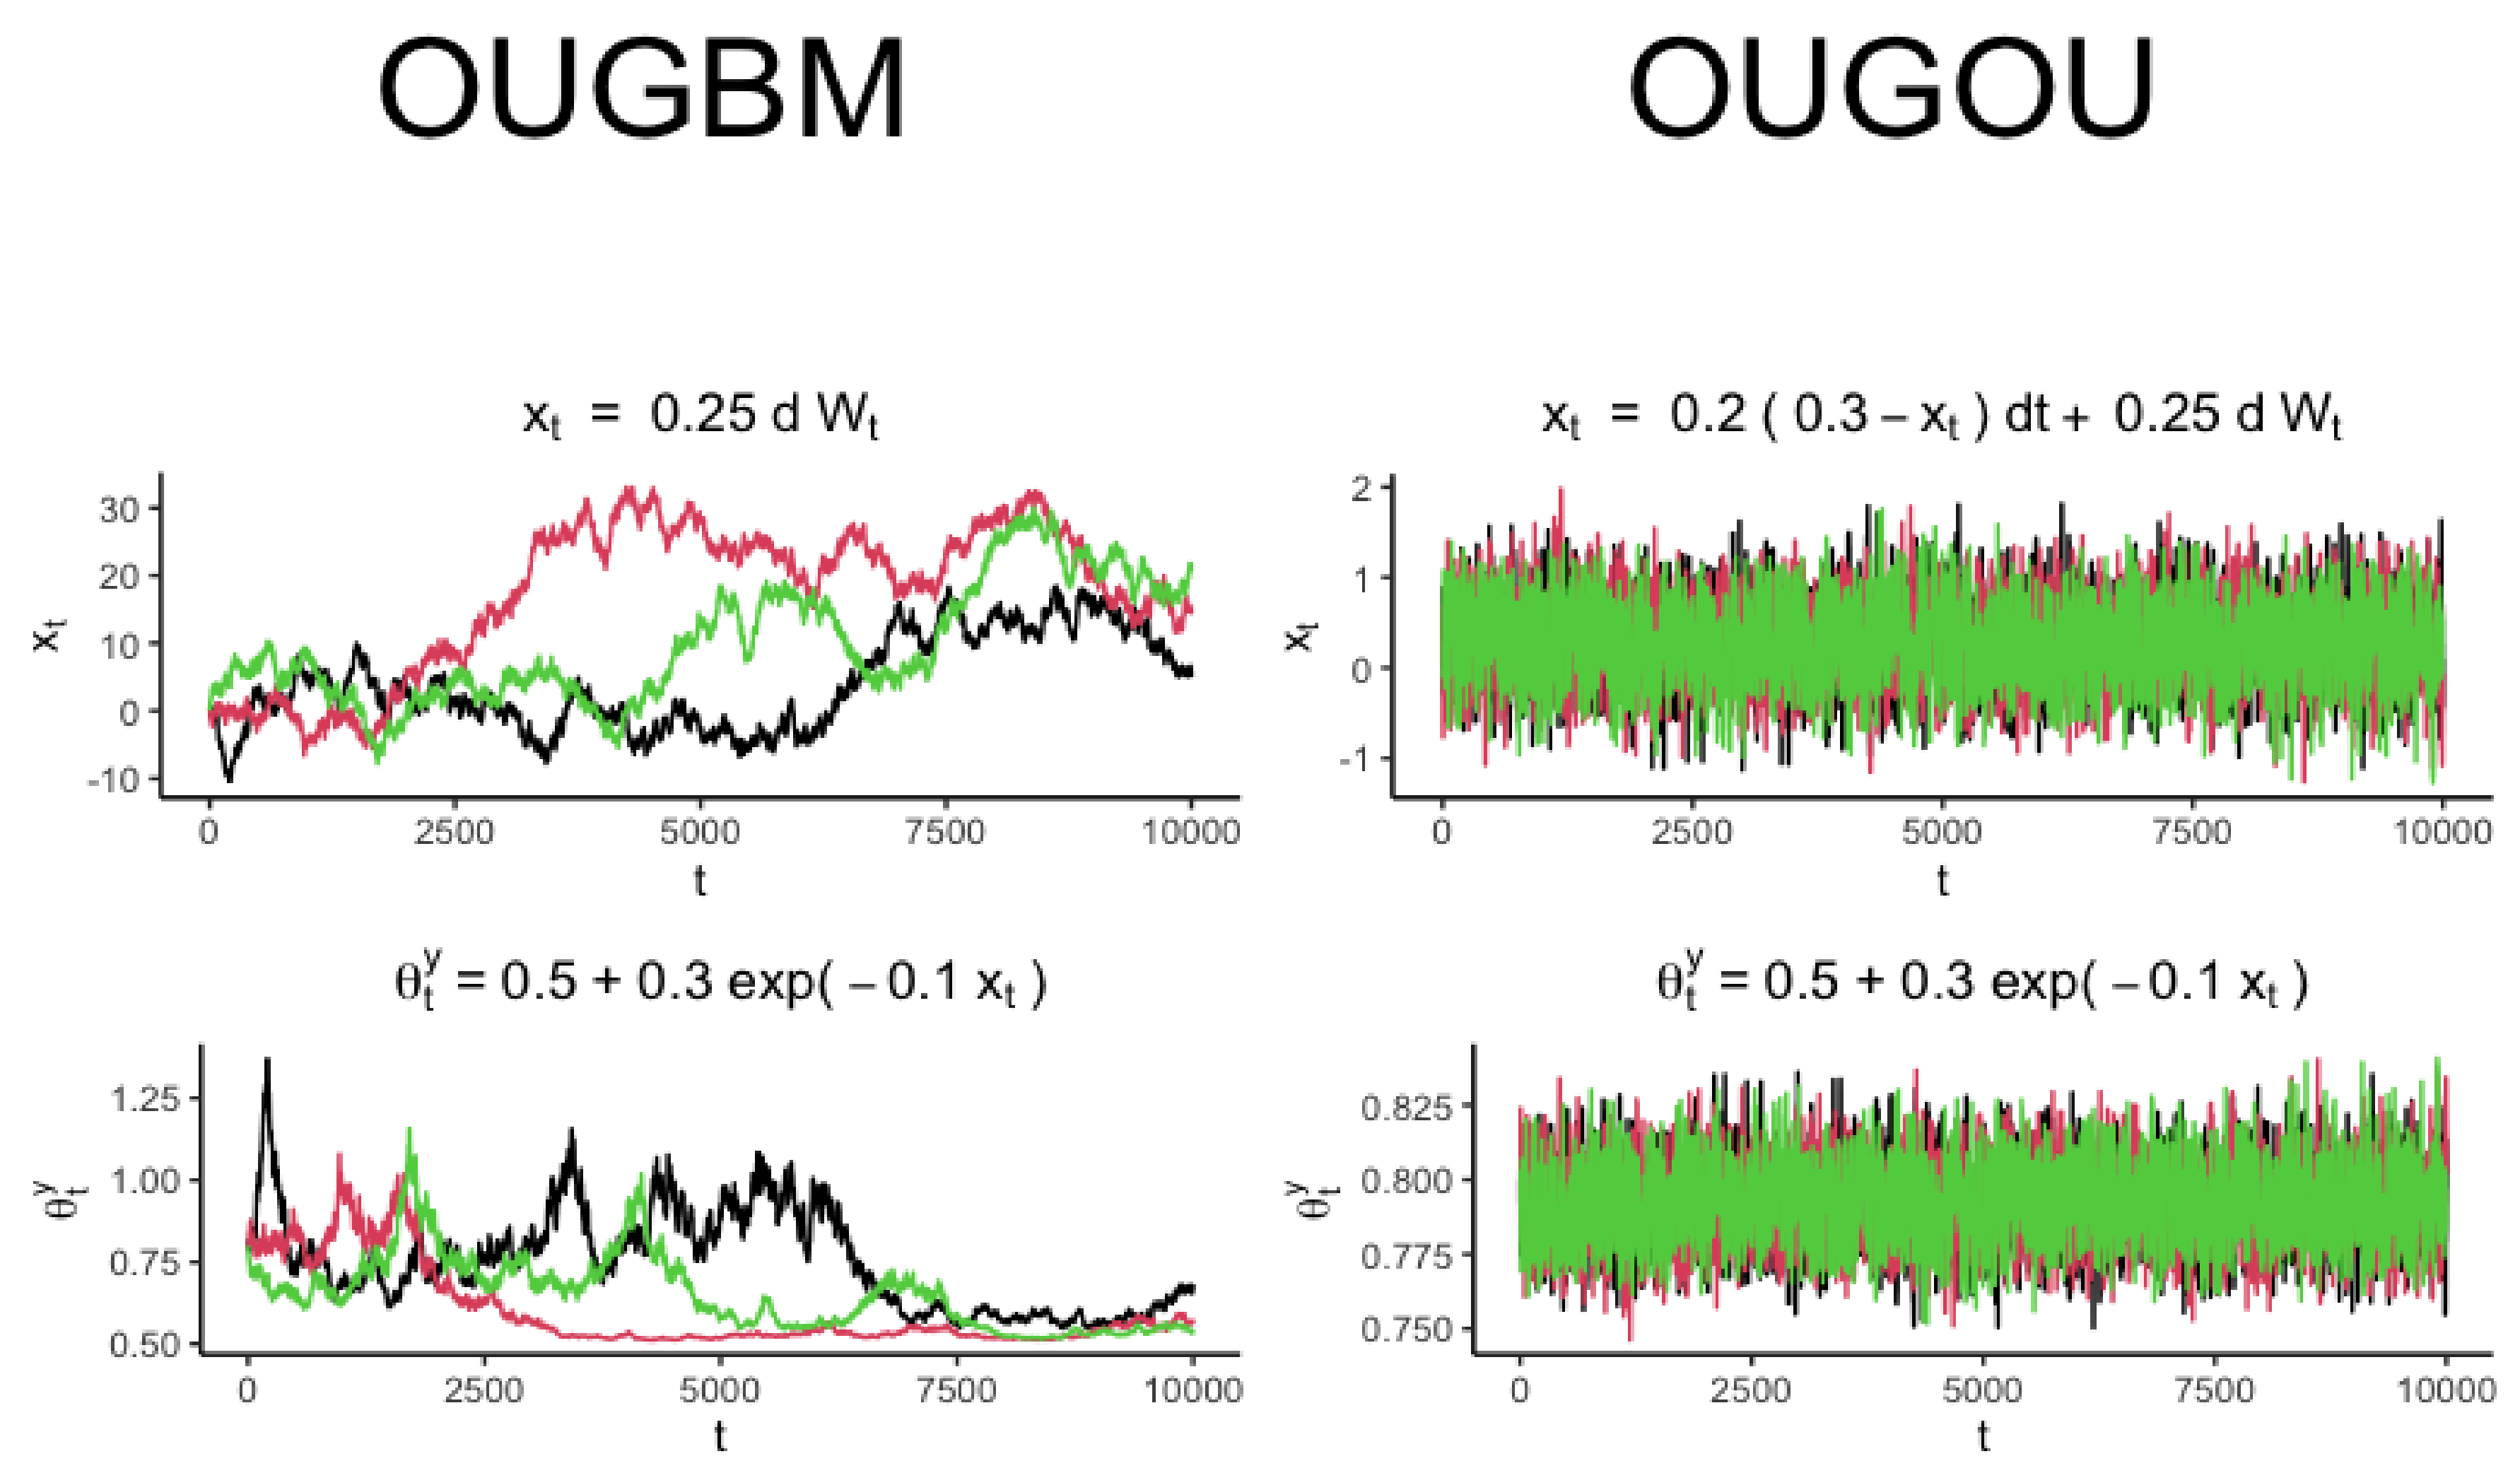
. The new model is named OUGBM (see
Section 2.1.1) when trait
represented in Equation (
2) admits a generalized OU process dynamic, and its optimum
has an exponential relationship with Brownian motion covariates
. The new model is named OUGOU (see
Section 2.1.2) if
admits a generalized OU process, and
has an exponential relationship with OU process covariates
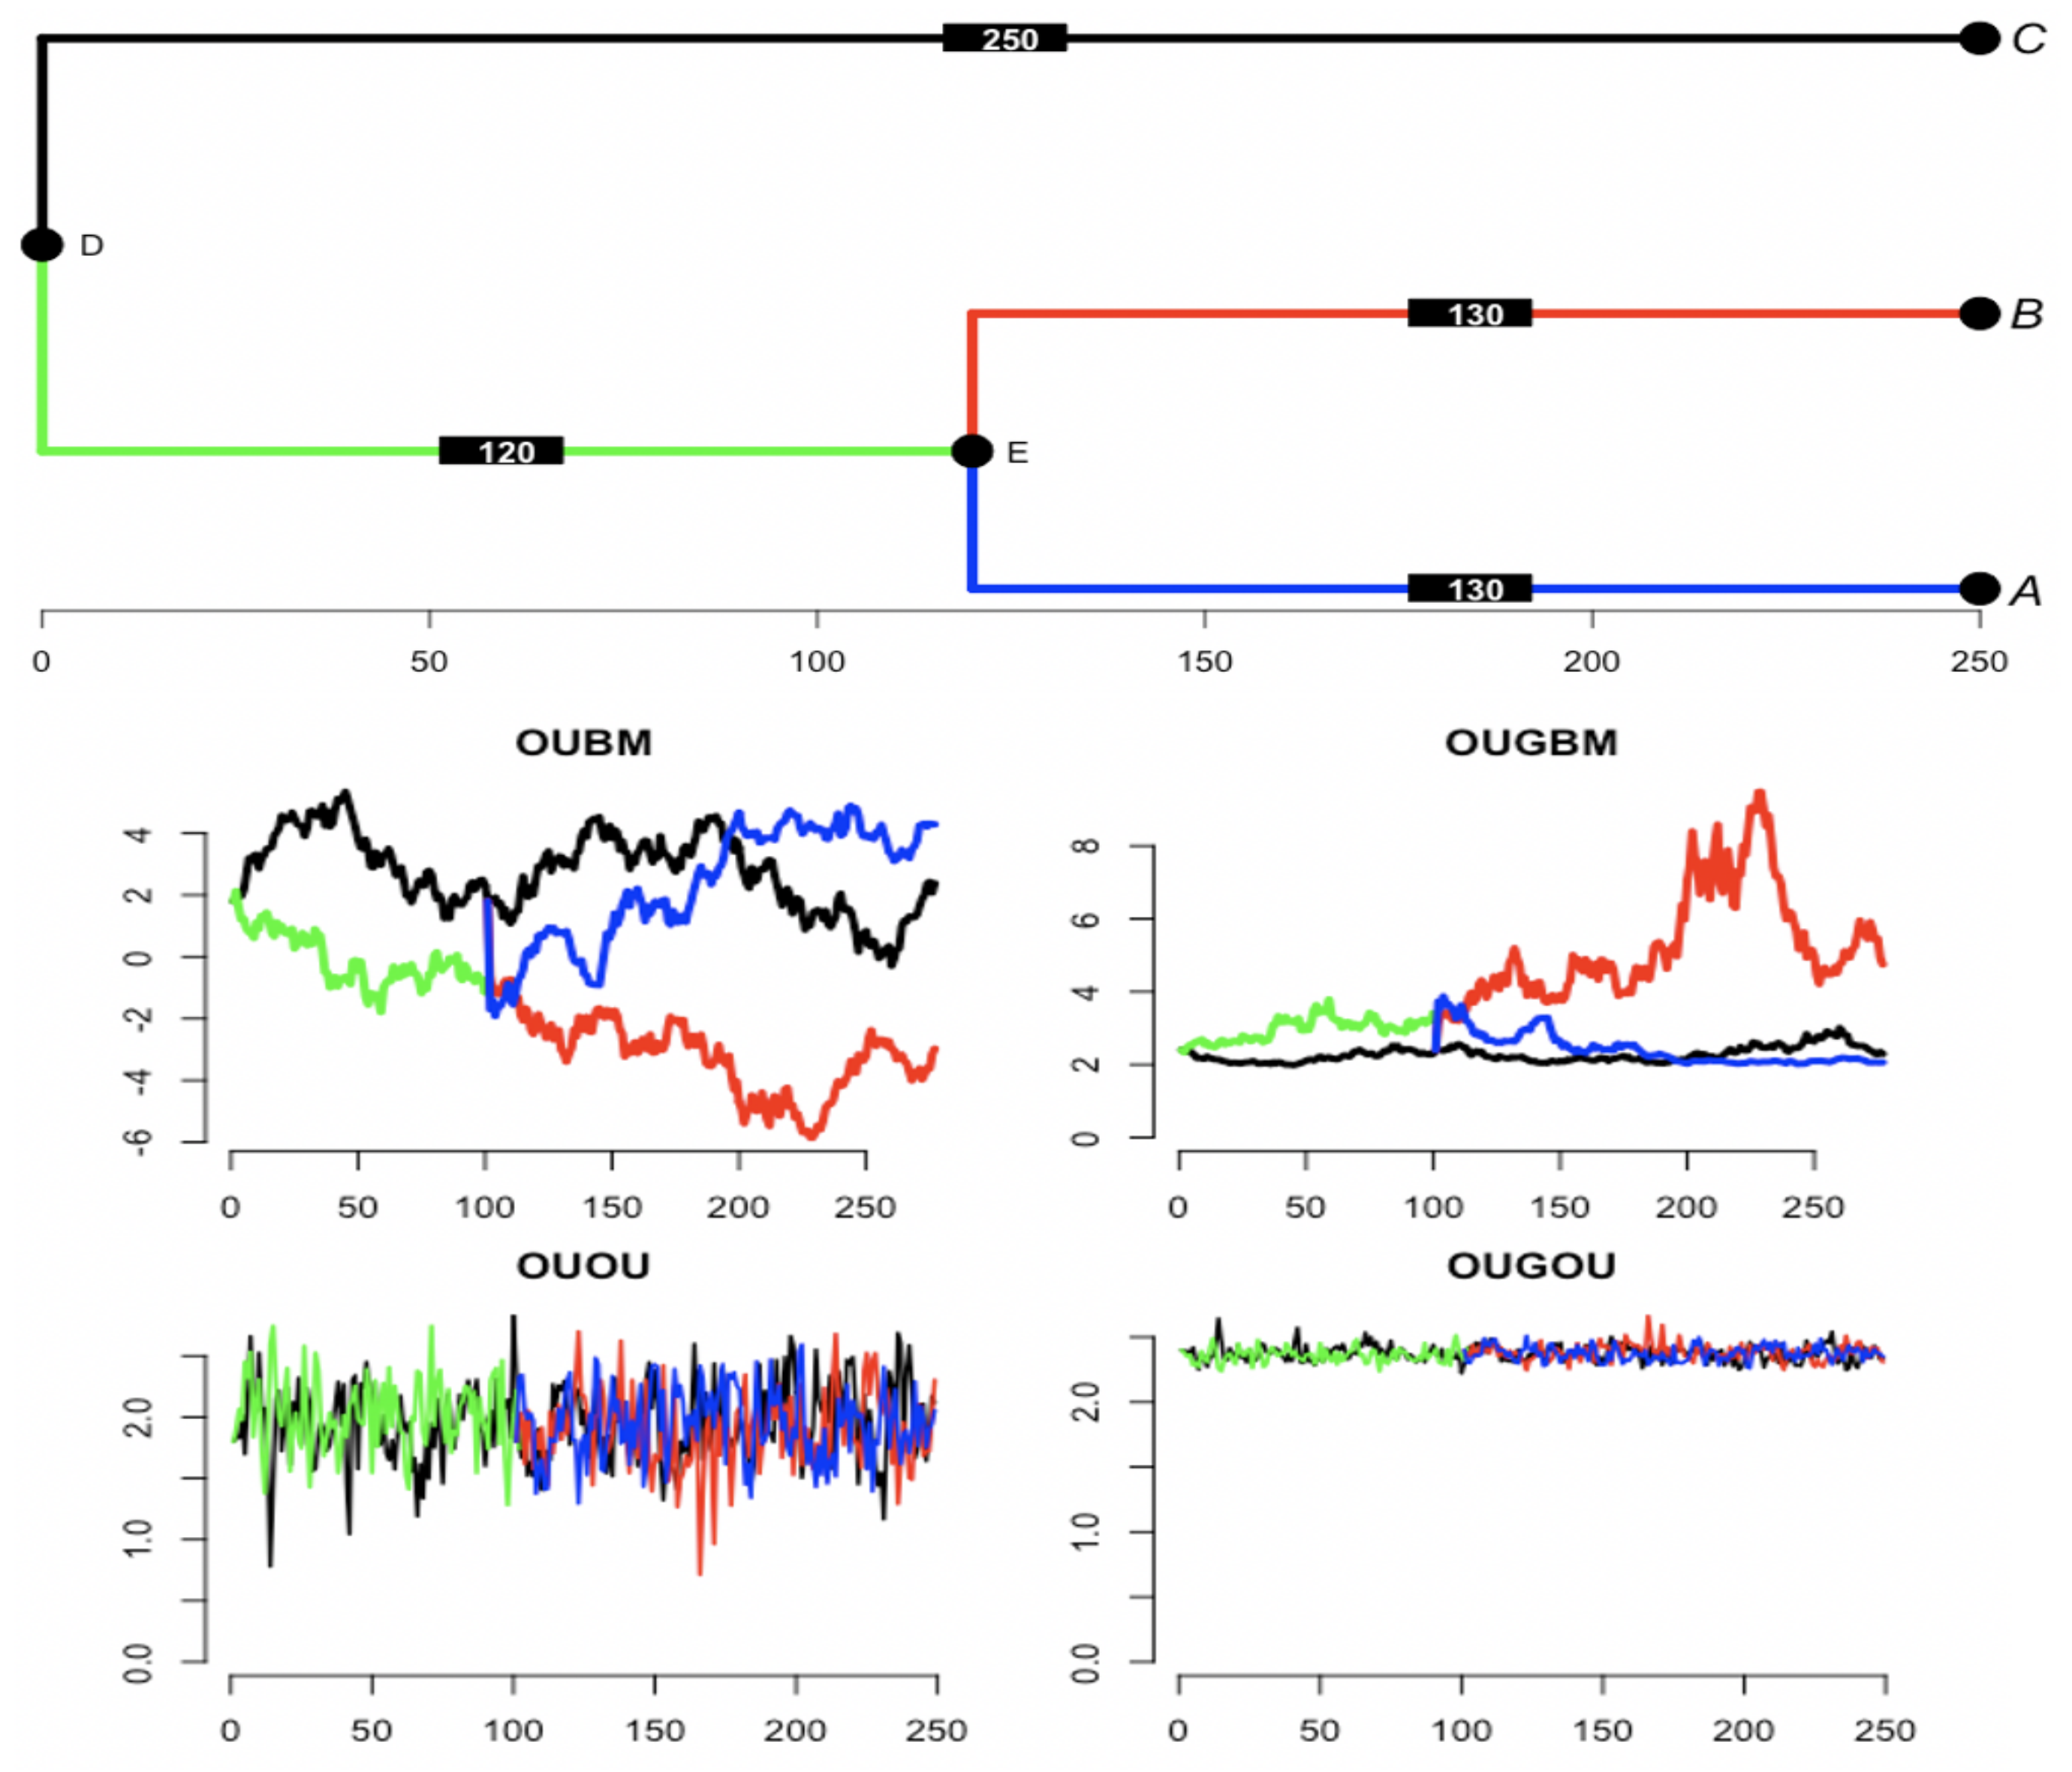
. We also implemented the OUBM (see
Section 2.2.1) and OUOU (see
Section 2.2.2) models for comparison with the new models. Since species are evolutionarily related, the models were developed with the assumption that evolutionary dependency among a group of species is along a given root phylogenetic tree (see
Section 2.3). Due to those new models’ lack of model likelihood, we propose the use of the approximate Bayesian computation procedure for model inference (see
Section 2.4).
4. Discussion
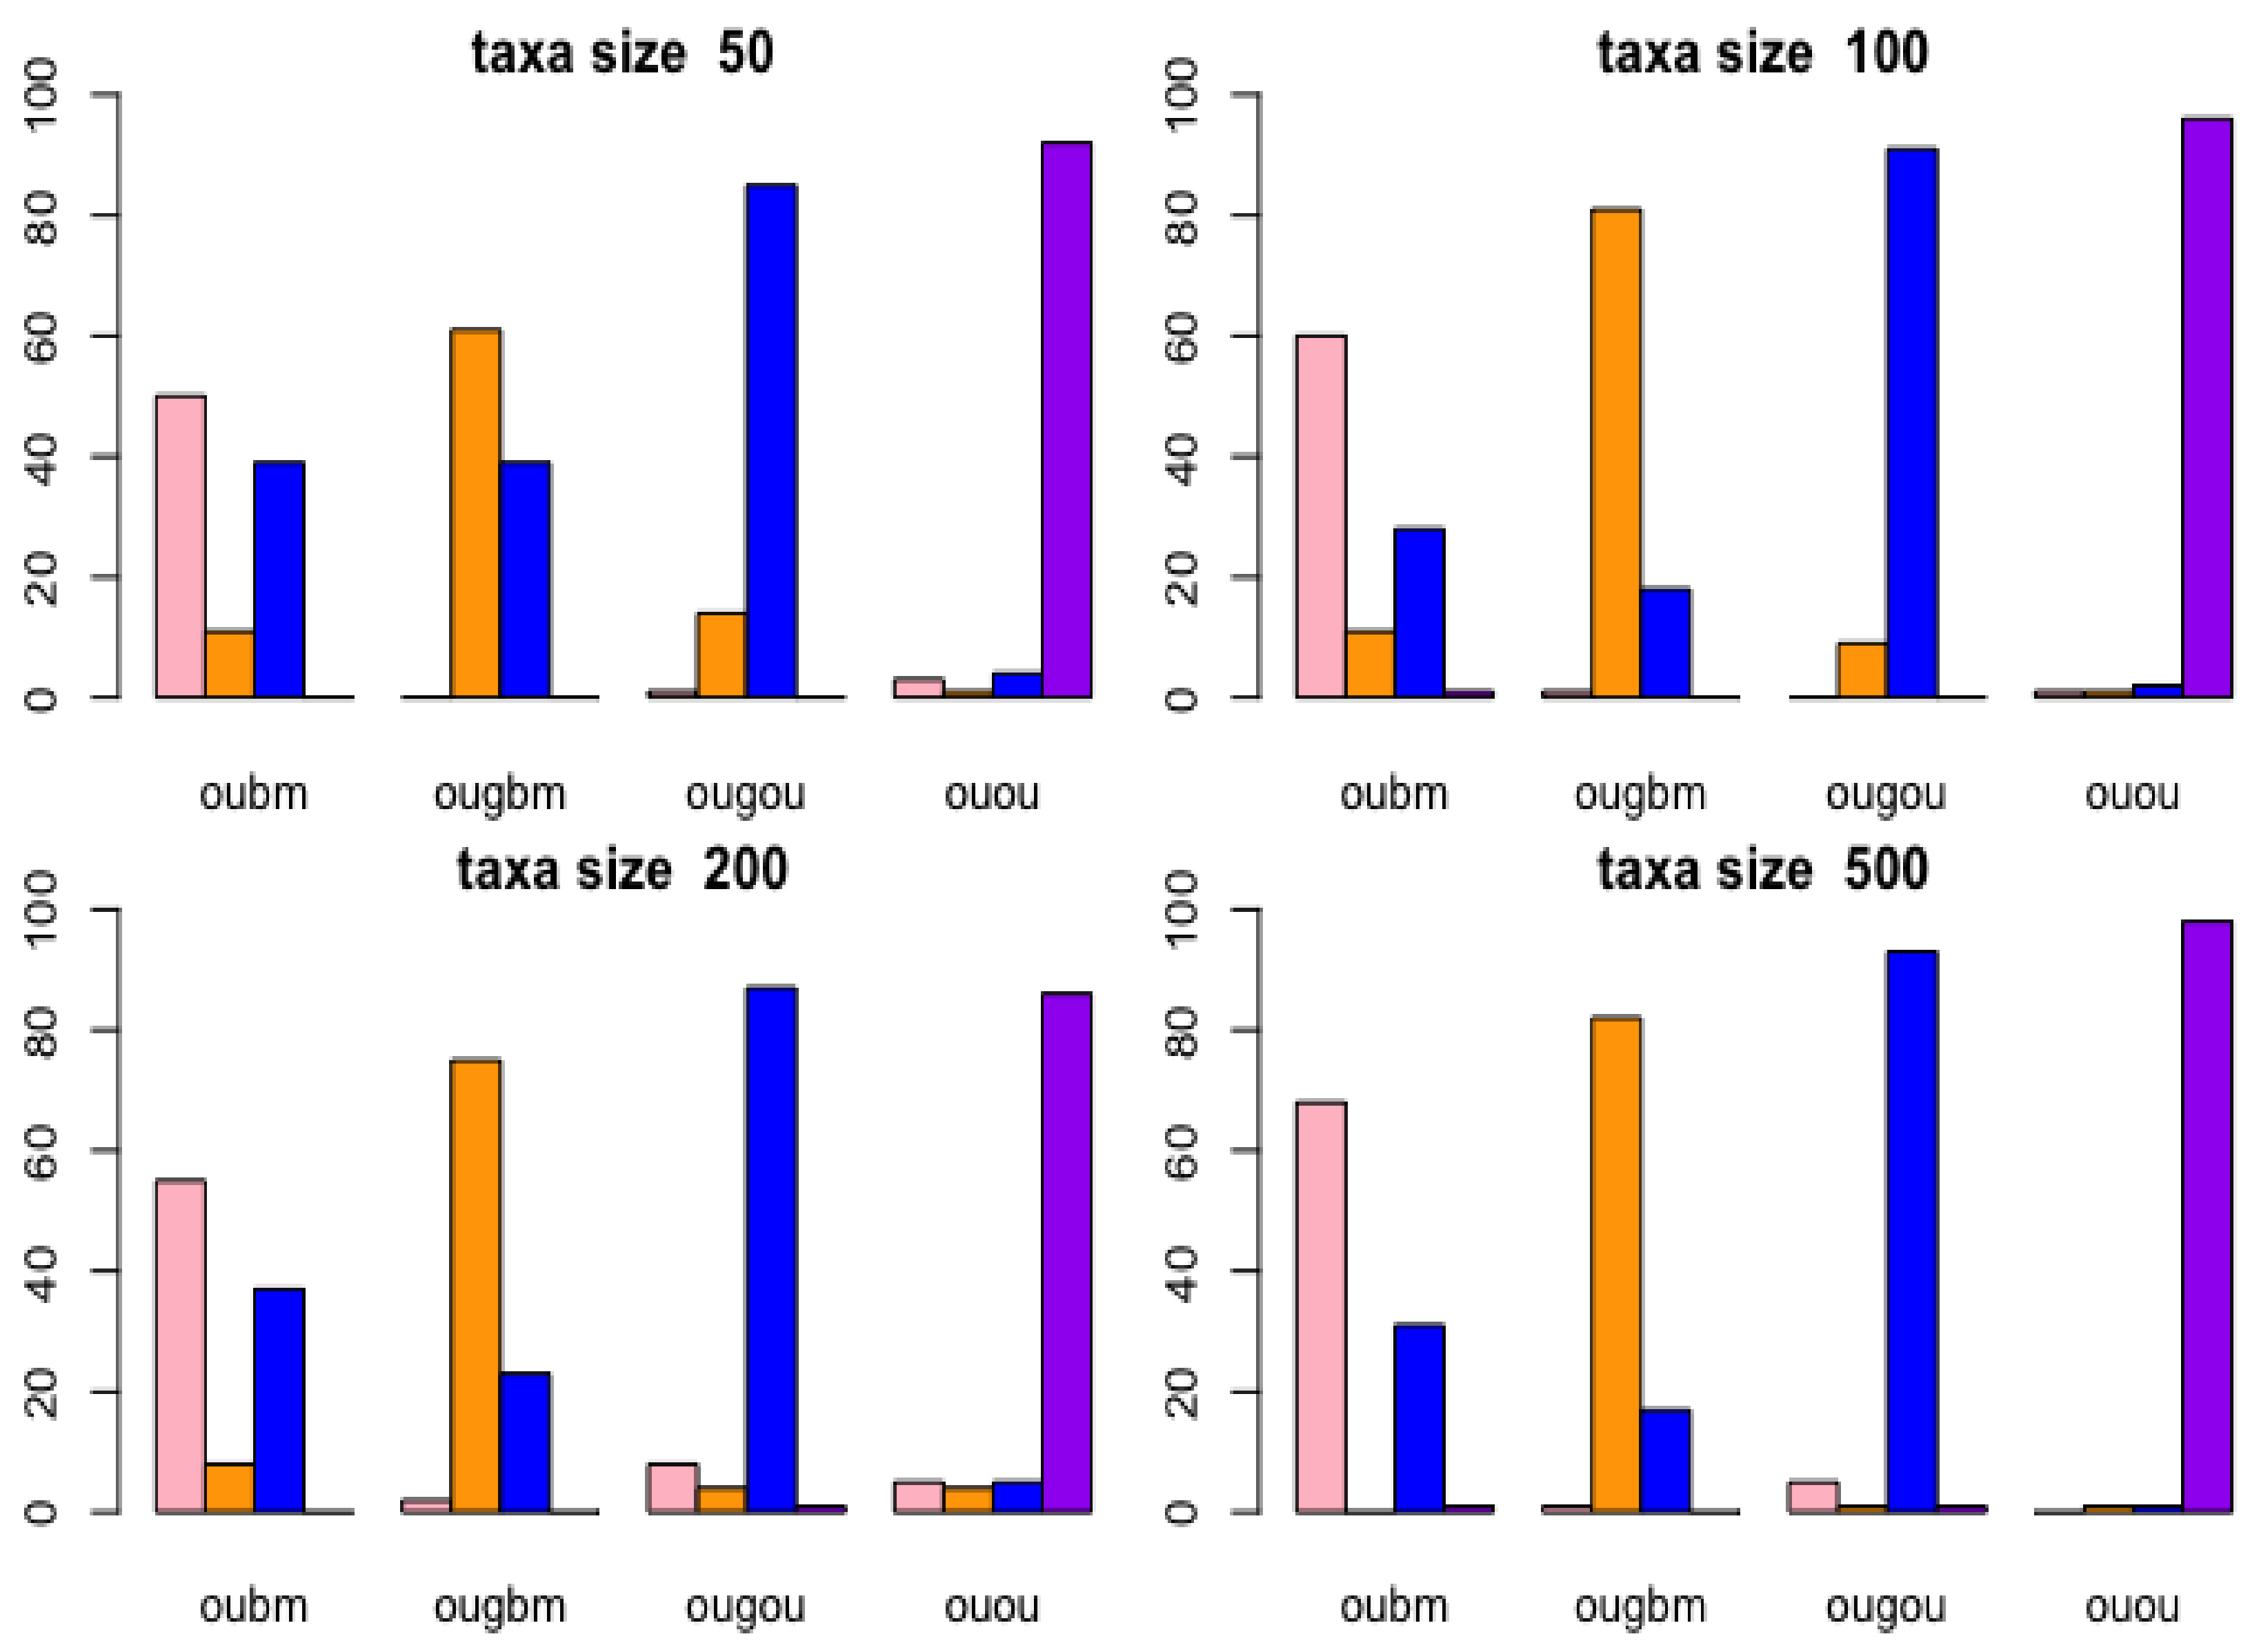
Two phylogenetic optimal exponential regression models, OUGBM and OUGOU, for adaptive trait evolution under stabilizing selection were developed. Simulations showed that the new models were validated where posterior means of parameters were close to their true parameter values. The utility of the new regression models in phylogenetic comparative analysis is accessed by analyzing the kangaroo dataset, and results showed that the new models could be appropriately used and are more competitive than the linear models.
Parameter estimation for regression parameters in the ABC procedure depends on several factors. While appropriate priors are required for simulating samples, the choice of the hyperparameters is also important. In this study, uniform distribution with bounds of regression estimates ±5 times their standard deviations was used. As results showed the fit of the model, the choice of the parameters for ABC inference provides a reasonable range to cover the true parameters.
The OU process is applied to model stabilizing selection, but is currently criticised for simply being a trait-tracking movement process [
48]. Our models assumed that the optimum was tracked by its covariates in a nonlinear functional manner. While our approach provides options for analyzing trait data from the aspect of adaptive trait evolution, it remains to be seen whether models can accurately estimate the adaptive optima from the stabilizing selection, as described in the literature [
48]. Undoubtedly, it would be very interesting to investigate this open question for all OU process-based PCMs [
8].
Phylogenetic comparative methods are very useful statistical methods to answer evolutionary questions. Those methods, which were developed on the basis of the property of stochastic process remains, require more improvement so that they are able to face the challenges of an intrinsic evolutionary process, which merely a simple Brownian motion model or an OU process model can solve [
40,
49]. Our models provide feasible options to users in the community to account for nonlinearity in the relationship between the trait optima undergoing stabilizing selection and predictor traits. The models and procedures included in this study were implemented into the
R package
ouxy [
50].


