
The Value of Heart Rhythm Complexity in Identifying High-Risk Pulmonary Hypertension Patients

 , and
, and
Abstract
:1. Introduction
2. Materials and Methods
2.1. Patients
2.2. Echocardiogram
2.3. 24-h Holter Recording and Data Processing
2.4. Linear HRV Analysis
2.5. Non-Linear HRV Analysis
2.6. Statistical Analysis
3. Results
3.1. Patient Characteristics
3.2. Predictors of Interest: HRV Analysis
3.2.1. Comparisons of Linear and Non-Linear HRV Parameters to Differentiate the High-Risk PH Patients
3.2.2. Logistic Regression Analysis to Predict the Presence of High-Risk PH
3.2.3. The Effect of Adding Heart Rhythm Complexity to the Linear HRV Parameters to Identify High-Risk PH Patients
4. Discussion
5. Conclusions
Author Contributions
Funding
Institutional Review Board Statement
Informed Consent Statement
Data Availability Statement
Acknowledgments
Conflicts of Interest
References
- Galie, N.; Humbert, M.; Vachiery, J.L.; Gibbs, S.; Lang, I.; Torbicki, A.; Simonneau, G.; Peacock, A.; Vonk Noordegraaf, A.; Beghetti, M.; et al. 2015 ESC/ERS Guidelines for the Diagnosis and Treatment of Pulmonary Hypertension. Rev. Esp. Cardiol. (Engl. Ed.) 2016, 69, 177. [Google Scholar] [CrossRef] [PubMed]
- Lilienfeld, D.E.; Rubin, L.J. Mortality from primary pulmonary hypertension in the United States, 1979–1996. Chest 2000, 117, 796–800. [Google Scholar] [CrossRef] [PubMed]
- Ghofrani, H.A.; Wiedemann, R.; Rose, F.; Olschewski, H.; Schermuly, R.T.; Weissmann, N.; Seeger, W.; Grimminger, F. Combination therapy with oral sildenafil and inhaled iloprost for severe pulmonary hypertension. Ann. Intern. Med. 2002, 136, 515–522. [Google Scholar] [CrossRef] [PubMed]
- Hoeper, M.M.; Faulenbach, C.; Golpon, H.; Winkler, J.; Welte, T.; Niedermeyer, J. Combination therapy with bosentan and sildenafil in idiopathic pulmonary arterial hypertension. Eur. Respir. J. 2004, 24, 1007–1010. [Google Scholar] [CrossRef] [Green Version]
- Galie, N.; Humbert, M.; Vachiery, J.L.; Gibbs, S.; Lang, I.; Torbicki, A.; Simonneau, G.; Peacock, A.; Vonk Noordegraaf, A.; Beghetti, M.; et al. 2015 ESC/ERS Guidelines for the diagnosis and treatment of pulmonary hypertension: The Joint Task Force for the Diagnosis and Treatment of Pulmonary Hypertension of the European Society of Cardiology (ESC) and the European Respiratory Society (ERS): Endorsed by: Association for European Paediatric and Congenital Cardiology (AEPC), International Society for Heart and Lung Transplantation (ISHLT). Eur. Heart J. 2016, 37, 67–119. [Google Scholar] [CrossRef]
- Humbert, M.; Sitbon, O.; Chaouat, A.; Bertocchi, M.; Habib, G.; Gressin, V.; Yaïci, A.; Weitzenblum, E.; Cordier, J.-F.; Chabot, F.; et al. Survival in Patients With Idiopathic, Familial, and Anorexigen-Associated Pulmonary Arterial Hypertension in the Modern Management Era. Circulation 2010, 122, 156–163. [Google Scholar] [CrossRef] [Green Version]
- Wang, L.Y.; Lee, K.T.; Lin, C.P.; Hsu, L.A.; Wang, C.L.; Hsu, T.S.; Ho, W.J. Long-Term Survival of Patients with Pulmonary Arterial Hypertension at a Single Center in Taiwan. Acta. Cardiol. Sin. 2017, 33, 498–509. [Google Scholar]
- Benza, R.L.; Miller, D.P.; Barst, R.J.; Badesch, D.B.; Frost, A.E.; McGoon, M.D. An Evaluation of Long-term Survival From Time of Diagnosis in Pulmonary Arterial Hypertension From the REVEAL Registry. Chest 2012, 142, 448–456. [Google Scholar] [CrossRef]
- Hoeper, M.M.; Pittrow, D.; Opitz, C.; Gibbs, J.S.R.; Rosenkranz, S.; Grünig, E.; Olsson, K.M.; Huscher, D. Risk assessment in pulmonary arterial hypertension. Eur. Respir. J. 2018, 51, 1702606. [Google Scholar] [CrossRef]
- Raina, A.; Humbert, M. Risk assessment in pulmonary arterial hypertension. Eur. Respir. Rev. 2016, 25, 390–398. [Google Scholar] [CrossRef] [Green Version]
- Ho, Y.L.; Lin, C.; Lin, Y.H.; Lo, M.T. The prognostic value of non-linear analysis of heart rate variability in patients with congestive heart failure--a pilot study of multiscale entropy. PLoS ONE 2011, 6, e18699. [Google Scholar] [CrossRef] [Green Version]
- Ferrario, M.; Raimann, J.G.; Larive, B.; Pierratos, A.; Thijssen, S.; Rajagopalan, S.; Greene, T.; Cerutti, S.; Beck, G.; Chan, C.; et al. Non-Linear Heart Rate Variability Indices in the Frequent Hemodialysis Network Trials of Chronic Hemodialysis Patients. Blood Purif. 2015, 40, 99–108. [Google Scholar] [CrossRef] [Green Version]
- Tsai, C.H.; Ma, H.P.; Lin, Y.T.; Hung, C.S.; Hsieh, M.C.; Chang, T.Y.; Kuo, P.H.; Lin, C.; Lo, M.T.; Hsu, H.H.; et al. Heart Rhythm Complexity Impairment in Patients with Pulmonary Hypertension. Sci. Rep. 2019, 9, 10710. [Google Scholar] [CrossRef] [Green Version]
- Makikallio, T.H.; Huikuri, H.V.; Hintze, U.; Videbaek, J.; Mitrani, R.D.; Castellanos, A.; Myerburg, R.J.; Moller, M.; Group, D.S. Fractal analysis and time- and frequency-domain measures of heart rate variability as predictors of mortality in patients with heart failure. Am. J. Cardiol. 2001, 87, 178–182. [Google Scholar] [CrossRef]
- Humbert, M. Pulmonary arterial hypertension and chronic thromboembolic pulmonary hypertension: Pathophysiology. Eur. Respir. Rev. 2010, 19, 59–63. [Google Scholar] [CrossRef] [Green Version]
- Thenappan, T.; Ormiston, M.L.; Ryan, J.J.; Archer, S.L. Pulmonary arterial hypertension: Pathogenesis and clinical management. BMJ 2018, 360, j5492. [Google Scholar] [CrossRef]
- Glanville, A.R.; Burke, C.M.; Theodore, J.; Robin, E.D. Primary pulmonary hypertension. Length of survival in patients referred for heart-lung transplantation. Chest 1987, 91, 675–681. [Google Scholar] [CrossRef] [Green Version]
- Montani, D.; O’Callaghan, D.S.; Jais, X.; Savale, L.; Natali, D.; Redzepi, A.; Hoette, S.; Parent, F.; Sitbon, O.; Simonneau, G.; et al. Implementing the ESC/ERS pulmonary hypertension guidelines: Real-life cases from a national referral centre. Eur. Respir. Rev. 2009, 18, 272–290. [Google Scholar] [CrossRef]
- Sitbon, O.; Simonneau, G. Optimal management of severe pulmonary arterial hypertension. Eur. Respir. Rev. 2011, 20, 254–261. [Google Scholar] [CrossRef] [Green Version]
- Von Elm, E.; Altman, D.G.; Egger, M.; Pocock, S.J.; Gotzsche, P.C.; Vandenbroucke, J.P.; Initiative, S. The Strengthening the Reporting of Observational Studies in Epidemiology (STROBE) statement: Guidelines for reporting observational studies. Ann. Intern. Med. 2007, 147, 573–577. [Google Scholar] [CrossRef] [Green Version]
- Mitchell, C.; Rahko, P.S.; Blauwet, L.A.; Canaday, B.; Finstuen, J.A.; Foster, M.C.; Horton, K.; Ogunyankin, K.O.; Palma, R.A.; Velazquez, E.J. Guidelines for Performing a Comprehensive Transthoracic Echocardiographic Examination in Adults: Recommendations from the American Society of Echocardiography. J. Am. Soc. Echocardiogr. 2019, 32, 1–64. [Google Scholar] [CrossRef] [PubMed]
- Magagnin, V.; Bassani, T.; Bari, V.; Turiel, M.; Maestri, R.; Pinna, G.D.; Porta, A. Non-stationarities significantly distort short-term spectral, symbolic and entropy heart rate variability indices. Physiol. Meas. 2011, 32, 1775–1786. [Google Scholar] [CrossRef] [PubMed]
- Lin, C.; Yeh, C.H.; Wang, C.Y.; Shi, W.; Serafico, B.M.F.; Wang, C.H.; Juan, C.H.; Vincent Young, H.W.; Lin, Y.J.; Yeh, H.M.; et al. Robust Fetal Heart Beat Detection via R-Peak Intervals Distribution. IEEE Trans. Biomed. Eng. 2019, 66, 3310–3319. [Google Scholar] [CrossRef] [PubMed]
- Lin, Y.H.; Wu, V.C.; Lo, M.T.; Wu, X.M.; Hung, C.S.; Wu, K.D.; Lin, C.; Ho, Y.L.; Stowasser, M.; Peng, C.K. Reversible heart rhythm complexity impairment in patients with primary aldosteronism. Sci. Rep. 2015, 5, 11249. [Google Scholar] [CrossRef] [PubMed] [Green Version]
- Heart rate variability: Standards of measurement, physiological interpretation and clinical use. Task Force of the European Society of Cardiology and the North American Society of Pacing and Electrophysiology. Circulation 1996, 93, 1043–1065.
- Peng, C.K.; Havlin, S.; Stanley, H.E.; Goldberger, A.L. Quantification of scaling exponents and crossover phenomena in nonstationary heartbeat time series. Chaos 1995, 5, 82–87. [Google Scholar] [CrossRef] [PubMed]
- Peng, C.K.; Havlin, S.; Hausdorff, J.M.; Mietus, J.E.; Stanley, H.E.; Goldberger, A.L. Fractal mechanisms and heart rate dynamics: Long-range correlations and their breakdown with disease. J. Electrocardiol. 1995, 28, 59–65. [Google Scholar] [CrossRef]
- Costa, M.; Goldberger, A.L.; Peng, C.K. Multiscale entropy analysis of biological signals. Phys. Rev. E Stat. Nonlin. Soft Matter Phys. 2005, 71, 021906. [Google Scholar] [CrossRef] [Green Version]
- Pencina, M.J.; D’Agostino, R.B., Sr.; D’Agostino, R.B., Jr.; Vasan, R.S. Evaluating the added predictive ability of a new marker: From area under the ROC curve to reclassification and beyond. Stat. Med. 2008, 27, 157–172. [Google Scholar] [CrossRef]
- Pencina, M.J.; D’Agostino, R.B., Sr.; Steyerberg, E.W. Extensions of net reclassification improvement calculations to measure usefulness of new biomarkers. Stat. Med. 2011, 30, 11–21. [Google Scholar] [CrossRef]
- Ling, Y.; Johnson, M.K.; Kiely, D.G.; Condliffe, R.; Elliot, C.A.; Gibbs, J.S.R.; Howard, L.S.; Pepke-Zaba, J.; Sheares, K.K.K.; Corris, P.A.; et al. Changing Demographics, Epidemiology, and Survival of Incident Pulmonary Arterial Hypertension. Am. J. Respir. Crit. Care Med. 2012, 186, 790–796. [Google Scholar] [CrossRef]
- Casolo, G.; Balli, E.; Taddei, T.; Amuhasi, J.; Gori, C. Decreased spontaneous heart rate variability in congestive heart failure. Am. J. Cardiol. 1989, 64, 1162–1167. [Google Scholar] [CrossRef]
- Goncalves, H.; Henriques-Coelho, T.; Bernardes, J.; Rocha, A.P.; Brandao-Nogueira, A.; Leite-Moreira, A. Analysis of heart rate variability in a rat model of induced pulmonary hypertension. Med. Eng. Phys. 2010, 32, 746–752. [Google Scholar] [CrossRef] [Green Version]
- Huikuri, H.V.; Jokinen, V.; Syvanne, M.; Nieminen, M.S.; Airaksinen, K.E.; Ikaheimo, M.J.; Koistinen, J.M.; Kauma, H.; Kesaniemi, A.Y.; Majahalme, S.; et al. Heart rate variability and progression of coronary atherosclerosis. Arter. Thromb. Vasc. Biol. 1999, 19, 1979–1985. [Google Scholar] [CrossRef] [Green Version]
- Porta, A.; Gnecchi-Ruscone, T.; Tobaldini, E.; Guzzetti, S.; Furlan, R.; Montano, N. Progressive decrease of heart period variability entropy-based complexity during graded head-up tilt. J. Appl. Physiol. 2007, 103, 1143–1149. [Google Scholar] [CrossRef]
- Catai, A.M.; Takahashi, A.; Perseguini, N.M.; Milan, J.C.; Minatel, V.; Rehder-Santos, P.; Marchi, A.; Bari, V.; Porta, A. Effect of the postural challenge on the dependence of the cardiovascular control complexity on age. Entropy 2014, 16, 6686–6704. [Google Scholar] [CrossRef] [Green Version]
- Ryan, J.J.; Archer, S.L. The right ventricle in pulmonary arterial hypertension: Disorders of metabolism, angiogenesis and adrenergic signaling in right ventricular failure. Circ. Res. 2014, 115, 176–188. [Google Scholar] [CrossRef] [Green Version]
- Mak, S.; Witte, K.K.; Al-Hesayen, A.; Granton, J.J.; Parker, J.D. Cardiac sympathetic activation in patients with pulmonary arterial hypertension. Am. J. Physiol. Regul. Integr. Comp. Physiol. 2012, 302, R1153–R1157. [Google Scholar] [CrossRef] [Green Version]
- Ciarka, A.; Doan, V.; Velez-Roa, S.; Naeije, R.; van de Borne, P. Prognostic significance of sympathetic nervous system activation in pulmonary arterial hypertension. Am. J. Respir. Crit. Care. Med. 2010, 181, 1269–1275. [Google Scholar] [CrossRef]
- Velez-Roa, S.; Ciarka, A.; Najem, B.; Vachiery, J.L.; Naeije, R.; van de Borne, P. Increased sympathetic nerve activity in pulmonary artery hypertension. Circulation 2004, 110, 1308–1312. [Google Scholar] [CrossRef] [Green Version]
- Isobe-Sasaki, Y.; Fukuda, M.; Ogiyama, Y.; Sato, R.; Miura, T.; Fuwa, D.; Mizuno, M.; Matsuoka, T.; Shibata, H.; Ito, H.; et al. Sodium balance, circadian BP rhythm, heart rate variability, and intrarenal renin-angiotensin-aldosterone and dopaminergic systems in acute phase of ARB therapy. Physiol. Rep. 2017, 5, e13309. [Google Scholar] [CrossRef]
- Saul, J.P.; Arai, Y.; Berger, R.D.; Lilly, L.S.; Colucci, W.S.; Cohen, R.J. Assessment of autonomic regulation in chronic congestive heart failure by heart rate spectral analysis. Am. J. Cardiol. 1988, 61, 1292–1299. [Google Scholar] [CrossRef]
- Florea, V.G.; Cohn, J.N. The autonomic nervous system and heart failure. Circ. Res. 2014, 114, 1815–1826. [Google Scholar] [CrossRef] [Green Version]
- Vaillancourt, M.; Chia, P.; Sarji, S.; Nguyen, J.; Hoftman, N.; Ruffenach, G.; Eghbali, M.; Mahajan, A.; Umar, S. Autonomic nervous system involvement in pulmonary arterial hypertension. Respir. Res. 2017, 18, 201. [Google Scholar] [CrossRef] [Green Version]
- Bienias, P.; Kostrubiec, M.; Rymarczyk, Z.; Korczak, D.; Ciurzynski, M.; Kurzyna, M.; Torbicki, A.; Fijalkowska, A.; Pruszczyk, P. Severity of arterial and chronic thromboembolic pulmonary hypertension is associated with impairment of heart rate turbulence. Ann. Noninvasive Electrocardiol. 2015, 20, 69–78. [Google Scholar] [CrossRef]
- Costa, M.; Goldberger, A.L.; Peng, C.K. Multiscale entropy analysis of complex physiologic time series. Phys. Rev. Lett. 2002, 89, 068102. [Google Scholar] [CrossRef] [Green Version]
- Tsai, C.H.; Huang, J.W.; Lin, C.; Ma, H.P.; Lo, M.T.; Liu, L.D.; Lin, L.Y.; Lin, C.T.; Hung, C.S.; Peng, C.K.; et al. Heart Rhythm Complexity Predicts Long-Term Cardiovascular Outcomes in Peritoneal Dialysis Patients: A Prospective Cohort Study. J. Am. Heart Assoc. 2020, 9, e013036. [Google Scholar] [CrossRef]
- Busa, M.A.; van Emmerik, R.E.A. Multiscale entropy: A tool for understanding the complexity of postural control. J. Sport Health Sci. 2016, 5, 44–51. [Google Scholar] [CrossRef] [Green Version]
- Patel, V.N.; Pierce, B.R.; Bodapati, R.K.; Brown, D.L.; Ives, D.G.; Stein, P.K. Association of Holter-Derived Heart Rate Variability Parameters with the Development of Congestive Heart Failure in the Cardiovascular Health Study. JACC Heart Fail. 2017, 5, 423–431. [Google Scholar] [CrossRef]
- Binkley, P.F. Promise of a New Role for Heart Rate Variability in the Clinical Management of Patients with Heart Failure. JACC Heart Fail. 2017, 5, 432–434. [Google Scholar] [CrossRef]
- Tsuji, H.; Larson, M.G.; Venditti, F.J., Jr.; Manders, E.S.; Evans, J.C.; Feldman, C.L.; Levy, D. Impact of reduced heart rate variability on risk for cardiac events. The Framingham Heart Study. Circulation 1996, 94, 2850–2855. [Google Scholar] [CrossRef] [PubMed]
- Chiu, H.C.; Ma, H.P.; Lin, C.; Lo, M.T.; Lin, L.Y.; Wu, C.K.; Chiang, J.Y.; Lee, J.K.; Hung, C.S.; Wang, T.D.; et al. Serial heart rhythm complexity changes in patients with anterior wall ST segment elevation myocardial infarction. Sci. Rep. 2017, 7, 43507. [Google Scholar] [CrossRef]
- Chiang, J.Y.; Huang, J.W.; Lin, L.Y.; Chang, C.H.; Chu, F.Y.; Lin, Y.H.; Wu, C.K.; Lee, J.K.; Hwang, J.J.; Lin, J.L.; et al. Detrended Fluctuation Analysis of Heart Rate Dynamics Is an Important Prognostic Factor in Patients with End-Stage Renal Disease Receiving Peritoneal Dialysis. PLoS ONE 2016, 11, e0147282. [Google Scholar] [CrossRef] [PubMed]
- Tsai, C.H.; Lin, C.; Ho, Y.H.; Lo, M.T.; Liu, L.D.; Lin, C.T.; Huang, J.W.; Peng, C.K.; Lin, Y.H. The association between heart rhythm complexity and the severity of abdominal aorta calcification in peritoneal dialysis patients. Sci. Rep. 2018, 8, 15627. [Google Scholar] [CrossRef] [PubMed] [Green Version]
- Tang, S.C.; Jen, H.I.; Lin, Y.H.; Hung, C.S.; Jou, W.J.; Huang, P.W.; Shieh, J.S.; Ho, Y.L.; Lai, D.M.; Wu, A.Y.; et al. Complexity of heart rate variability predicts outcome in intensive care unit admitted patients with acute stroke. J. Neurol. Neurosurg. Psychiatry 2015, 86, 95–100. [Google Scholar] [CrossRef] [PubMed] [Green Version]
- Folino, A.F.; Bobbo, F.; Schiraldi, C.; Tona, F.; Romano, S.; Buja, G.; Bellotto, F. Ventricular arrhythmias and autonomic profile in patients with primary pulmonary hypertension. Lung 2003, 181, 321–328. [Google Scholar] [CrossRef] [PubMed]
- Valencia, J.F.; Porta, A.; Vallverdu, M.; Claria, F.; Baranowski, R.; Orlowska-Baranowska, E.; Caminal, P. Refined multiscale entropy: Application to 24-h Holter recordings of heart period variability in healthy and aortic stenosis subjects. IEEE Trans. Biomed. Eng. 2009, 56, 2202–2213. [Google Scholar] [CrossRef]
- Yeh, C.H.; Juan, C.H.; Yeh, H.M.; Wang, C.Y.; Young, H.V.; Lin, J.L.; Lin, C.; Lin, L.Y.; Lo, M.T. The critical role of respiratory sinus arrhythmia on temporal cardiac dynamics. J. Appl. Physiol. 2019, 127, 1733–1741. [Google Scholar] [CrossRef]
- Porta, A.; De Maria, B.; Bari, V.; Marchi, A.; Faes, L. Are Nonlinear Model-Free Conditional Entropy Approaches for the Assessment of Cardiac Control Complexity Superior to the Linear Model-Based One? IEEE Trans. Biomed. Eng. 2017, 64, 1287–1296. [Google Scholar] [CrossRef] [Green Version]
- Porta, A.; Bari, V.; De Maria, B.; Cairo, B.; Vaini, E.; Malacarne, M.; Pagani, M.; Lucini, D. On the Relevance of Computing a Local Version of Sample Entropy in Cardiovascular Control Analysis. IEEE Trans. Biomed. Eng. 2019, 66, 623–631. [Google Scholar] [CrossRef]
- Schulz, S.; Adochiei, F.C.; Edu, I.R.; Schroeder, R.; Costin, H.; Bar, K.J.; Voss, A. Cardiovascular and cardiorespiratory coupling analyses: A review. Philos. Trans. A Math. Phys. Eng. Sci. 2013, 371, 20120191. [Google Scholar] [CrossRef] [Green Version]
- Platisa, M.M.; Radovanovic, N.N.; Kalauzi, A.; Milasinovic, G.; Pavlovic, S.U. Multiscale Entropy Analysis: Application to Cardio-Respiratory Coupling. Entropy 2020, 22, 1042. [Google Scholar] [CrossRef]
- Witte, C.; Meyer Zur Heide Genannt Meyer-Arend, J.U.; Andrie, R.; Schrickel, J.W.; Hammerstingl, C.; Schwab, J.O.; Nickenig, G.; Skowasch, D.; Pizarro, C. Heart Rate Variability and Arrhythmic Burden in Pulmonary Hypertension. Adv. Exp. Med. Biol. 2016, 934, 9–22. [Google Scholar] [CrossRef]
- Bienias, P.; Ciurzynski, M.; Kostrubiec, M.; Rymarczyk, Z.; Kurzyna, M.; Korczak, D.; Roik, M.; Torbicki, A.; Fijalkowska, A.; Pruszczyk, P. Functional class and type of pulmonary hypertension determinate severity of cardiac autonomic dysfunction assessed by heart rate variability and turbulence. Acta. Cardiol. 2015, 70, 286–296. [Google Scholar] [CrossRef]
- Semen, K.; Solovey, L.; Karapinka, M.; Yelisyeyeva, O. Heart rate variability: Possible implications for management of pulmonary arterial hypertension patients. Eur. Respir. J. 2012, 40, P970. [Google Scholar]
- Andersen, M.Ø.; Diederichsen, S.Z.; Svendsen, J.H.; Carlsen, J. Heart Rate Variability as Assessed with Long-Term Continuous Cardiac Monitoring in Pulmonary Hypertension. J. Am. Coll. Cardiol. 2020, 75, 2088. [Google Scholar] [CrossRef]

| High-Risk Group (N = 20) | Low-Risk Group (N = 34) | p Value | |
|---|---|---|---|
| Age (years) | 43.80 ± 10.70 | 45.76 ± 11.34 | 0.533 |
| Male, n (%) | 9 (45%) | 12 (35%) | 0.480 |
| BMI (kg·m−2) | 22.09 ± 3.85 | 24.21 ± 4.41 | 0.081 |
| CAD, n (%) | 1 (5%) | 1 (3%) | 1.000 |
| DM, n (%) | 2 (10%) | 3 (9%) | 1.000 |
| HTN, n (%) | 1 (5%) | 5 (15%) | 0.395 |
| Dyslipidemia, n (%) | 1 (5%) | 3 (9%) | 1.000 |
| PAH (WHO group 1) | 17 (85%) | 18 (53%) | 0.017 |
| Hemoglobin (g/dL) | 13.72 ± 3.15 | 13.52 ± 3.76 | 0.835 |
| Creatinine (mg/dL) | 1.15 ± 0.67 | 0.76 ± 0.26 | 0.024 |
| Log NT-proBNP | 3.34 ± 0.54 | 2.52 ± 0.54 | <0.001 |
| NT-proBNP (ng/dL) | 1510 (959~6428) | 292 (116~1045) | <0.001 |
| LVEF (%) | 68.55 ± 9.46 | 68.62 ± 10.07 | 0.977 |
| TRPG (mmHg) | 93.31 ± 31.8 | 64.67 ± 28.10 | 0.001 |
| Pericardial effusion, n (%) | 7 (35%) | 1 (3%) | 0.003 |
| 6MWD (m) | 298.31 ± 128.00 | 367.42 ± 120.32 | 0.074 |
| mPAP (mmHg) | 58.11 ± 15.46 | 47.44 ± 15.27 | 0.021 |
| PVR (Wood Units) | 13.63 ± 6.00 | 8.24 ± 4.23 | 0.002 |
| CO (L·min−1) | 3.71 ± 1.59 | 4.45 ± 1.30 | 0.081 |
| CI (L·min−1·m2) | 2.26 ± 0.97 | 2.75 ± 0.86 | 0.069 |
| PAWP (mmHg) | 14.00 ± 4.23 | 12.09 ± 3.69 | 0.097 |
| PAH specific medication | |||
| Sildenafil, n (%) | 8 (40%) | 15 (44%) | 0.768 |
| Macitentan, n (%) | 3 (15%) | 1 (3%) | 0.138 |
| Riociguat, n (%) | 0 (0%) | 6 (18%) | 0.074 |
| Bosentan, n (%) | 2 (10%) | 2 (6%) | 0.622 |
| Iloprost, n (%) | 4 (20%) | 1 (3%) | 0.057 |
| Epoprostenol, n (%) | 1 (5%) | 1 (3%) | 1.000 |
| High-Risk Group (N = 20) | Low-Risk Group (N = 34) | p Value | |
|---|---|---|---|
| Time Domain Analysis | |||
| Mean RR (ms) | 684.03 (605.77~795.63) | 748.63 (678.30~805.53) | 0.203 |
| SDRR (ms) | 57.14 (43.84~65.88) | 64.42 (54.37~87.43) | 0.162 |
| pNN20 (%) | 19.17 (9.20~26.67) | 20.86 (13.94~36.88) | 0.463 |
| pNN50 (%) | 3.47 (0.32~12.32) | 2.21 (0.77~6.64) | 0.667 |
| Frequency Domain Analysis | |||
| VLF (ms−2) | 172.56 (46.43~543.01) | 384.16 (169.56~604.98) | 0.062 |
| LF (ms−2) | 64.99 (19.52~140.02) | 98.00 (38.11~174.58) | 0.333 |
| HF (ms−2) | 42.28 (12.81~227.52) | 36.46 (15.94~125.03) | 0.629 |
| LF/HF ratio | 1.06 (0.56~2.17) | 2.14 (1.03~3.61) | 0.026 |
| Detrended fluctuation analysis | |||
| DFAα1 | 0.92 (0.56~1.05) | 1.04 (0.89~1.23) | 0.028 |
| DFAα2 | 1.12 (1.01~1.19) | 1.11 (1.03~1.17) | 0.900 |
| Multiscale entropy | |||
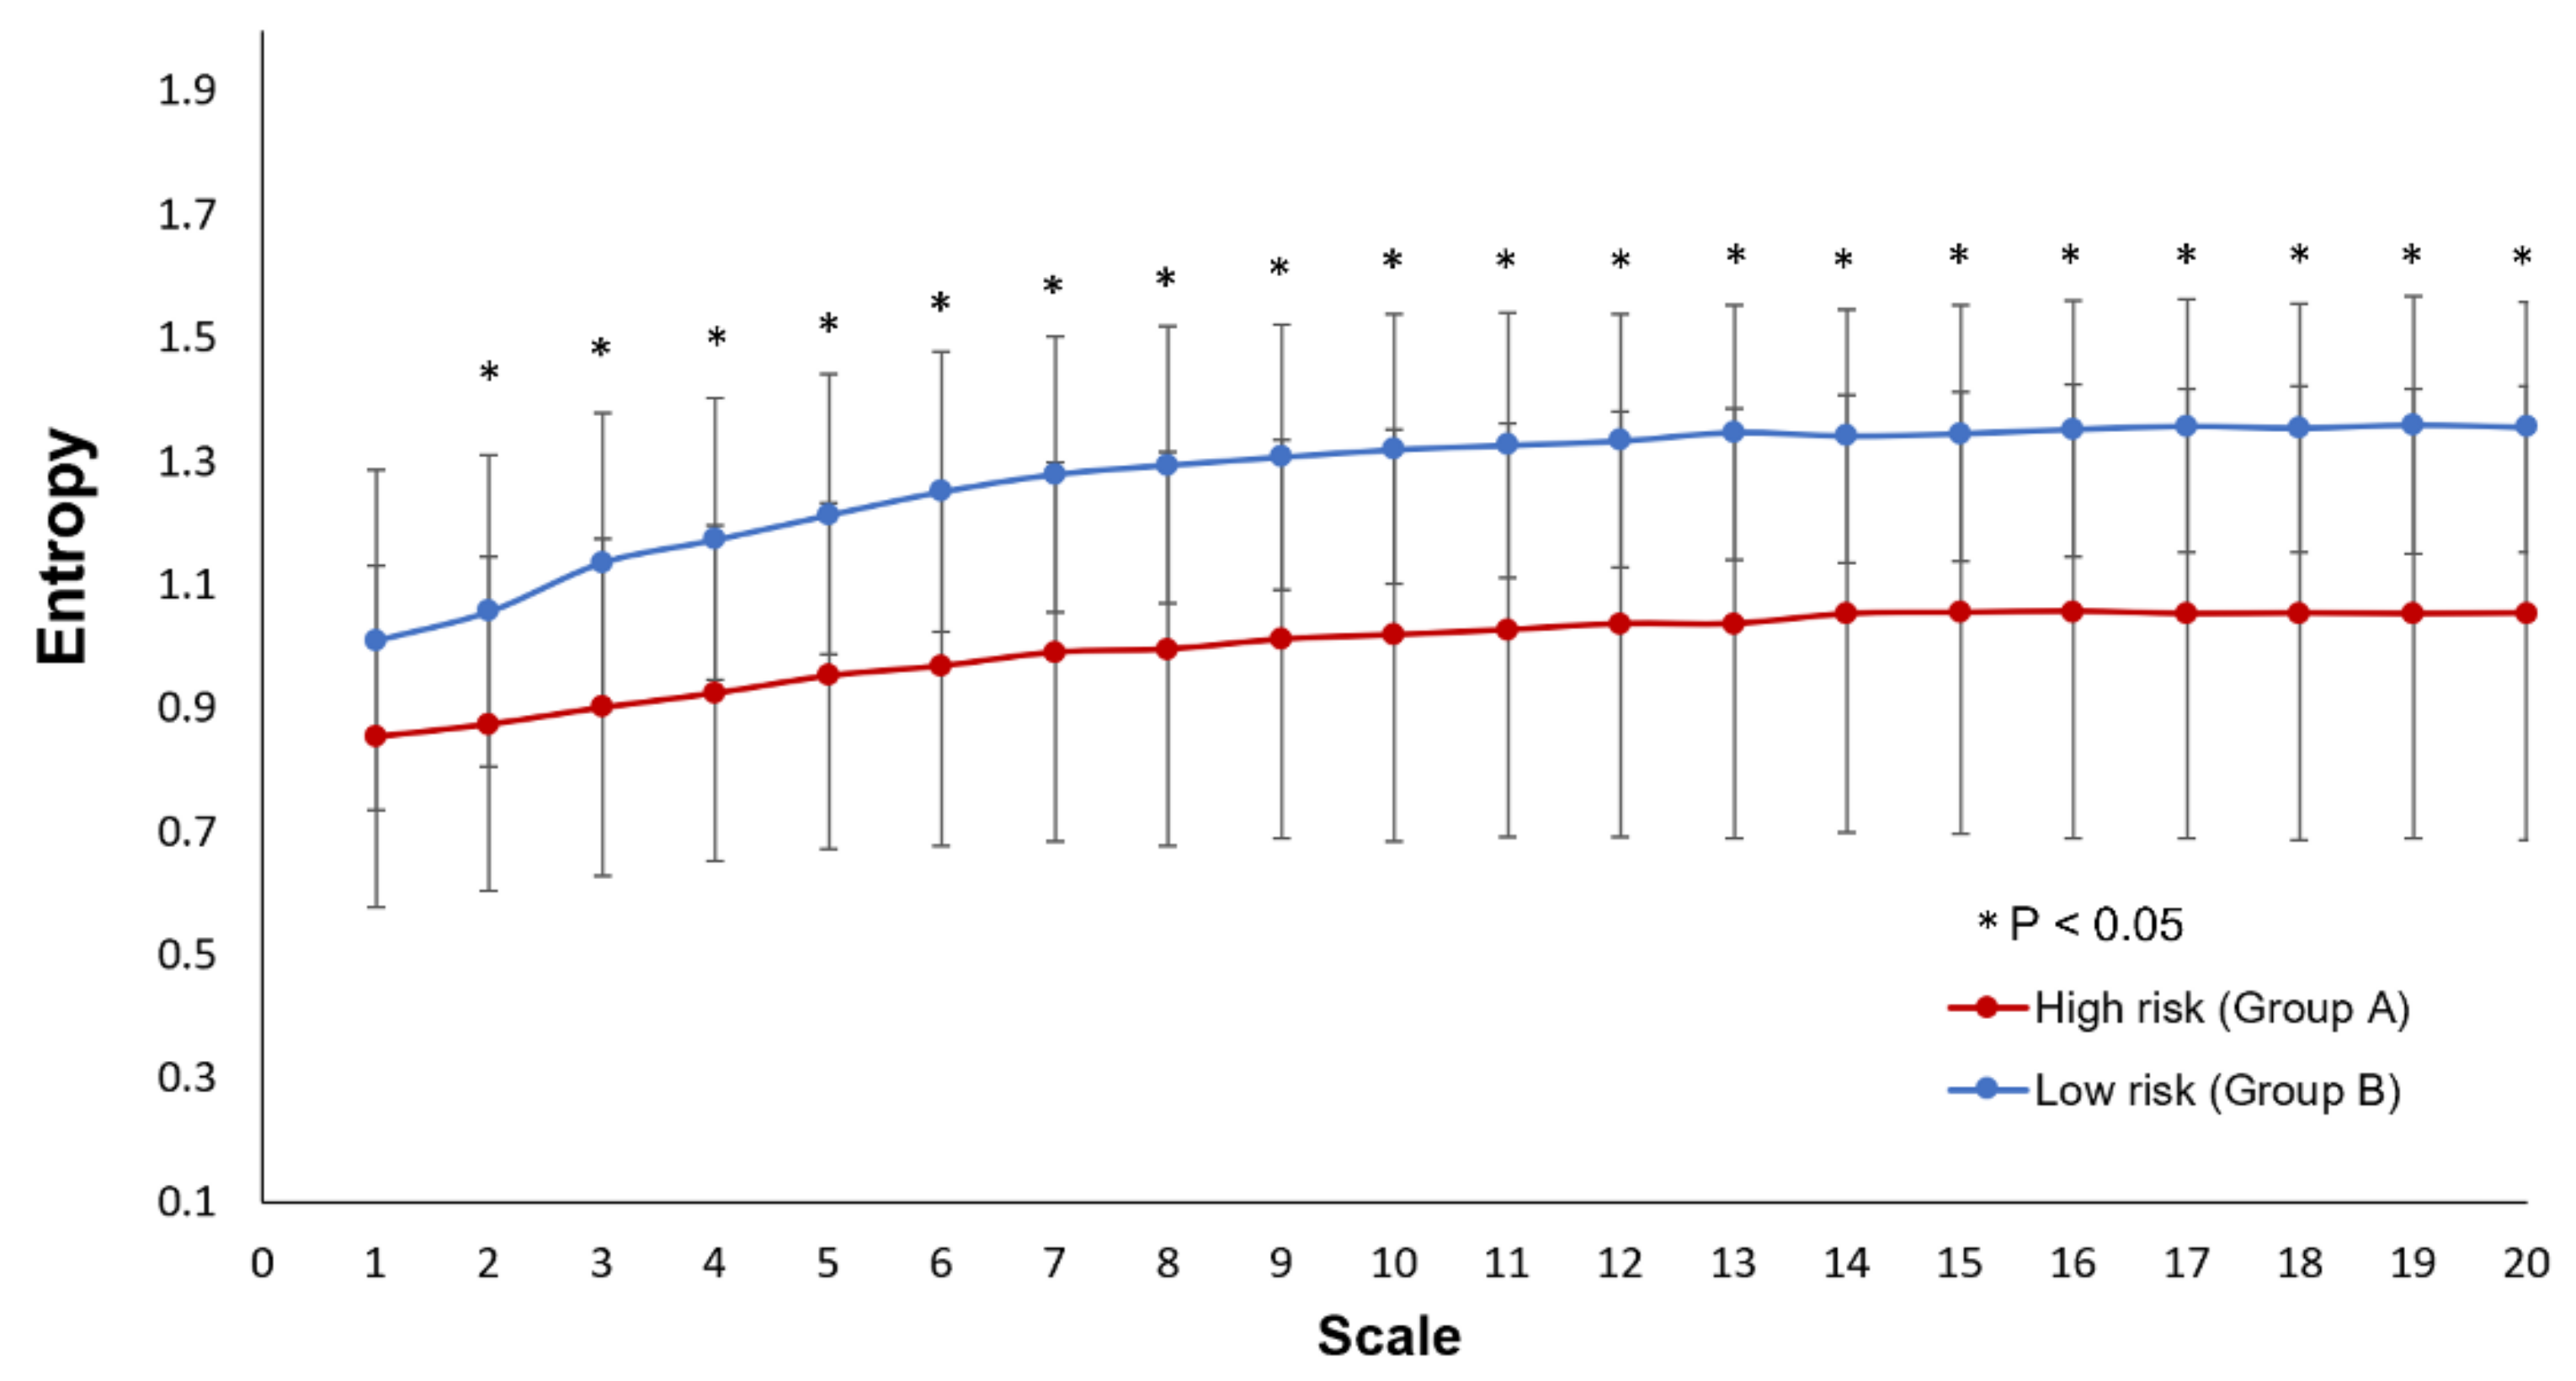
| Slope 1–5 | −0.008 (−0.075~0.039) | 0.04 (−0.03~0.07) | 0.038 |
| Scale 5 | 1.01 (0.73~1.14) | 1.22 (1.06~1.36) | 0.002 |
| Area 1–5 | 3.30 (2.94~4.44) | 4.18 (3.26~4.89) | 0.135 |
| Area 6–20 | 15.94 (12.48~18.40) | 18.89 (15.16~20.91) | 0.004 |
| Univariable Logistic Regression | Multivariable Logistic Regression | |||
|---|---|---|---|---|
| OR (95% CI) | p Value | OR (95% CI) | p Value | |
| Age (Year) | 0.984 (0.935~1.035) | 0.525 | ||
| Sex (man) | 1.500 (0.486~4.631) | 0.481 | ||
| BMI (kg·m−2) | 0.884 (0.768~1.017) | 0.086 | ||
| PAH group 1 | 5.037 (1.242~20.43) | 0.024 | ||
| Creatinine (mg/dL) | 8.301 (1.358~50.75) | 0.022 | ||
| NT-ProBNP (ng/dl) | 1.001 (1.000~1.002) | 0.019 | 1.001 (1.000~1.002) | 0.009 |
| 6MWD (m) | 0.995 (0.990~1.001) | 0.080 | ||
| mPAP (mmHg) | 1.046 (1.005~1.089) | 0.029 | ||
| CI (L·min−1·m2) | 0.525 (0.258~1.067) | 0.075 | ||
| PVR (Wood Units) | 1.232 (1.070~1.418) | 0.004 | ||
| Mean RR (ms) | 0.997 (0.992~1.002) | 0.198 | ||
| SDRR (ms) | 0.992 (0.973~1.010) | 0.373 | ||
| pNN20 (%) | 0.993 (0.961~1.025) | 0.647 | ||
| pNN50 (%) | 1.016 (0.971~1.063) | 0.503 | ||
| VLF (ms−2) | 0.998 (0.996~1.000) | 0.081 | ||
| LF (ms−2) | 0.999 (0.997~1.002) | 0.543 | ||
| HF (ms−2) | 1.000 (0.999~1.001) | 0.858 | ||
| LF/HF ratio | 0.622 (0.391~0.990) | 0.045 | ||
| DFAα1 | 0.072 (0.008~0.626) | 0.017 | ||
| DFAα2 | 0.457 (0.006~33.761) | 0.721 | ||
| Slope 1–5 | 0.000 (0.000~0.560) | 0.036 | ||
| Scale 5 | 0.012 (0.001~0.222) | 0.003 | 0.009 (<0.001~0.324) | 0.010 |
| Area 1–5 | 0.705 (0.418~1.189) | 0.190 | ||
| Area 6–20 | 0.835 (0.714~0.977) | 0.024 | ||
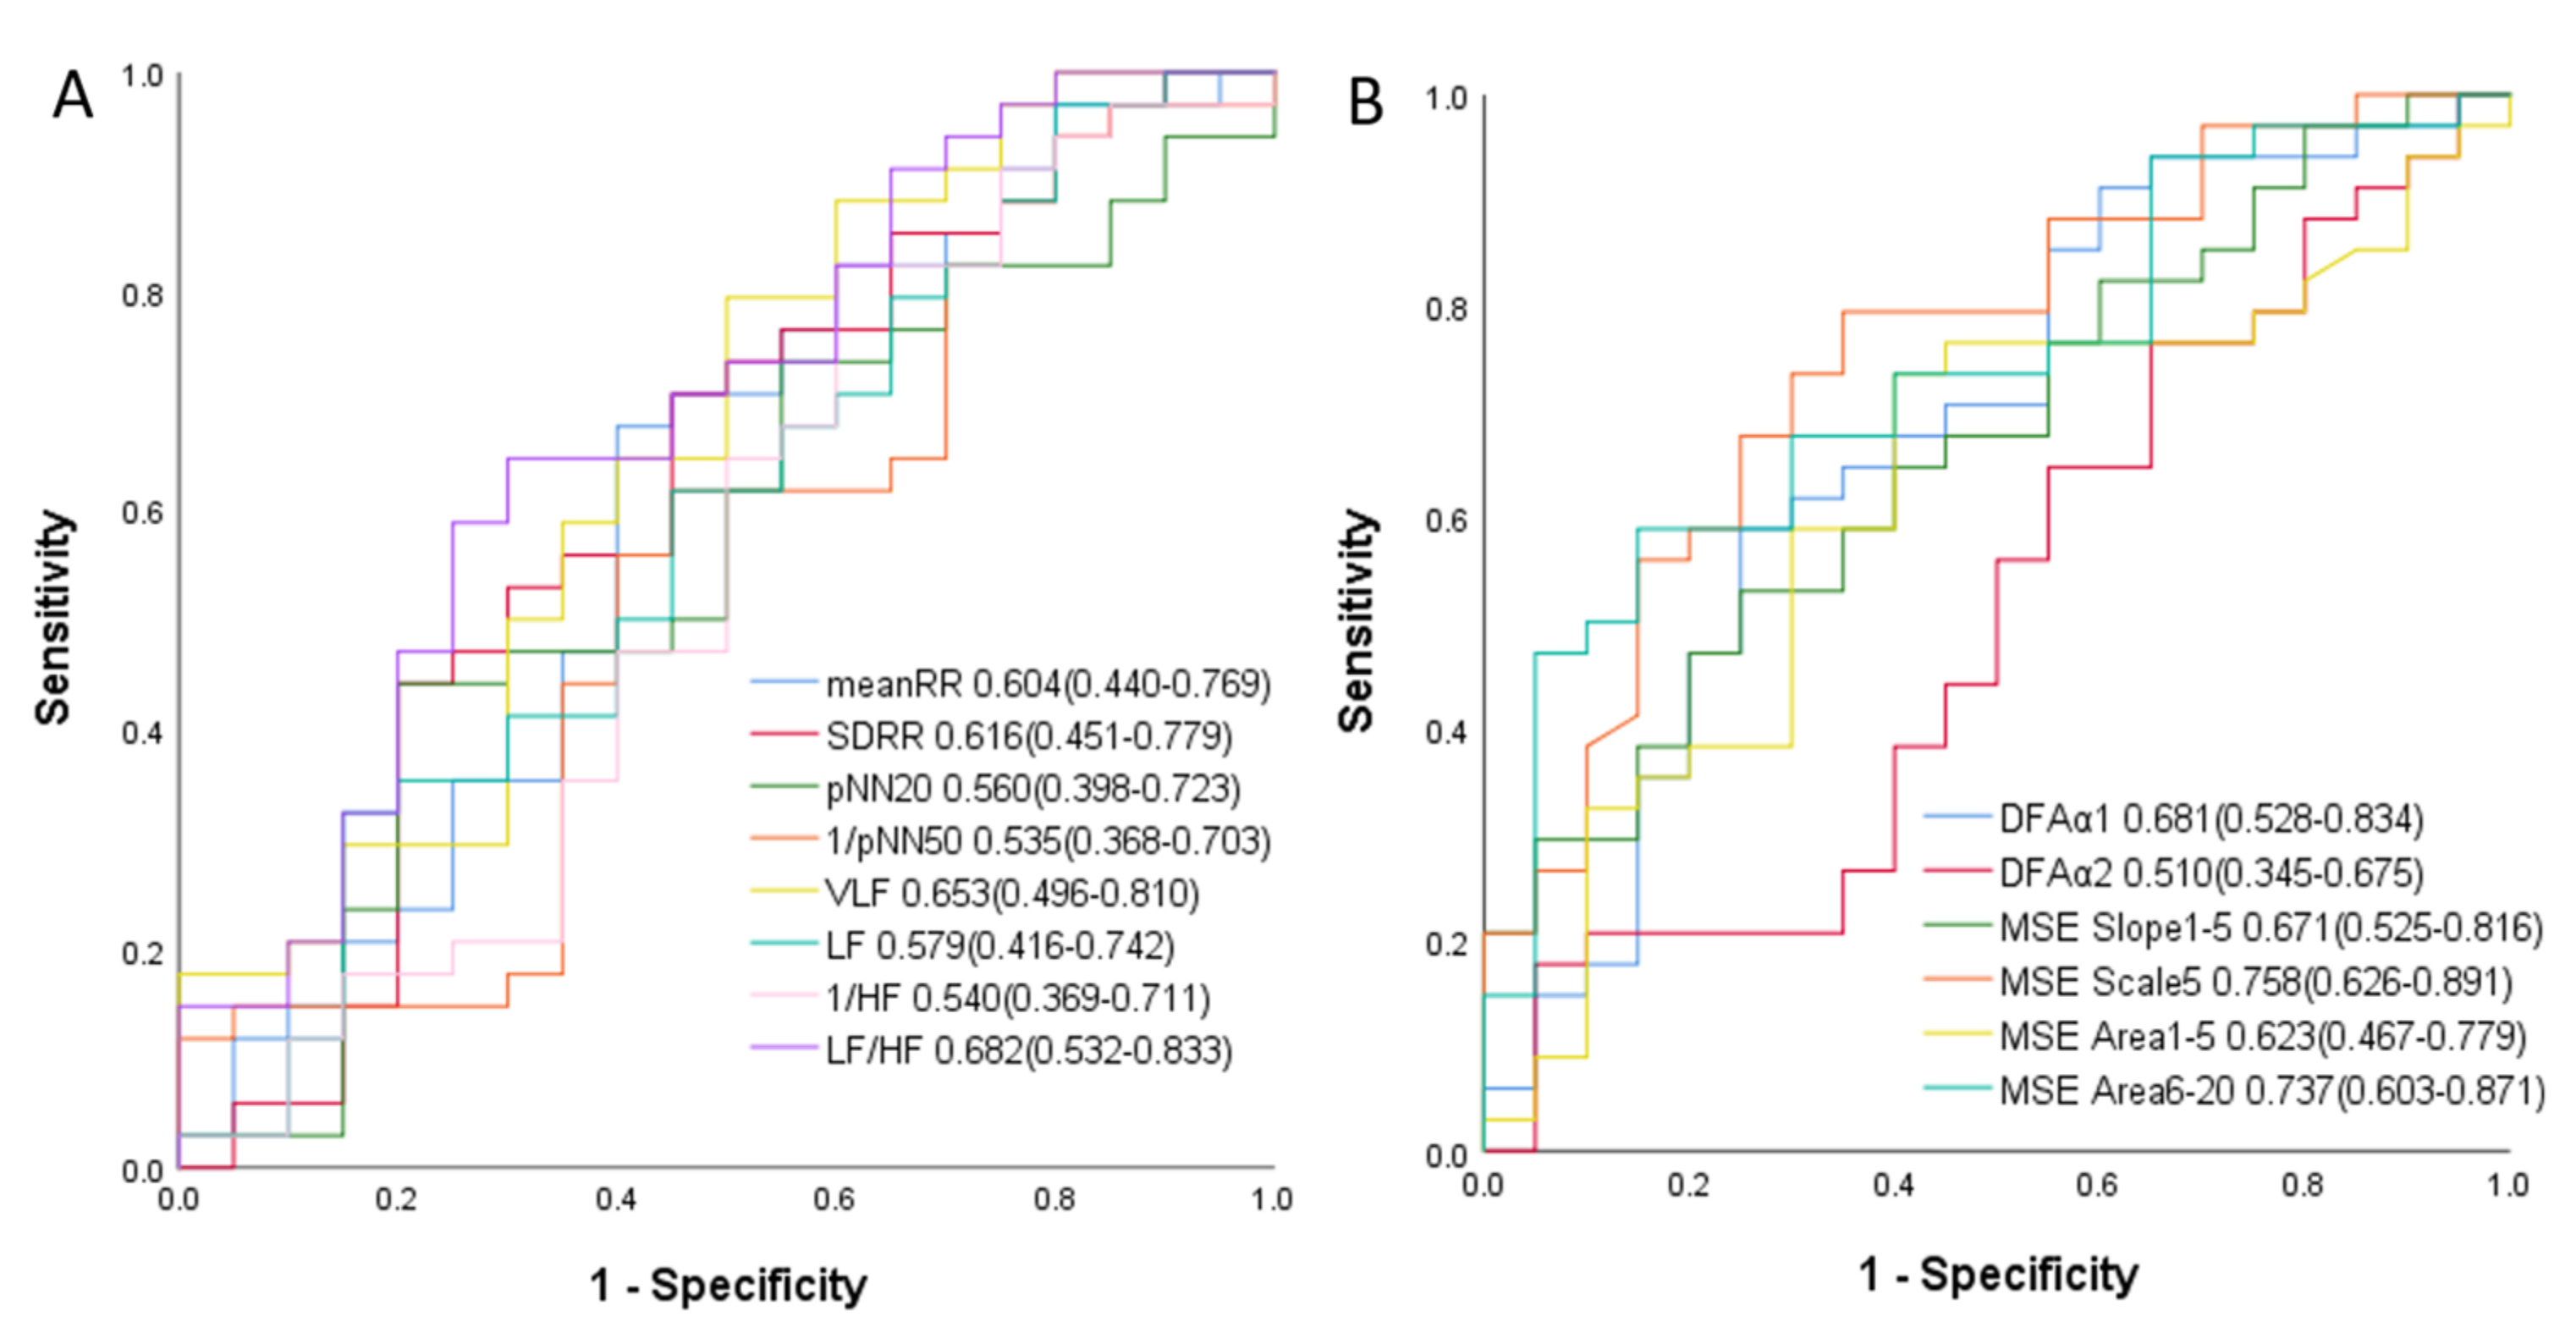
| Parameters | AUC | R Square | NRI | NRI p Value | IDI | IDI p Value |
|---|---|---|---|---|---|---|
| Mean RR | 0.604 | 0.032 | ||||
| +Scale5 | 0.775 | 0.051 | 0.694 | 0.008 | 0.194 | 0.001 |
| +Area 6–20 | 0.749 | 0.12 | 0.535 | 0.048 | 0.092 | 0.026 |
| +DFAα1 | 0.701 | 0.126 | 0.494 | 0.071 | 0.095 | 0.028 |
| SDRR | 0.615 | 0.015 | ||||
| +Scale5 | 0.781 | 0.12 | 0.771 | 0.003 | 0.211 | 0.001 |
| +Area 6–20 | 0.731 | 0.121 | 0.494 | 0.071 | 0.107 | 0.014 |
| +DFAα1 | 0.681 | 0.123 | 0.535 | 0.048 | 0.108 | 0.017 |
| VLF | 0.653 | 0.061 | ||||
| +Scale5 | 0.782 | 0.117 | 0.535 | 0.048 | 0.171 | 0.002 |
| +Area 6–20 | 0.725 | 0.147 | 0.653 | 0.014 | 0.082 | 0.035 |
| +DFAα1 | 0.699 | 0.145 | 0.694 | 0.008 | 0.084 | 0.037 |
| LF | 0.579 | 0.008 | ||||
| +Scale5 | 0.768 | 0.086 | 0.771 | 0.003 | 0.209 | 0.001 |
| +Area 6–20 | 0.731 | 0.118 | 0.494 | 0.071 | 0.112 | 0.012 |
| +DFAα1 | 0.694 | 0.134 | 0.553 | 0.042 | 0.129 | 0.01 |
| HF | 0.54 | 0.001 | ||||
| +Scale5 | 0.76 | 0.029 | 0.871 | 0.001 | 0.221 | <0.001 |
| +Area 6–20 | 0.734 | 0.116 | 0.553 | 0.042 | 0.118 | 0.01 |
| +DFAα1 | 0.694 | 0.129 | 0.612 | 0.023 | 0.132 | 0.009 |
| LF/HF ratio | 0.682 | 0.075 | ||||
| +Scale5 | 0.806 | 0.077 | 0.771 | 0.003 | 0.184 | 0.001 |
| +Area 6–20 | 0.76 | 0.156 | 0.394 | 0.154 | 0.068 | 0.039 |
| +DFAα1 | 0.718 | 0.114 | 0.335 | 0.228 | 0.027 | 0.19 |
Publisher’s Note: MDPI stays neutral with regard to jurisdictional claims in published maps and institutional affiliations. |
© 2021 by the authors. Licensee MDPI, Basel, Switzerland. This article is an open access article distributed under the terms and conditions of the Creative Commons Attribution (CC BY) license (https://creativecommons.org/licenses/by/4.0/).
Share and Cite
Tang, S.-Y.; Ma, H.-P.; Hung, C.-S.; Kuo, P.-H.; Lin, C.; Lo, M.-T.; Hsu, H.-H.; Chiu, Y.-W.; Wu, C.-K.; Tsai, C.-H.; et al. The Value of Heart Rhythm Complexity in Identifying High-Risk Pulmonary Hypertension Patients. Entropy 2021, 23, 753. https://doi.org/10.3390/e23060753
Tang S-Y, Ma H-P, Hung C-S, Kuo P-H, Lin C, Lo M-T, Hsu H-H, Chiu Y-W, Wu C-K, Tsai C-H, et al. The Value of Heart Rhythm Complexity in Identifying High-Risk Pulmonary Hypertension Patients. Entropy. 2021; 23(6):753. https://doi.org/10.3390/e23060753
Chicago/Turabian StyleTang, Shu-Yu, Hsi-Pin Ma, Chi-Sheng Hung, Ping-Hung Kuo, Chen Lin, Men-Tzung Lo, Hsao-Hsun Hsu, Yu-Wei Chiu, Cho-Kai Wu, Cheng-Hsuan Tsai, and et al. 2021. "The Value of Heart Rhythm Complexity in Identifying High-Risk Pulmonary Hypertension Patients" Entropy 23, no. 6: 753. https://doi.org/10.3390/e23060753