
Effects of Muscle Fatigue and Recovery on Complexity of Surface Electromyography of Biceps Brachii

 ,
, 
Abstract
:1. Introduction
2. Methods
2.1. Participants
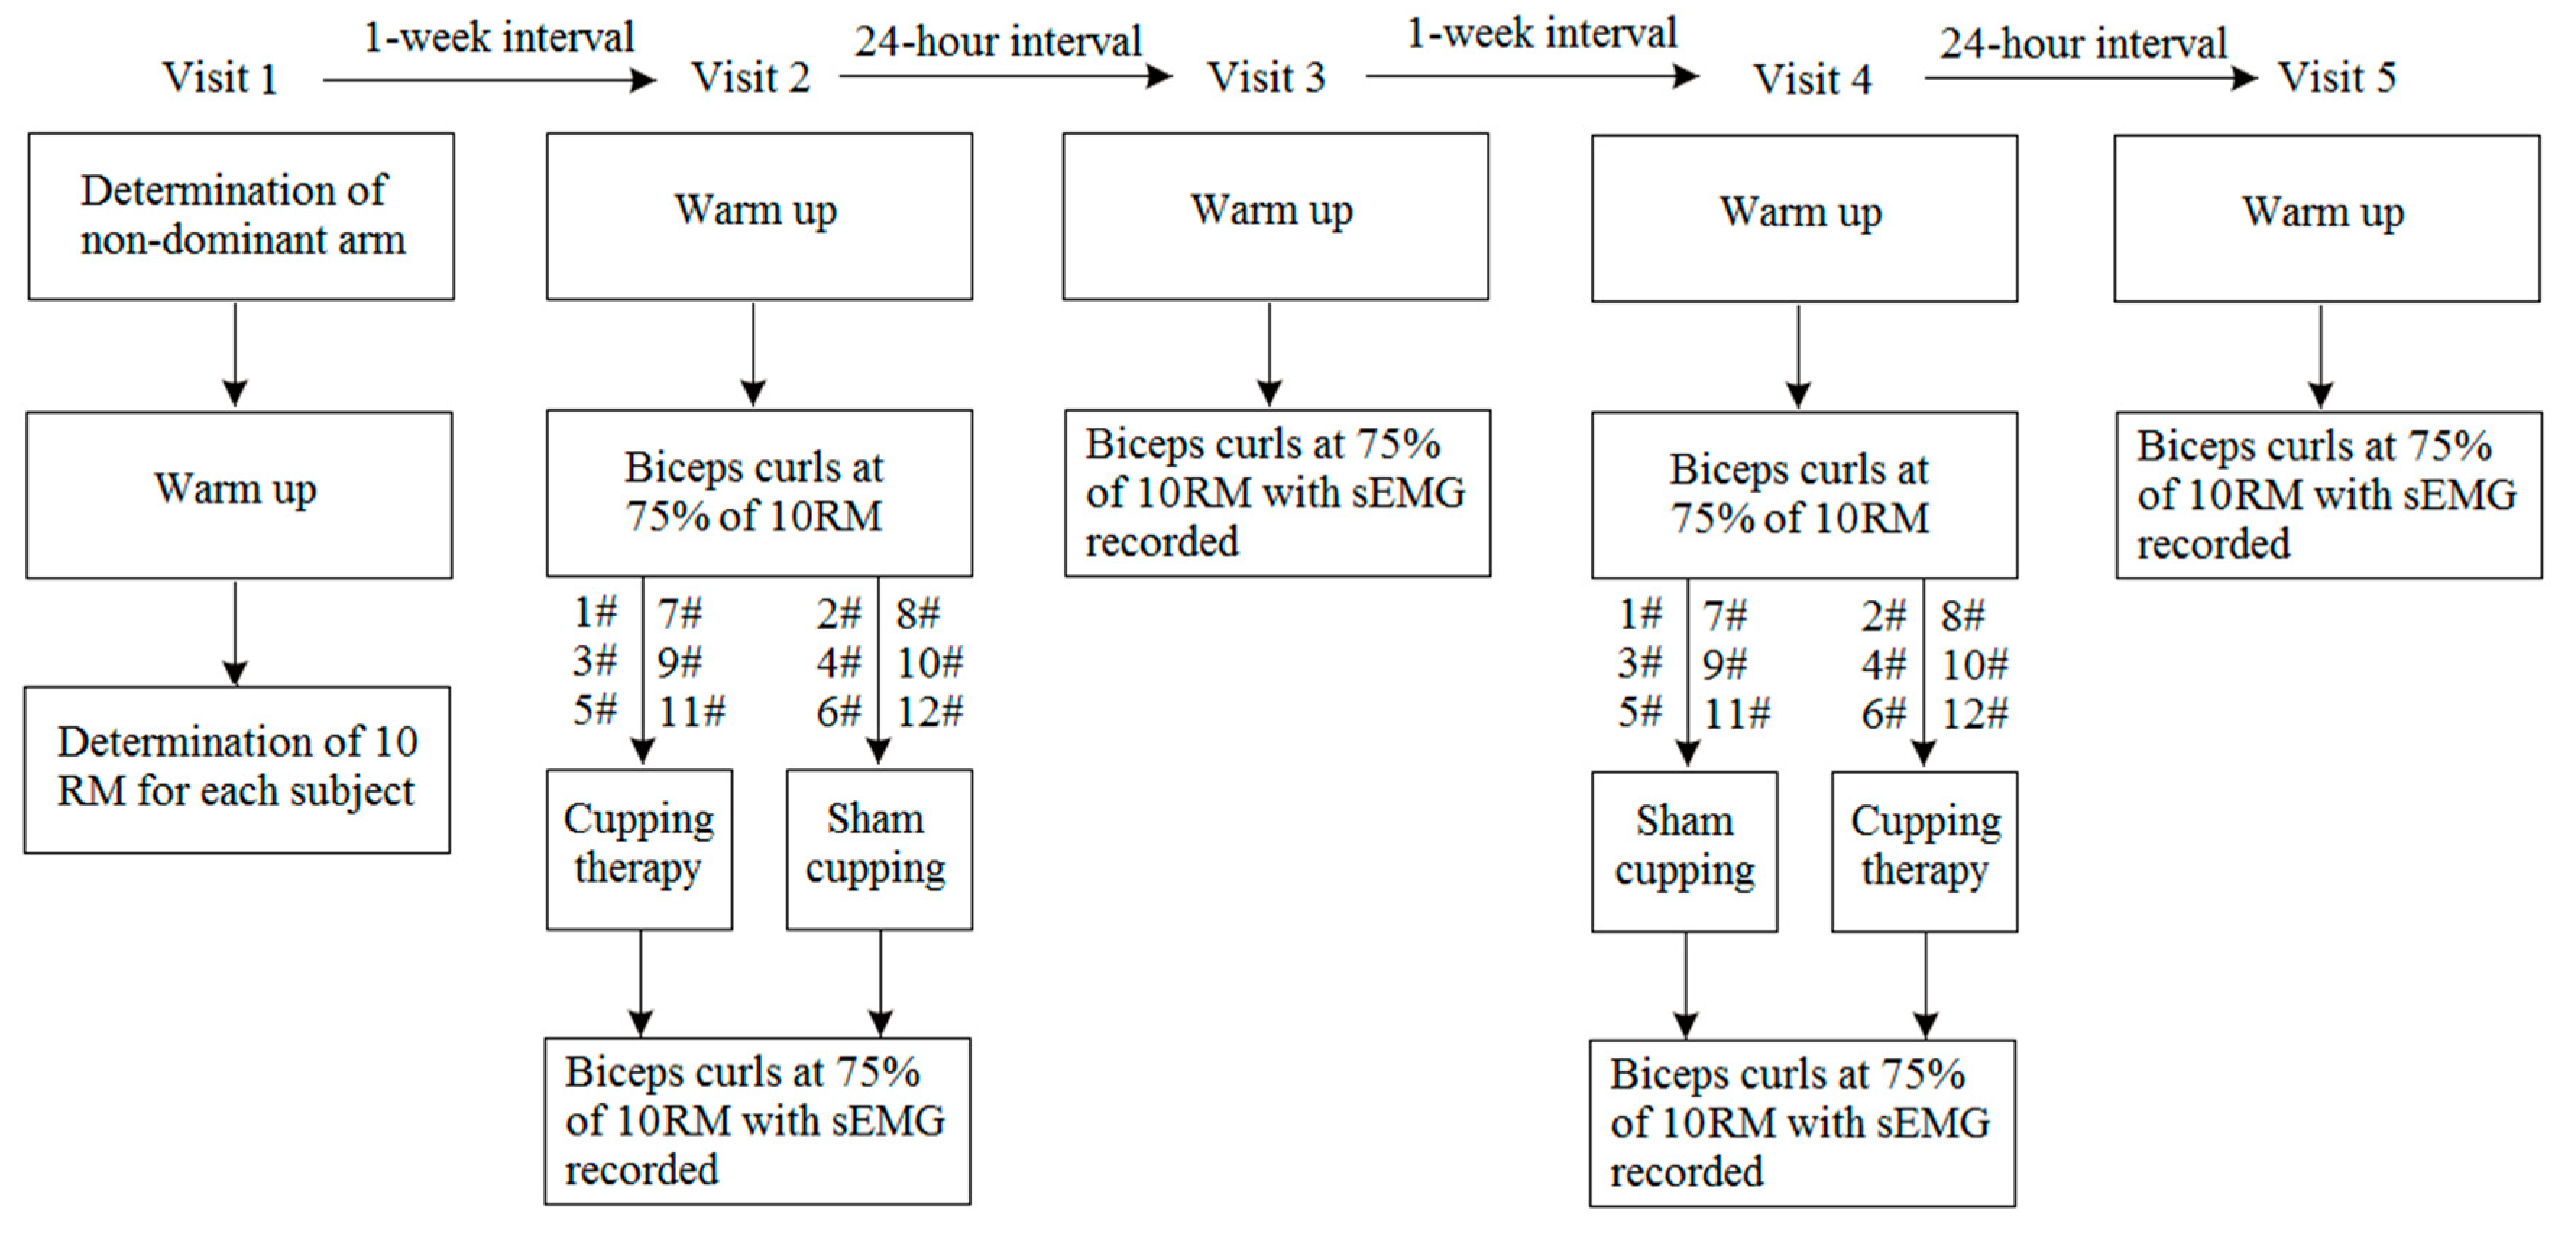
2.2. Study Design
2.3. Experimental Procedure
2.4. Data Analysis
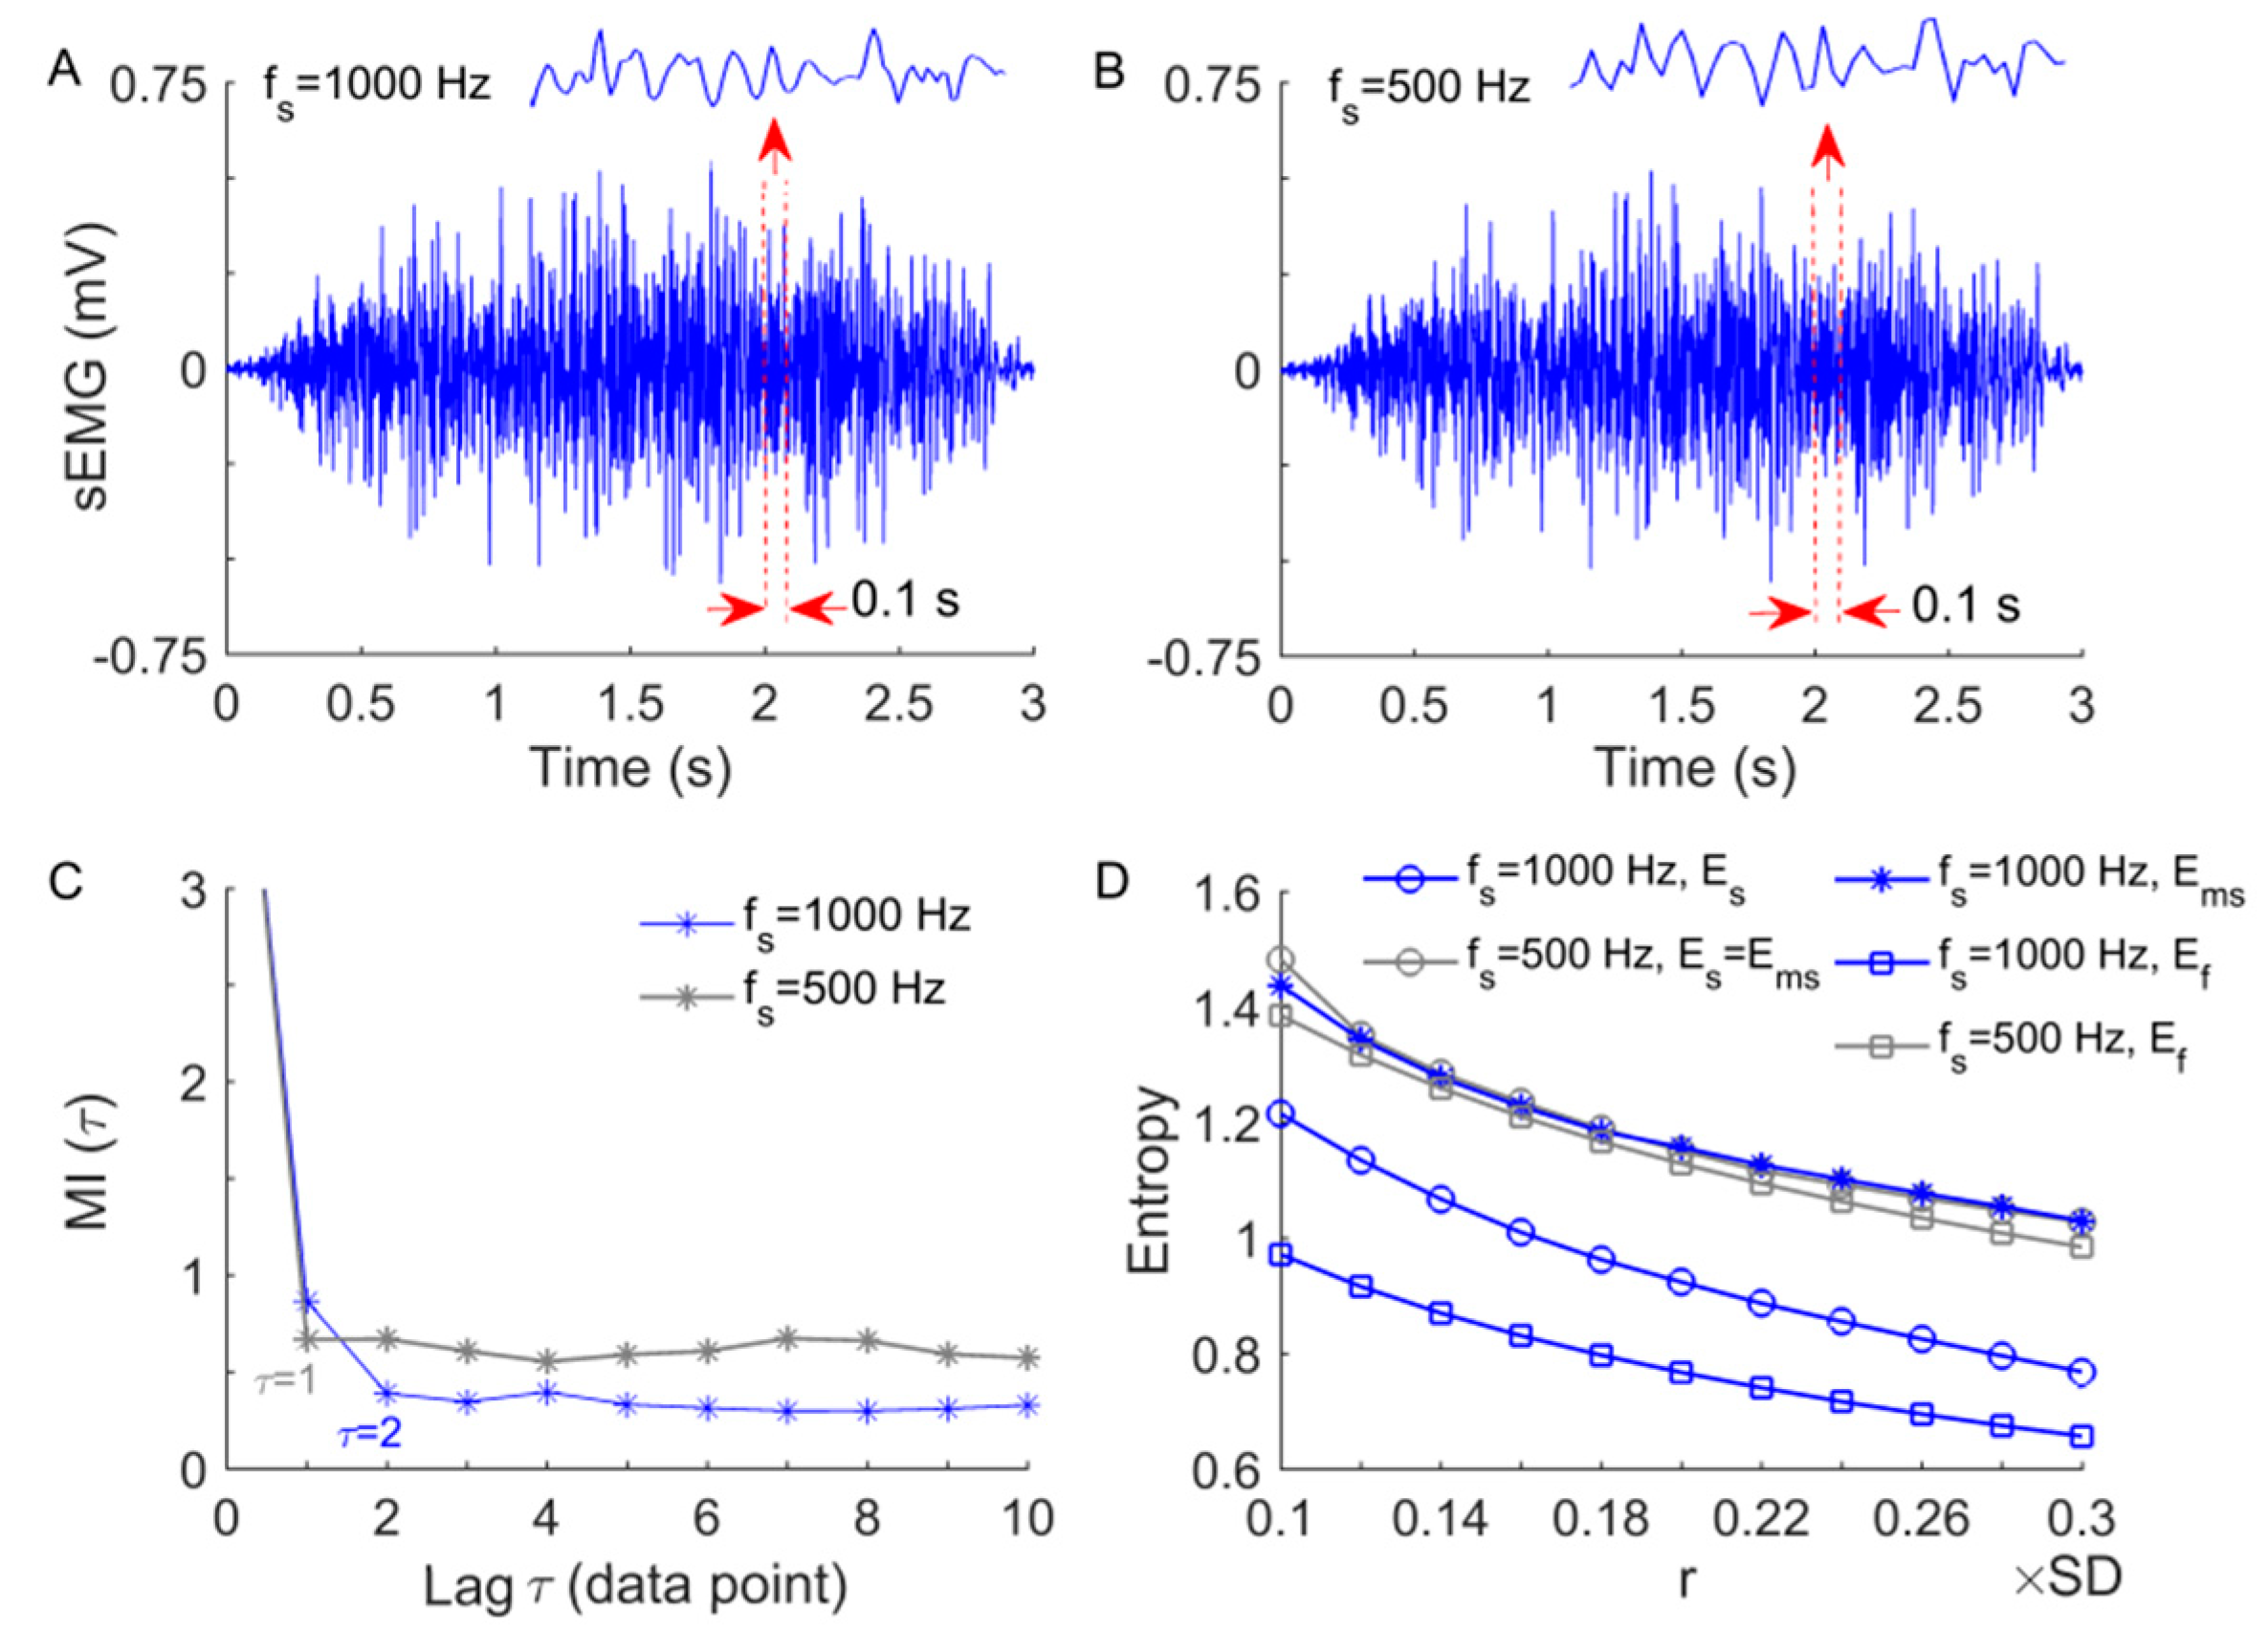
2.4.1. Modified Sample Entropy
2.4.2. Application of to sEMG Data
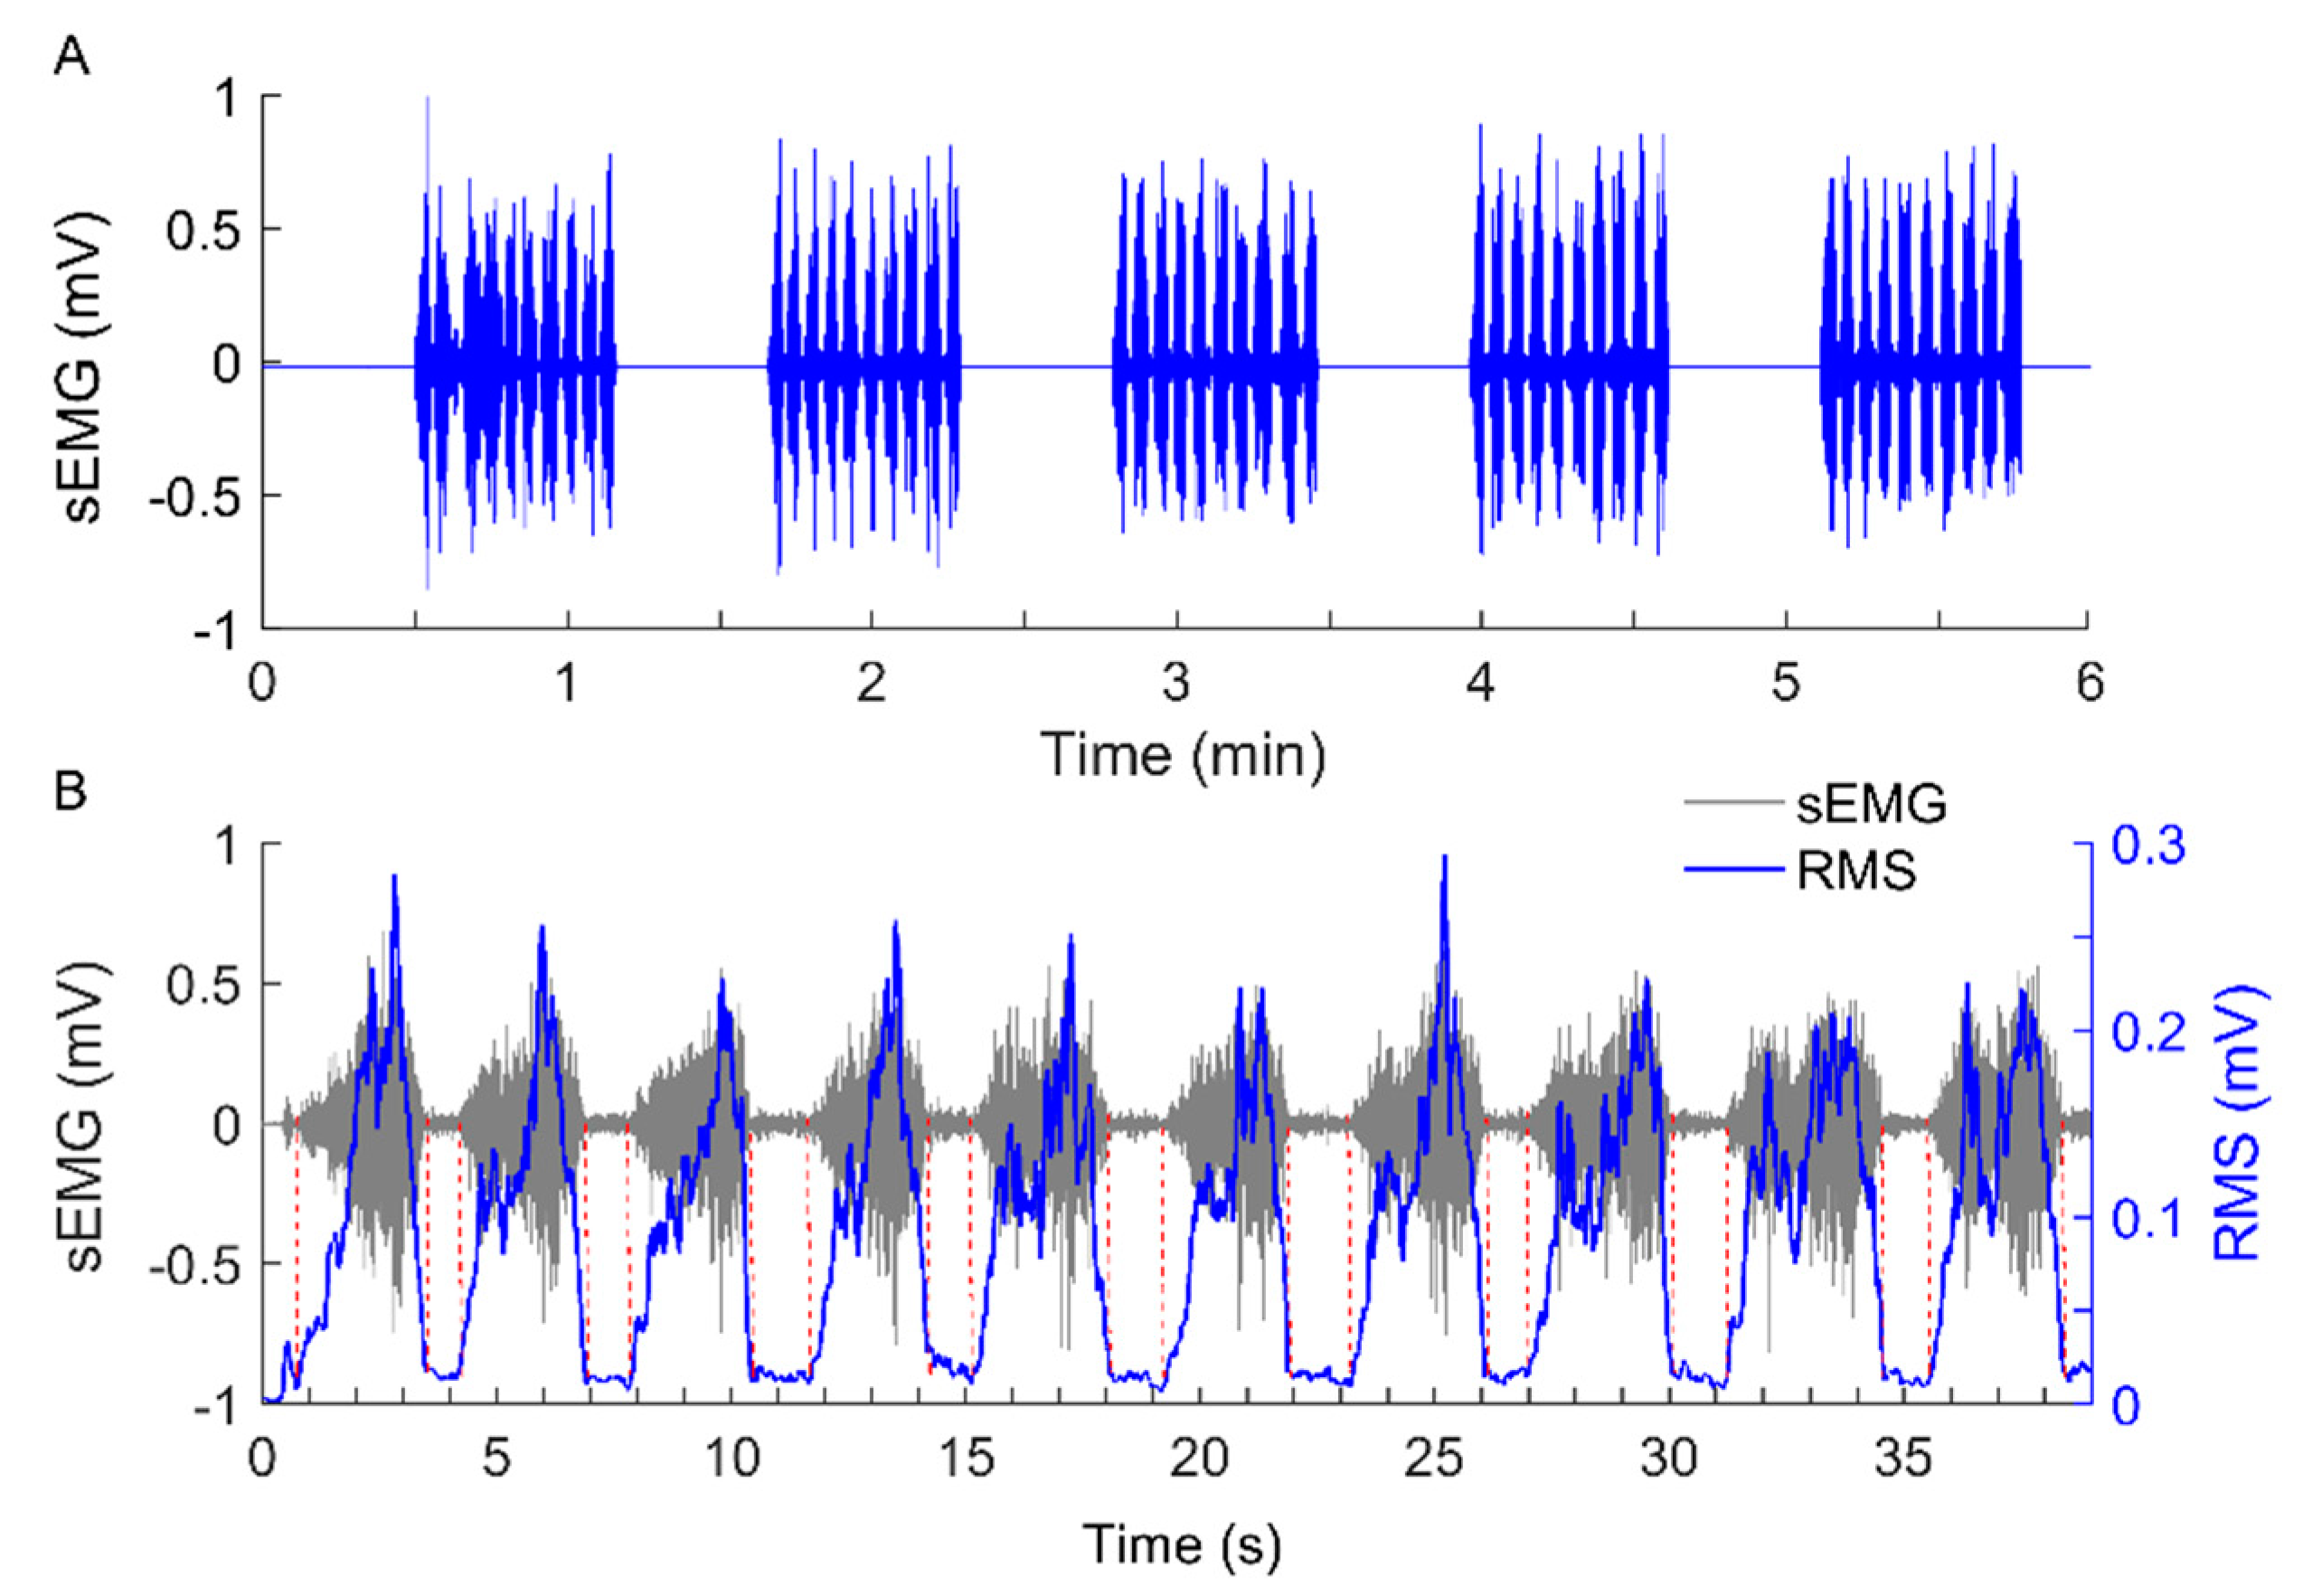
2.4.3. Linear Analysis of sEMG Data
2.4.4. Statistical Analysis
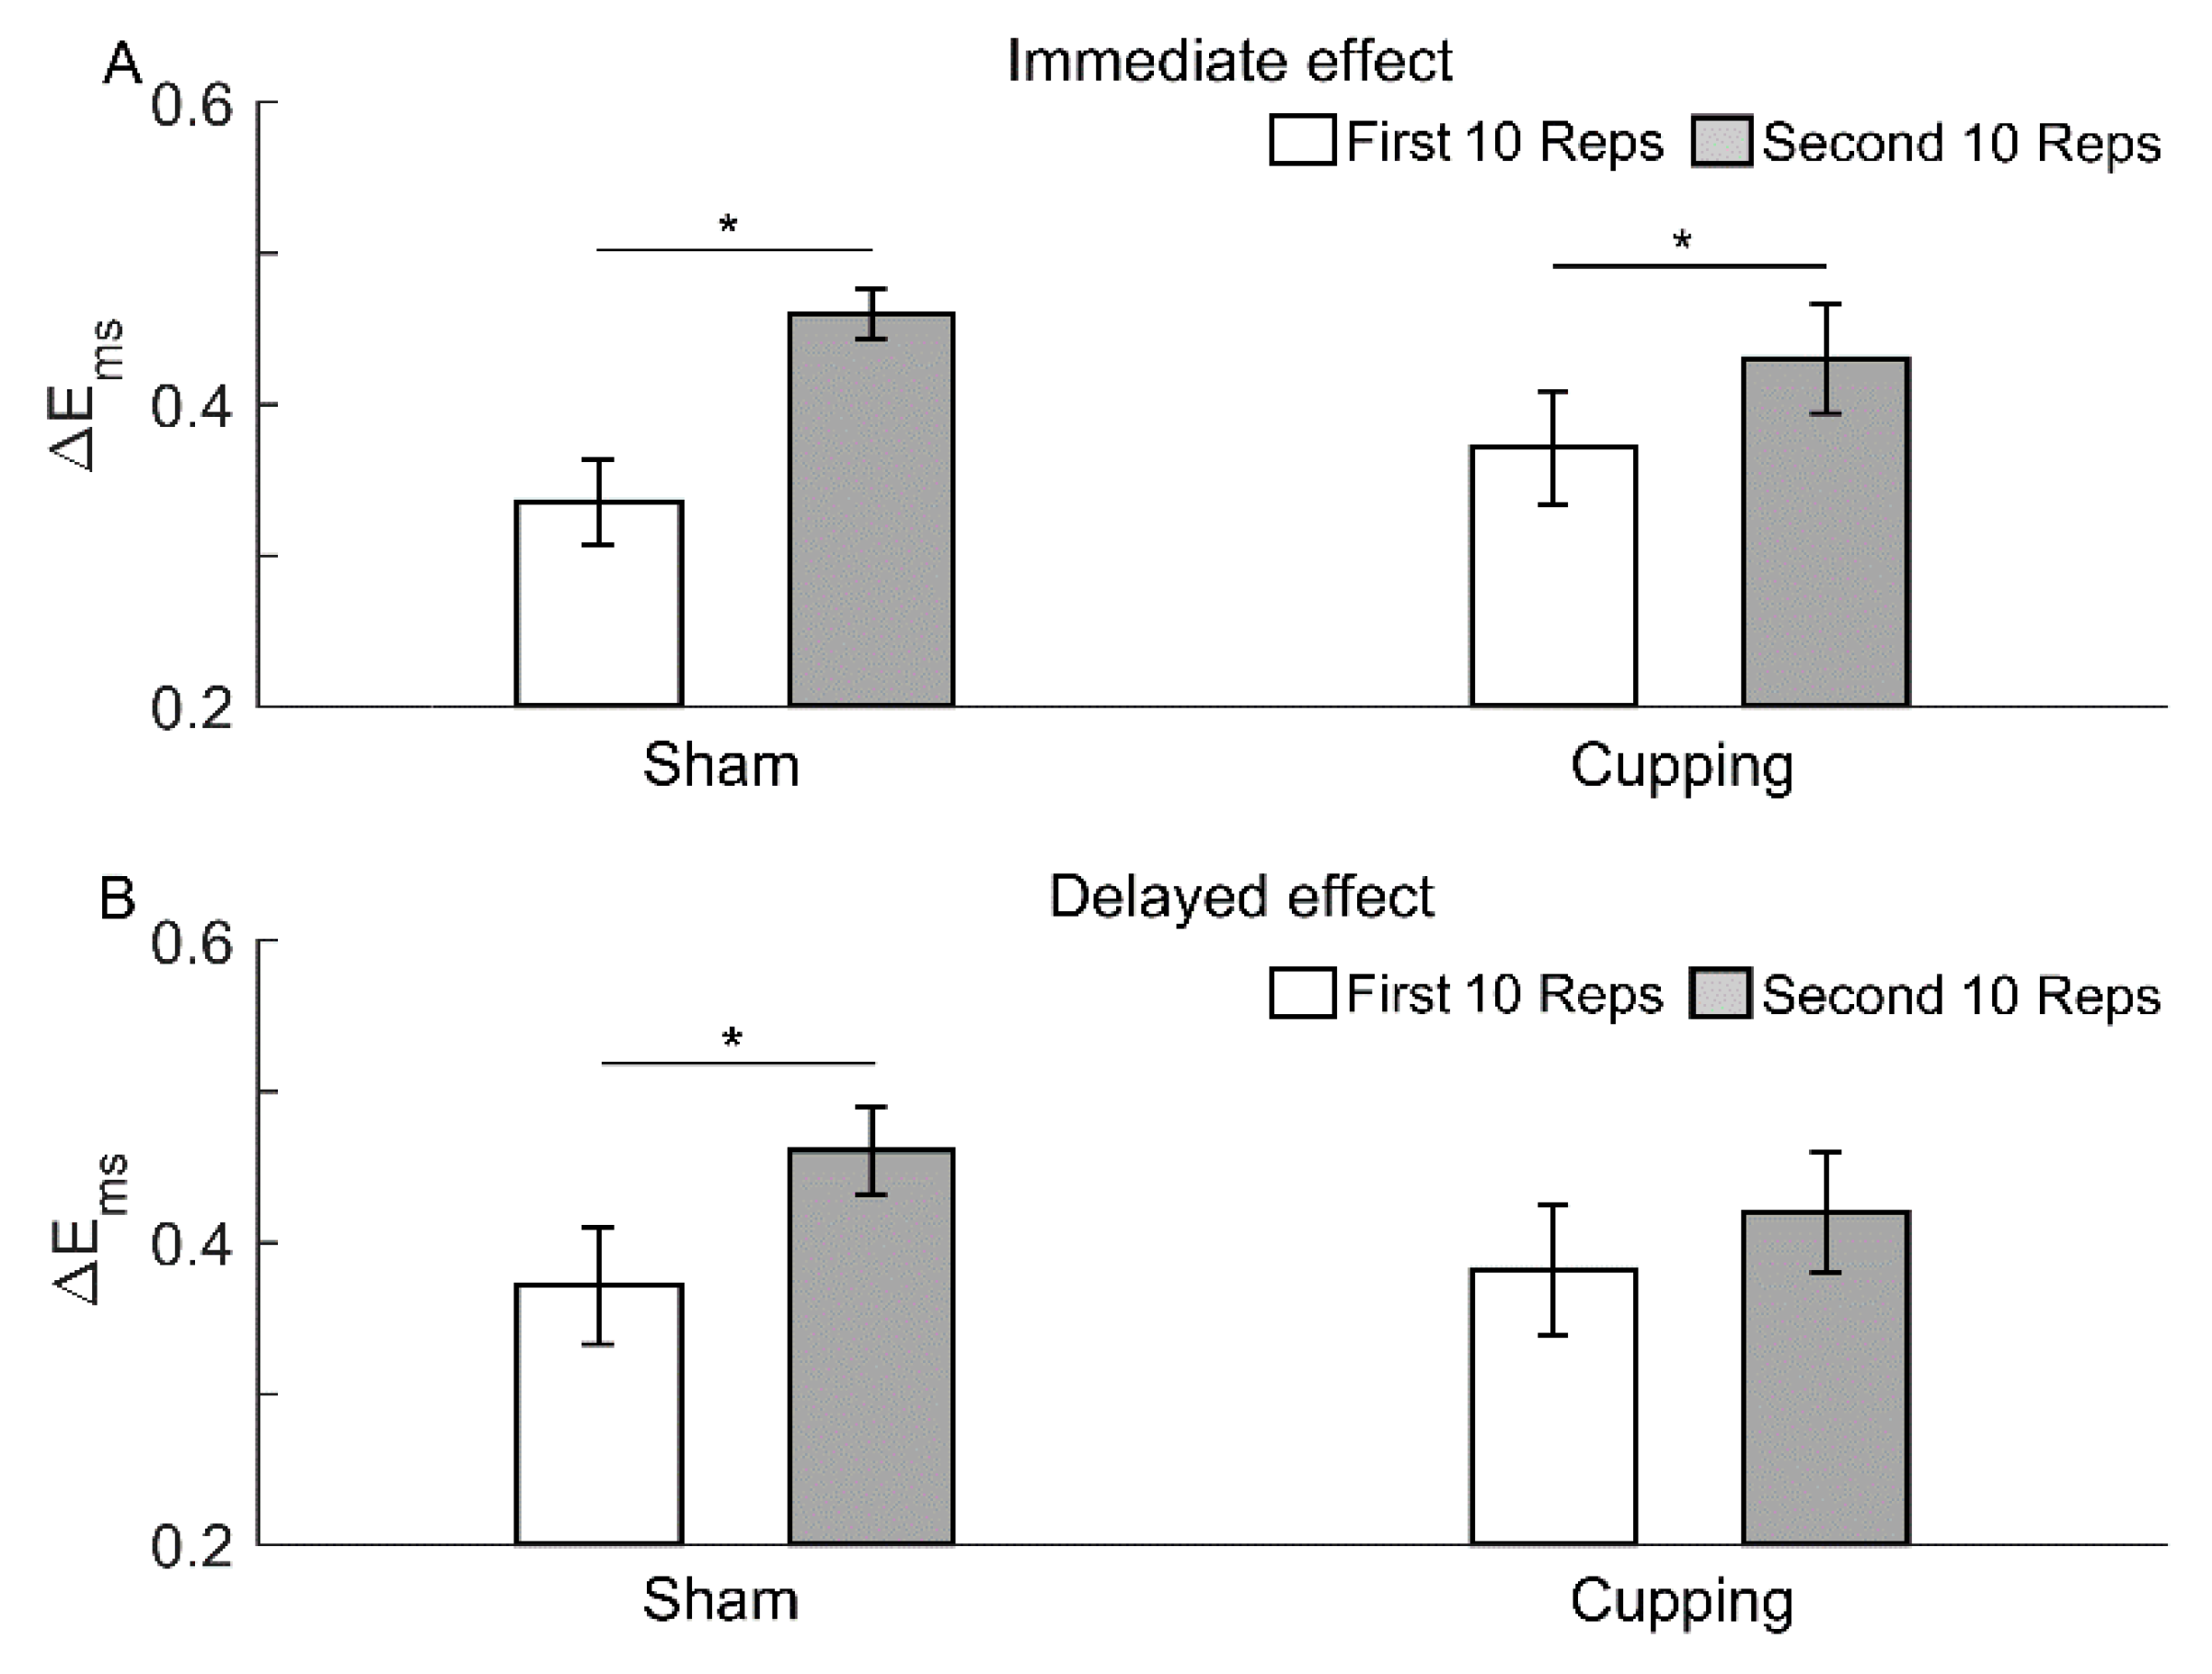
3. Results
4. Discussion
5. Conclusions
Author Contributions
Funding
Institutional Review Board Statement
Informed Consent Statement
Data Availability Statement
Conflicts of Interest
References
- Vollestad, N.K. Measurement of human muscle fatigue. J. Neurosci. Methods 1997, 74, 219–227. [Google Scholar] [CrossRef]
- Gandevia, S.C. Spinal and Supraspinal Factors in Human Muscle Fatigue. Physiol. Rev. 2001, 81, 1725. [Google Scholar] [CrossRef] [PubMed]
- Boyas, S.; Guével, A. Neuromuscular fatigue in healthy muscle: Underlying factors and adaptation mechanisms. Ann. Phys. Rehabil. Med. 2011, 54, 88–108. [Google Scholar] [CrossRef] [Green Version]
- Dupuy, O.; Douzi, W.; Theurot, D.; Bosquet, L.; Dugue, B. An Evidence-Based Approach for Choosing Post-exercise Recovery Techniques to Reduce Markers of Muscle Damage, Soreness, Fatigue, and Inflammation: A Systematic Review With Meta-Analysis. Front. Physiol 2018, 9, 403. [Google Scholar] [CrossRef] [PubMed]
- González-Izal, M.; Malanda, A.; Gorostiaga, E.; Izquierdo, M. Electromyographic models to assess muscle fatigue. J. Electromyogr. Kinesiol. Off. J. Int. Soc. Electrophysiol. Kinesiol. 2012, 22, 501–512. [Google Scholar] [CrossRef]
- Merletti, R.; Roy, S. Myoelectric and mechanical manifestations of muscle fatigue in voluntary contractions. J. Orthop. Sports Phys. Ther. 1996, 24, 342–353. [Google Scholar] [CrossRef] [PubMed] [Green Version]
- Mclean, L.; Goudy, N. Neuromuscular response to sustained low-level muscle activation: Within-and between-synergist substitution in the triceps surae muscles. Eur. J. Appl. Physiol. 2004, 91, 204. [Google Scholar] [CrossRef] [PubMed]
- Kahl, L.; Hofmann, U.G. Comparison of algorithms to quantify muscle fatigue in upper limb muscles based on sEMG signals. Med Eng. Phys. 2016, 38, 1260–1269. [Google Scholar] [CrossRef]
- Rampichini, S.; Vieira, T.M.; Castiglioni, P.; Merati, G. Complexity Analysis of Surface Electromyography for Assessing the Myoelectric Manifestation of Muscle Fatigue: A Review. Entropy 2020, 22, 529. [Google Scholar] [CrossRef] [PubMed]
- Dimitrov, G.V.; Arabadzhiev, T.I.; Mileva, K.N.; Bowtell, J.L.; Crichton, N.; Dimitrova, N.A. Muscle fatigue during dynamic contractions assessed by new spectral indices. Med. Sci. Sports Exerc. 2006, 38, 1971–1979. [Google Scholar] [CrossRef] [PubMed]
- Nieminen, H.; Takala, E.P. Evidence of deterministic chaos in the myoelectric signal. Electromyogr. Clin. Neurophysiol. 1996, 36, 49–58. [Google Scholar]
- Chakraborty, M.; Parbat, D. Fractals, chaos and entropy analysis to obtain parametric features of surface electromyography signals during dynamic contraction of biceps muscles under varying load. In Proceedings of the International Conference for Convergence in Technology, Pune, India, 8–9 April 2017; pp. 222–229. [Google Scholar]
- Anmuth, C.J.; Goldberg, G.; Mayer, N.H. Fractal dimension of electromyographic signals recorded with surface electrodes during isometric contractions is linearly correlated with muscle activation. Muscle Nerve 1994, 17, 953–954. [Google Scholar] [CrossRef] [PubMed]
- Xie, H.B.; Guo, J.Y.; Zheng, Y.P. Fuzzy Approximate Entropy Analysis of Chaotic and Natural Complex Systems: Detecting Muscle Fatigue Using Electromyography Signals. Ann. Biomed. Eng. 2010, 38, 1483–1496. [Google Scholar] [CrossRef] [PubMed]
- Zhu, X.; Zhang, X.; Tang, X.; Gao, X.; Chen, X. Re-Evaluating Electromyogram–Force Relation in Healthy Biceps Brachii Muscles Using Complexity Measures. Entropy 2017, 19, 624. [Google Scholar] [CrossRef] [Green Version]
- Pethick, J.; Winter, S.L.; Burnley, M. Fatigue reduces the complexity of knee extensor torque during fatiguing sustained isometric contractions. Eur. J. Sport Sci. 2019, 19, 1349–1358. [Google Scholar] [CrossRef]
- Hernandez, L.R.; Camic, C.L. Fatigue-Mediated Loss of Complexity is Contraction-Type Dependent in Vastus Lateralis Electromyographic Signals. Sports 2019, 7, 78. [Google Scholar] [CrossRef] [Green Version]
- Richman, J.S.; Moorman, R.J. Physiological time-series analysis using approximate entropy and sample entropy. Am. J. Physiol. Heart Circ. Physiol. 2000, 278, H2039–H2049. [Google Scholar] [CrossRef] [Green Version]
- Liao, F.; Jan, Y.K. Using Modified Sample Entropy to Characterize Aging-Associated Microvascular Dysfunction. Front. Physiol. 2016, 7, 126. [Google Scholar] [CrossRef] [Green Version]
- Jan, Y.K.; Hou, X.; He, X.; Guo, C.; Jain, S.; Bleakney, A. Using elastographic ultrasound to assess the effect of cupping size of cupping therapy on stiffness of triceps muscle. Am. J. Phys. Med. Rehabil. 2021, 100, 694–699. [Google Scholar] [CrossRef]
- Wang, X.; Zhang, X.; Elliott, J.; Liao, F.; Tao, J.; Jan, Y.K. Effect of Pressures and Durations of Cupping Therapy on Skin Blood Flow Responses. Front. Bioeng Biotechnol. 2020, 8, 608509. [Google Scholar] [CrossRef] [PubMed]
- He, X.; Zhang, X.; Liao, F.; He, L.; Jan, Y.K. Using reactive hyperemia to investigate the effect of cupping sizes of cupping therapy on skin blood flow responses. J. Back Musculoskelet. Rehabil. 2021, 34, 327–333. [Google Scholar] [CrossRef]
- Hou, X.; He, X.; Zhang, X.; Liao, F.; Hung, Y.; Jan, Y. Using laser Doppler flowmetry with wavelet analysis to study skin blood flow regulations after cupping therapy. Skin Res. Technol. 2021, 27, 393–399. [Google Scholar] [CrossRef] [PubMed]
- Hwang, H.J.; Chung, W.H.; Song, J.H.; Lim, J.K.; Kim, H.S. Prediction of biceps muscle fatigue and force using electromyography signal analysis for repeated isokinetic dumbbell curl exercise. J. Mech. Sci. Technol. 2016, 30, 5329–5336. [Google Scholar] [CrossRef]
- Freeborn, T.J.; Fu, B. Time-course bicep tissue bio-impedance changes throughout a fatiguing exercise protocol. Med. Eng. Phys. 2019, 69, 109–115. [Google Scholar] [CrossRef]
- Pekünlü, E.; Atalağ, O. Relationship Between Fatigue Index and Number of Repetition Maxima with Sub-Maximal Loads in Biceps Curl. J. Human Kinet. 2013, 38, 169–181. [Google Scholar] [CrossRef] [Green Version]
- Hermens, H.J.; Freriks, B.; Disselhorst-Klug, C.; Rau, G. Development of recommendations for SEMG sensors and sensor placement procedures. J. Electromyogr. Kinesiol. 2000, 10, 361–374. [Google Scholar] [CrossRef]
- Keshtkaran, M.R.; Zhi, Y. A fast, robust algorithm for power line interference cancellation in neural recording. J. Neural. Eng. 2014, 11, 026017. [Google Scholar] [CrossRef] [PubMed] [Green Version]
- Liao, F.; Cheing, G.L.Y.; Ren, W.; Jain, S.; Jan, Y.K. Application of Multiscale Entropy in Assessing Plantar Skin Blood Flow Dynamics in Diabetics with Peripheral Neuropathy. Entropy 2018, 20, 127. [Google Scholar] [CrossRef] [Green Version]
- Liao, F.; Yang, T.D.; Wu, F.L.; Cao, C.; Mohamed, A.; Jan, Y.K. Using Multiscale Entropy to Assess the Efficacy of Local Cooling on Reactive Hyperemia in People with a Spinal Cord Injury. Entropy 2019, 21, 90. [Google Scholar] [CrossRef] [Green Version]
- Liao, F.; Zhang, K.; Zhou, L.; Chen, Y.; Elliott, J.; Jan, Y.K. Effect of Different Local Vibration Frequencies on the Multiscale Regularity of Plantar Skin Blood Flow. Entropy 2020, 22, 1288. [Google Scholar] [CrossRef] [PubMed]
- Phinyomark, A.; Phukpattaranont, P.; Limsakul, C. Feature Reduction and Selection for EMG Signal Classification. Expert Syst. Appl. 2012, 39, 7420–7431. [Google Scholar] [CrossRef]
- De Luca, C.J. Physiology and mathematics of myoelectric signals. IEEE Trans. Biomed. Eng. 1979, 26, 313–325. [Google Scholar] [CrossRef]
- Pethick, J.; Winter, S.L.; Burnley, M. Fatigue reduces the complexity of knee extensor torque fluctuations during maximal and submaximal intermittent isometric contractions in man. J. Physiol. 2015, 593, 2085–2096. [Google Scholar] [CrossRef] [PubMed]
- Navaneethakrishna, M.; Karthick, P.A.; Ramakrishnan, S. Analysis of biceps brachii sEMG signal using Multiscale Fuzzy Approximate Entropy. In Proceedings of the Engineering in Medicine & Biology Society, Milan, Italy, 25–29 August 2015; pp. 7881–7884. [Google Scholar]
- Tong, H.; Xu, Z.; Ma, H.; Chen, Y.; Chen, X. Fatiguing Effects on the Multi-Scale Entropy of Surface Electromyography in Children with Cerebral Palsy. Entropy. 2016, 18, 1–16. [Google Scholar]
- Tham, L.M.; Lee, H.P.; Lu, C. Cupping: From a biomechanical perspective. J. Biomech. 2006, 39, 2183–2193. [Google Scholar] [CrossRef]
- Neric, F.B.; Beam, W.C.; Brown, L.E.; Wiersma, L.D. Comparison of swim recovery and muscle stimulation on lactate removal after sprint swimming. J. Strength Cond. Res. 2009, 23, 2560–2567. [Google Scholar] [CrossRef] [Green Version]
- Rui, T.; Ribeiro, F.; Duarte, J.A.; Cabri, J. Evidence of the physiotherapeutic interventions used currently after exercise-induced muscle damage: Systematic review and meta-analysis. Phys. Ther. Sport 2012, 13, 101–114. [Google Scholar]
- Lowe, D.T. Cupping therapy: An analysis of the effects of suction on skin and the possible influence on human health. Complement. Ther Clin. Pract. 2017, 29, 162–168. [Google Scholar] [CrossRef]


Publisher’s Note: MDPI stays neutral with regard to jurisdictional claims in published maps and institutional affiliations. |
© 2021 by the authors. Licensee MDPI, Basel, Switzerland. This article is an open access article distributed under the terms and conditions of the Creative Commons Attribution (CC BY) license (https://creativecommons.org/licenses/by/4.0/).
Share and Cite
Liao, F.; Zhang, X.; Cao, C.; Hung, I.Y.-J.; Chen, Y.; Jan, Y.-K. Effects of Muscle Fatigue and Recovery on Complexity of Surface Electromyography of Biceps Brachii. Entropy 2021, 23, 1036. https://doi.org/10.3390/e23081036
Liao F, Zhang X, Cao C, Hung IY-J, Chen Y, Jan Y-K. Effects of Muscle Fatigue and Recovery on Complexity of Surface Electromyography of Biceps Brachii. Entropy. 2021; 23(8):1036. https://doi.org/10.3390/e23081036
Chicago/Turabian StyleLiao, Fuyuan, Xueyan Zhang, Chunmei Cao, Isabella Yu-Ju Hung, Yanni Chen, and Yih-Kuen Jan. 2021. "Effects of Muscle Fatigue and Recovery on Complexity of Surface Electromyography of Biceps Brachii" Entropy 23, no. 8: 1036. https://doi.org/10.3390/e23081036
APA StyleLiao, F., Zhang, X., Cao, C., Hung, I. Y.-J., Chen, Y., & Jan, Y.-K. (2021). Effects of Muscle Fatigue and Recovery on Complexity of Surface Electromyography of Biceps Brachii. Entropy, 23(8), 1036. https://doi.org/10.3390/e23081036