Model for Risk Calculation and Reliability Comparison of Level Crossings
Abstract
:1. Introduction
2. Models for Predicting Accidents and Incidents at Level Crossings—A Review of the Literature
3. Model of Heterogeneous Queuing System
3.1. Model Basics: Maximum Risk, Entropy and Chaos
3.2. Ideal Level Crossing Queuing System
3.3. Queuing System for the Calculation of Maximal Risk
- λc average daily intensity flows of road vehicle.
- λt, average daily intensity flows of railway vehicle.
- μc average daily service intensity of road vehicles.
- μt, average daily service intensity of railway vehicles.
- lc average length of road vehicles.
- Lc length of the critical distance for road vehicles, which is equal to the average frontal width of the train.
- lt length of the critical distance, which is equal to the average train length.
- Lt length of the critical distance for railway vehicles, which is equal to the width of the level crossing.
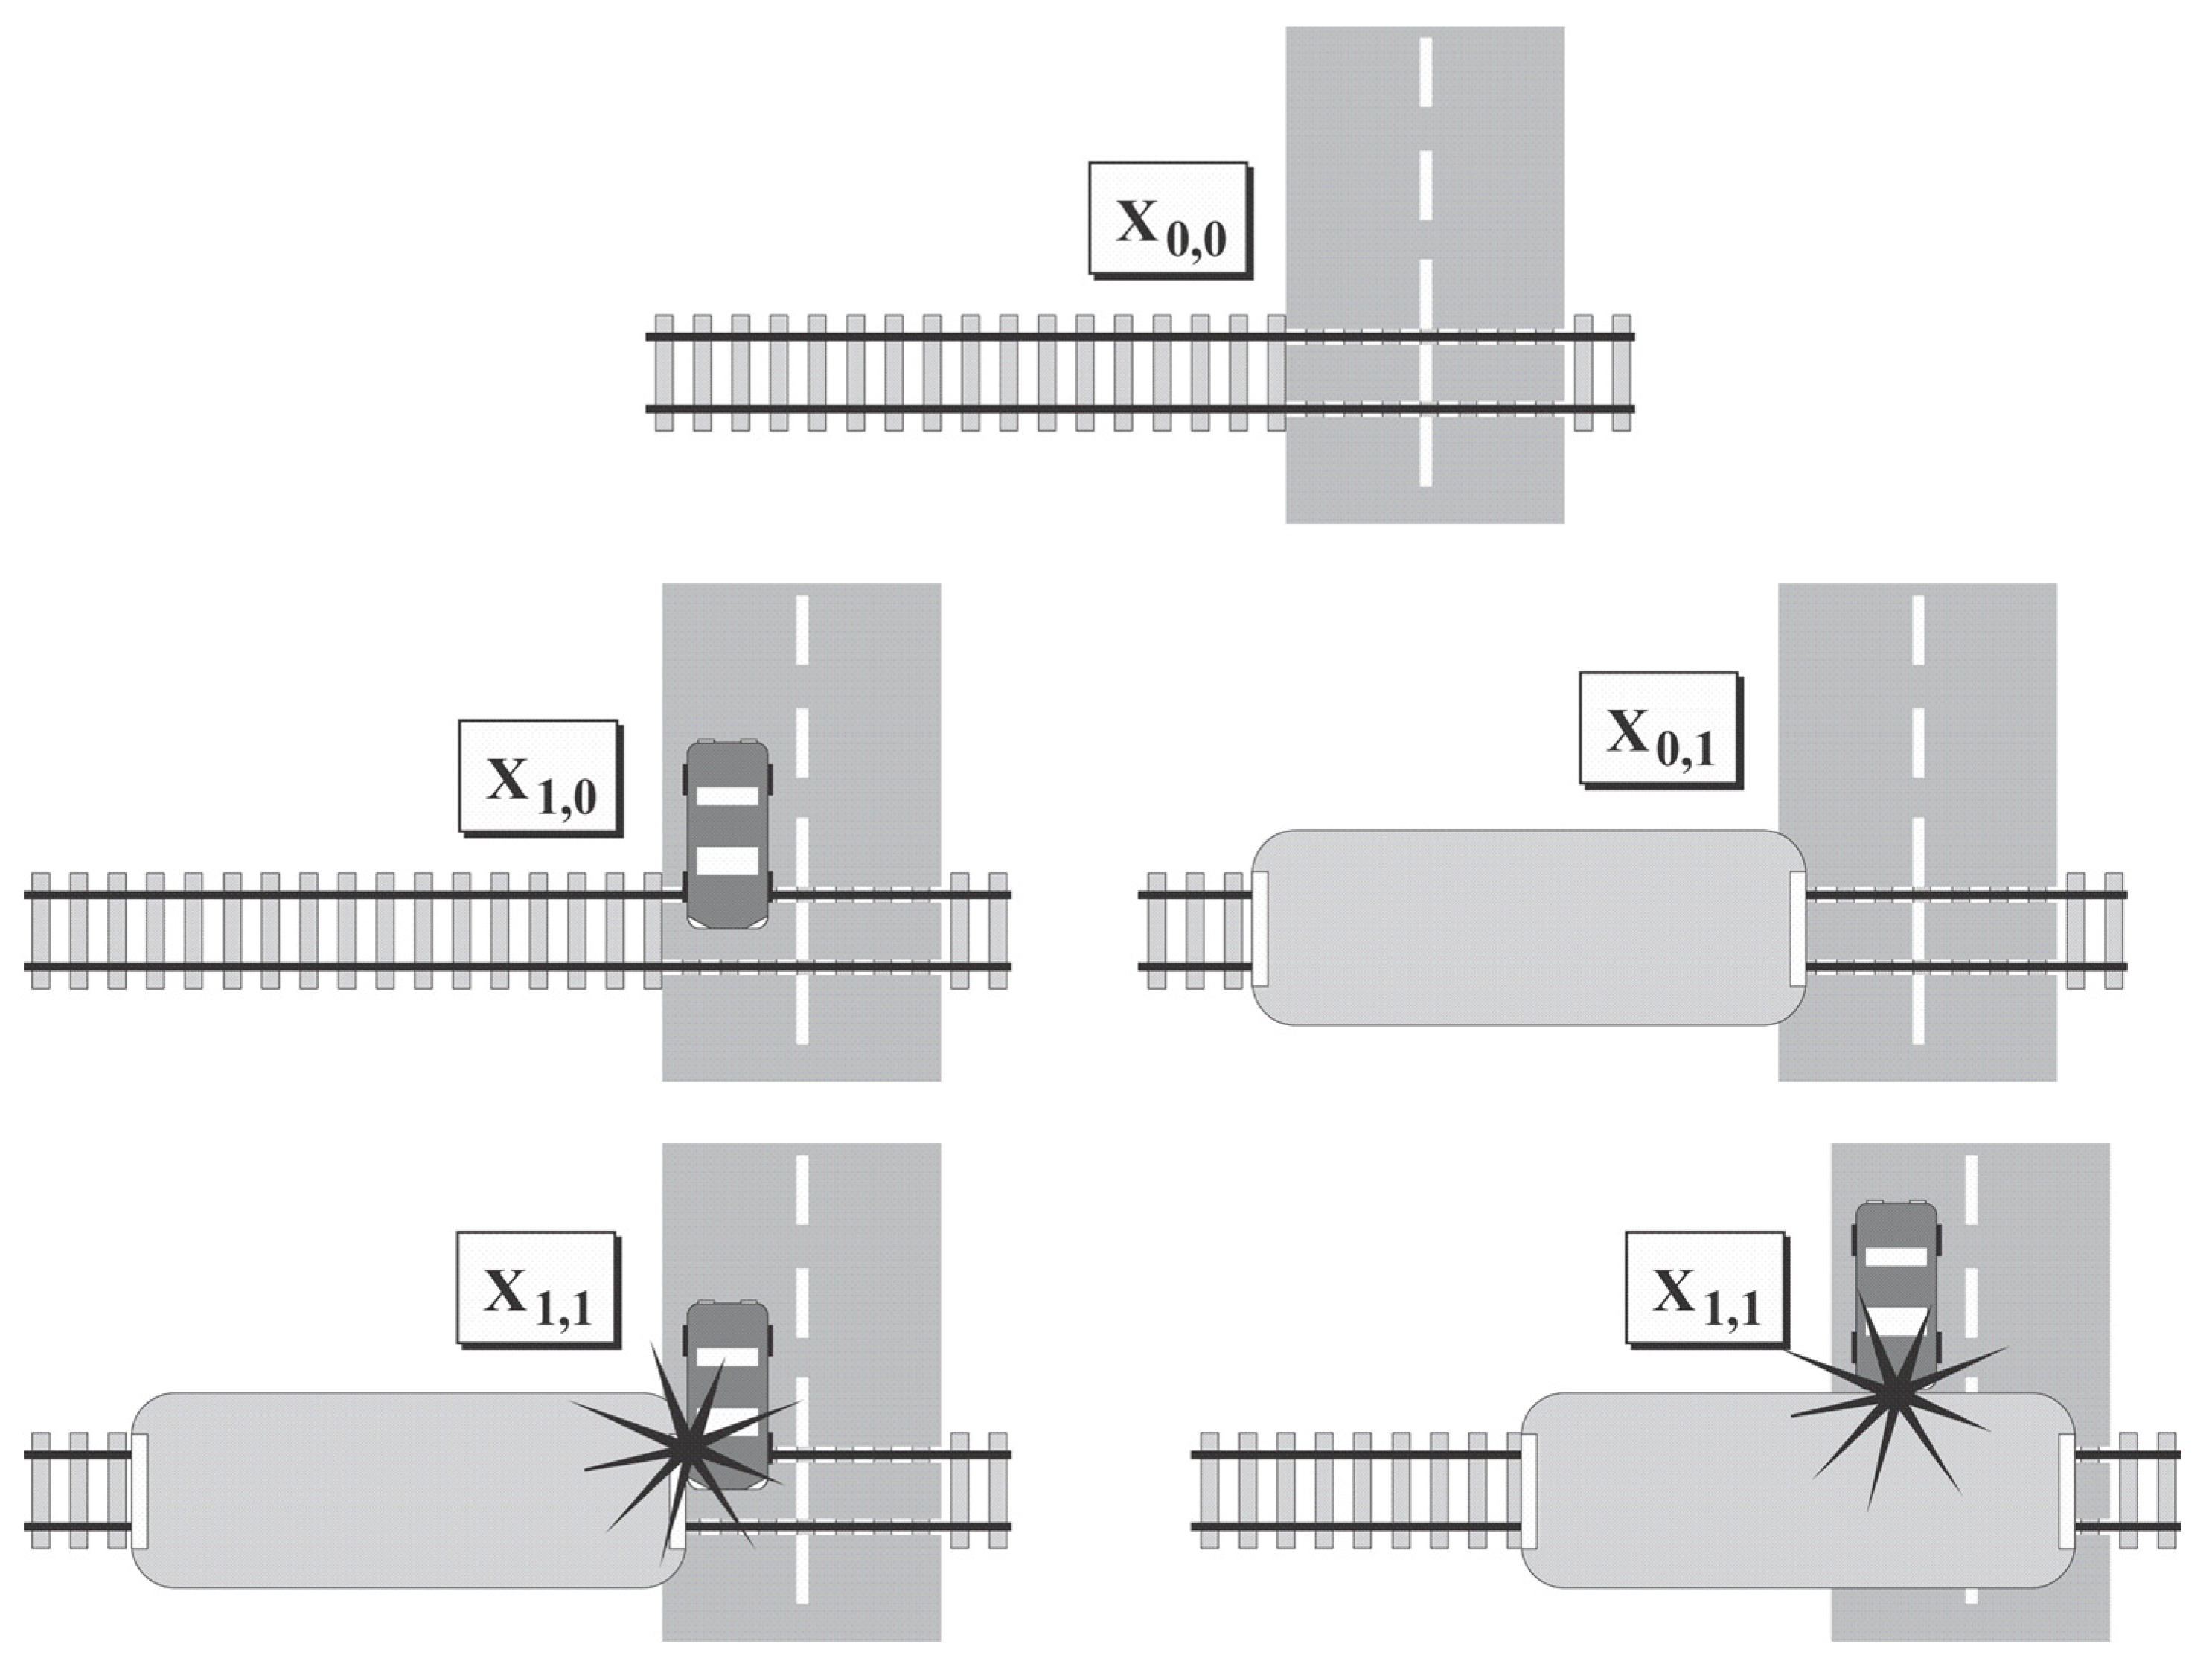
- X0,0 road crossing is without vehicles.
- X1,0 level crossing is at a critical distance and serves only road vehicles.
- X0,1 level crossing is at a critical distance and serves only railway vehicles.
- X1,1 road crossing serves both road and rail vehicles at the same time. This condition has a dual accident status: A railway vehicle may run into a road vehicle, or a road vehicle may run into a railway vehicle.
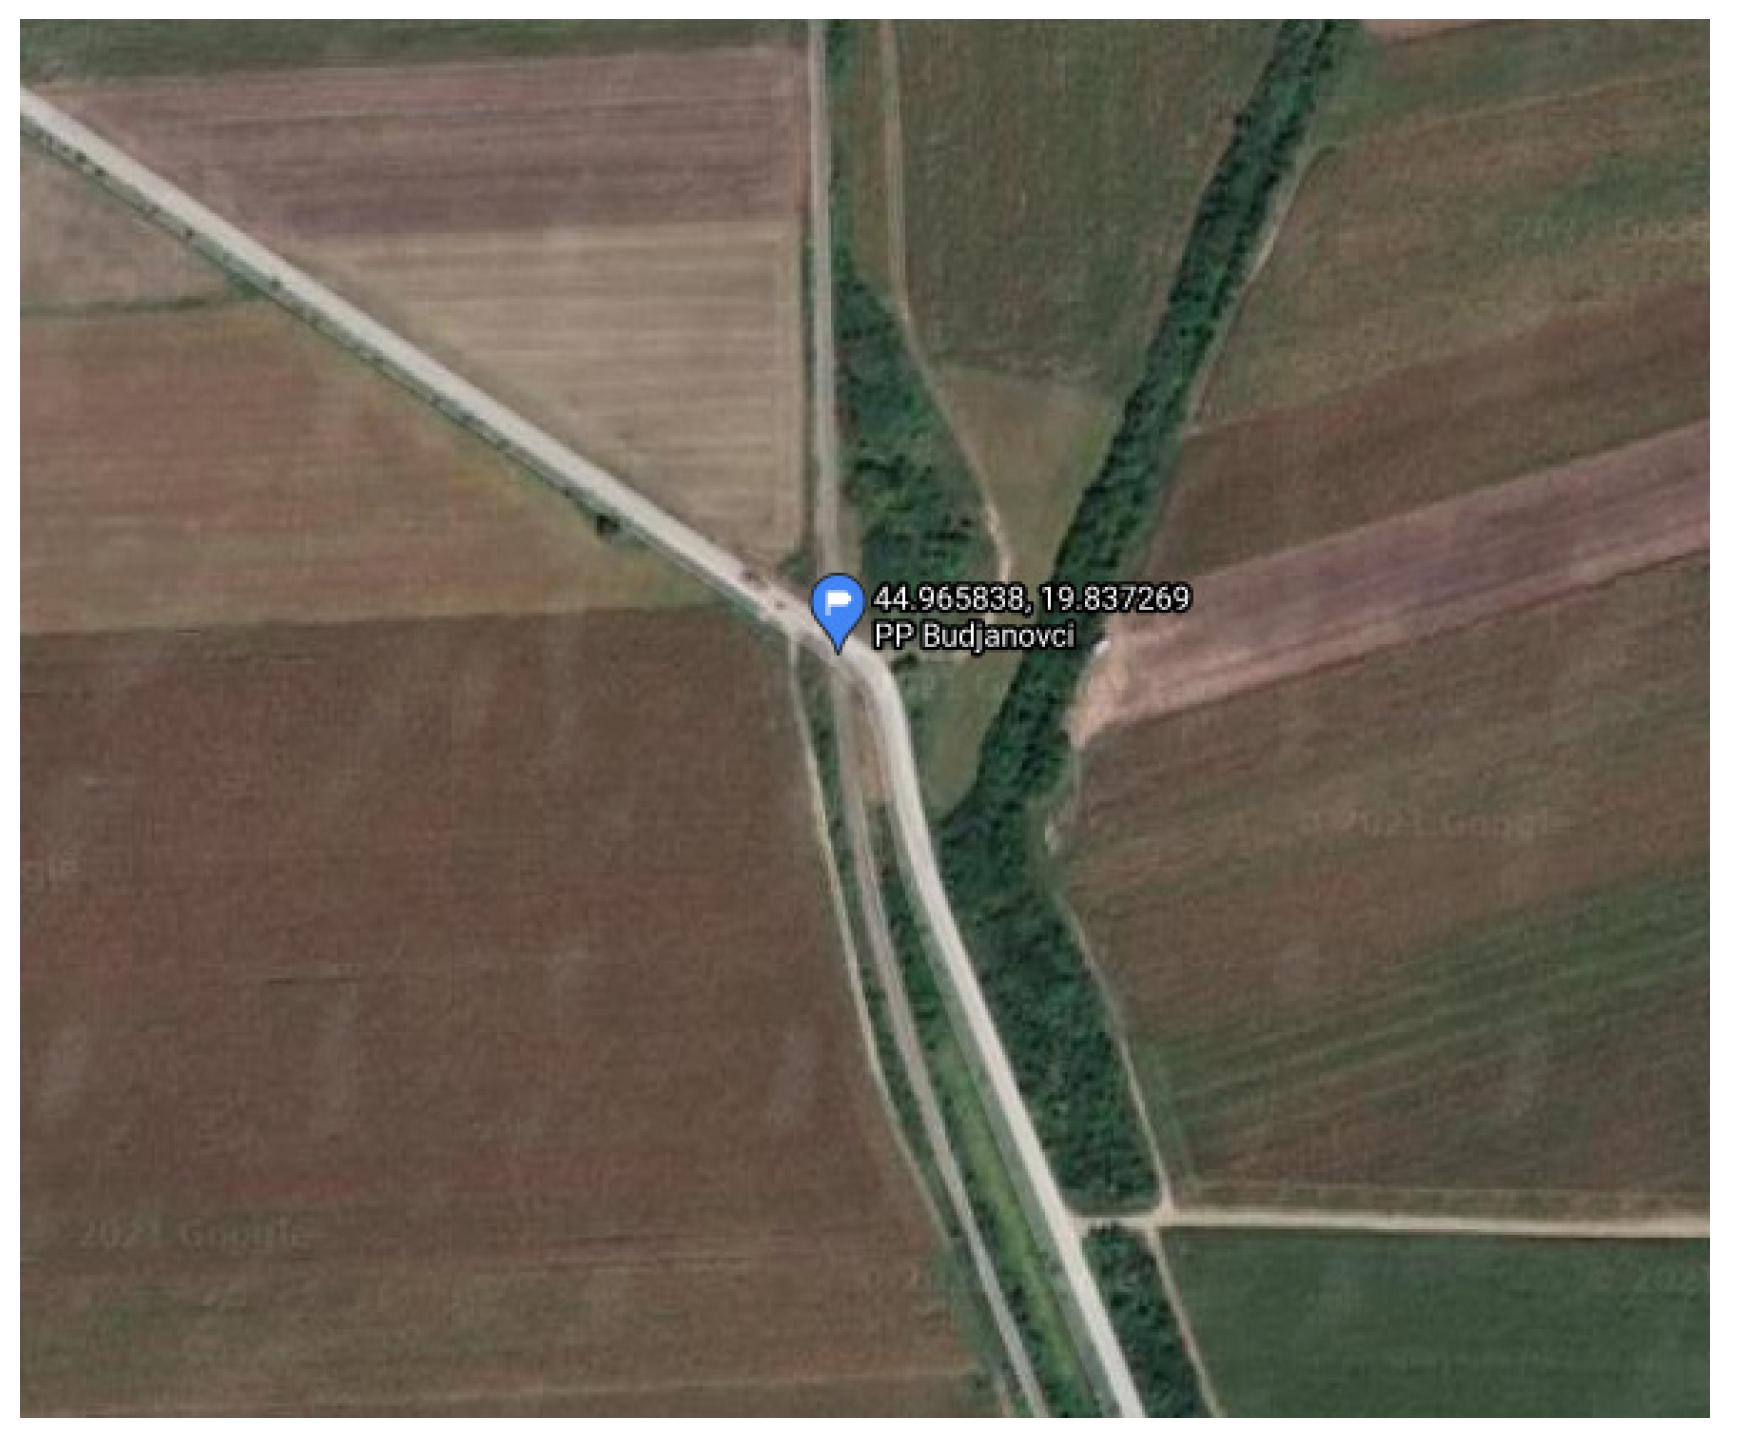
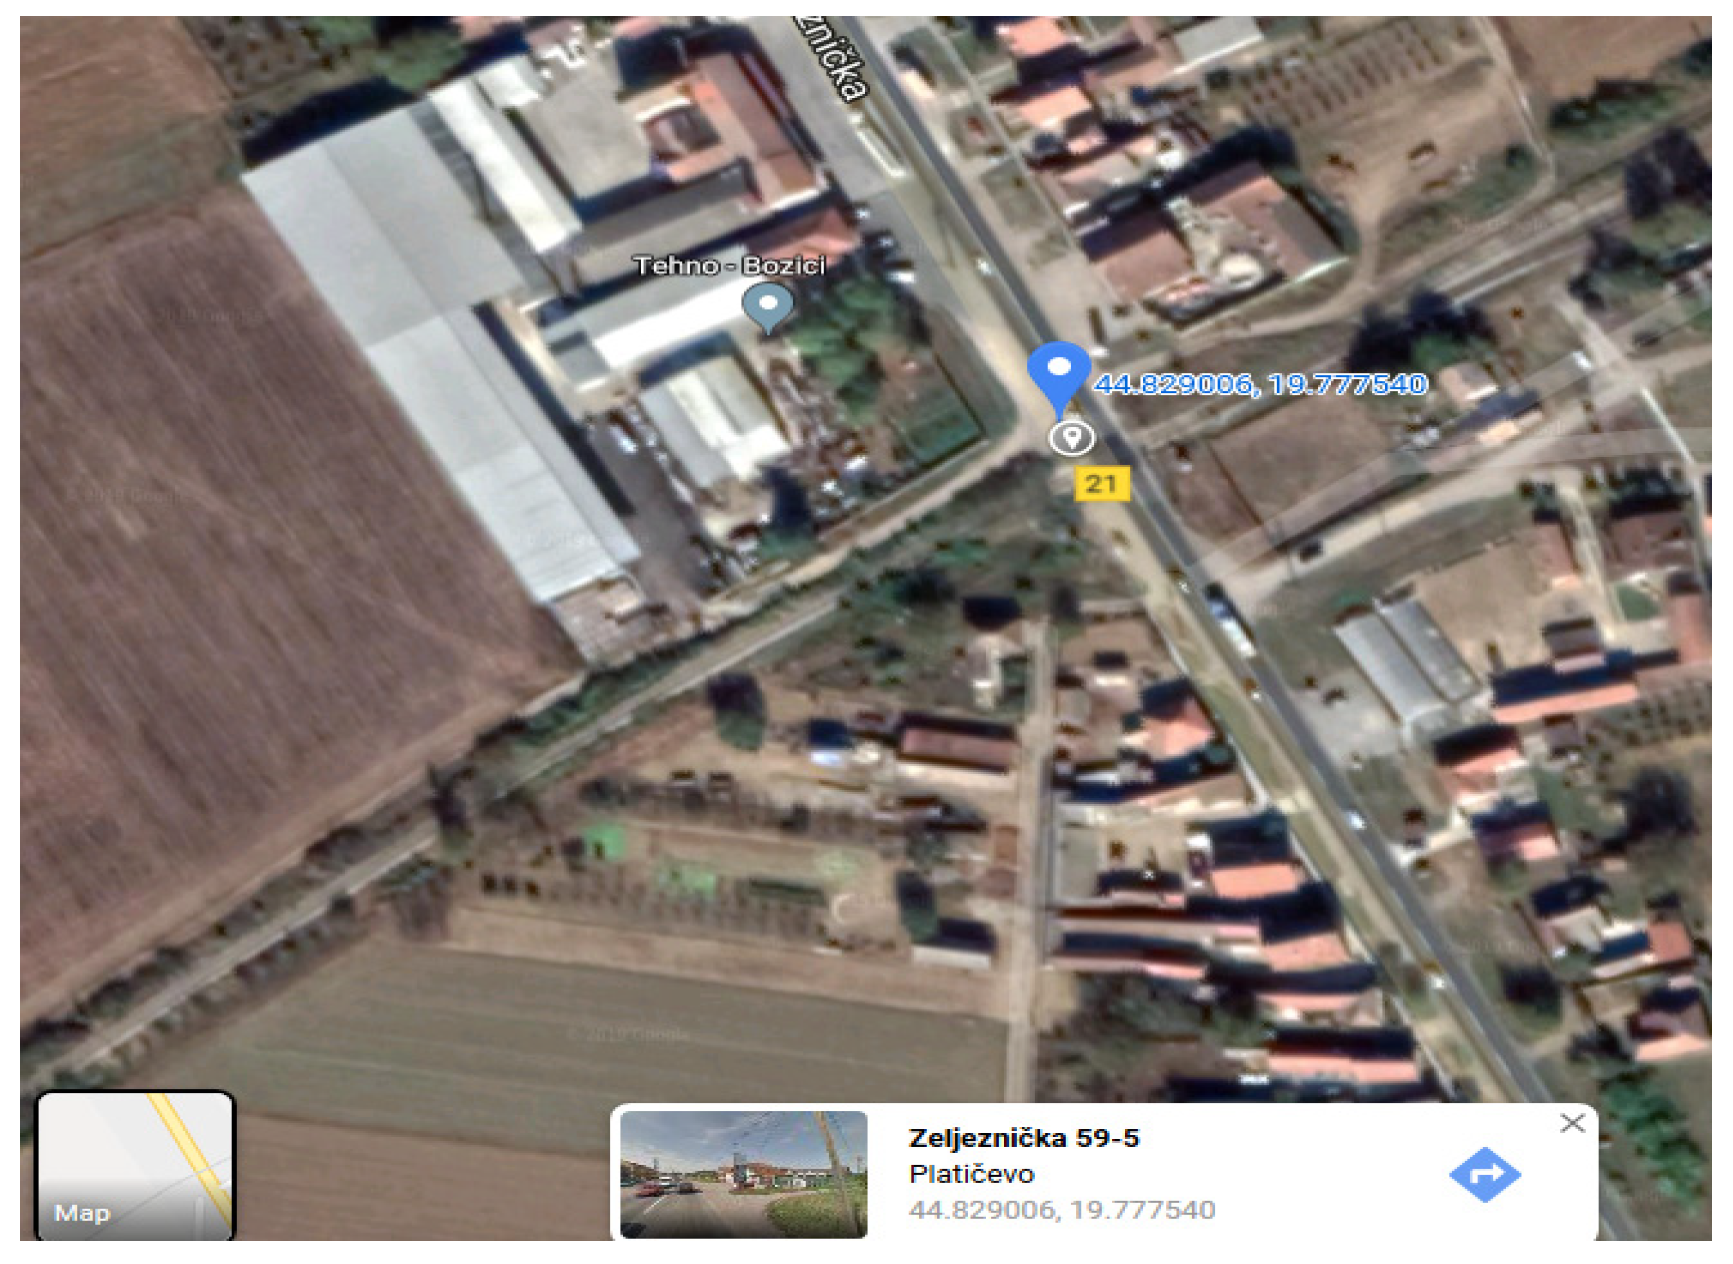
4. Model Testing on Selected Level Crossings
Discussion
- The installation of vibrating lanes in order to “calm down” road traffic when approaching the area of the road-rail crossing.
- Improving the visibility at the level crossing (all visibility triangles must be absolutely provided).
- Paving the surface of the road–rail crossing (level crossing) with different strong colors, lighting the crossing with reflectors and installing additional light signals and lanterns that will warn road users that they are about to encounter the level crossing, etc.
5. Conclusions
Author Contributions
Funding
Institutional Review Board Statement
Informed Consent Statement
Data Availability Statement
Conflicts of Interest
References
- Kendall, D.G. Stochastic processes occurring in the theory of queues and their analysis by the method of the imbedded Markov chain. Ann. Math. Stat. 1953, 24, 338–354. [Google Scholar] [CrossRef]
- Heragu, S.S.; Kakuturi, S.R. Grouping and placement of machinecells. IIE Trans. 1997, 29, 561–571. [Google Scholar] [CrossRef]
- Lee, A. Applied Queuing Theory; St Martin’s Press: New York, NY, USA, 1966; p. 45. Available online: https://books.google.rs/books?id=hVJdDwAAQBAJ&printsec=frontcover&hl=hr#v=onepage&q&f=false (accessed on 14 February 2021).
- Ghazel, M. Using stochastic Petri nets for level-crossing collision risk assessment. IEEE Trans. Intell. Transp. Syst. 2009, 10, 668–677. [Google Scholar] [CrossRef]
- Liu, B.; Ghazel, M.; Toguyeni, A. Model-based diagnosis of multi-track level crossing plants. IEEE Trans. Intell. Transp. Syst. 2016, 17, 546–556. [Google Scholar] [CrossRef]
- Mekki, A.; Ghazel, M.; Toguyeni, A. Validation of a new functional design of automatic protection systems at level crossings with model-checking techniques. IEEE Trans. Intell. Transp. Syst. 2012, 13, 714–723. [Google Scholar] [CrossRef]
- European Railway Agency (ERA). Intermediate Report on the Development of Railwaysafety in the European Union, European Railway Agency, Safety Unit. 2014. Available online: https://www.era.europa.eu/sites/default/files/library/docs/safety_interoperability_progress_reports/railway_safety_performance_2014_en.pdf (accessed on 15 April 2021).
- Ghazel, M.; El-Koursi, E.-M. Two-half-barrier level crossings versus four-half-barrier level crossings: A comparative risk analysis study. IEEE Trans. Intell. Transp. Syst. 2014, 15, 1123–1133. [Google Scholar] [CrossRef]
- Evans, W.A. Fatal accidents at railway level crossings in Great Britain 1946–2009. Accid. Anal. Prev. 2011, 43, 1837–1845. [Google Scholar] [CrossRef] [PubMed] [Green Version]
- SNCF Réseau. World Conference of Road Safety at Level Crossings (Journée Mondiale de Sécurité Routière aux Passages à Niveau), France. 2011. Available online: http://www.planetoscope.com/automobile/1271-nombre-de-collisions-aux-passages-a-niveau-en-france.html (accessed on 9 April 2021).
- SNCF Réseau. 8th National Conference of Road Safety at Level Crossings (8ème Journée Nationale de Sécurité Routière aux Passages à Niveau), France. 2015. Available online: http://docplayer.fr/10733454-8-eme-journee-nationale-de-securite-routiere-aux-passages-a-niveau.html (accessed on 7 April 2021).
- U.S. Department of Transportation, Washington, DC. Available online: http://www.dot.gov (accessed on 14 June 2021).
- Jovanis, P.P.; Chang, H. Modeling the Relationship of Accidents to Miles Traveled; Transportation Research Record, No. 1068, TRB, National Research Council. 1986. Available online: http://www.honolulutraffic.com/Admin_Record/Administrative_Record_rev_2.28.12/Administrative_Record_Volumes_1-11/Vol002_AR00028614/AR00029621.pdf (accessed on 10 May 2021).
- Miaou, S.P.; Lum, H. Modeling vehicle accidents and highway geometric design relationship. Accid. Anal. Prev. 1993, 25, 689–709. [Google Scholar] [CrossRef]
- Maher, M.J.; Summersgill, I.A. Comprehensive methodology for the fitting of predictive accident models. Accid. Anal. Prev. 1996, 28, 281–296. [Google Scholar] [CrossRef]
- Maycock, G.; Hall, R.D. Accidents at 4-Arm Roundabouts; TRL Laboratory Report LR 1120; Transport and Road Research Laboratory, Traffic Engineering & Control Dept., Traffic Systems Division: Crowthorne, UK, 1984.
- Miaou, S.-P.; Bligh, R.P.; Lord, D. Developing median barrier installation guidelines: A benefit/cost analysis using Texas data. Transp. Res. Rec. 2005, 1904, 2–19. [Google Scholar] [CrossRef]
- Lord, D.; Miranda-Moreno, L.F. Effects of low sample mean values and small sample size on the estimation of the fixed dispersion parameter of Poisson-gamma models for modeling motor vehicle crashes. A Bayesian perspective. Saf. Sci. 2008, 46, 751–770. [Google Scholar] [CrossRef]
- Aguero-Valverde, J.; Jovanis, P. Analysis of road crash frequency with spatial models. Transp. Res. Rec. 2008, 2061, 55–63. [Google Scholar] [CrossRef]
- Miaou, S.P. The relationship between truck accidents and geometric design of road sections: Poisson versus negative binomial regressions. Accid. Anal. Prev. 1994, 26, 471–482. [Google Scholar] [CrossRef] [Green Version]
- Shankar, V.; Mannering, F.; Barfield, W. Statistical analysis of accident severity on rural freeways. Accid. Anal. Prev. 1996, 28, 391–401. [Google Scholar] [CrossRef]
- Poch, M.; Mannering, F. Negative Binomial Analysis of Intersection Accident Frequencies. J. Transp. Eng. 1996, 122, 105–113. Available online: https://www.researchgate.net/publication/246925336_Negative_Binomial_Analysis_of_Intersection-Accident_Frequencies (accessed on 12 July 2021). [CrossRef] [Green Version]
- Milton, J.; Mannering, F. The relationship among highway geometrics, traffic-related elements and motor-vehicle accident frequencies. Transportation 1998, 25, 395–413. [Google Scholar] [CrossRef]
- Chin, H.; Quddus, M.A. Applying the random effect negative binomial model to examine traffic accident occurrence at signalized intersections. Accid. Anal. Prev. 2003, 35, 253–259. [Google Scholar] [CrossRef]
- El-Basyouny, K.; Sayed, T. Comparison of two negative binomial regression techniques in developing accident prediction models. Transp. Res. Rec. 2006, 1950, 9–16. [Google Scholar] [CrossRef]
- Donnell, E.T.; Mason, J.M., Jr. Predicting the frequency of median barrier crashes on Pennsylvania interstate highways. Accid. Anal. Prev. 2006, 38, 590–599. [Google Scholar] [CrossRef]
- Malyshkina, N.V.; Mannering, F. Empirical assessment of the impact of highway design exceptions on the frequency and severity of vehicle accidents. Accid. Anal. Prev. 2010, 42, 131–139. [Google Scholar] [CrossRef] [Green Version]
- Hauer, E. Overdispersion in modelling accidents on road sections and in Empirical Bayes estimation. Accid. Anal. Prev. 2001, 33, 799–808. [Google Scholar] [CrossRef]
- Shmueli, G.; Minka, T.P.; Kadane, J.B.; Borle, S.; Boatwright, P. A useful distribution for fitting discrete data: Revival of the Conway-Maxwell-Poisson distribution. J. R. Stat. Soc. Ser. C 2005, 54, 127–142. [Google Scholar] [CrossRef]
- Kadane, J.B.; Galit, S.; Minkа, T.P.; Borlex, S.; Boatwright, P. Conjugate analysis of the Conway-Maxwell-Poisson distribution. Bayesian Anal. 2006, 1, 363–374. [Google Scholar] [CrossRef]
- Lord, D.; Guikema, S.D.; Geedipally, S.R. Application of the Conway–Maxwell–Poisson generalized linear model for analyzing motor vehicle crashes. Accid. Anal. Prev. 2008, 40, 1123–1134. [Google Scholar] [CrossRef]
- Lambert, D. Zero-Inflated Poisson Regression, with an Application to Defects in Manufacturing. American Statistical Association and the American Society for Quality Control. Technometrics 1992, 34, 11–14. Available online: https://www.researchgate.net/publication/254333007_Zero-Inflated_Poisson_Regression_With_An_Application_to_Defects_in_Manufacturing (accessed on 25 August 2021). [CrossRef]
- Lee, J.; Mannering, F. Impact of roadside features on the frequency and severity of run-off-roadway accidents: An empirical analysis. Accid. Anal. Prev. 2002, 41, 798–808. [Google Scholar] [CrossRef]
- Oh, J.; Washington, S.P.; Nama, D. Accident prediction model for railway-highway interfaces. Accid. Anal. Prev. 2006, 38, 346–356. [Google Scholar] [CrossRef]
- Abdel-Aty, M.A.; Radwan, A.E. Modeling traffic accident occurrence and involvement. Accid. Anal. Prev. 2000, 32, 633–642. [Google Scholar] [CrossRef]
- Woods, M.D.; Slovak, R.; Schnieder, E. Safer European Level Crossing Appraisal and Technology (SELCAT)-D3 Report on Risk Modeling Techniques for Level Crossing Risk and System Safety Evaluation; Rail Safety and Standards Board (RSSB): London, UK, 2008; pp. 66–67. Available online: http://www.railway-research.org/IMG/pdf/g.2.4.5.4.pdf (accessed on 22 August 2021).
- Pribyl, O.; Goulias, K.G. Simulation of Daily Activity Patterns. In Progress in Activity-Based Analysis; Timmermans, H.J.P., Ed.; Pergamon: Oxford, UK, 2005; pp. 43–66. Available online: https://trid.trb.org/view/759268 (accessed on 22 August 2021).
- Federal Highway Administration—FHWA. Railway-Highway Crossings (Section 130) Program. Available online: https://railroads.dot.gov/sites/fra.dot.gov/files/fra_net/1464/HRGXHandbook.pdf (accessed on 14 January 2021).
- Austin, R.D.; Carson, J.L. An alternative accident prediction model for highway-rail interfaces. Accid. Anal. Prev. 2002, 34, 31–42. [Google Scholar] [CrossRef]
- Mengert, P.; Farr, E.H. Rail-Highway Crossing Accident Prediction Research Results-FY80; Transportation Systems Center: Cambridge, MA, USA, 1980; Available online: https://www.google.com/url?sa=t&rct=j&q=&esrc=s&source=web&cd=&ved=2ahUKEwjygYWI6P7yAhVu_rsIHYOxDusQFnoECAQQAQ&url=https%3A%2F%2Frosap.ntl.bts.gov%2Fview%2Fdot%2F8594%2Fdot_8594_DS1.pdf%3F&usg=AOvVaw0bfh-sAm8Okotr4kFegMUF (accessed on 27 December 2020).
- Liang, C.; Ghazel, M.; Cazier, O.; Koursi, E.M.E. Developing accident prediction model for railway level crossings. Saf. Sci. 2018, 101, 48–59. [Google Scholar] [CrossRef] [Green Version]
- Liang, C.; Ghazel, M.; Cazier, O.; Bouillaut, L. Advanced model-based risk reasoning on automatic railway level crossings. Saf. Sci. 2020, 124, 104592. [Google Scholar] [CrossRef]
- Grujić, S.; Popović, M.; Savić, G.; Pamučar, D. Safety Assessment of Railway Crossings in Serbia Using DEA Method. In Proceedings of the XLV Symposium on Operational Research (SYM-OP-IS 2018), Zlatibor, Serbia, 16–19 September 2018; Available online: http://cea.fon.bg.ac.rs/wp-content/uploads/2019/01/Grujic_Popovic_Savic_Pamucar-SymOpIs2018final.pdf (accessed on 19 May 2021).
- Kasalica, S.; Obradović, M.; Blagojević, A.; Jeremić, D.; Vuković, M. Models for ranking railway crossings for safety improvement. Oper. Res. Eng. Sci. Theory Appl. 2020, 3, 85–100. [Google Scholar] [CrossRef]
- Blagojević, A.; Kasalica, S.; Stević, Ž.; Tričković, G.; Pavelkić, V. Evaluation of safety degree at railway crossings in order to achieve sustainable traffic management: A novel integrated fuzzy MCDM model. Sustainability 2021, 13, 832. [Google Scholar] [CrossRef]
- Soumya Sharma, S.; Pulugurtha, S.S. Modeling crash risk at rail-highway grade crossings by track class. J. Transp. Technol. 2019, 9, 261. [Google Scholar] [CrossRef] [Green Version]
- Pasha, J.; Dulebenets, M.A.; Abioye, O.F.; Kavoosi, M.; Moses, R.; Sobanjo, J.; Ozguven, E.E. A comprehensive assessment of the existing accident and hazard prediction models for the highway-rail grade crossings in the State of Florida. Sustainability 2020, 12, 4291. [Google Scholar] [CrossRef]
- Keramati, A.; Lu, P.; Zhou, X.; Tolliver, D. A simultaneous safety analysis of crash frequency and severity for highway-rail grade crossings: The competing risks method. J. Adv. Transp. 2020, 2020, 8878911. [Google Scholar] [CrossRef]
- Exponential Distribution. Available online: https://en.wikipedia.org/wiki/Exponential_distribution (accessed on 31 August 2021).
- Tanackov, I.; Sinani, F.; Stanković, M.; Bogdanović, V.; Stević, Ž.; Vidić, M.; Mihaljev-Martinov, J. Natural test for random numbers generator basedon exponential distribution. Mathematics 2019, 7, 920. [Google Scholar] [CrossRef] [Green Version]
- Raikov, D. On the decomposition of Poisson laws. Doklady Akademii Nauk SSSR 1937, 14, 9–11. [Google Scholar]
- Vukadinović, S. Masovno Opsluživanje; Naučna Knjiga: Belgrade, Serbia, 1988. [Google Scholar]
- Agencija za Bezbednost Saobraćaja RS. Studija “Istraživanje Stanja Bezbednosti Saobraćaja u Zonama Pružnih Prelaza”. 2018. Available online: https://www.abs.gov.rs/admin/upload/documents/Istra%c5%beivanje%20stanja%20bezbednosti%20%20saobra%c4%87aja%20u%20zonama%20pru%c5%benih%20prelaza.pdf (accessed on 22 September 2020).




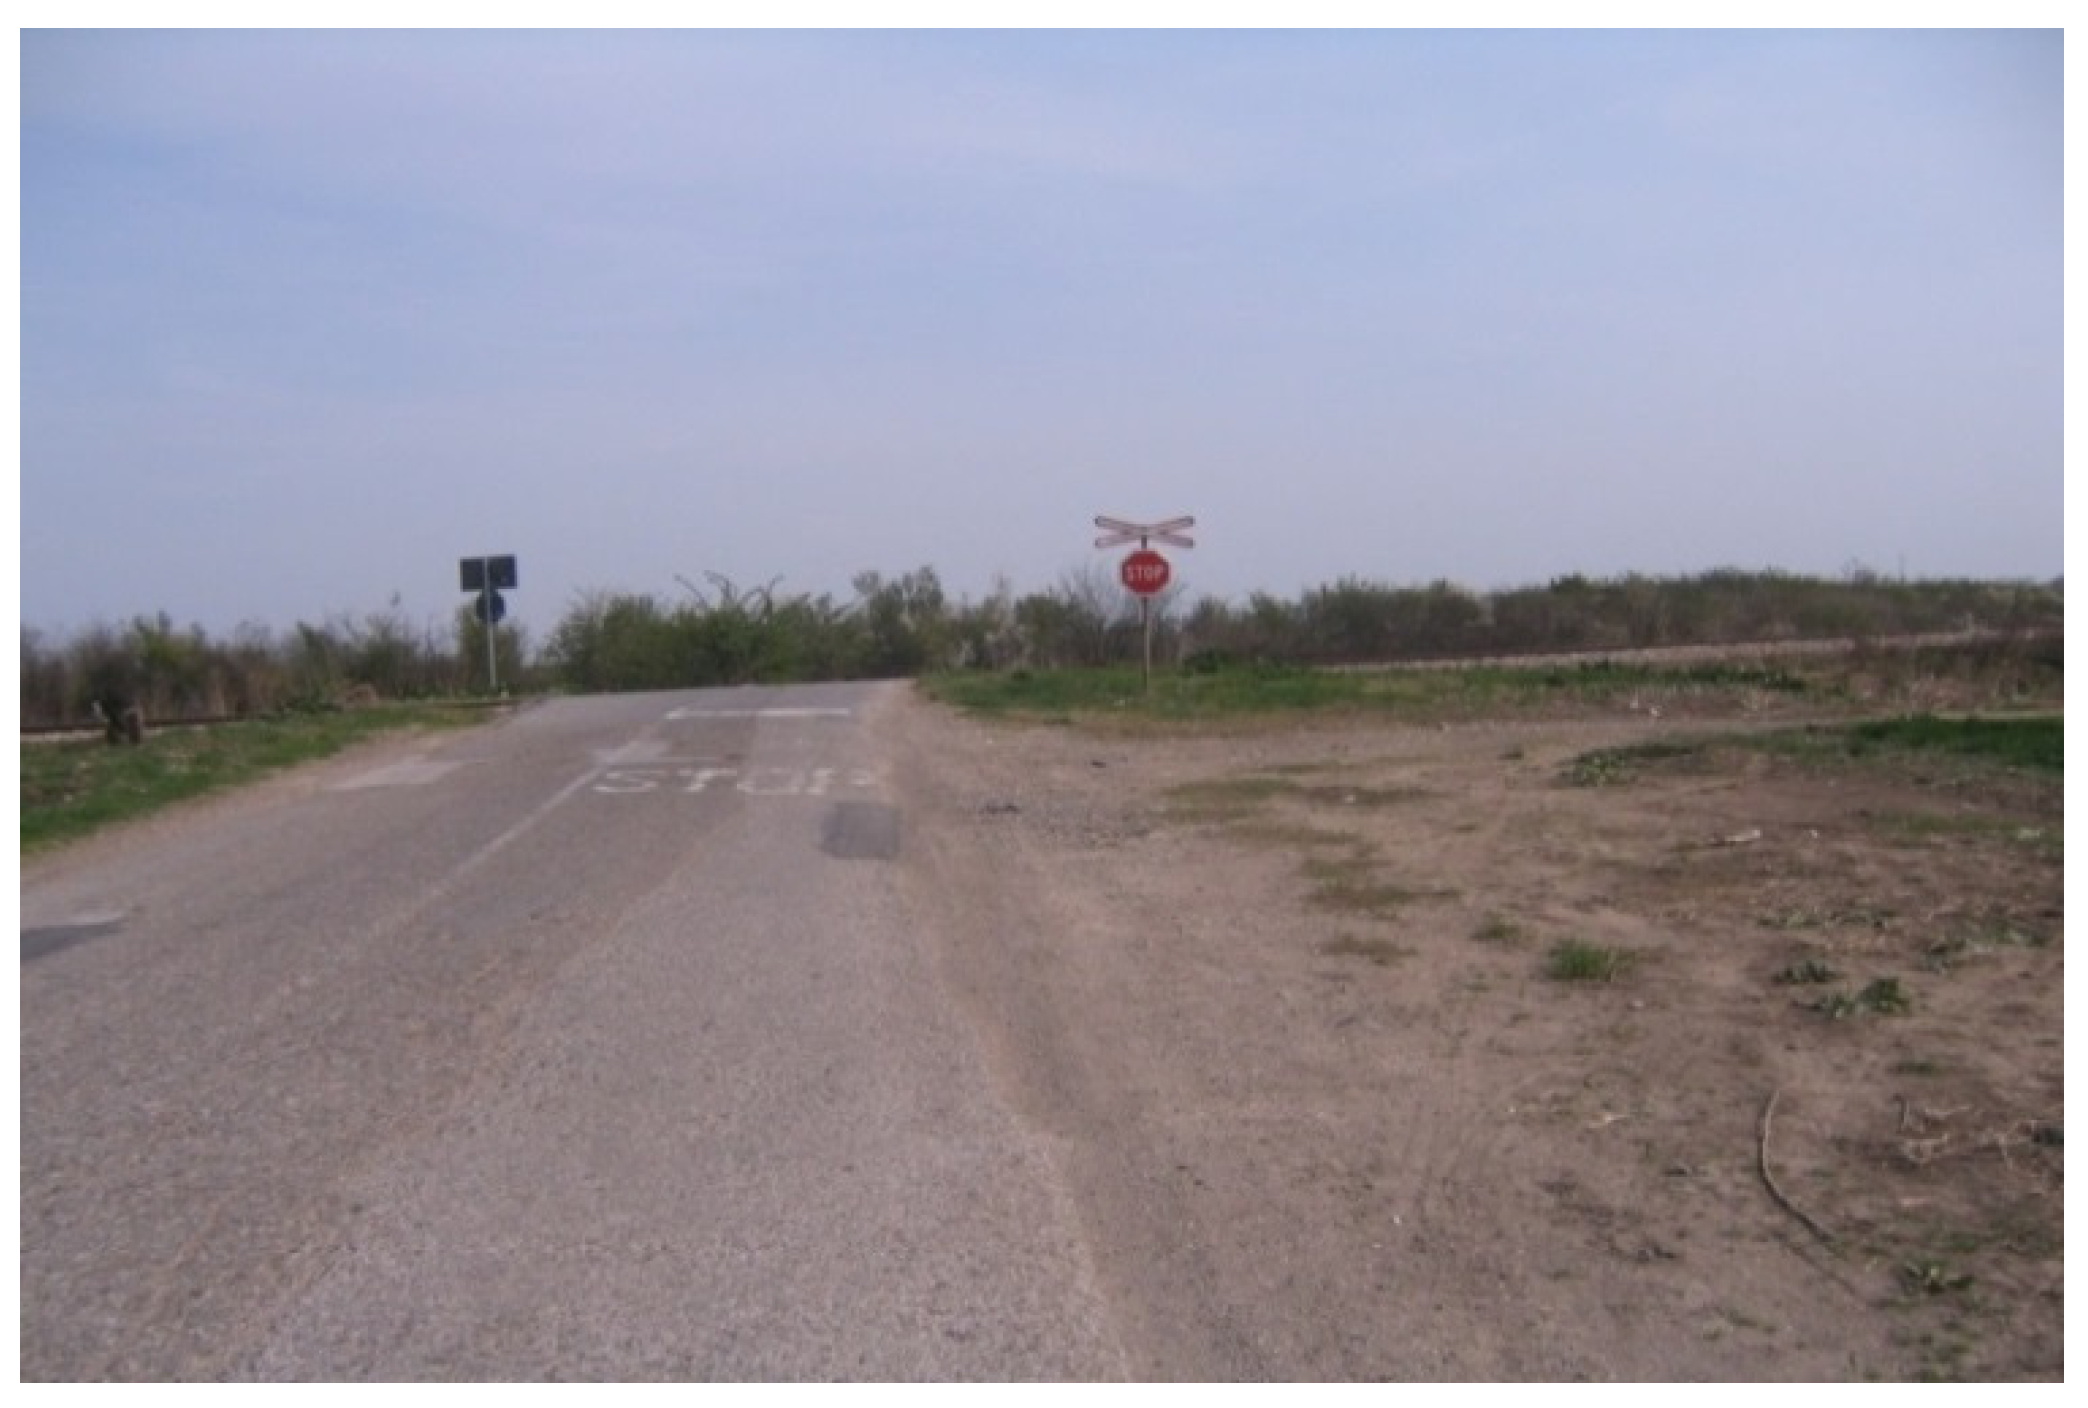
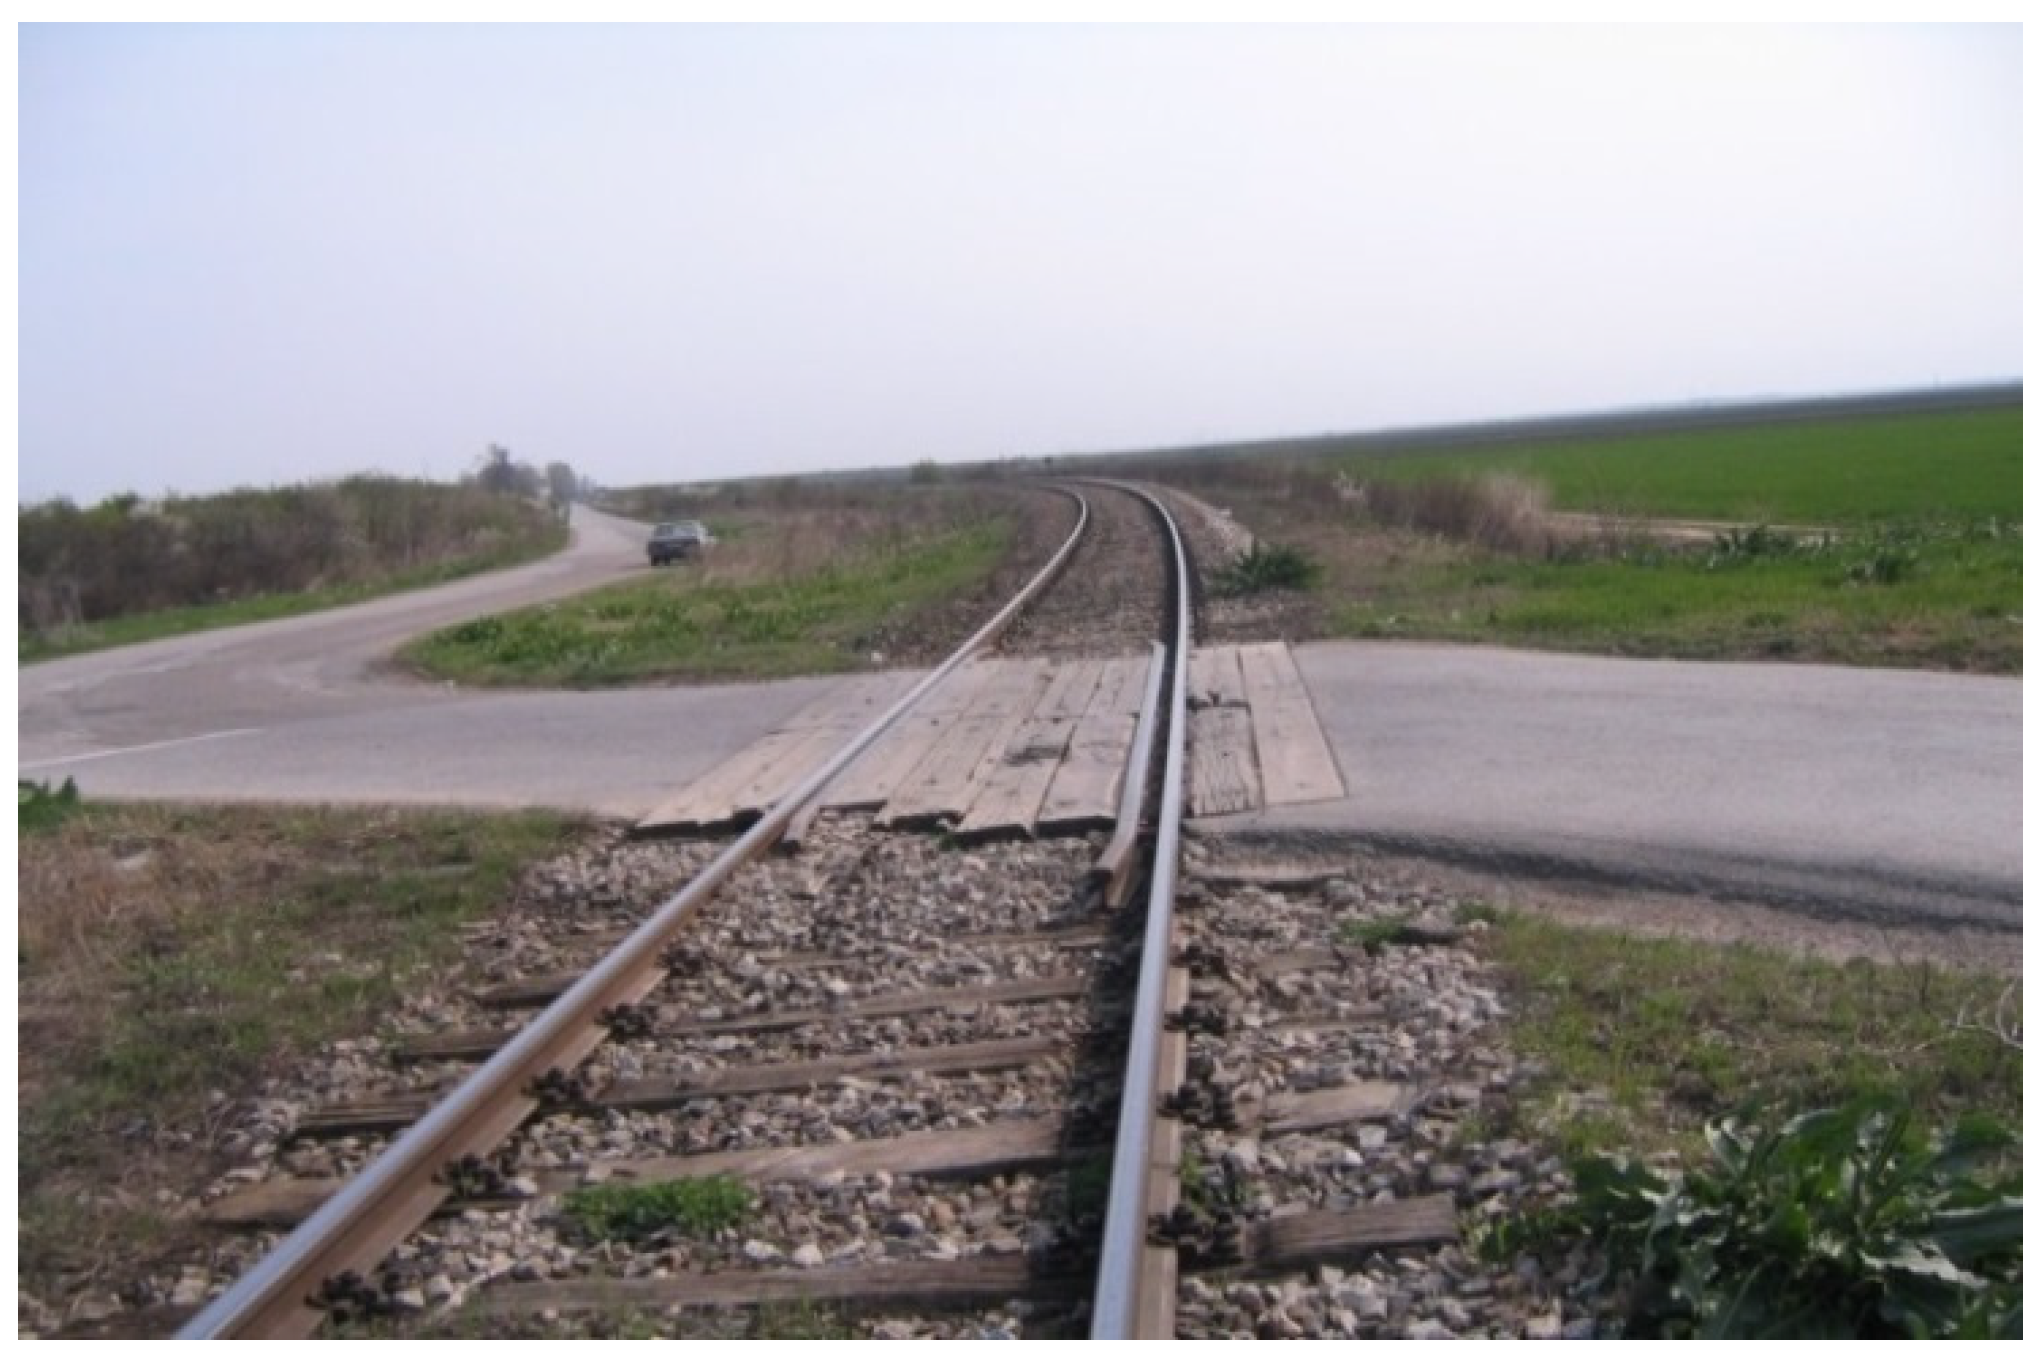
| Stationary and Dynamic Parameters | Value |
|---|---|
| Average train speed over the level crossing (km/h) | 70 |
| Average speed of road vehicles over the level crossing (km/h) | 32 |
| λt (trains/day) | 23 |
| λc (road vehicles/day) | 807 |
| lt (average train length in m) | 350 |
| Lt (length of railway vehicle over critical distance in m) | 5.00 |
| lc (average length of road vehicle in m) | 6.80 |
| Lc (length of road vehicle over critical distance in m) | 2.80 |
| Train service intensity μt = (lt + Lt)/vt | 4,732.394 |
| Road service intensity μc = (lc + Lc)/vc | 80,000.000 |
| The probability of a real accident preal | 0.000001851792 |
| The probability of a theoretical accident ptheor | 0.004836612535 |
| Synthetic level crossing reliability (R) | 0.99961713041 |
| Risk (r) | 0.00038286959 |
| Stationary and Dynamic Parameters | Value |
|---|---|
| Average train speed over the level crossing (km/h) | 34 |
| Average speed of road vehicles over the level crossing (km/h) | 70 |
| λt (trains/day) | 23 |
| λc (road vehicles/day) | 7628 |
| lt (average train length in m) | 350 |
| Lt (length of railway vehicle over critical distance in m) | 8.50 |
| lc (average length of road vehicle in m) | 5.20 |
| Lc (length of road vehicle over critical distance in m) | 2.80 |
| Train service intensity μt = (lt + Lt)/vt | 4786.192 |
| Road service intensity μc = (lc + Lc)/vc | 102000.000 |
| The probability of a real accident preal | 0.000000065303 |
| The probability of a theoretical accident ptheor | 0.004884064551 |
| Synthetic level crossing reliability (R) | 0.99998662935 |
| Risk (r) | 0.00001337065 |
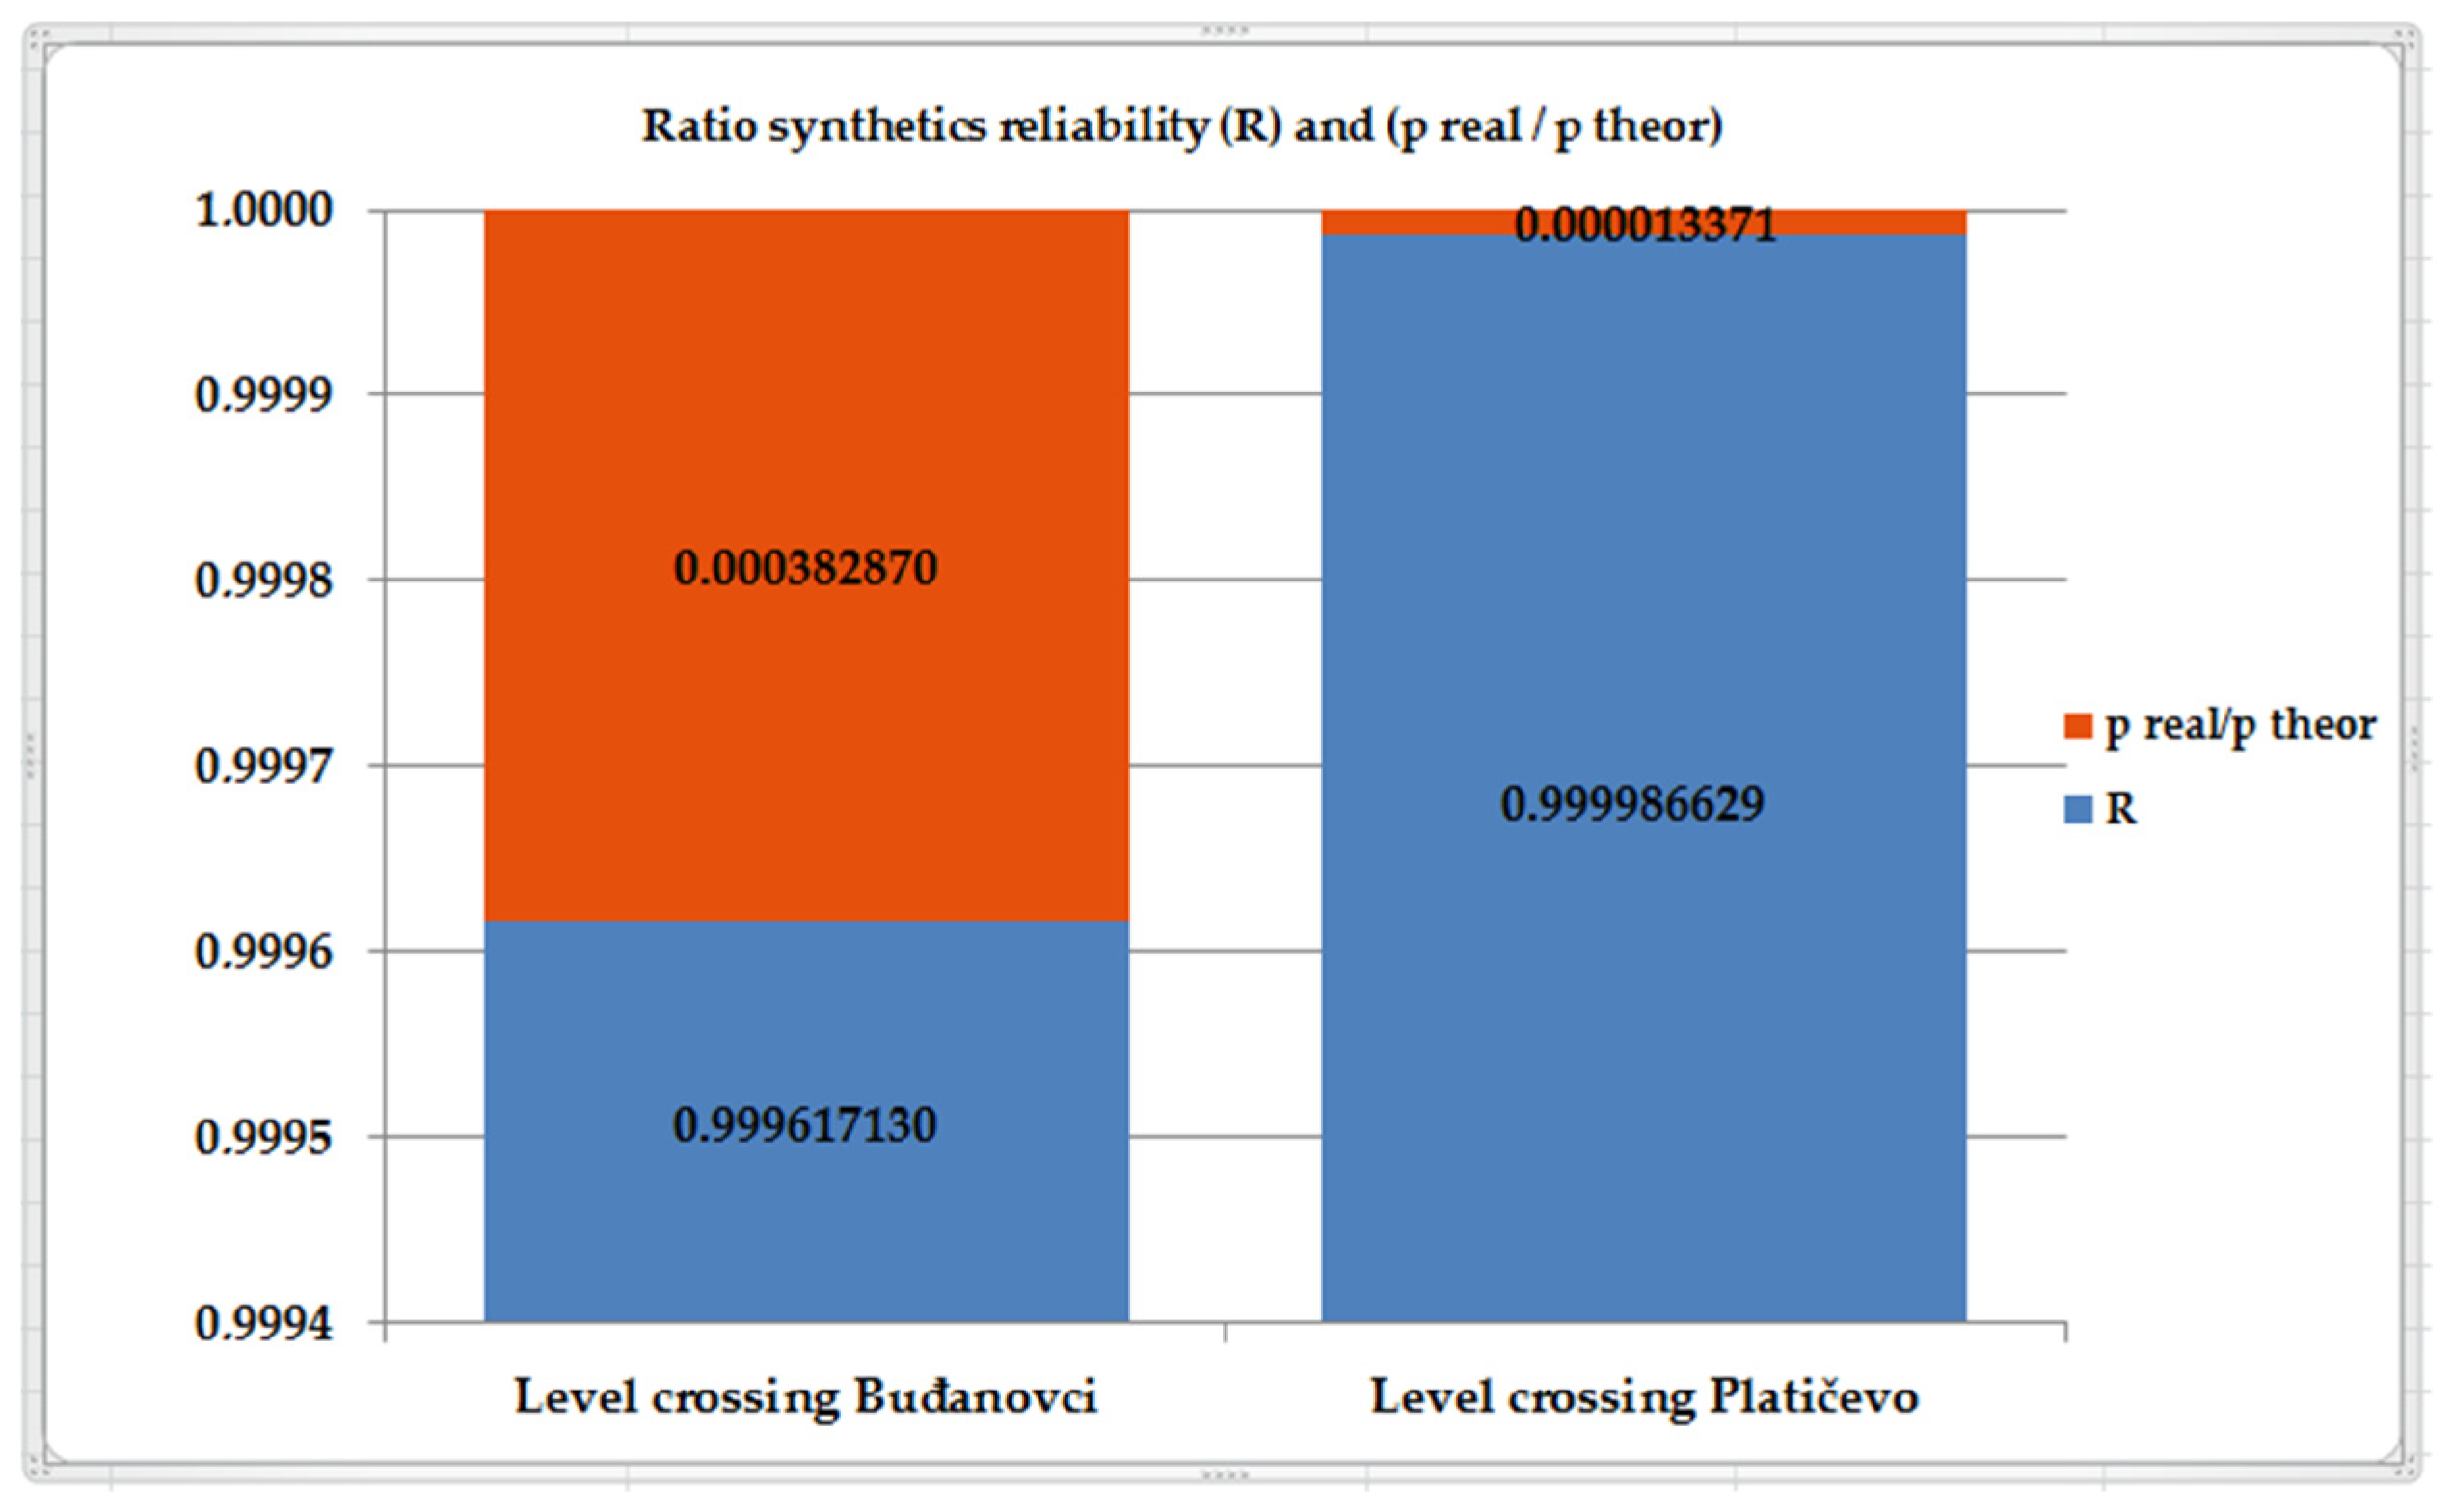
| Level Crossing Buđanovci | Level Crossing Platičevo | |
|---|---|---|
| R | 0.999617130 | 0.999986629 |
| preal/ptheor | 0.000382870 | 0.000013371 |
| Risk | Level Crossing Buđanovci | Level Crossing Platičevo |
|---|---|---|
| r | 0.00038287 | 1.33707 × 10⁻⁵ |
| Number of Accidents, Injuries and Deaths | Value |
|---|---|
| Number of accidents in the period from 23 years (1996–2020) | 12 |
| Number of persons who were deaths at the level crossing (1996–2020) | 2 |
| Number of persons who were seriously injured at the level crossing (1996–2020) | 4 |
| Number of persons who were lightly injured at the level crossing (1996–2020) | 1 |
Publisher’s Note: MDPI stays neutral with regard to jurisdictional claims in published maps and institutional affiliations. |
© 2021 by the authors. Licensee MDPI, Basel, Switzerland. This article is an open access article distributed under the terms and conditions of the Creative Commons Attribution (CC BY) license (https://creativecommons.org/licenses/by/4.0/).
Share and Cite
Ercegovac, P.; Stojić, G.; Kopić, M.; Stević, Ž.; Sinani, F.; Tanackov, I. Model for Risk Calculation and Reliability Comparison of Level Crossings. Entropy 2021, 23, 1230. https://doi.org/10.3390/e23091230
Ercegovac P, Stojić G, Kopić M, Stević Ž, Sinani F, Tanackov I. Model for Risk Calculation and Reliability Comparison of Level Crossings. Entropy. 2021; 23(9):1230. https://doi.org/10.3390/e23091230
Chicago/Turabian StyleErcegovac, Pamela, Gordan Stojić, Miloš Kopić, Željko Stević, Feta Sinani, and Ilija Tanackov. 2021. "Model for Risk Calculation and Reliability Comparison of Level Crossings" Entropy 23, no. 9: 1230. https://doi.org/10.3390/e23091230
APA StyleErcegovac, P., Stojić, G., Kopić, M., Stević, Ž., Sinani, F., & Tanackov, I. (2021). Model for Risk Calculation and Reliability Comparison of Level Crossings. Entropy, 23(9), 1230. https://doi.org/10.3390/e23091230


