Aiming at the complex working environment of special mechanical equipment, data collection is difficult, and the amount of data is small. This paper presents a method for predicting the remaining service life of small sample bearings based on data twin driving. First of all, feature extraction is carried out on the actual data to form a high-dimensional feature dataset. Then, an improved self-organizing feature mapping method (ISOFM) is used to select features, calculate the numerical probability density intervals of features corresponding to sensitive features, determine the optimal number of sensitive features, and form a feature framework. The feature framework is combined with existing data to form an interactive dataset with missing data, and CatBoost integrated learning algorithm is introduced. The missing eigenvalues are taken as the feature learning objectives of CatBoost, respectively, and their regression operation characteristics are used to complement the interactive dataset, thus forming a complete twin dataset. Finally, the macro and micro attention mechanisms are combined with BiLSTM to form MMA-BiLSTM. The weight of MMA-BiLSTM is amplified in the whole time dimension and each time dimension to realize the residual life prediction of bearings.
3.2. MMA-BiLSTM
The derivation of BiLSTM based on macro and micro attention mechanisms is as follows: macro and micro attention mechanisms refer to the operation of the attention mechanism on the whole time dimension of input data and data on each time dimension. Specifically, firstly, the data matrix generated by digital twins is processed, and its macro and micro attention coefficients are calculated using MMA. In the prediction process, the input dataset of the whole time dimension is
. Where
represents the input data at time
, and the macro attention mechanism processes the data in the whole time dimension through the attention mechanism; the micro attention mechanism is to use the attention mechanism to process input data
in each time dimension [
25].
The formula for calculating macro and micro attention coefficients:
Where
is the attention coefficient of input data in the micro attention mechanism.
is the macro attention coefficient obtained in the whole time dimension.
is the mean value of
,
is the
element in the input data
at the time of
,
is the dimension of the input dataset
,
is the mean value of the
vector in the input dataset
, and
is the query vector. In the MMA-BiLSTM network training process, set the macro level query vector
and the micro level query vector
; the relevant scoring function is calculated as follows:
Where is the dimension of input data at time .
According to the corresponding macro and micro attention coefficients, the associated input data weights and recursive data weights are magnified at multiple levels.
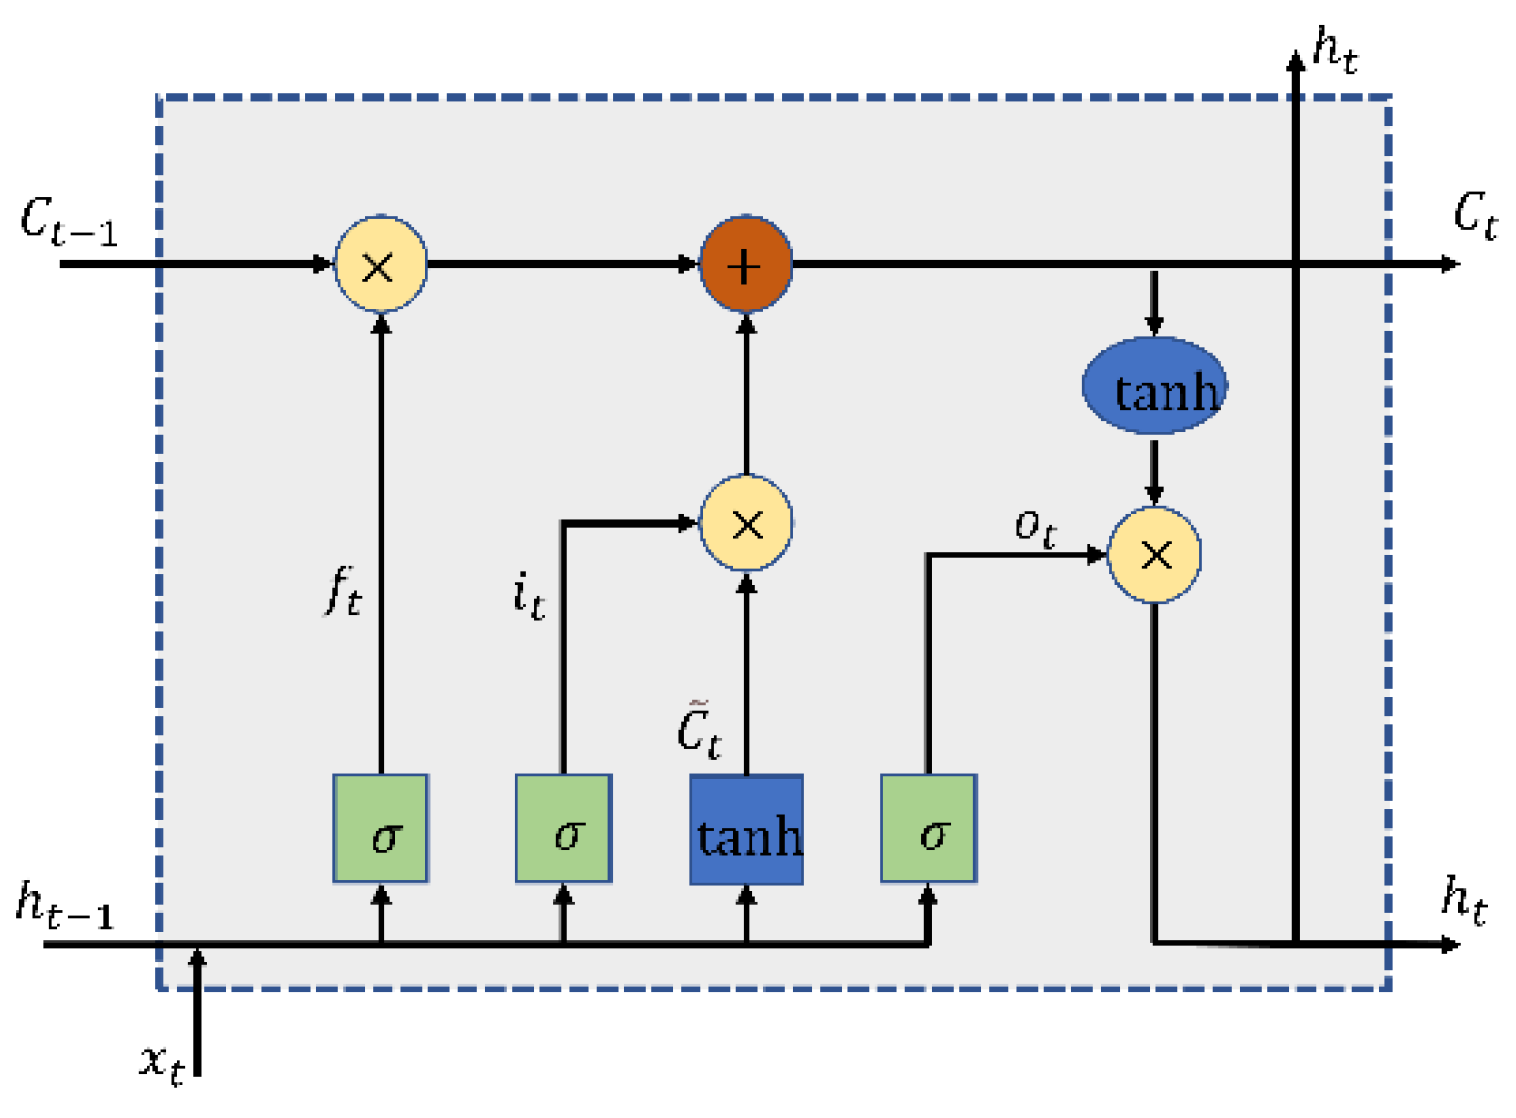
Wherein, represents the weight between the input data of the BiLSTM neural network and the input gate in the hidden layer, represents the weight between the input data of the BiLSTM neural network and the output gate in the hidden layer, represents the weight between the input data of the LSTM neural network and the forgetting gate in the hidden layer, represents the weight between the input data of the MMA-BiLSTM neural network and the input gate in the hidden layer, represents the weight between the input data of MMA-BiLSTM neural network and the output gate in the hidden layer, and represents the weight between the input data of MMA-BiLSTM neural network and the forgetting gate in the hidden layer.
According to the amplification of input data weight and recursive number weight, the corresponding calculation results are obtained:
Wherein, is sigmoid activation function, is linear activation function, is MMA-BilLSTM hidden layer input gate offset term, is MMA-BiLSTM hidden layer forgetting gate offset term, is MMA-BiLSTM hidden layer storage cell unit offset term, is MMA-BiLSTM hidden layer output gate offset term, is MMA-BiLSTM output layer offset term, is the input gate output at time, is the forgetting gate output at time, is the storage cell unit output at time, and is the output layer output at time.
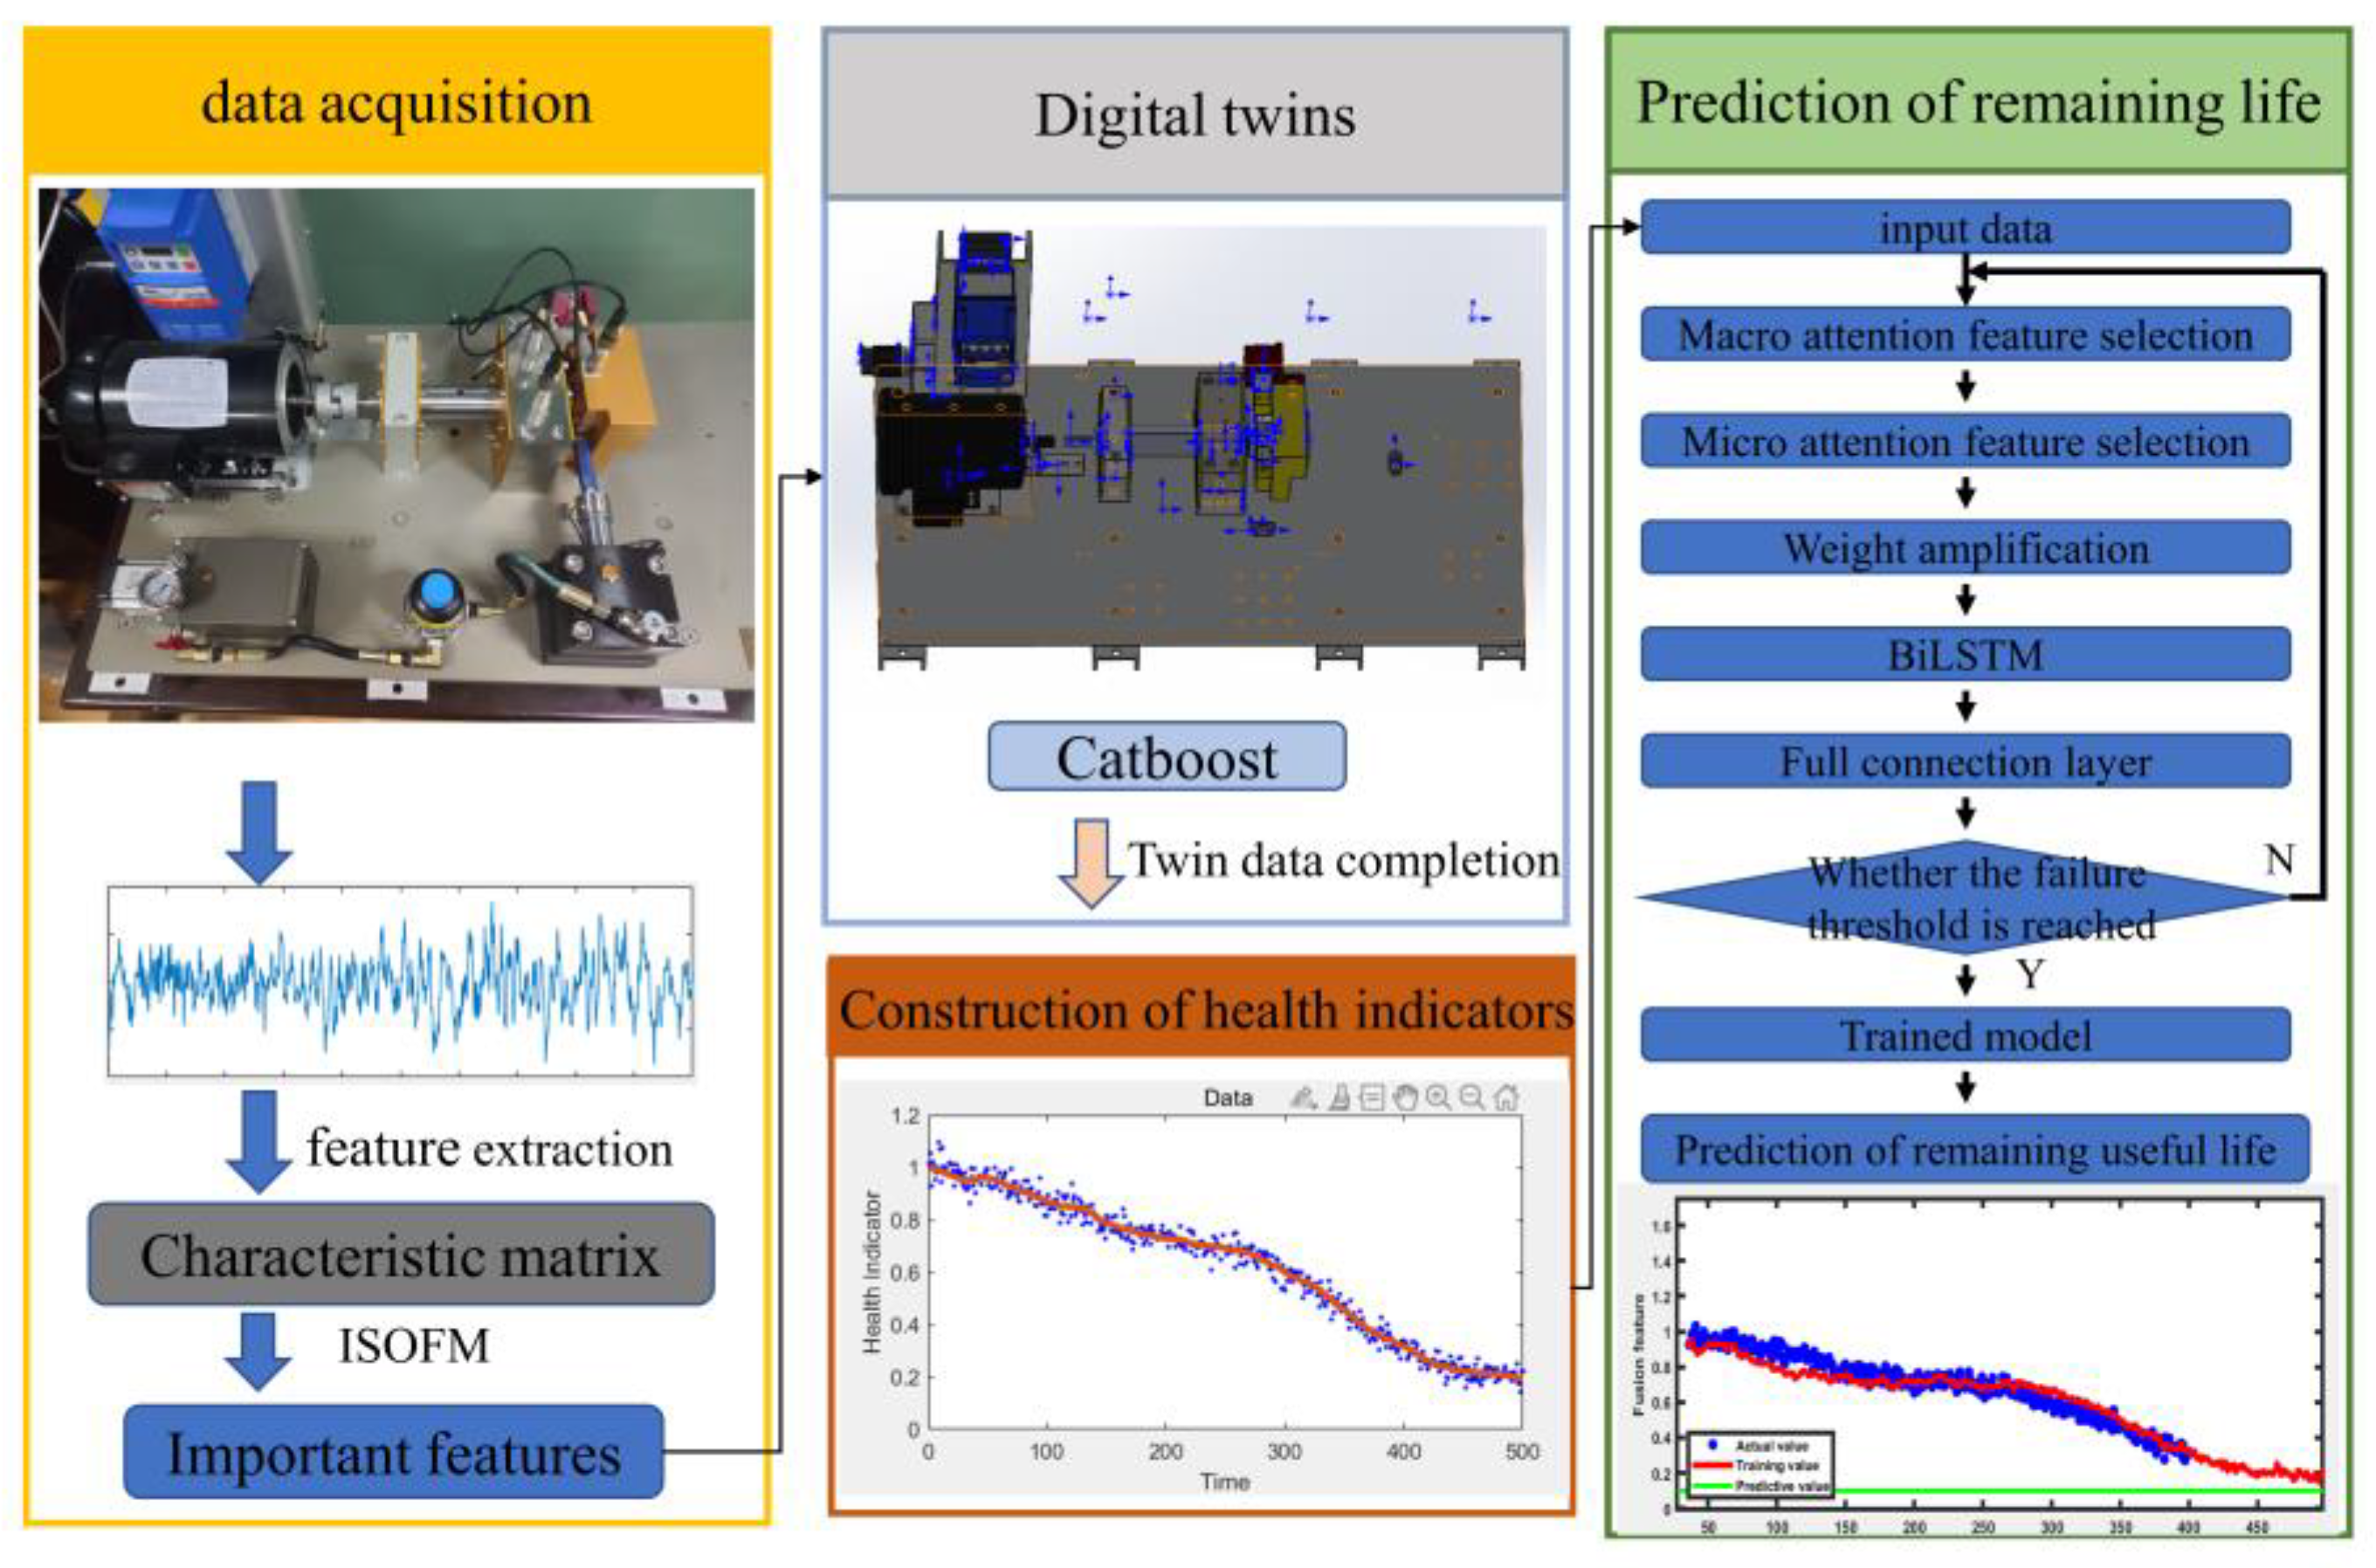
The bearing vibration data are collected separately as samples, and the data samples are twin expanded. Finally, different machine learning methods are used to compare the prediction accuracy between the original sample and the interactive dataset. The specific process and structure of the proposed method can be shown in
Figure 2. The specific steps of the proposed method are shown as follows:
(1) Set up a test platform to collect vibration signals of bearings from normal operation to fault status;
(2) Extraction of time-domain and frequency-domain features of vibration signals from the original signal;
(3) Use ISOFM to determine the number of sensitive features and select features from the acquired feature data set, and extract the main features in the feature set that can determine the signal category;
(4) The probability density distribution models of sensitive features in feature data sets are constructed, respectively; determine the feature frame and the selection range of its feature values;
(5) The feature data frame generated is combined with the feature data set extracted from the initial samples interactively, and the data at the nonsensitive features are represented by missing values;
(6) The CatBoost regression algorithm is used to fill in the missing values in the interactive dataset containing missing values. Sorted according to importance, the missing value is used as the prediction target to fill the characteristic value. During the filling process, the missing values of other features are filled with the feature mean value;
(7) An interactive dataset with a complete data structure is obtained, i.e., a twin feature dataset that expresses vibration signal fault information obtained from a small amount of data. The dataset is normalized to fit the health indicators of the bearing;
(8) Use the first k health indicators of the bearing as network input to predict the health value at moment k + 1;
(9) Repeat step 8 a certain number of times, and when these output values are less than 0, the inverse normalization of the sampled points results in RUL.


