
Entropy Analysis of Neonatal Electrodermal Activity during the First Three Days after Birth


Abstract
:1. Introduction
2. Materials and Methods
2.1. Participants
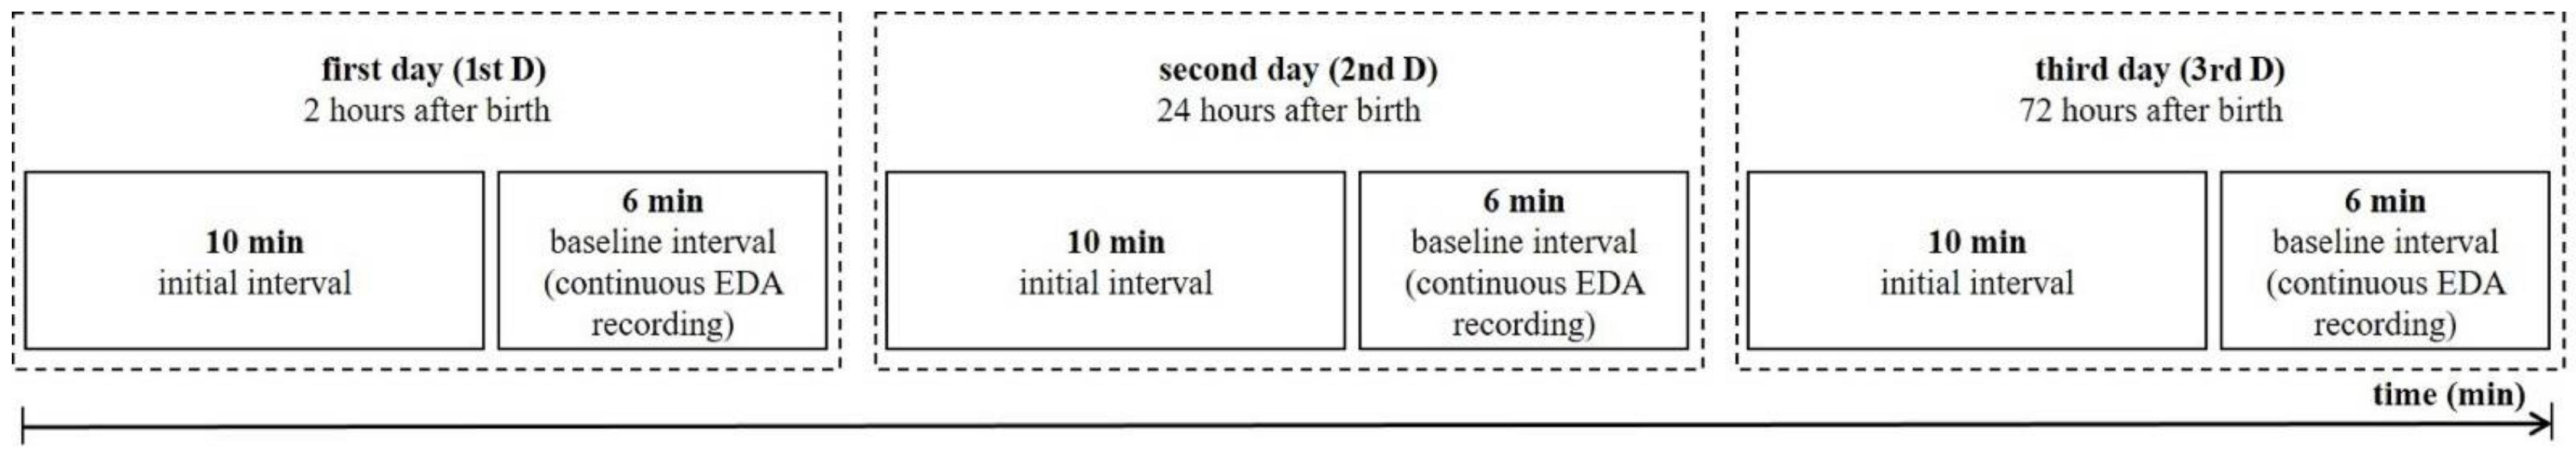
2.2. Protocol
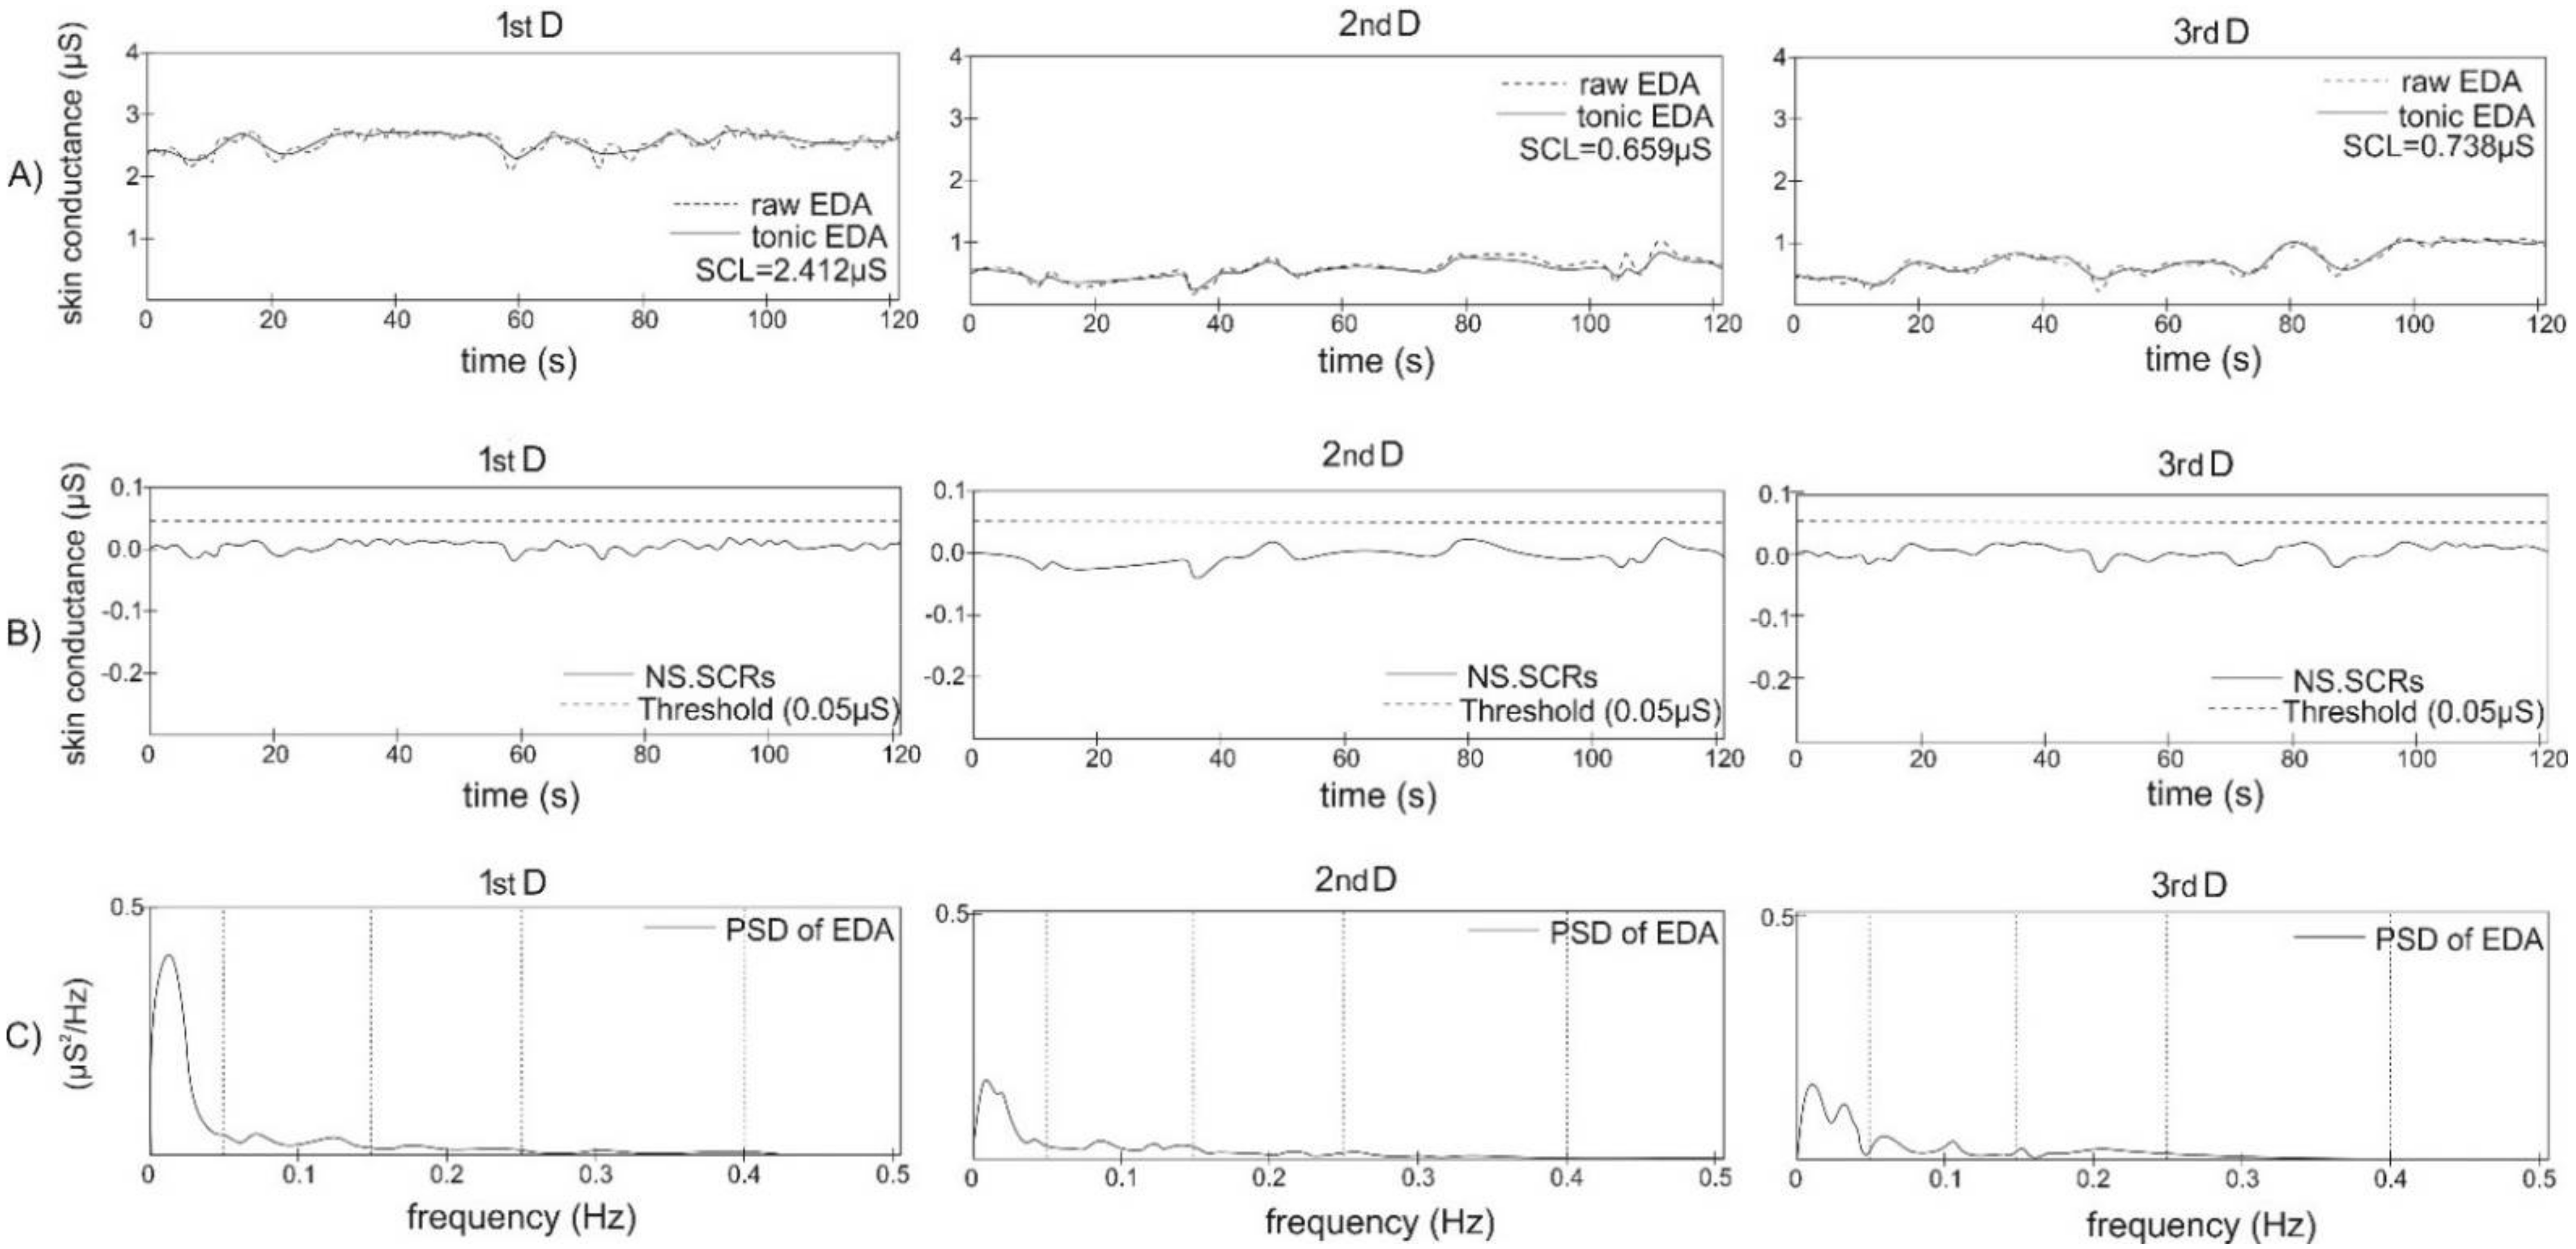
2.3. Data Analysis
2.4. Approximate Entropy
2.5. Sample Entropy
2.6. Fuzzy Entropy
2.7. Permutation Entropy
2.8. Shannon Entropy
2.9. Symbolic Information Entropy
2.10. Statistical Analysis
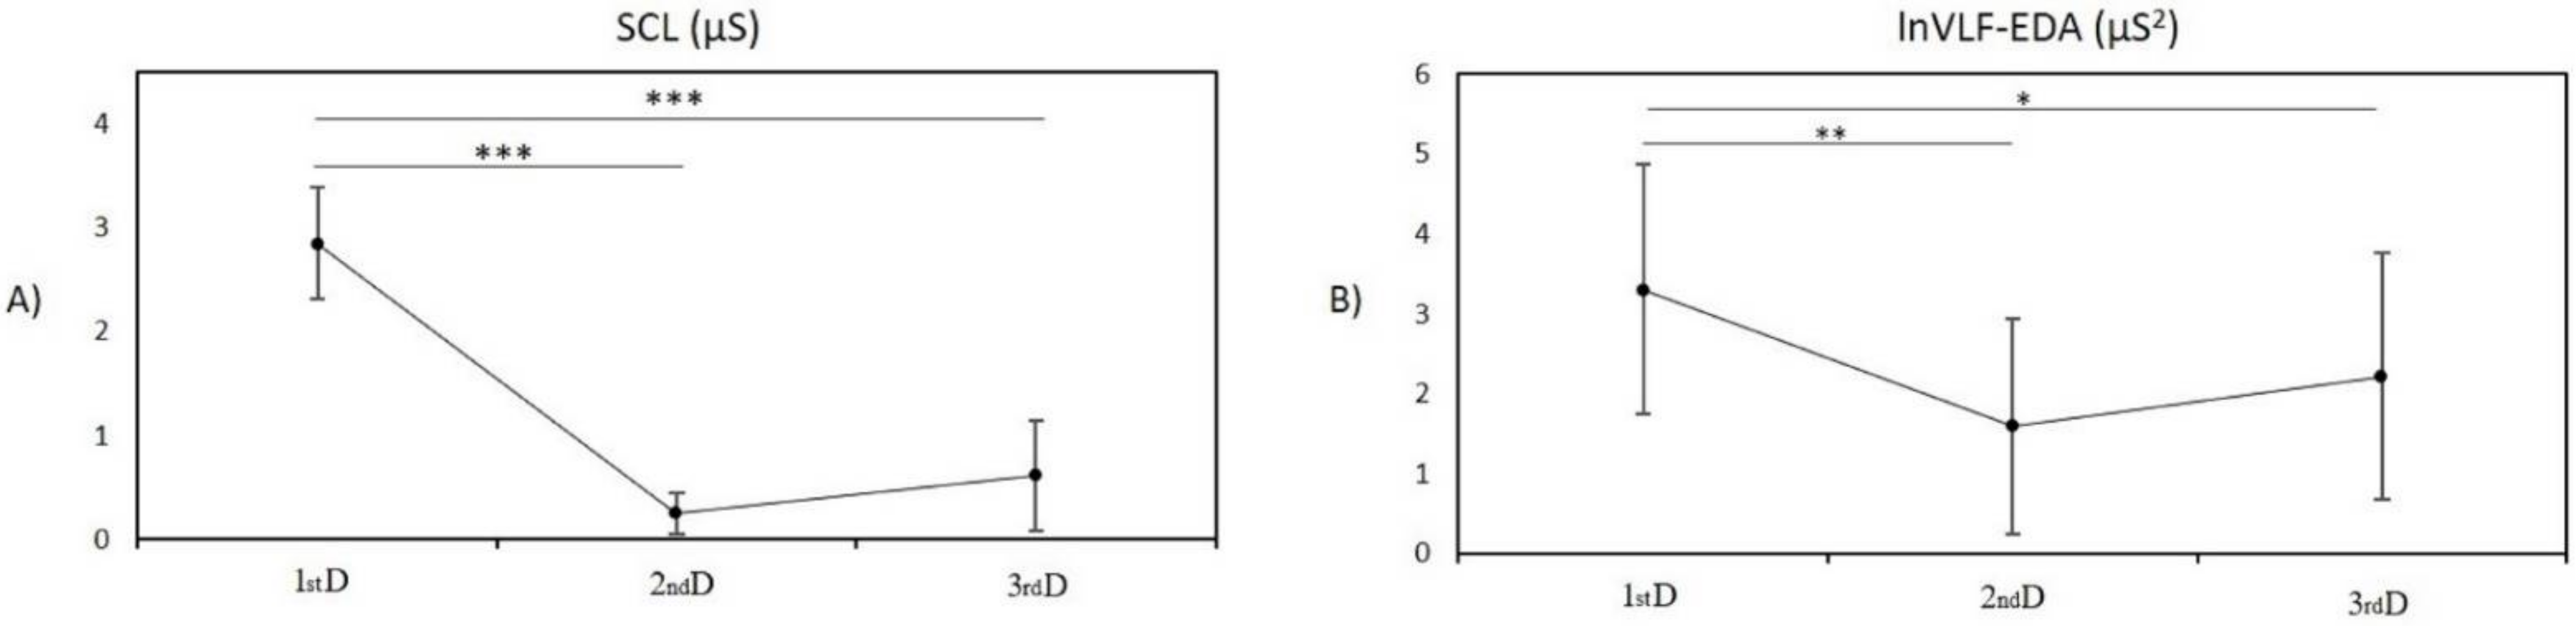
3. Results
3.1. Entropy Analysis
3.1.1. Post Hoc Pairwise Comparison between Measurement in the First Day and Second Day
3.1.2. Post Hoc Pairwise Comparison between Measurement in the First Day and Third Day
3.1.3. Post Hoc Pairwise Comparison between Measurement on the Second Day and Third Day
4. Discussion
5. Conclusions
Author Contributions
Funding
Institutional Review Board Statement
Informed Consent Statement
Data Availability Statement
Conflicts of Interest
References
- Posada-Quintero, H.F.; Florian, J.P.; Orjuela-Cañón, A.D.; Aljama-Corrales, T.; Charleston-Villalobos, S.; Chon, K.H. Power Spectral Density Analysis of Electrodermal Activity for Sympathetic Function Assessment. Ann. Biomed. Eng. 2016, 44, 3124–3135. [Google Scholar] [CrossRef] [PubMed]
- Posada-Quintero, H.F.; Dimitrov, T.; Moutran, A.; Park, S.; Chon, K.H. Analysis of Reproducibility of Noninvasive Measures of Sympathetic Autonomic Control Based on Electrodermal Activity and Heart Rate Variability. IEEE Access 2019, 7, 22523–22531. [Google Scholar] [CrossRef]
- Tranel, D.; Damasio, H. Neuroanatomical correlates of electrodermal skin conductance responses. Psychophysiology 1994, 31, 427–438. [Google Scholar] [CrossRef]
- Longin, E.; Gerstner, T.; Schaible, T.; Lenz, T.; König, S. Maturation of the autonomic nervous system: Differences in heart rate variability in premature vs. term infants. J. Perinat. Med. 2006, 34, 303–308. [Google Scholar] [CrossRef]
- Mulkey, S.B.; du Plessis, A.J. Autonomic nervous system development and its impact on neuropsychiatric outcome. Pediatr. Res. 2019, 85, 120–126. [Google Scholar] [CrossRef]
- Fyfe, K.L.; Yiallourou, S.R.; Wong, F.Y.; Odoi, A.; Walker, A.M.; Horne, R.S.C. The Effect of Gestational Age at Birth on Post-Term Maturation of Heart Rate Variability. Sleep 2015, 38, 1635–1644. [Google Scholar] [CrossRef] [PubMed] [Green Version]
- Malliani, A.; Lombardi, F.; Pagani, M. Power spectrum analysis of heart rate variability: A tool to explore neural regulatory mechanisms. Br. Heart J. 1994, 71, 1–2. [Google Scholar] [CrossRef] [Green Version]
- Garabedian, C.; Champion, C.; Servan-Schreiber, E.; Butruille, L.; Aubry, E.; Sharma, D.; Logier, R.; Deruelle, P.; Storme, L.; Houfflin-Debarge, V.; et al. A new analysis of heart rate variability in the assessment of fetal parasympathetic activity: An experimental study in a fetal sheep model. PLoS ONE 2017, 12, e0180653. [Google Scholar] [CrossRef] [Green Version]
- Boucsein, W. Electrodermal Activity, 2nd ed.; Sprinder: London, UK, 2012. [Google Scholar]
- Dawson, M.E.; Schell, A.M.; Filion, D.L. The Electrodermal System. In Handbook of Psychophysiology; Cacioppo, J.T., Tassinary, L.G., Berntson, G.G., Eds.; Cambridge University Press: Cambridge, MA, USA, 2000; pp. 200–223. ISBN 62634X. [Google Scholar]
- Posada-Quintero, H.; Chon, K. Innovations in Electrodermal Activity Data Collection and Signal Processing: A Systematic Review. Sensors 2020, 20, 479. [Google Scholar] [CrossRef] [Green Version]
- Cacioppo, J.; Tassinary, L.; Berntson, G. Handbook of Psychophysiology, 3rd ed.; Cambridge University Press: Cambridge, MA, USA, 2007. [Google Scholar]
- Silva Moreira, P.; Chaves, P.; Dias, R.; Dias, N.; Almeida, P.R. Validation of Wireless Sensors for Psychophysiological Studies. Sensors 2019, 19, 4824. [Google Scholar] [CrossRef] [Green Version]
- Braithwaite, J.; Watson, D.; Jones, R.; Rowe, M.A. Guide for Analysing Electrodermal Activity & Skin Conductance Responses for Psychological Experiments; University of Birmingham: Birmingham, UK, 2013. [Google Scholar]
- Kaye, H. Skin Conductance in the Human Neonate. Child Dev. 1964, 35, 1297–1305. [Google Scholar] [CrossRef] [PubMed]
- Wass, S.V.; de Barbaro, K.; Clackson, K. Tonic and phasic co-variation of peripheral arousal indices in infants. Biol. Psychol. 2015, 111, 26–39. [Google Scholar] [CrossRef] [Green Version]
- Hernes, K.G.; Mørkrid, L.; Fremming, A.; Ødegården, S.; Martinsen, Ø.G.; Storm, H. Skin Conductance Changes During the First Year of Life in Full-Term Infants. Pediatr. Res. 2002, 52, 837–843. [Google Scholar] [CrossRef]
- Piacentini, R. Emotions at Fingertips: Revealing Individual Features in Galvanic Skin Response Signals; Università degli studi di Roma “La Sapienza”: Rome, Italy, 2004. [Google Scholar]
- Yang, Z.; Liu, G. An entropy measure of emotional arousal via skin conductance response. J. Fiber Bioeng. Inform. 2014, 7, 67–80. [Google Scholar] [CrossRef]
- Amarantidis, L.C.; Abásolo, D. Interpretation of Entropy Algorithms in the Context of Biomedical Signal Analysis and Their Application to EEG Analysis in Epilepsy. Entropy 2019, 21, 840. [Google Scholar] [CrossRef] [Green Version]
- Bandt, C.; Pompe, B. Permutation entropy: A natural complexity measure for time series. Phys. Rev. Lett. 2002, 88, 174102. [Google Scholar] [CrossRef] [PubMed]
- Eckmann, J.-P.; Ruelle, D. Fundamental limitations for estimating dimensions and Lyapunov exponents in dynamical systems. Phys. D Nonlinear Phenom. 1992, 56, 185–187. [Google Scholar] [CrossRef]
- Luppa, M.; Heinrich, S.; Angermeyer, M.C.; König, H.-H.; Riedel-Heller, S.G. Cost-of-illness studies of depression: A systematic review. J. Affect. Disord. 2007, 98, 29–43. [Google Scholar] [CrossRef]
- Bolea, J.; Laguna, P.; Remartínez, J.M.; Rovira, E.; Navarro, A.; Bailón, R. Methodological Framework for Estimating the Correlation Dimension in HRV Signals. Comput. Math. Methods Med. 2014, 2014, 129248. [Google Scholar] [CrossRef]
- Byun, S.; Kim, A.Y.; Jang, E.H.; Kim, S.; Choi, K.W.; Yu, H.Y.; Jeon, H.J. Entropy analysis of heart rate variability and its application to recognize major depressive disorder: A pilot study. Technol. Health Care 2019, 27, 407–424. [Google Scholar] [CrossRef] [Green Version]
- Zhang, D.; Ding, H.; Liu, Y.; Zhou, C.; Ding, H.; Ye, D. Neurodevelopment in newborns: A sample entropy analysis of electroencephalogram. Physiol. Meas. 2009, 30, 491–504. [Google Scholar] [CrossRef] [PubMed]
- Lucchini, M.; Pini, N.; Fifer, W.P.; Burtchen, N.; Signorini, M.G. Entropy Information of Cardiorespiratory Dynamics in Neonates during Sleep. Entropy 2017, 19, 225. [Google Scholar] [CrossRef] [PubMed] [Green Version]
- Pini, N.; Lucchini, M.; Fifer, W.; Burtchen, N.; Signorini, M. Lagged Transfer Entropy Analysis to Investigate Cardiorespiratory Regulation in Newborns during Sleep. In Proceedings of the 12th International Joint Conference on Biomedical Engineering Systems and Technologies-BIOSIGNALS, Prague, Czech Republic, 22–24 February 2019; pp. 139–146. [Google Scholar]
- Boucsein, W.; Fowles, D.C.; Grimnes, S.; Ben-Shakhar, G.; Roth, W.T.; Dawson, M.E.; Filion, D.L. Publication recommendations for electrodermal measurements. Psychophysiology 2012, 49, 1017–1034. [Google Scholar] [CrossRef] [PubMed]
- Fowles, D.C. The Measurement of Electrodermal Activity in Children. In Developmental Psychophysiology: Theory, Systems, and Methods; Schmidt, L.A., Segalowitz, S.J., Eds.; Cambridge University Press: Cambridge, MA, USA, 2007; pp. 286–316. [Google Scholar]
- Venables, P.H.; Gartshore, S.A.; O’Riordan, P.W. The function of skin conductance response recovery and rise time. Biol. Psychol. 1980, 10, 1–6. [Google Scholar] [CrossRef]
- Dawson, M.E.; Schell, A.M.; Filion, D.L. The Electrodermal System. In Handbook of Psychophysiology; Cacioppo, J.T., Tassinary, L.G., Berntson, G.G., Eds.; Cambridge University Press: Cambridge, MA, USA, 2007; pp. 159–181. [Google Scholar]
- Pincus, S.M. Approximate entropy as a measure of system complexity. Proc. Natl. Acad. Sci. USA 1991, 88, 2297–2301. [Google Scholar] [CrossRef] [Green Version]
- Richman, J.S.; Moorman, J.R. Physiological time-series analysis using approximate and sample entropy. Am. J. Physiol. Heart Circ. Physiol. 2000, 278. [Google Scholar] [CrossRef] [Green Version]
- Pincus, S.M.; Goldberger, A.L. Physiological time-series analysis: What does regularity quantify? Am. J. Physiol. Heart Circ. Physiol. 1994, 266. [Google Scholar] [CrossRef]
- Kaffashi, F.; Foglyano, R.; Wilson, C.G.; Loparo, K.A. The effect of time delay on Approximate & Sample Entropy calculations. Phys. D Nonlinear Phenom. 2008, 237, 3069–3074. [Google Scholar] [CrossRef]
- Yentes, J.M.; Hunt, N.; Schmid, K.K.; Kaipust, J.P.; McGrath, D.; Stergiou, N. The appropriate use of approximate entropy and sample entropy with short data sets. Ann. Biomed. Eng. 2013, 41, 349–365. [Google Scholar] [CrossRef]
- Lake, D.E.; Richman, J.S.; Griffin, M.P.; Moorman, J.R. Sample entropy analysis of neonatal heart rate variability. Am. J. Physiol. Regul. Integr. Comp. Physiol. 2002, 283, R789–R797. [Google Scholar] [CrossRef] [Green Version]
- Chen, W.; Wang, Z.; Xie, H.; Yu, W. Characterization of Surface EMG Signal Based on Fuzzy Entropy. IEEE Trans. Neural Syst. Rehabil. Eng. 2007, 15, 266–272. [Google Scholar] [CrossRef] [PubMed]
- Zadeh, L.A. Fuzzy sets. Inf. Control 1965, 8, 338–353. [Google Scholar] [CrossRef] [Green Version]
- Al-sharhan, S.; Karray, F.; Gueaieb, W.; Basir, O. Fuzzy entropy: A brief survey. In Proceedings of the 10th IEEE International Conference on Fuzzy Systems. (Cat. No.01CH37297), Melbourne, VIC, Australia, 2–5 December 2001; Volume 3, pp. 1135–1139. [Google Scholar]
- Restrepo, J.F.; Schlotthauer, G.; Torres, M.E. Maximum approximate entropy and r threshold: A new approach for regularity changes detection. Phys. A Stat. Mech. Its Appl. 2014, 409, 97–109. [Google Scholar] [CrossRef] [Green Version]
- Xie, H.-B.; Chen, W.-T.; He, W.-X.; Liu, H. Complexity analysis of the biomedical signal using fuzzy entropy measurement. Appl. Soft Comput. 2011, 11, 2871–2879. [Google Scholar] [CrossRef]
- Zhang, T.; Chen, W.; Li, M. Fuzzy distribution entropy and its application in automated seizure detection technique. Biomed. Signal Process. Control 2018, 39, 360–377. [Google Scholar] [CrossRef]
- Zhao, X.; Shang, P.; Huang, J. Permutation complexity and dependence measures of time series. EPL 2013, 102, 40005. [Google Scholar] [CrossRef]
- Zunino, L.; Olivares, F.; Scholkmann, F.; Rosso, O.A. Permutation entropy based time series analysis: Equalities in the input signal can lead to false conclusions. Phys. Lett. A 2017, 381, 1883–1892. [Google Scholar] [CrossRef] [Green Version]
- Wu, Y.; Chen, P.; Luo, X.; Wu, M.; Liao, L.; Yang, S.; Rangayyan, R.M. Measuring signal fluctuations in gait rhythm time series of patients with Parkinson’s disease using entropy parameters. Biomed. Signal Process. Control 2017, 31, 265–271. [Google Scholar] [CrossRef]
- Mengarelli, A.; Tigrini, A.; Fioretti, S.; Cardarelli, S.; Verdini, F. On the Use of Fuzzy and Permutation Entropy in Hand Gesture Characterization from EMG Signals: Parameters Selection and Comparison. Appl. Sci. 2020, 10, 7144. [Google Scholar] [CrossRef]
- Shannon, C.E.; Weaver, W. He Mathematical Theory of Communication; University of Illinois Press: Champaign, IL, USA, 1949. [Google Scholar]
- Robert, A. Information Theory; Dover Publications: New York, NY, USA, 1990. [Google Scholar]
- Porta, A.; Baselli, G.; Liberati, D.; Montano, N.; Cogliati, C.; Gnecchi-Ruscone, T.; Malliani, A.; Cerutti, S. Measuring regularity by means of a corrected conditional entropy in sympathetic outflow. Biol. Cybern. 1998, 78, 71–78. [Google Scholar] [CrossRef]
- Porta, A.; Guzzetti, S.; Montano, N.; Furlan, R.; Pagani, M.; Malliani, A.; Cerutti, S. Entropy, entropy rate, and pattern classification as tools to typify complexity in short heart period variability series. IEEE Trans. Biomed. Eng. 2001, 48, 1282–1291. [Google Scholar] [CrossRef] [PubMed]
- Ghasemi, A.; Zahediasl, S. Normality tests for statistical analysis: A guide for non-statisticians. Int. J. Endocrinol. Metab. 2012, 10, 486–489. [Google Scholar] [CrossRef] [PubMed] [Green Version]
- Neyman, J.; Pearson, E.S. On the Use and Interpretation of Certain Test Criteria for Purposes of Statistical Inference Part I. Biometrika 1928, 20A, 175–240. [Google Scholar] [CrossRef]
- Dunn, O.J. Multiple Comparisons among Means. J. Am. Stat. Assoc. 1961, 56, 52–64. [Google Scholar] [CrossRef]
- Streiner, D.L.; Norman, G.R. Correction for multiple testing: Is there a resolution? Chest 2011, 140, 16–18. [Google Scholar] [CrossRef]
- Armstrong, R.A.; Davies, L.N.; Dunne, M.C.M.; Gilmartin, B. Statistical guidelines for clinical studies of human vision. Ophthalmic Physiol. Opt. 2011, 31, 123–136. [Google Scholar] [CrossRef]
- Armstrong, R.A.; Slade, S.V.; Eperjesi, F. An introduction to analysis of variance (ANOVA) with special reference to data from clinical experiments in optometry. Ophthalmic Physiol. Opt. 2000, 20, 235–241. [Google Scholar] [CrossRef]
- Schlatterer, S.D.; Govindan, R.B.; Barnett, S.D.; Al-Shargabi, T.; Reich, D.A.; Iyer, S.; Hitchings, L.; Larry Maxwell, G.; Baker, R.; du Plessis, A.J.; et al. Autonomic development in preterm infants is associated with morbidity of prematurity. Pediatr. Res. 2022, 91, 171–177. [Google Scholar] [CrossRef] [PubMed]
- Pincus, S.M.; Huang, W.-M. Approximate entropy: Statistical properties and applications. Commun. Stat. Theory Methods 1992, 21, 3061–3077. [Google Scholar] [CrossRef]
- Azami, H.; Faes, L.; Escudero, J.; Humeau-Heurtier, A.; da Silva, L.E.V. Entropy Analysis of Univariate Biomedical Signals: Review and Comparison of Methods. Available online: http://www.lucafaes.net/pubs_content/other/B08-EntropyAnalysis_submitted.pdf (accessed on 8 February 2022).
- Li, P.; Karmakar, C.; Yearwood, J.; Venkatesh, S.; Palaniswami, M.; Liu, C. Detection of epileptic seizure based on entropy analysis of short-term EEG. PLoS ONE 2018, 13, e0193691. [Google Scholar] [CrossRef] [Green Version]
- Cerritelli, F.; Frasch, M.G.; Antonelli, M.C.; Viglione, C.; Vecchi, S.; Chiera, M.; Manzotti, A. A Review on the Vagus Nerve and Autonomic Nervous System During Fetal Development: Searching for Critical Windows. Front. Neurosci. 2021, 15, 721605. [Google Scholar] [CrossRef] [PubMed]
- Asahina, M.; Suzuki, A.; Mori, M.; Kanesaka, T.; Hattori, T. Emotional sweating response in a patient with bilateral amygdala damage. Int. J. Psychophysiol. 2003, 47, 87–93. [Google Scholar] [CrossRef]

Publisher’s Note: MDPI stays neutral with regard to jurisdictional claims in published maps and institutional affiliations. |
© 2022 by the authors. Licensee MDPI, Basel, Switzerland. This article is an open access article distributed under the terms and conditions of the Creative Commons Attribution (CC BY) license (https://creativecommons.org/licenses/by/4.0/).
Share and Cite
Visnovcova, Z.; Kozar, M.; Kuderava, Z.; Zibolen, M.; Ferencova, N.; Tonhajzerova, I. Entropy Analysis of Neonatal Electrodermal Activity during the First Three Days after Birth. Entropy 2022, 24, 422. https://doi.org/10.3390/e24030422
Visnovcova Z, Kozar M, Kuderava Z, Zibolen M, Ferencova N, Tonhajzerova I. Entropy Analysis of Neonatal Electrodermal Activity during the First Three Days after Birth. Entropy. 2022; 24(3):422. https://doi.org/10.3390/e24030422
Chicago/Turabian StyleVisnovcova, Zuzana, Marek Kozar, Zuzana Kuderava, Mirko Zibolen, Nikola Ferencova, and Ingrid Tonhajzerova. 2022. "Entropy Analysis of Neonatal Electrodermal Activity during the First Three Days after Birth" Entropy 24, no. 3: 422. https://doi.org/10.3390/e24030422
APA StyleVisnovcova, Z., Kozar, M., Kuderava, Z., Zibolen, M., Ferencova, N., & Tonhajzerova, I. (2022). Entropy Analysis of Neonatal Electrodermal Activity during the First Three Days after Birth. Entropy, 24(3), 422. https://doi.org/10.3390/e24030422