
Impact of Surface Roughness on Flow Physics and Entropy Generation in Jet Impingement Applications

 ,
, 
Abstract
:1. Introduction
2. Computational Setup and Numerical Scheme
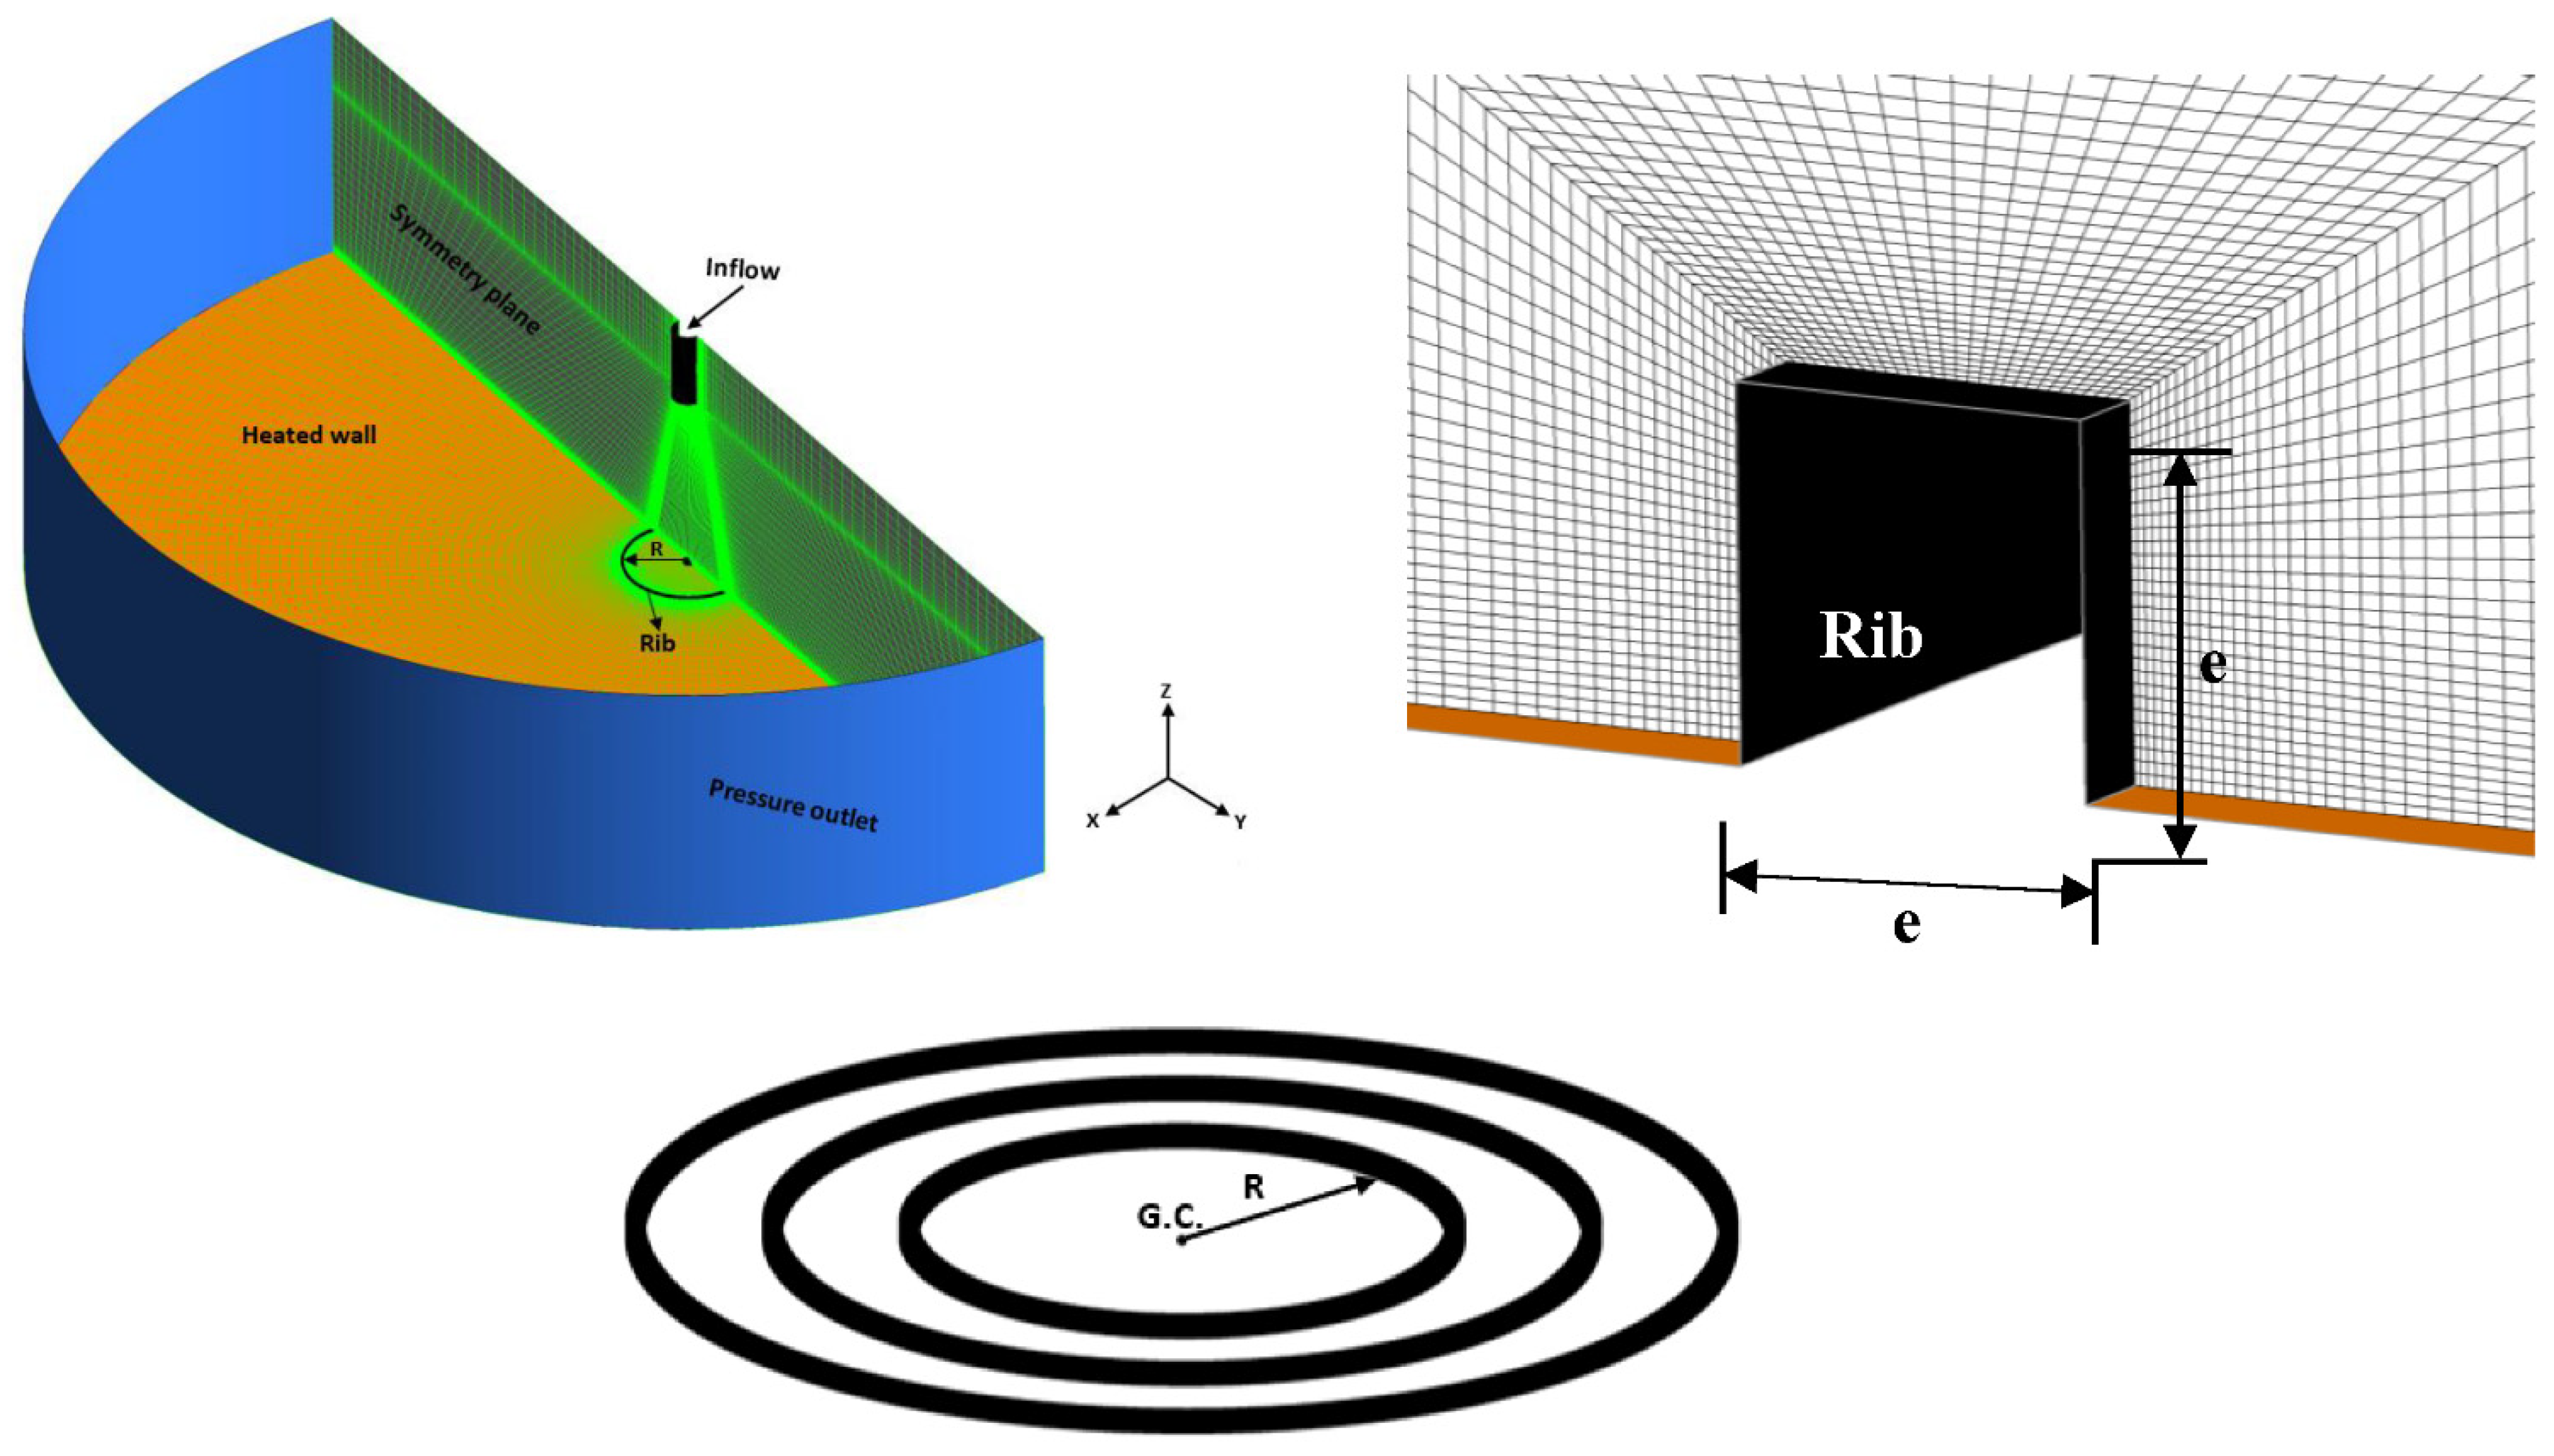
2.1. Computational Domain and Assumptions
2.2. Governing Equations
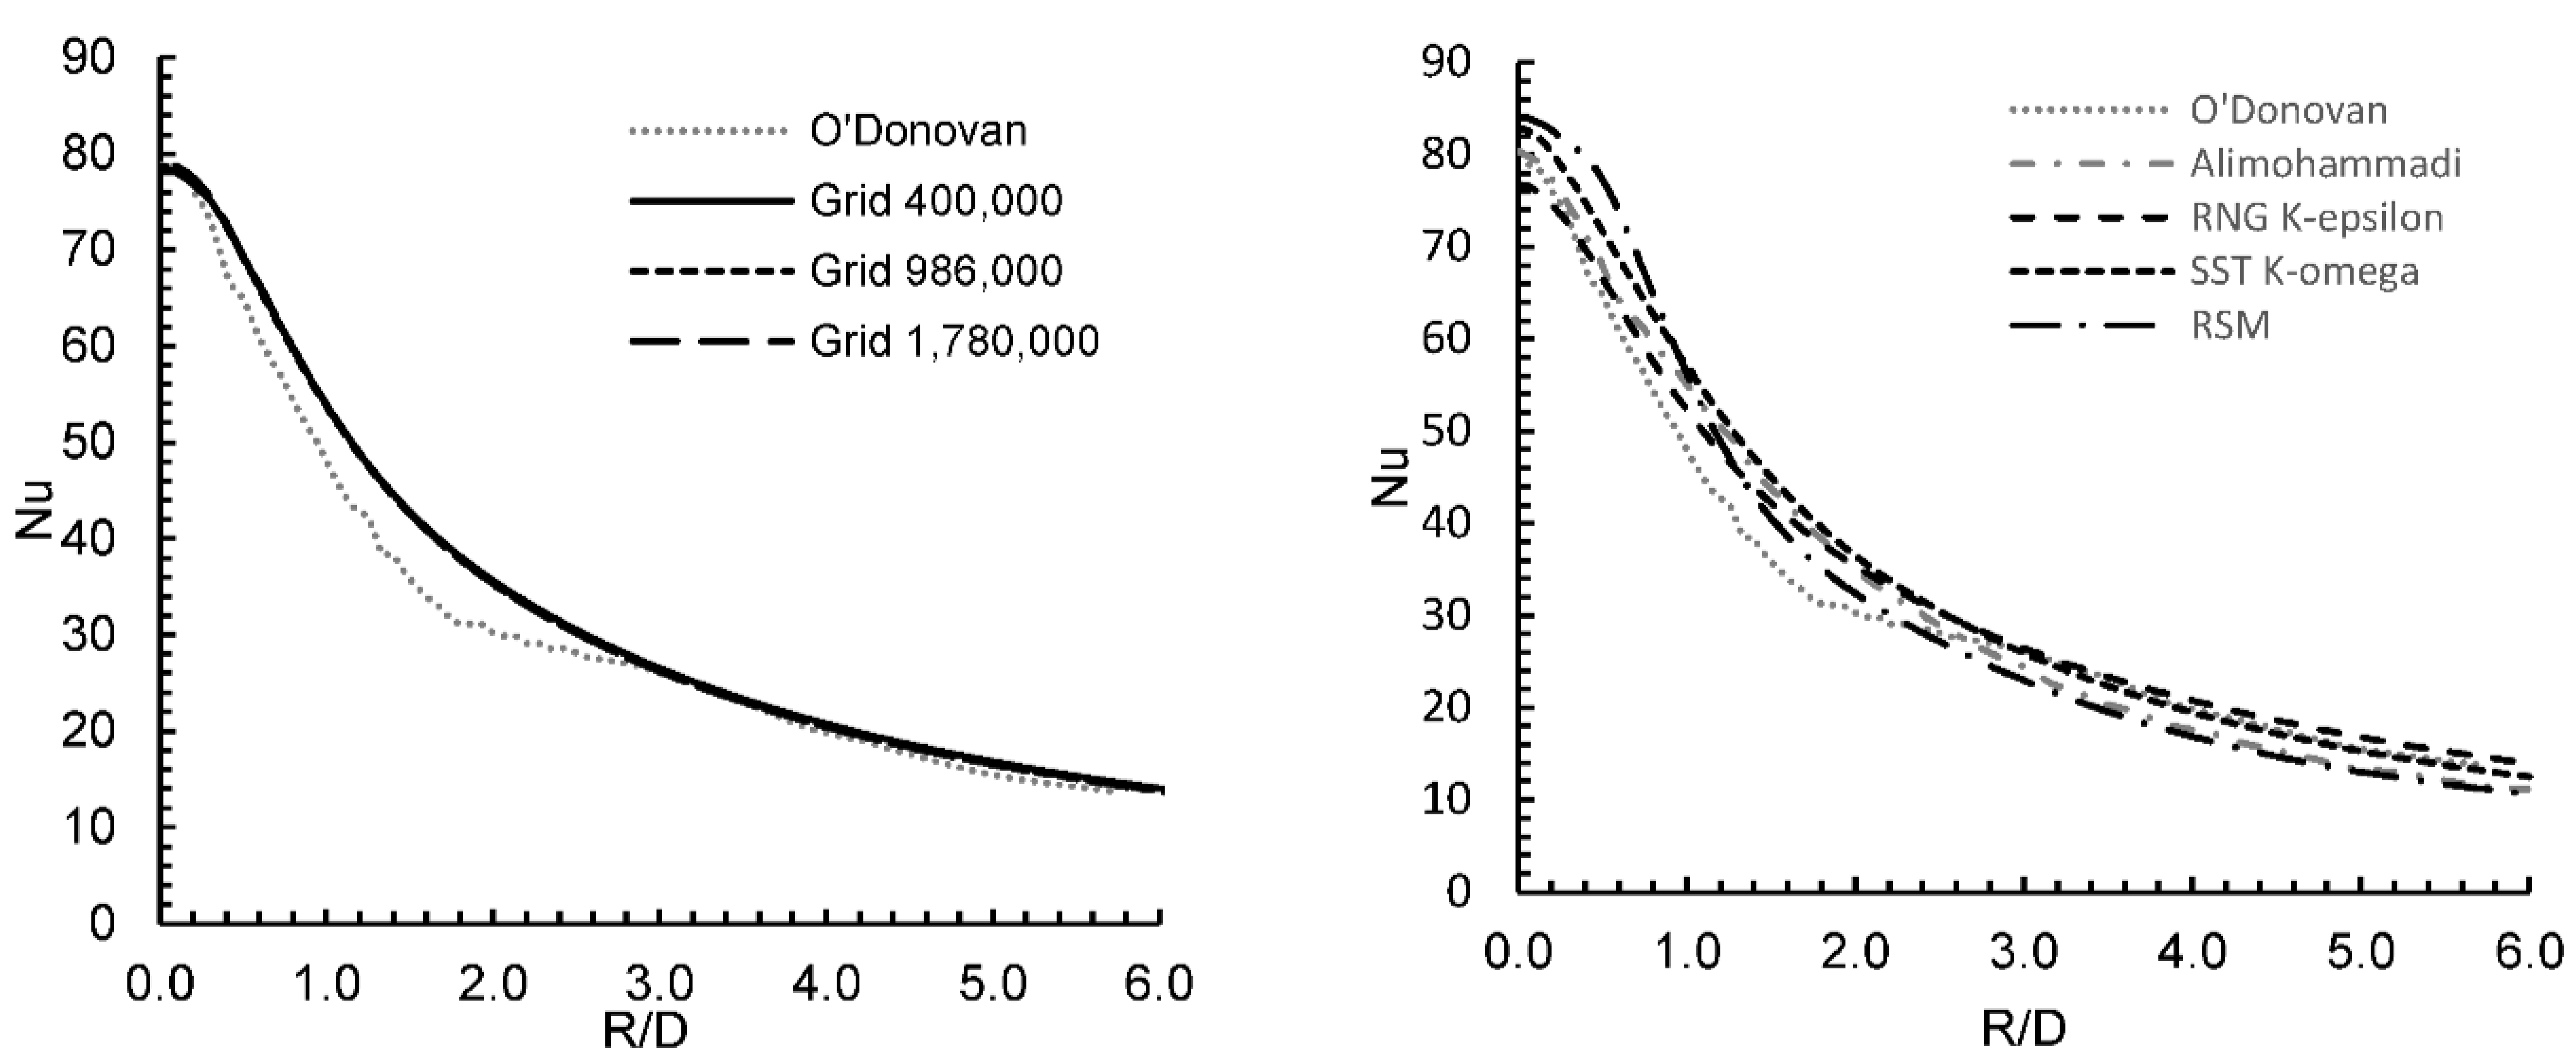
2.3. Modeling Approach and Validation
3. Results and Discussion
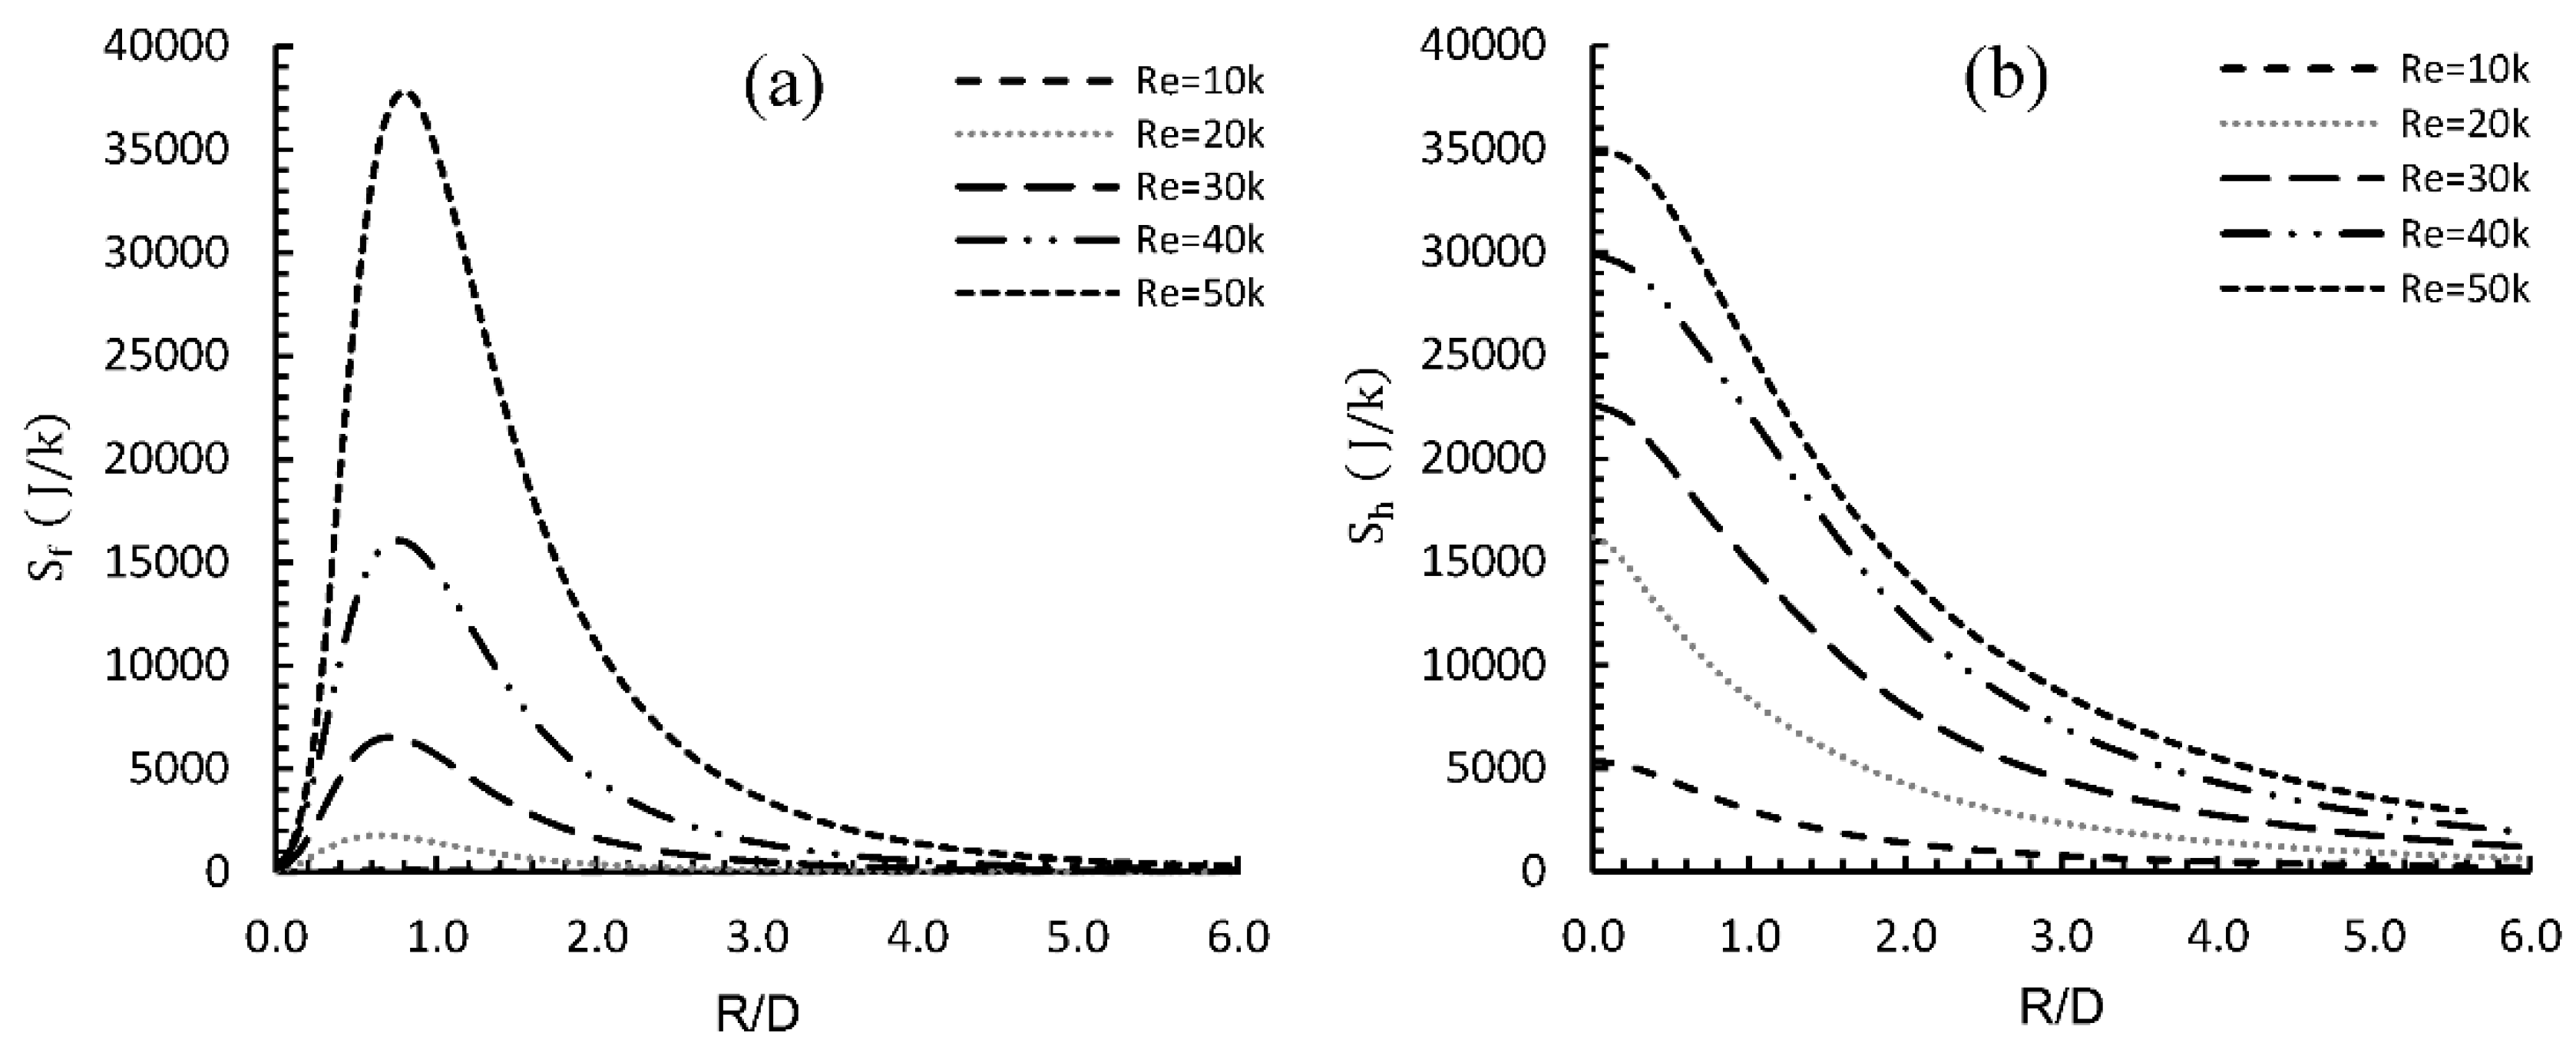
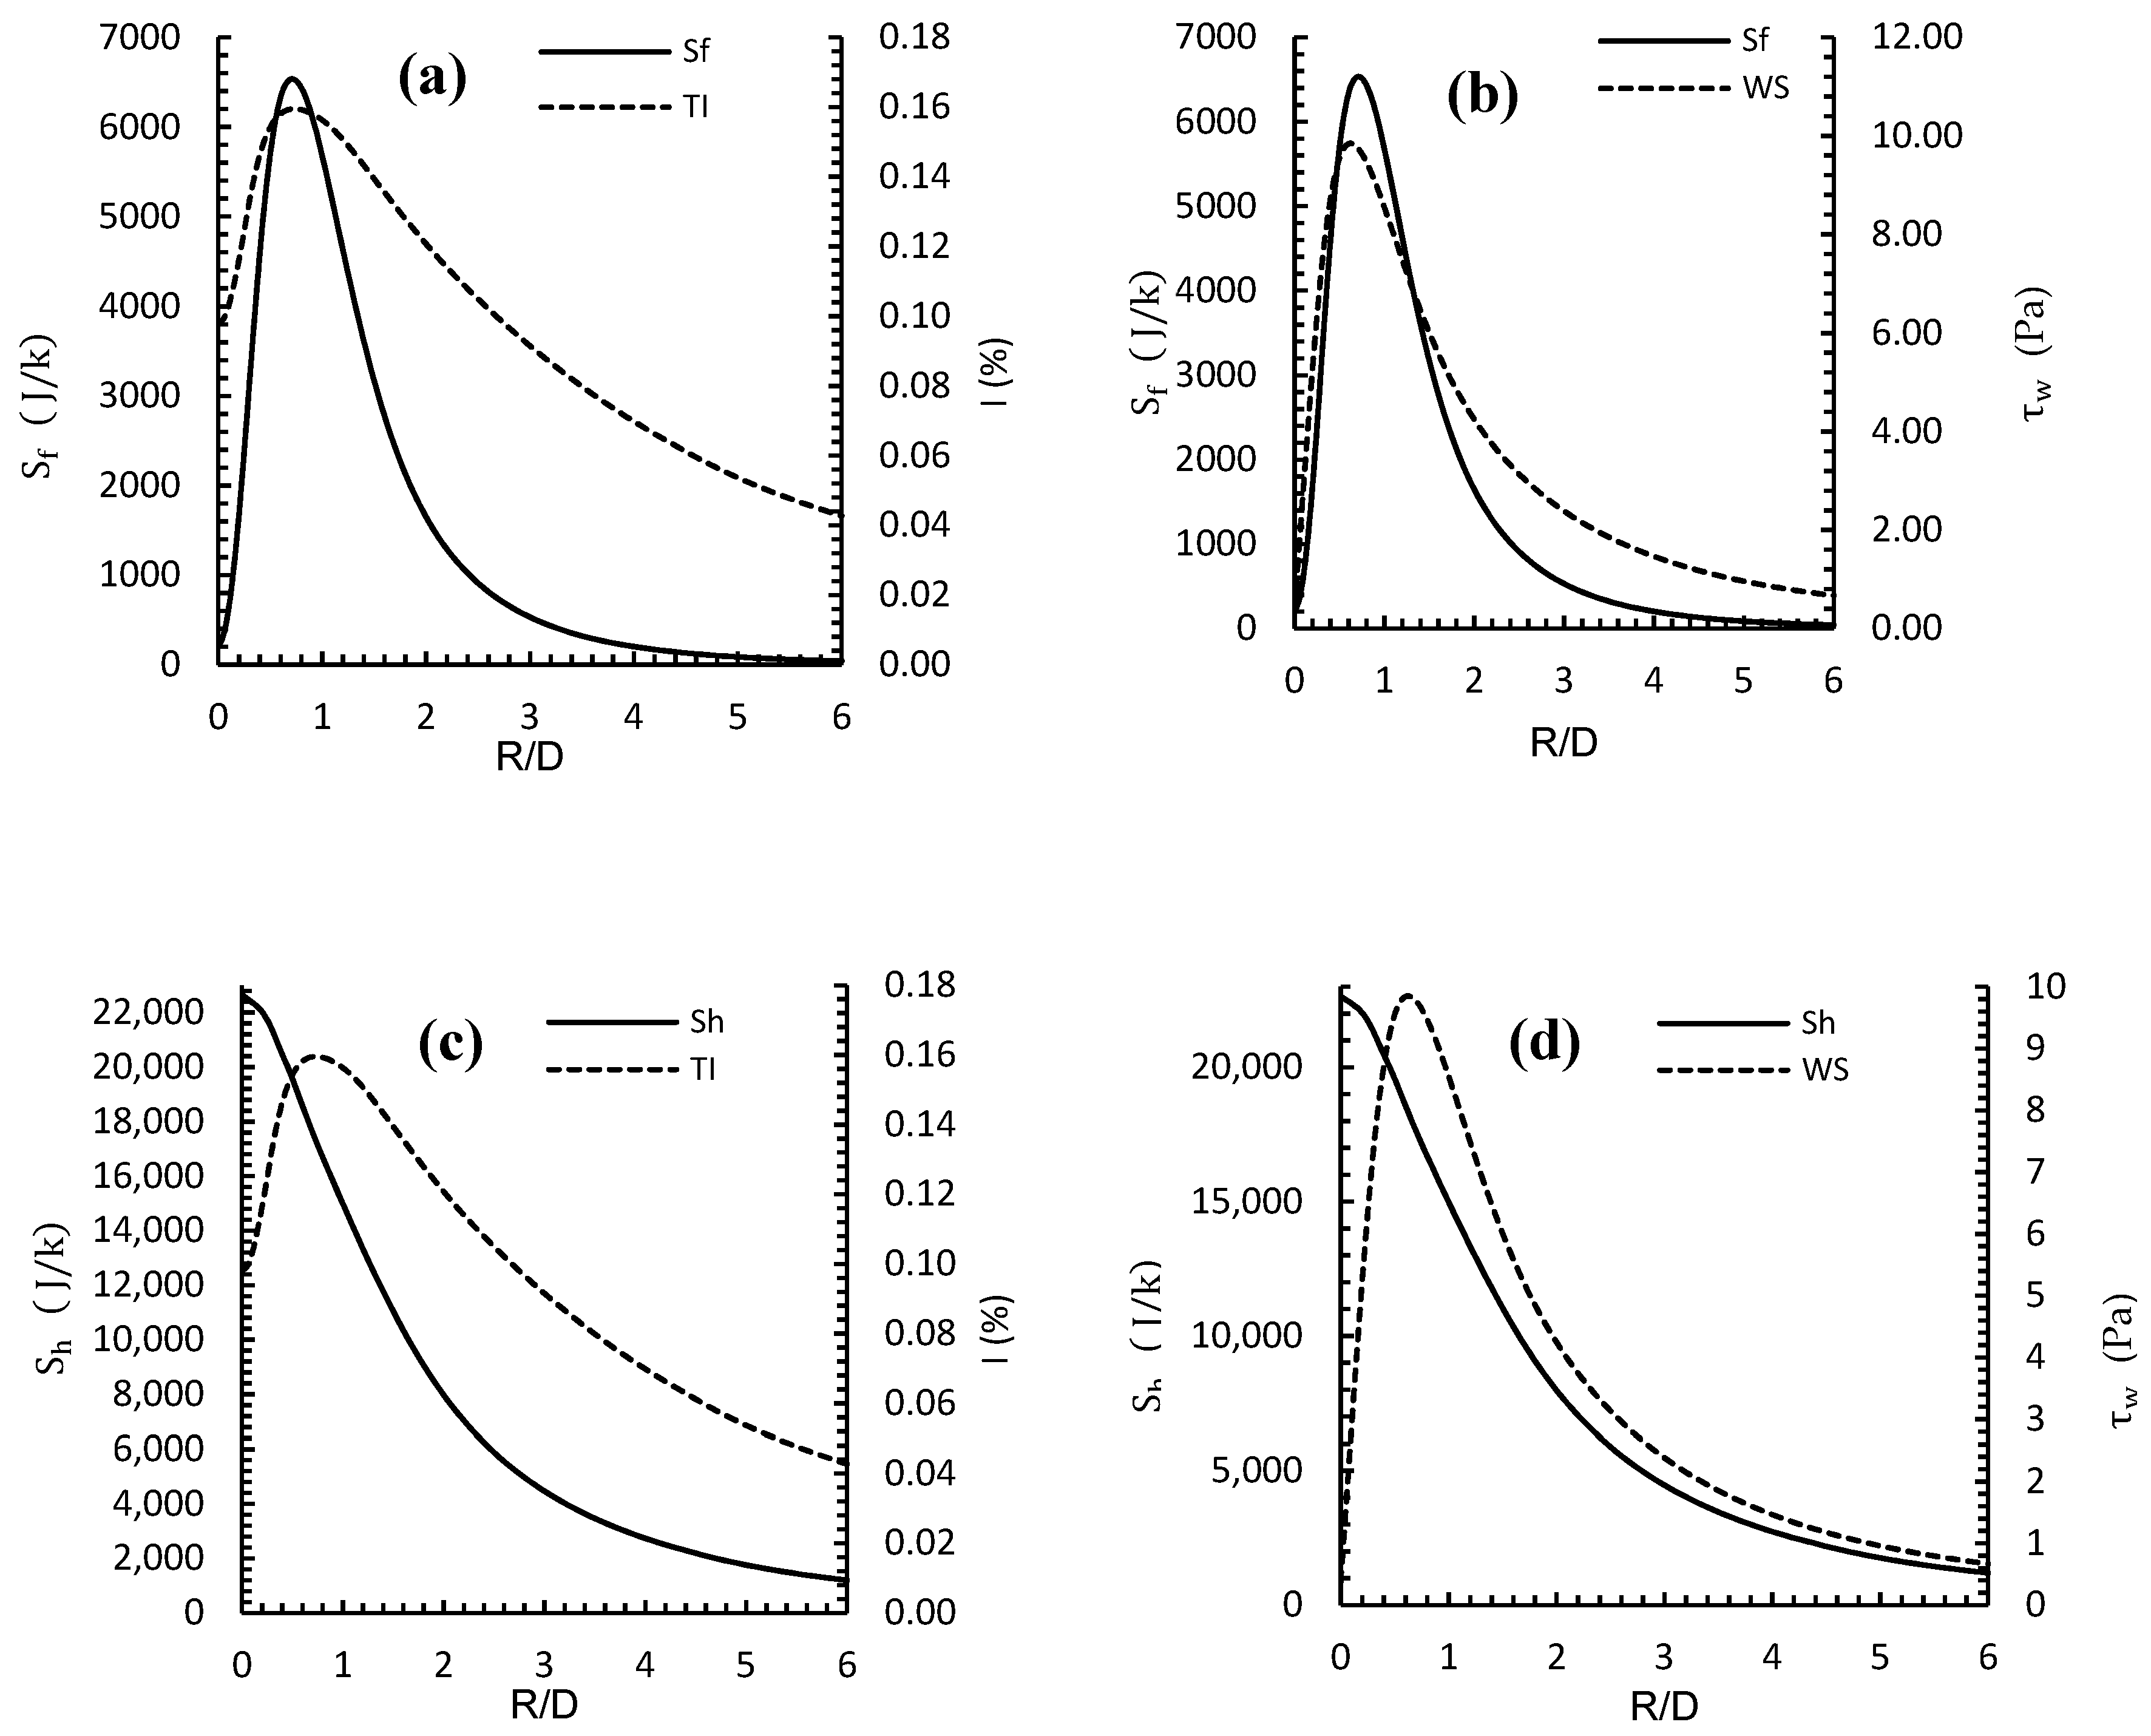
3.1. Smooth Wall—The Baseline Case
- Flow Physics Analysis
- b.
- Entropy generation analysis
3.2. Roughened Wall—Rib Geometry Effect
- Flow Physics Analysis
- b.
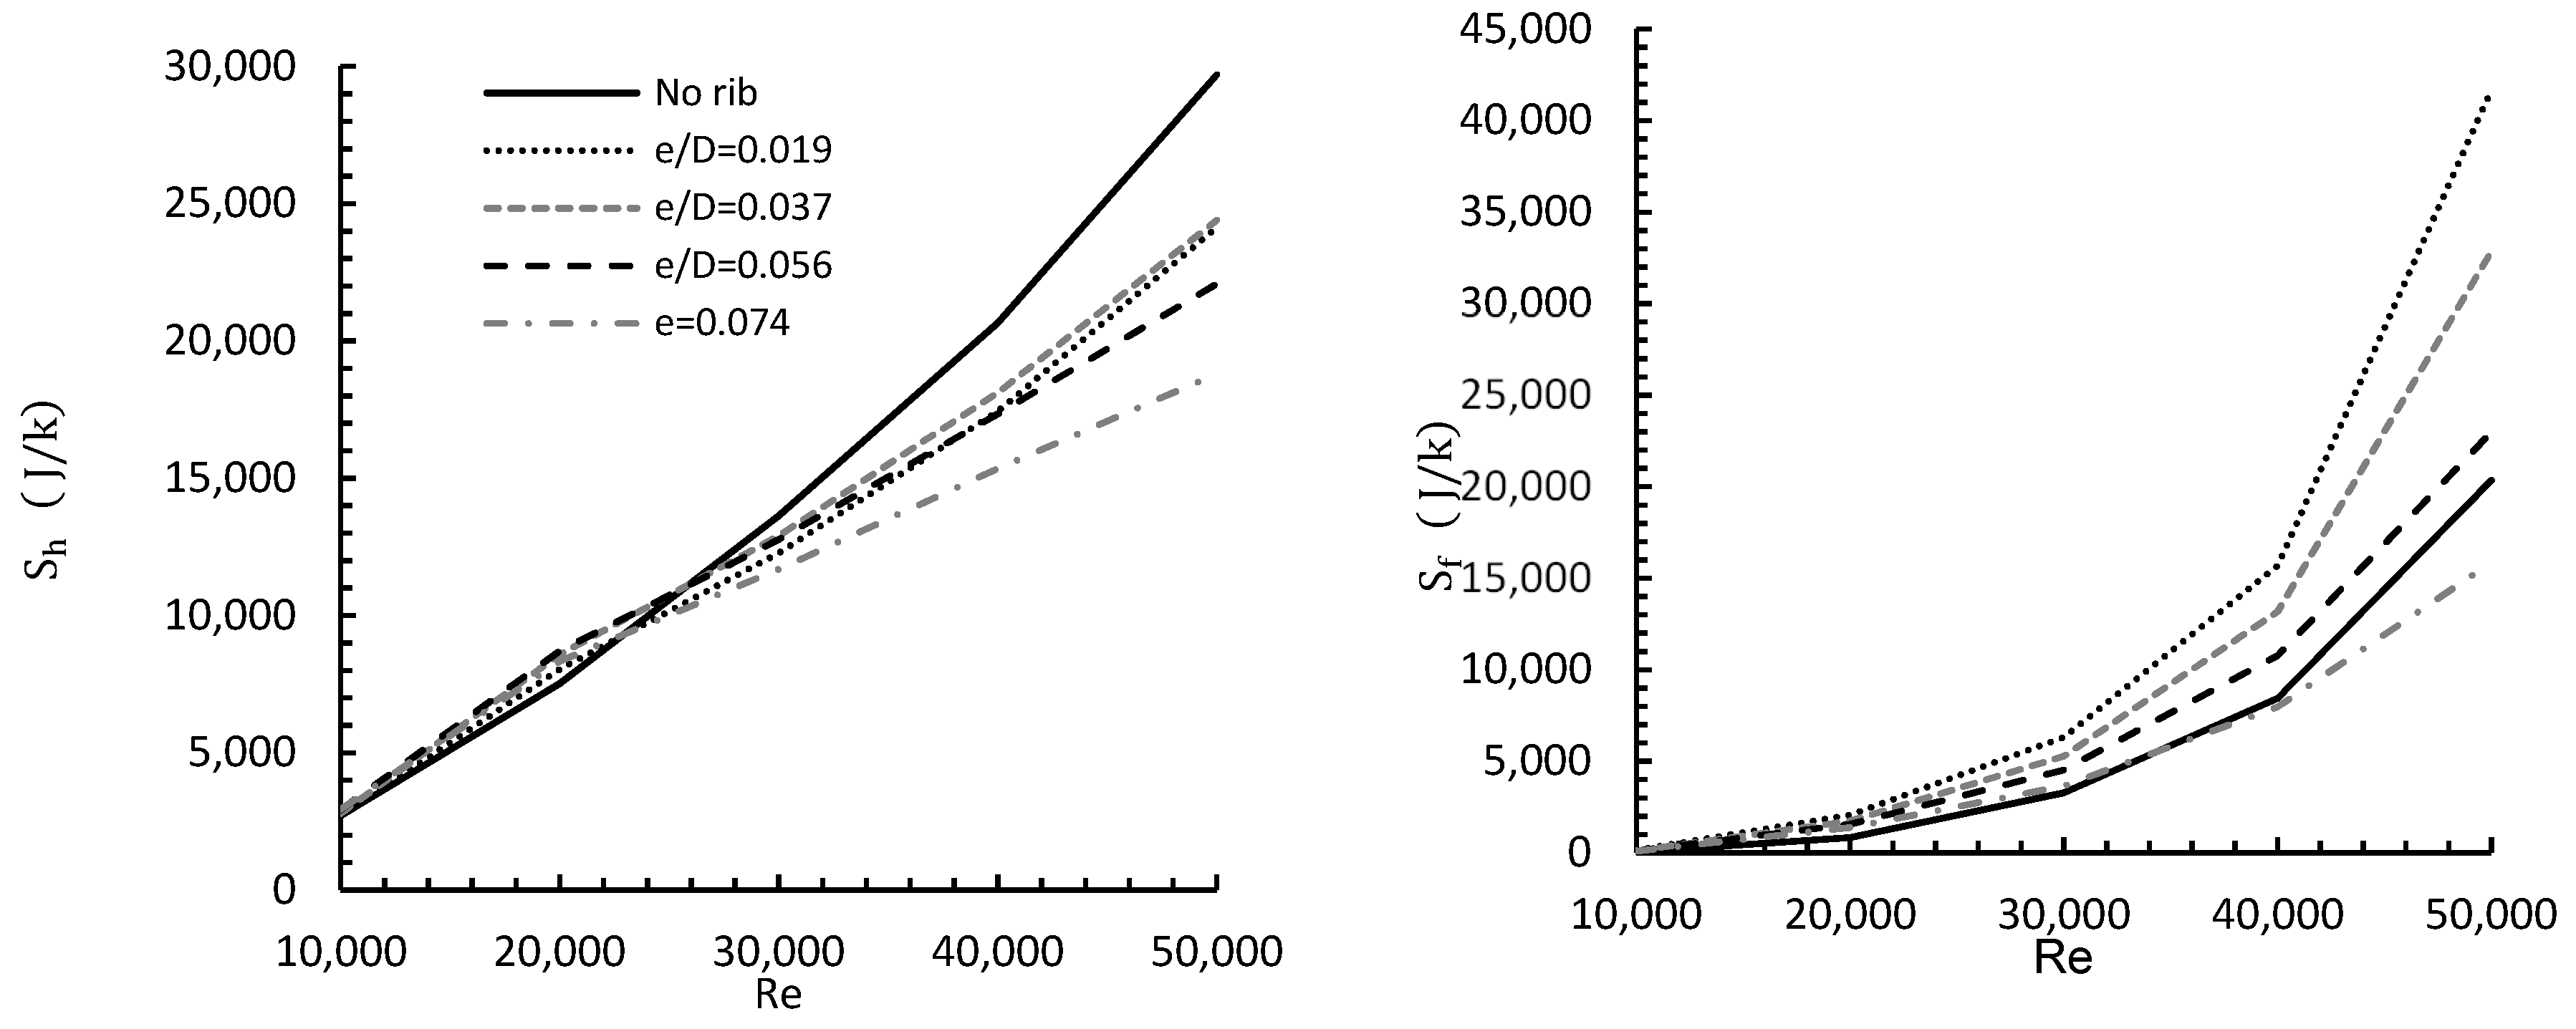
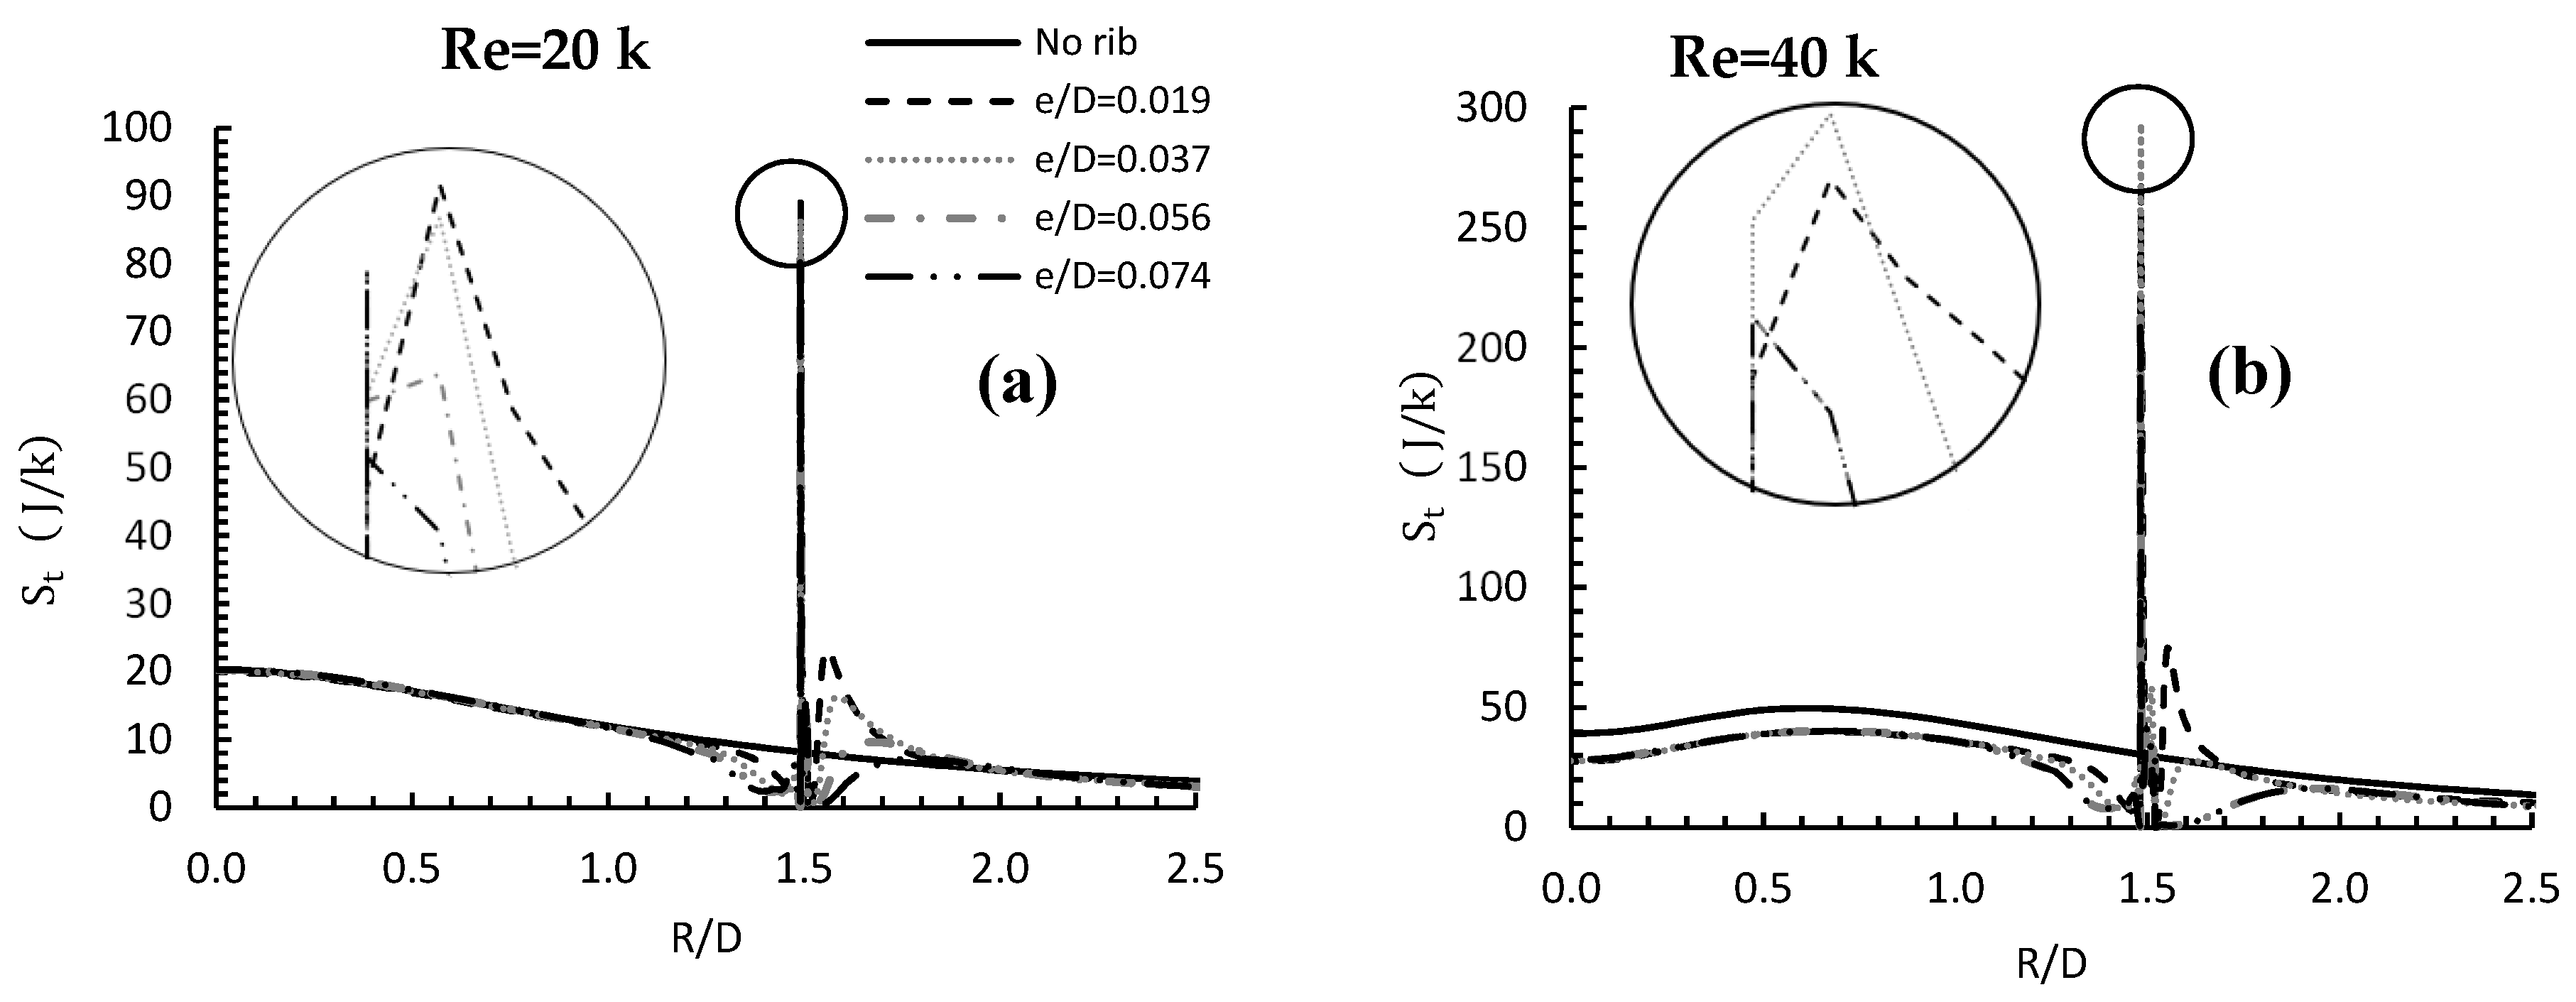
- Entropy Generation Analysis
3.3. Roughened Wall—Rib Location Effect
- Flow Physics Analysis
- b.
- Entropy Generation Analysis
4. Conclusions
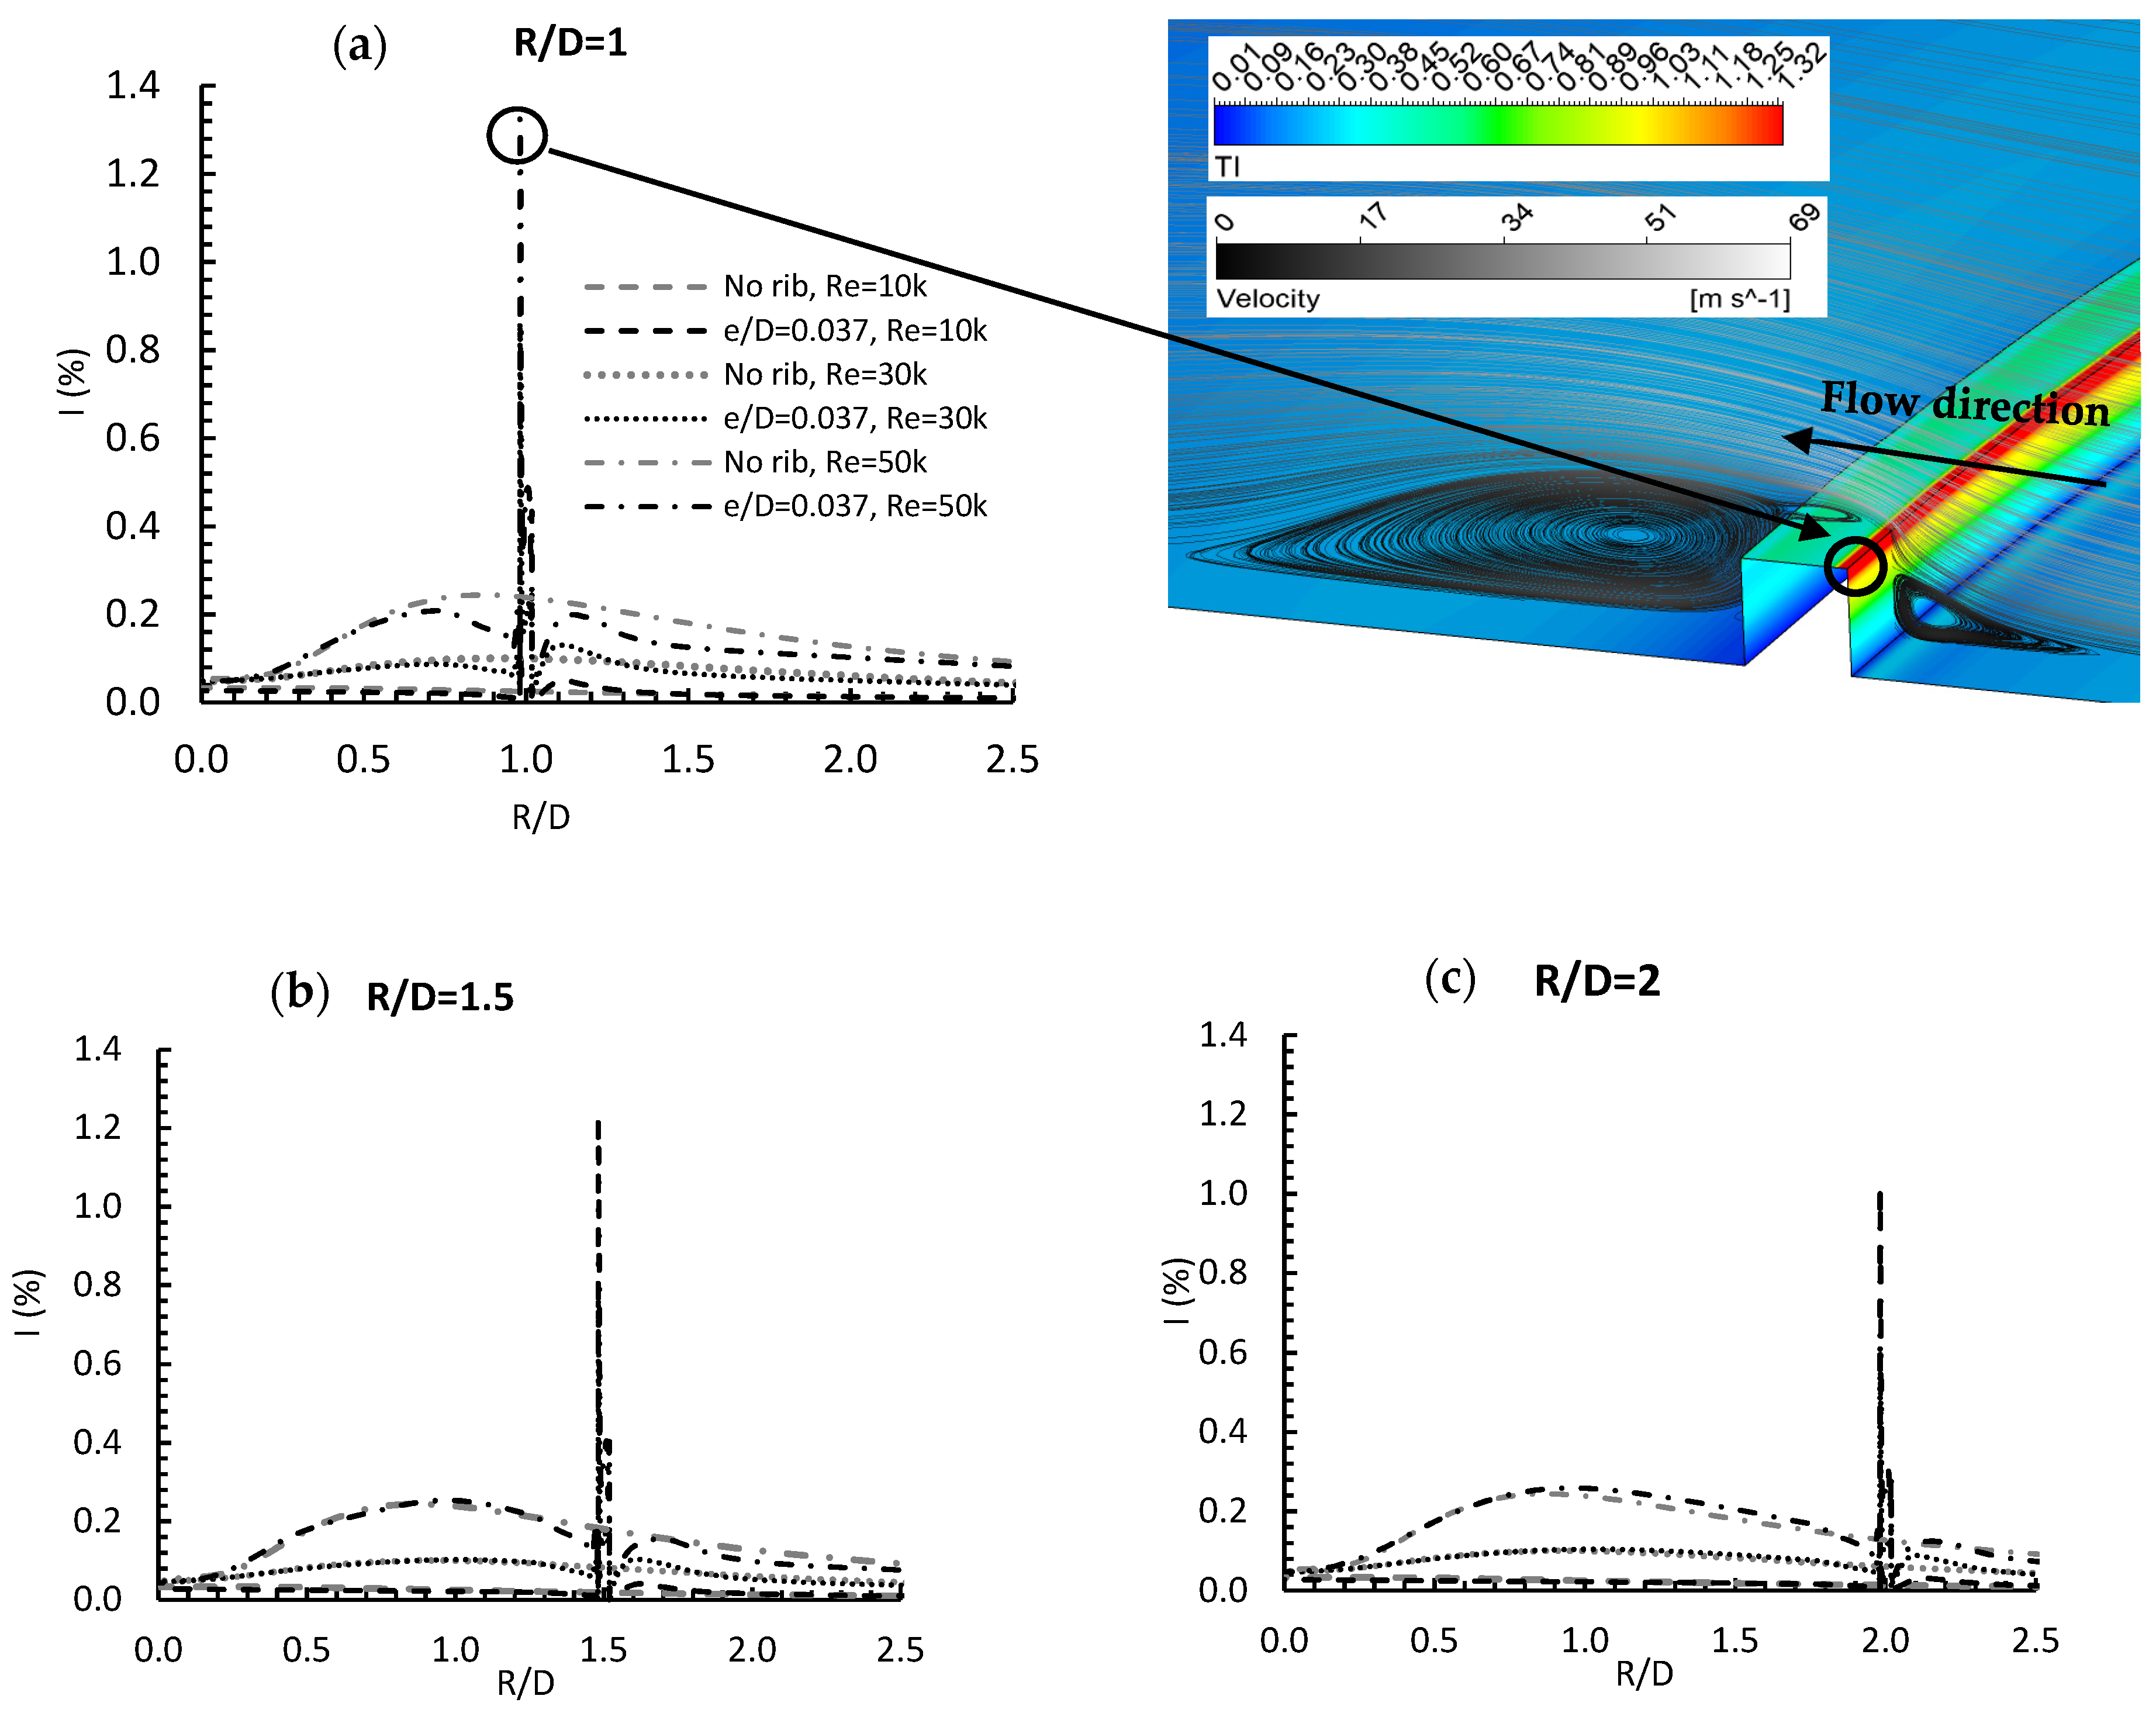
- A rib height of e/D = 0.019 produced the smallest size of a before-rib flow recirculation zone, preventing direct contact between the flow and the wall, resulting in the greatest wall shear stress peak value, but the lowest turbulence intensity.
- A rib height of e/D = 0.019 had a minor contribution to enhancing the heat transfer rate between the flow and the heated wall, due to the low level of flow vortices occurring by this rib height wall, resulting in the minimum Sh.
- At higher Reynolds numbers, adding a rib of a suitable height could have reduced the total entropy because it reduces Sh more than it increases Sf. In addition, for ribs of heights 0.019, 0.037 and 0.056, the entropy generated by friction was greater than that due to heat exchange.
- In general, varying the rib location and Re values had a noticeable impact on , and (), as these variations play an important role in forming and sizing a before-rib recirculation zone.
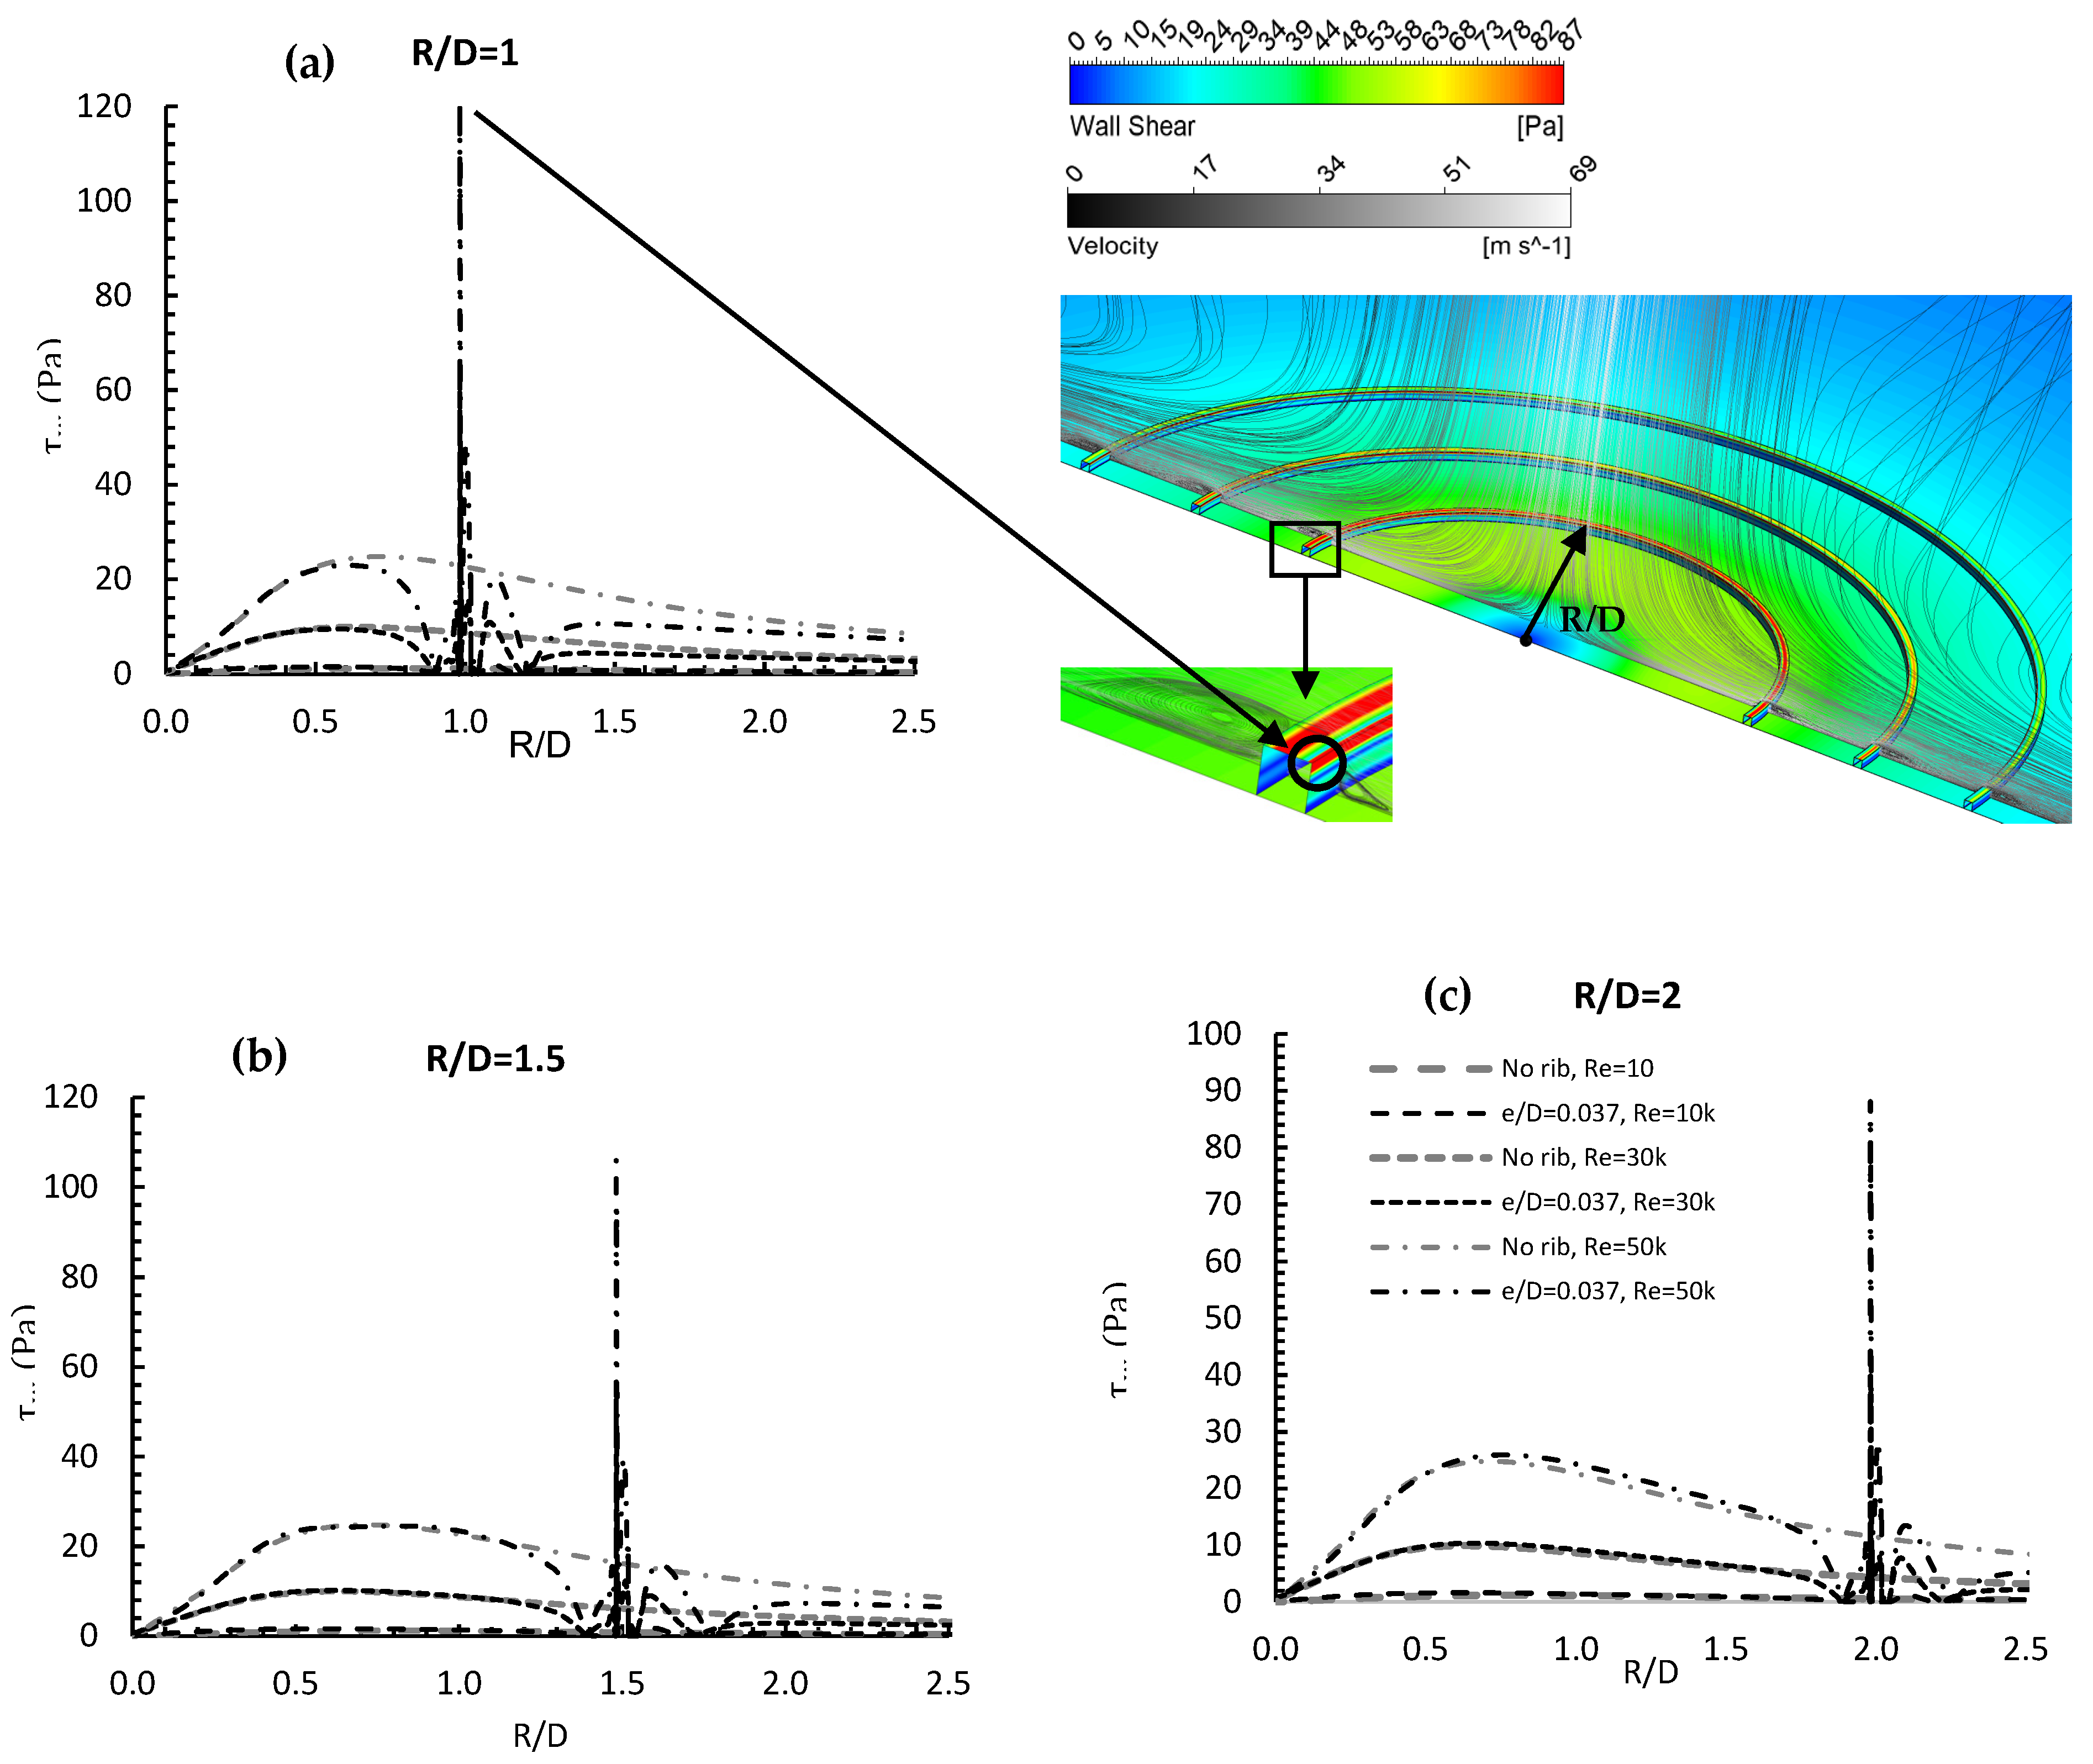
- Placing the rib at a radial location R/D = 1 involved positioning it within the stagnation region where the flow was very active, causing higher flow-wall friction and flow recirculation. This maximized but minimized , when compared to other radial locations.
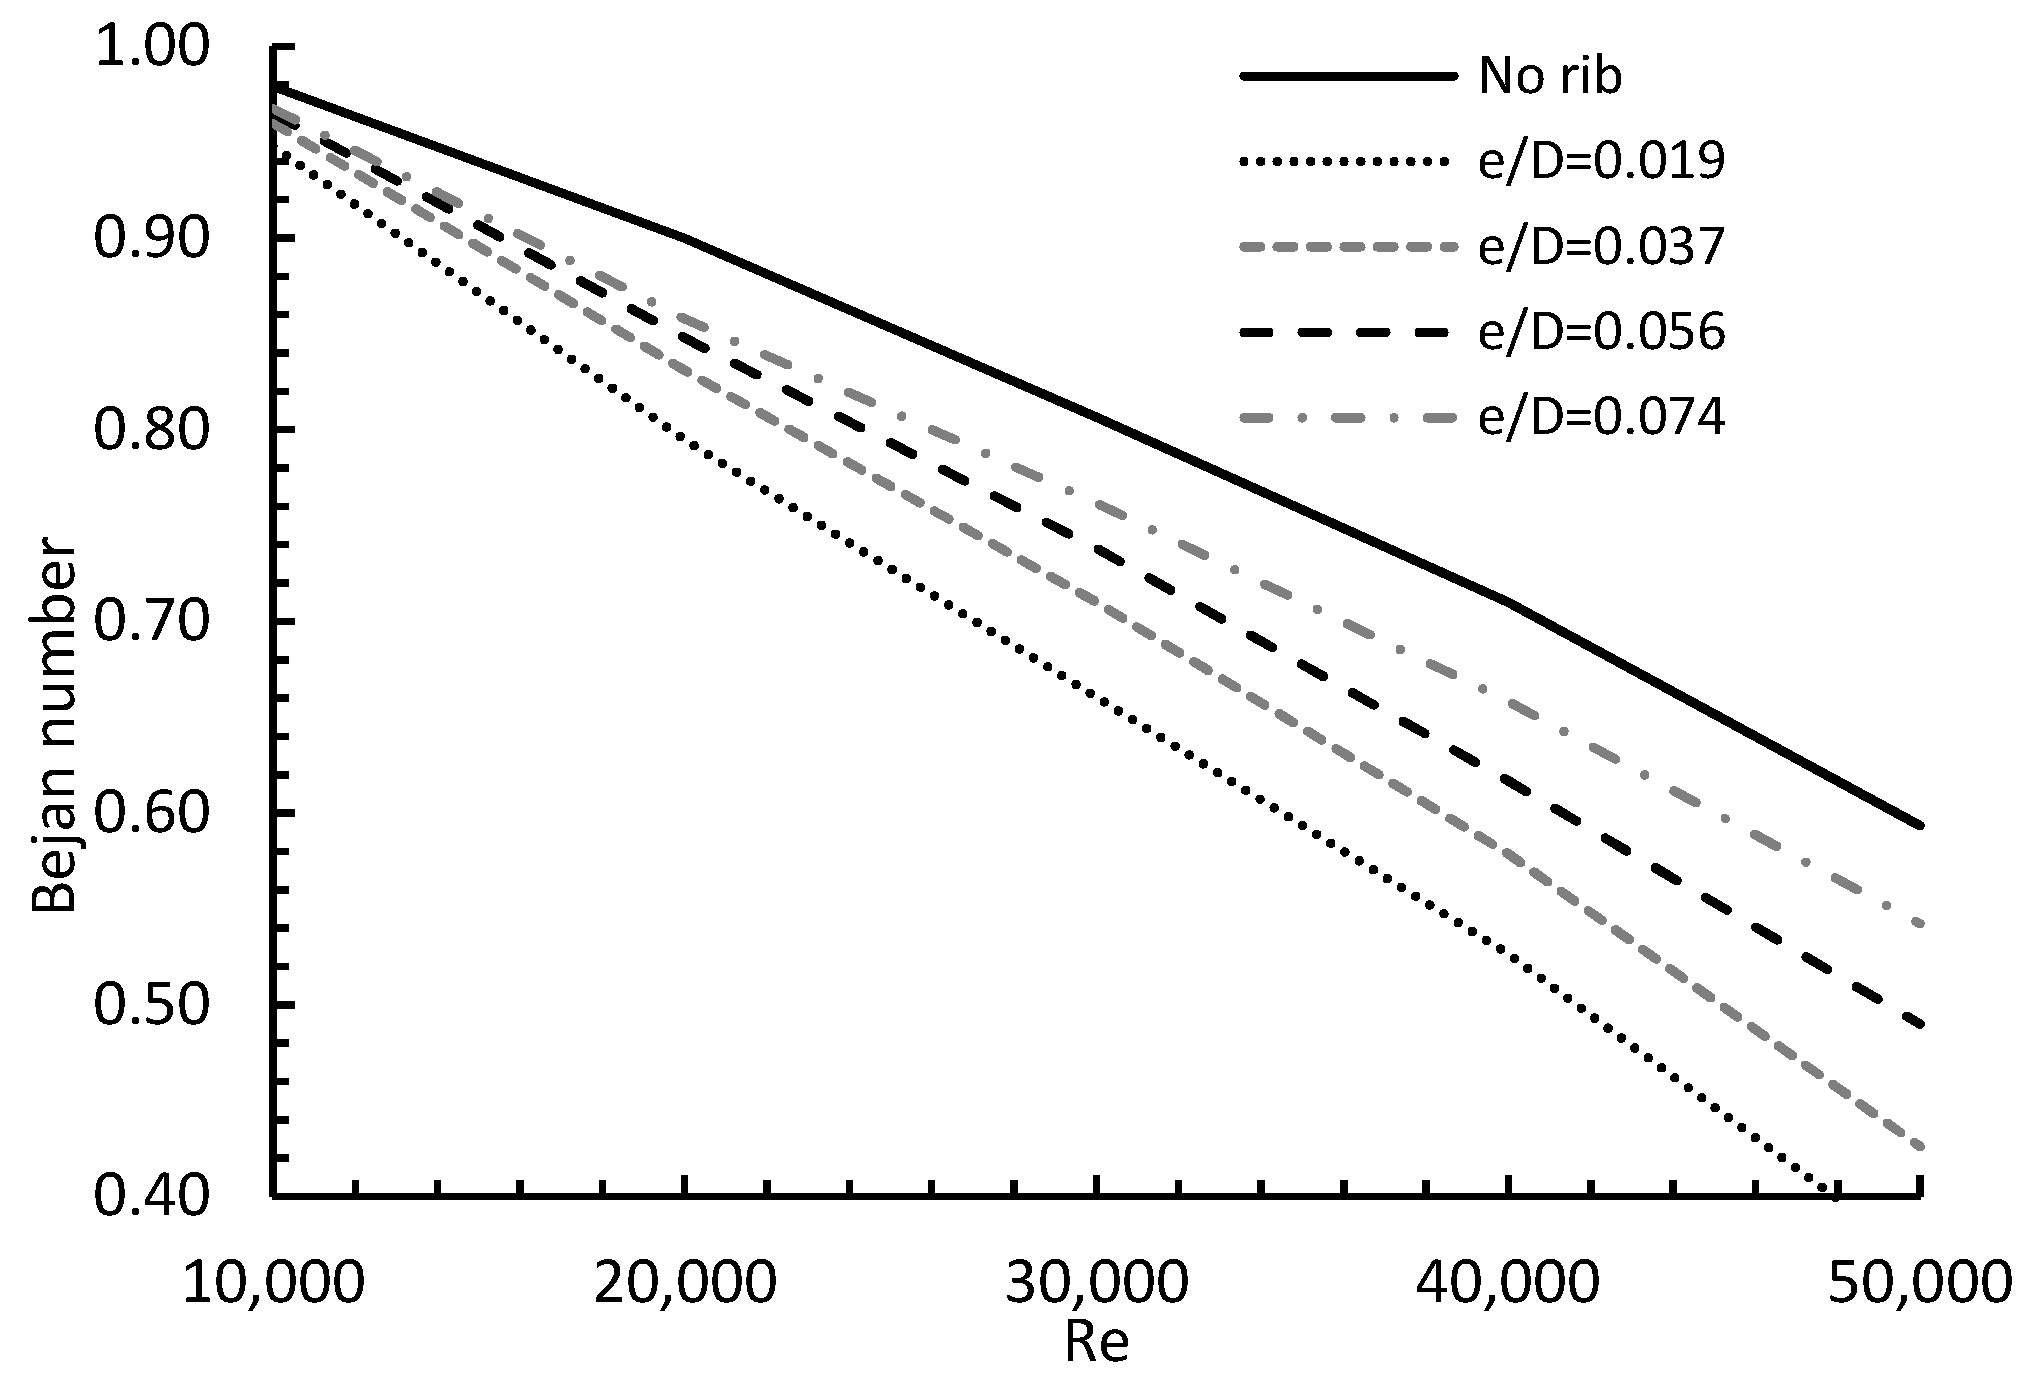
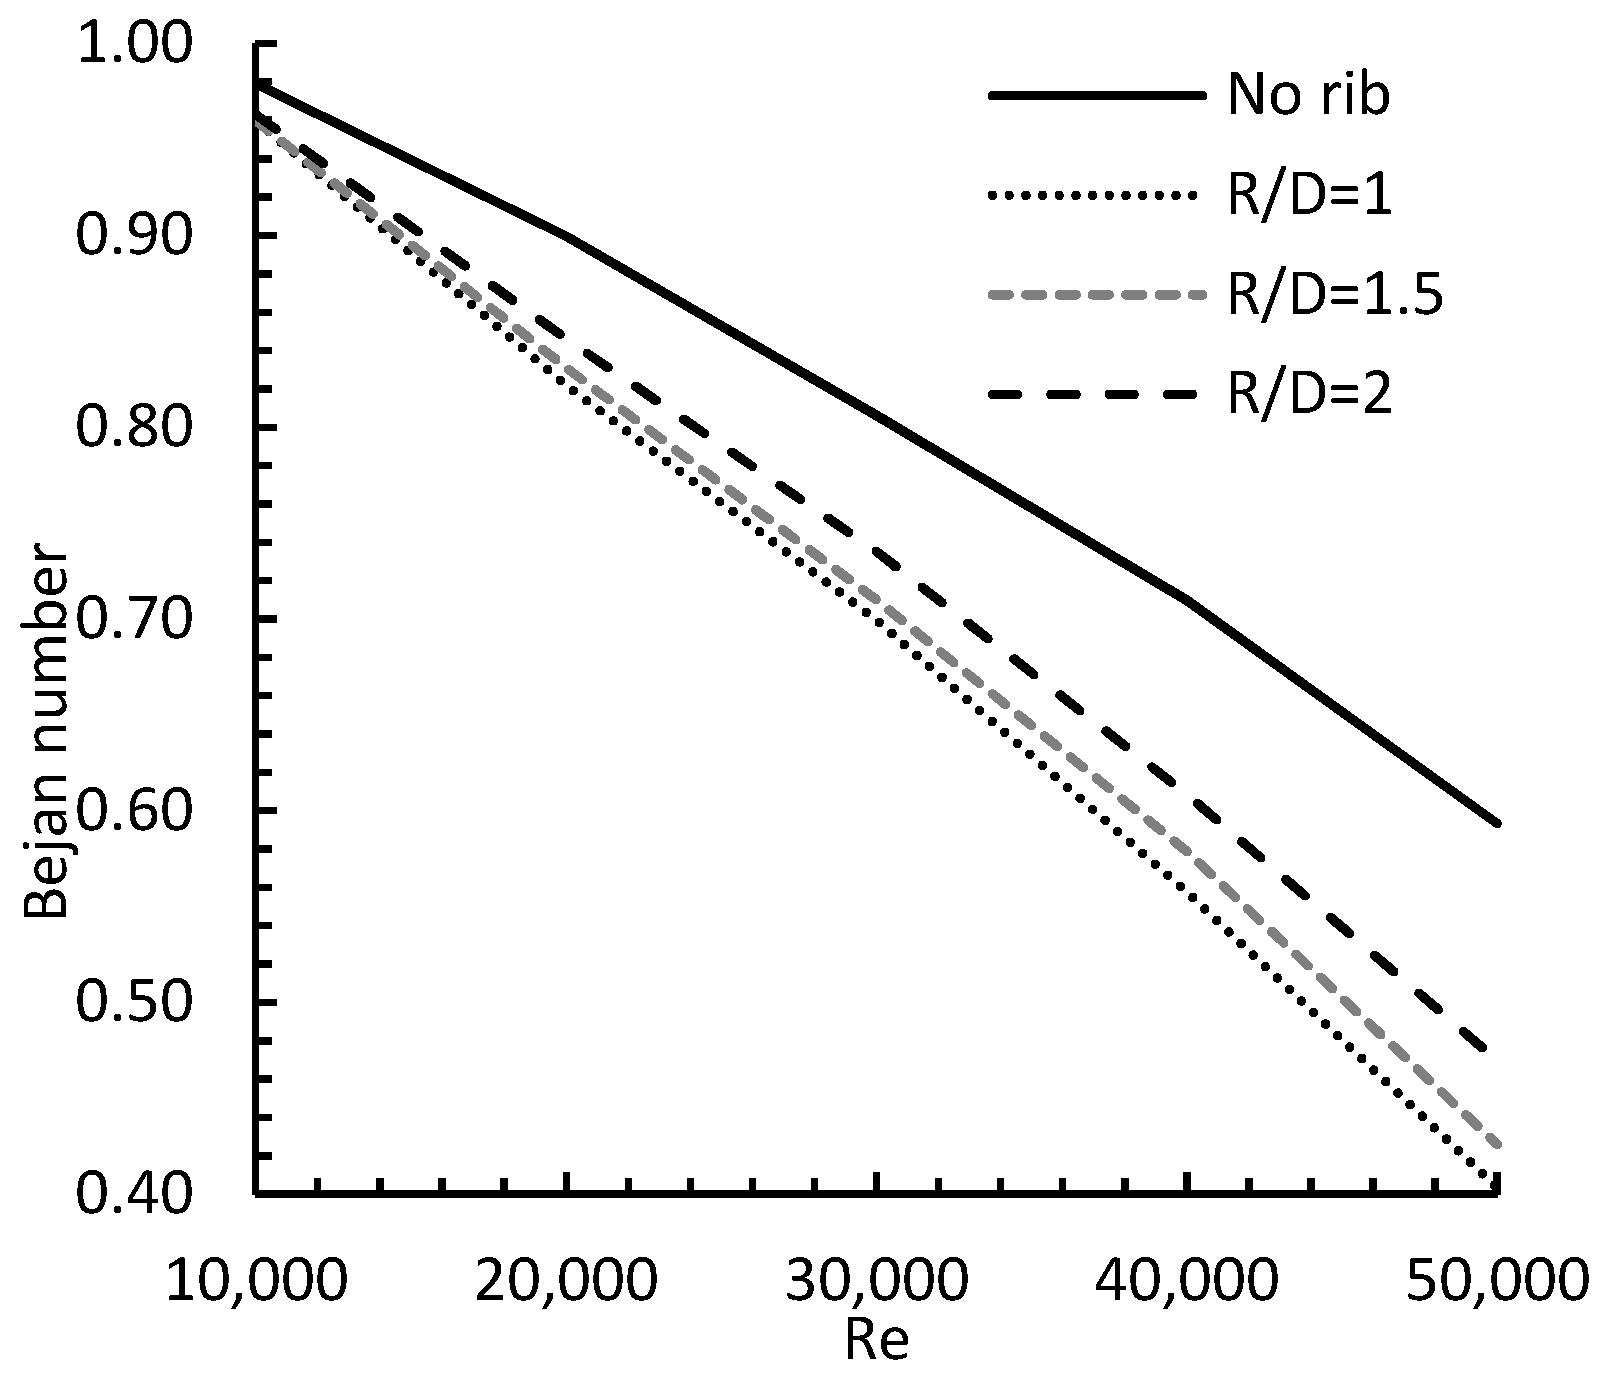
- In general, the Bejan number decreased as the Re increased. The rib height and rib location decreased due to the combined effect of three parameters: turbulence intensity, flow recirculation and wall friction, on total entropy generation. The results shown here could have important practical applications in the design of turbine blades, nozzle guide vanes and electronic devices for maximum heat removal.
Author Contributions
Funding
Institutional Review Board Statement
Informed Consent Statement
Data Availability Statement
Acknowledgments
Conflicts of Interest
Nomenclature
| D | jet diameter (m) |
| H | jet-to-target distance (m) |
| R | radial distance (m) |
| G.C. | geometric center (-) |
| y | flow direction coordinate (m) |
| y+ | the distance between the wall and the first mesh above (m) |
| e | rib height (m) |
| Re | Reynolds number (-) |
| T | temperature (k) |
| y+ | distance between the wall and the first node above it (-) |
| Sh | entropy generated due to heat exchange (J/k) |
| Sf | entropy generated due to friction (J/k) |
| St | total entropy generation (J/k) |
| I | turbulence intensity (%) |
| τw | wall shear stress (Pa) |
| Nu | local Nusselt number (-) |
| Greek Symbols | |
| λeff | the effective thermal conductivity (W/m k) |
| μeff | effective viscosity of the flows (m2/s) |
| μ | dynamic viscosity (m2/s) |
References
- Bejan, A. A Study of Entropy Generation in Fundamental Conwectife Heat Transfer. J. Heat Transf. 1979, 101, 718–725. [Google Scholar] [CrossRef]
- Bejan, A. Second law analysis in heat transfer. Energy 1980, 5, 720–732. [Google Scholar] [CrossRef]
- Ruocco, G. Entropy generation in conjugate heat transfer from a discretely heated plate to an impinging confined jet. Int. Commun. Heat Mass Transf. 1997, 24, 201–210. [Google Scholar] [CrossRef]
- Shuja, S.Z.; Yilbas, B.S.; Budair, M.O. Local entropy generation in an impinging jet: Minimum entropy concept evaluating various turbulence models. Comput. Methods Appl. Mech. Eng. 2001, 190, 3623–3644. [Google Scholar] [CrossRef]
- Shuja, S.Z.; Yilbas, B.S.; Rashid, M. Confined swirling jet impingement onto an adiabatic wall. Int. J. Heat Mass Transf. 2003, 46, 2947–2955. [Google Scholar] [CrossRef]
- Shuja, S.Z.; Yilbas, B.S.; Budair, M.O. Entropy generation due to jet impingement on a surface: Effect of annular nozzle outer angle. Int. J. Numer. Methods Heat Fluid Flow 2007, 17, 677–691. [Google Scholar] [CrossRef]
- Bilgen, E. Natural convection in cavities with a thin fin on the hot wall. Int. J. Heat Mass Transf. 2005, 48, 3493–3505. [Google Scholar] [CrossRef]
- Kasayapanand, N. A computational fluid dynamics modeling of natural convection in finned enclosure under electric field. Appl. Therm. Eng. 2009, 29, 131–141. [Google Scholar] [CrossRef]
- Frederick, R.L.; Moraga, S.G. Three-dimensional natural convection in finned cubical enclosures. Int. J. Heat Fluid Flow 2007, 28, 289–298. [Google Scholar] [CrossRef]
- Xu, P.; Sasmito, A.P.; Qiu, S.; Mujumdar, A.S.; Xu, L.; Geng, L. Heat transfer and entropy generation in air jet impingement on a model rough surface. Int. Commun. Heat Mass Transf. 2016, 72, 48–56. [Google Scholar] [CrossRef]
- Esmailpour, K.; Bozorgmehr, B.; Hosseinalipour, S.M.; Mujumdar, A.S. Entropy generation and second law analysis of pulsed impinging jet. Int. J. Numer. Methods Heat Fluid Flow 2015, 25, 1089–1106. [Google Scholar] [CrossRef]
- Zahmatkesh, I. On the importance of thermal boundary conditions in heat transfer and entropy generation for natural convection inside a porous enclosure. Int. J. Therm. Sci. 2008, 47, 339–346. [Google Scholar] [CrossRef]
- Ries, F.; Li, Y.; Nishad, K.; Janicka, J.; Sadiki, A. Entropy generation analysis and thermodynamic optimization of jet impingement cooling using Large Eddy Simulation. Entropy 2019, 21, 129. [Google Scholar] [CrossRef] [PubMed] [Green Version]
- Chaudhari, M.; Puranik, B.; Agrawal, A. Heat transfer characteristics of synthetic jet impingement cooling. Int. J. Heat Mass Transf. 2010, 53, 1057–1069. [Google Scholar] [CrossRef]
- Sciacovelli, A.; Verda, V.; Sciubba, E. Entropy generation analysis as a design tool—A review. Renew. Sustain. Energy Rev. 2015, 43, 1167–1181. [Google Scholar] [CrossRef]
- Sahin, A.Z.; Ben-Mansour, R. Entropy Generation in Laminar Fluid Flow Through A Circular Pipe. Entropy 2003, 5, 404–416. [Google Scholar] [CrossRef]
- Wang, W.; Zhang, Y.; Liu, J.; Wu, Z.; Li, B.; Sundén, B. Entropy generation analysis of fully-developed turbulent heat transfer flow in inward helically corrugated tubes. Numer. Heat Transf. Part A Appl. 2018, 73, 788–805. [Google Scholar] [CrossRef] [Green Version]
- Zhang, G.; Huang, H.; Sun, T.; Li, N.; Zhou, B.; Sun, Z. Analysis of the performance of a new developed shear stress transport model in a turbulent impinging jet flow. Phys. Fluids 2019, 31, 115110. [Google Scholar] [CrossRef]
- Esfahani, J.A.; Shahabi, P.B. Effect of non-uniform heating on entropy generation for the laminar developing pipe flow of a high Prandtl number fluid. Energy Convers. Manag. 2010, 51, 2087–2097. [Google Scholar] [CrossRef]
- Saqr, K.M.; Shehata, A.I.; Taha, A.A.; Abo Elazm, M.M. CFD modelling of entropy generation in turbulent pipe flow: Effects of temperature difference and swirl intensity. Appl. Therm. Eng. 2016, 100, 999–1006. [Google Scholar] [CrossRef]
- Ries, F.; Janicka, J.; Sadiki, A. Thermal transport and entropy production mechanisms in a turbulent round jet at supercritical thermodynamic conditions. Entropy 2017, 19, 404. [Google Scholar] [CrossRef] [Green Version]
- Sierra-Pallares, J.; García Del Valle, J.; García-Carrascal, P.; Castro Ruiz, F. Numerical study of supercritical and transcritical injection using different turbulent Prandlt numbers: A second law analysis. J. Supercrit. Fluids 2016, 115, 86–98. [Google Scholar] [CrossRef]
- Farran, R.; Chakraborty, N. A direct numerical simulation-based analysis of entropy generation in turbulent premixed flames. Entropy 2013, 15, 1540–1566. [Google Scholar] [CrossRef]
- Safari, M.; Hadi, F.; Sheikhi, M.R.H. Progress in the prediction of entropy generation in turbulent reacting flows using large eddy simulation. Entropy 2014, 16, 5159–5177. [Google Scholar] [CrossRef] [Green Version]
- Drost, M.K.; White, M.D. Numerical predictions of local entropy generation in an impinging jet. J. Heat Transfer 1991, 113, 823–829. [Google Scholar] [CrossRef]
- Oztop, H.F.; Al-Salem, K. A review on entropy generation in natural and mixed convection heat transfer for energy systems. Renew. Sustain. Energy Rev. 2012, 16, 911–920. [Google Scholar] [CrossRef]
- Siavashi, M.; Yousofvand, R.; Rezanejad, S. Nanofluid and porous fins effect on natural convection and entropy generation of flow inside a cavity. Adv. Powder Technol. 2018, 29, 142–156. [Google Scholar] [CrossRef]
- Chen, S.; Zheng, C. Entropy generation in impinging flow confined by planar opposing jets. Int. J. Therm. Sci. 2010, 49, 2067–2075. [Google Scholar] [CrossRef]
- Lam, P.A.K.; Arul Prakash, K. A numerical investigation of heat transfer and entropy generation during jet impingement cooling of protruding heat sources without and with porous medium. Energy Convers. Manag. 2015, 89, 626–643. [Google Scholar] [CrossRef]
- Salimi, M.R.; Taeibi-Rahni, M.; Rostamzadeh, H. Heat transfer and entropy generation analysis in a three-dimensional impinging jet porous heat sink under local thermal non-equilibrium condition. Int. J. Therm. Sci. 2020, 153, 106348. [Google Scholar] [CrossRef]
- Alenezi, A.; Almutairi, A.; Alhajeri, H.; Gamil, A.; Alshammari, F. Numerical Investigation on Turbulence Statistics and Heat Transfer of a Circular Jet Impinging on a Roughened Flat Plate. J. Therm. Sci. Eng. Appl. 2021, 13, 041010. [Google Scholar] [CrossRef]
- O’Donovan, T.S.; Murray, B.D. Jet impingement heat transfer—Part I: Mean and root-mean-square heat transfer and velocity distributions. Int. J. Heat Mass Transf. 2007, 50, 3291–3301. [Google Scholar] [CrossRef]
- Yakhot, V.; Orszag, S.A. Renormalization group analysis of turbulence. I. Basic theory. J. Sci. Comput. 1986, 1, 3–51. [Google Scholar] [CrossRef]
- Kock, F.; Herwig, H. Local entropy production in turbulent shear flows: A high-Reynolds number model with wall functions. Int. J. Heat Mass Transf. 2004, 47, 2205–2215. [Google Scholar] [CrossRef]
- Alimohammadi, S.; Murray, D.B.; Persoons, T. Experimental validation of a computational fluid dynamics methodology for transitional flow heat transfer characteristics of a steady impinging jet. J. Heat Transf. 2014, 136, 091703. [Google Scholar] [CrossRef] [Green Version]
- Alhajeri, H.M.; Almutairi, A.; Alenezi, A.H.; Gamil, A.A.A. Numerical investigation on heat transfer performance and flow characteristics in a roughened vortex chamber. Appl. Therm. Eng. 2019, 153, 58–68. [Google Scholar] [CrossRef] [Green Version]


| Air Properties | Value |
|---|---|
| Density (ρ) | 1.177 kg/m3 |
| Dynamic viscosity (μ) | 1.846 × 10⁻⁵ kg/m s |
| Thermal conductivity (k) | 0.026 W/m K |
| Specific heat (Cp) | 1004.9 kJ/kg K |
| Corresponding Prandtl no. (Pr) | 0.0706 |
Publisher’s Note: MDPI stays neutral with regard to jurisdictional claims in published maps and institutional affiliations. |
© 2022 by the authors. Licensee MDPI, Basel, Switzerland. This article is an open access article distributed under the terms and conditions of the Creative Commons Attribution (CC BY) license (https://creativecommons.org/licenses/by/4.0/).
Share and Cite
Alenezi, A.; Almutairi, A.; Alhajeri, H.; Almekmesh, S.F.; Alzuwayer, B.B. Impact of Surface Roughness on Flow Physics and Entropy Generation in Jet Impingement Applications. Entropy 2022, 24, 661. https://doi.org/10.3390/e24050661
Alenezi A, Almutairi A, Alhajeri H, Almekmesh SF, Alzuwayer BB. Impact of Surface Roughness on Flow Physics and Entropy Generation in Jet Impingement Applications. Entropy. 2022; 24(5):661. https://doi.org/10.3390/e24050661
Chicago/Turabian StyleAlenezi, Abdulrahman, Abdulrahman Almutairi, Hamad Alhajeri, Saad F. Almekmesh, and Bashar B. Alzuwayer. 2022. "Impact of Surface Roughness on Flow Physics and Entropy Generation in Jet Impingement Applications" Entropy 24, no. 5: 661. https://doi.org/10.3390/e24050661