
Multi-Task Offloading Based on Optimal Stopping Theory in Edge Computing Empowered Internet of Vehicles


Abstract
:1. Introduction
2. Related Work and Contributions
2.1. Related Work
2.2. Contribution
- We consider the multi-task offloading problem based on OST, where structured tasks are divided into multiple subtasks and offloaded to the MEC servers with the goal of minimizing the total task processing time.
- We propose a time-optimized function to simulate the situation where a mobile node needs to perform offloading as far as possible before the task data become obsolete in a realistic scenario and inject it into the decision model.
- We propose a time-optimized multi-task offloading model based on OST aiming at maximizing the probability of offloading to the optimal servers for general distribution scenarios.
- We propose a better time-optimized multi-task offloading model based on OST with the objective of minimizing the total task processing time for some realistic road scenarios where the CPU utilization may have an approximately uniform distribution.
- We provide an experimental comparison, performance evaluation and sensitivity analysis of the models in this paper and a series of models in other research using simulated and real data sets.
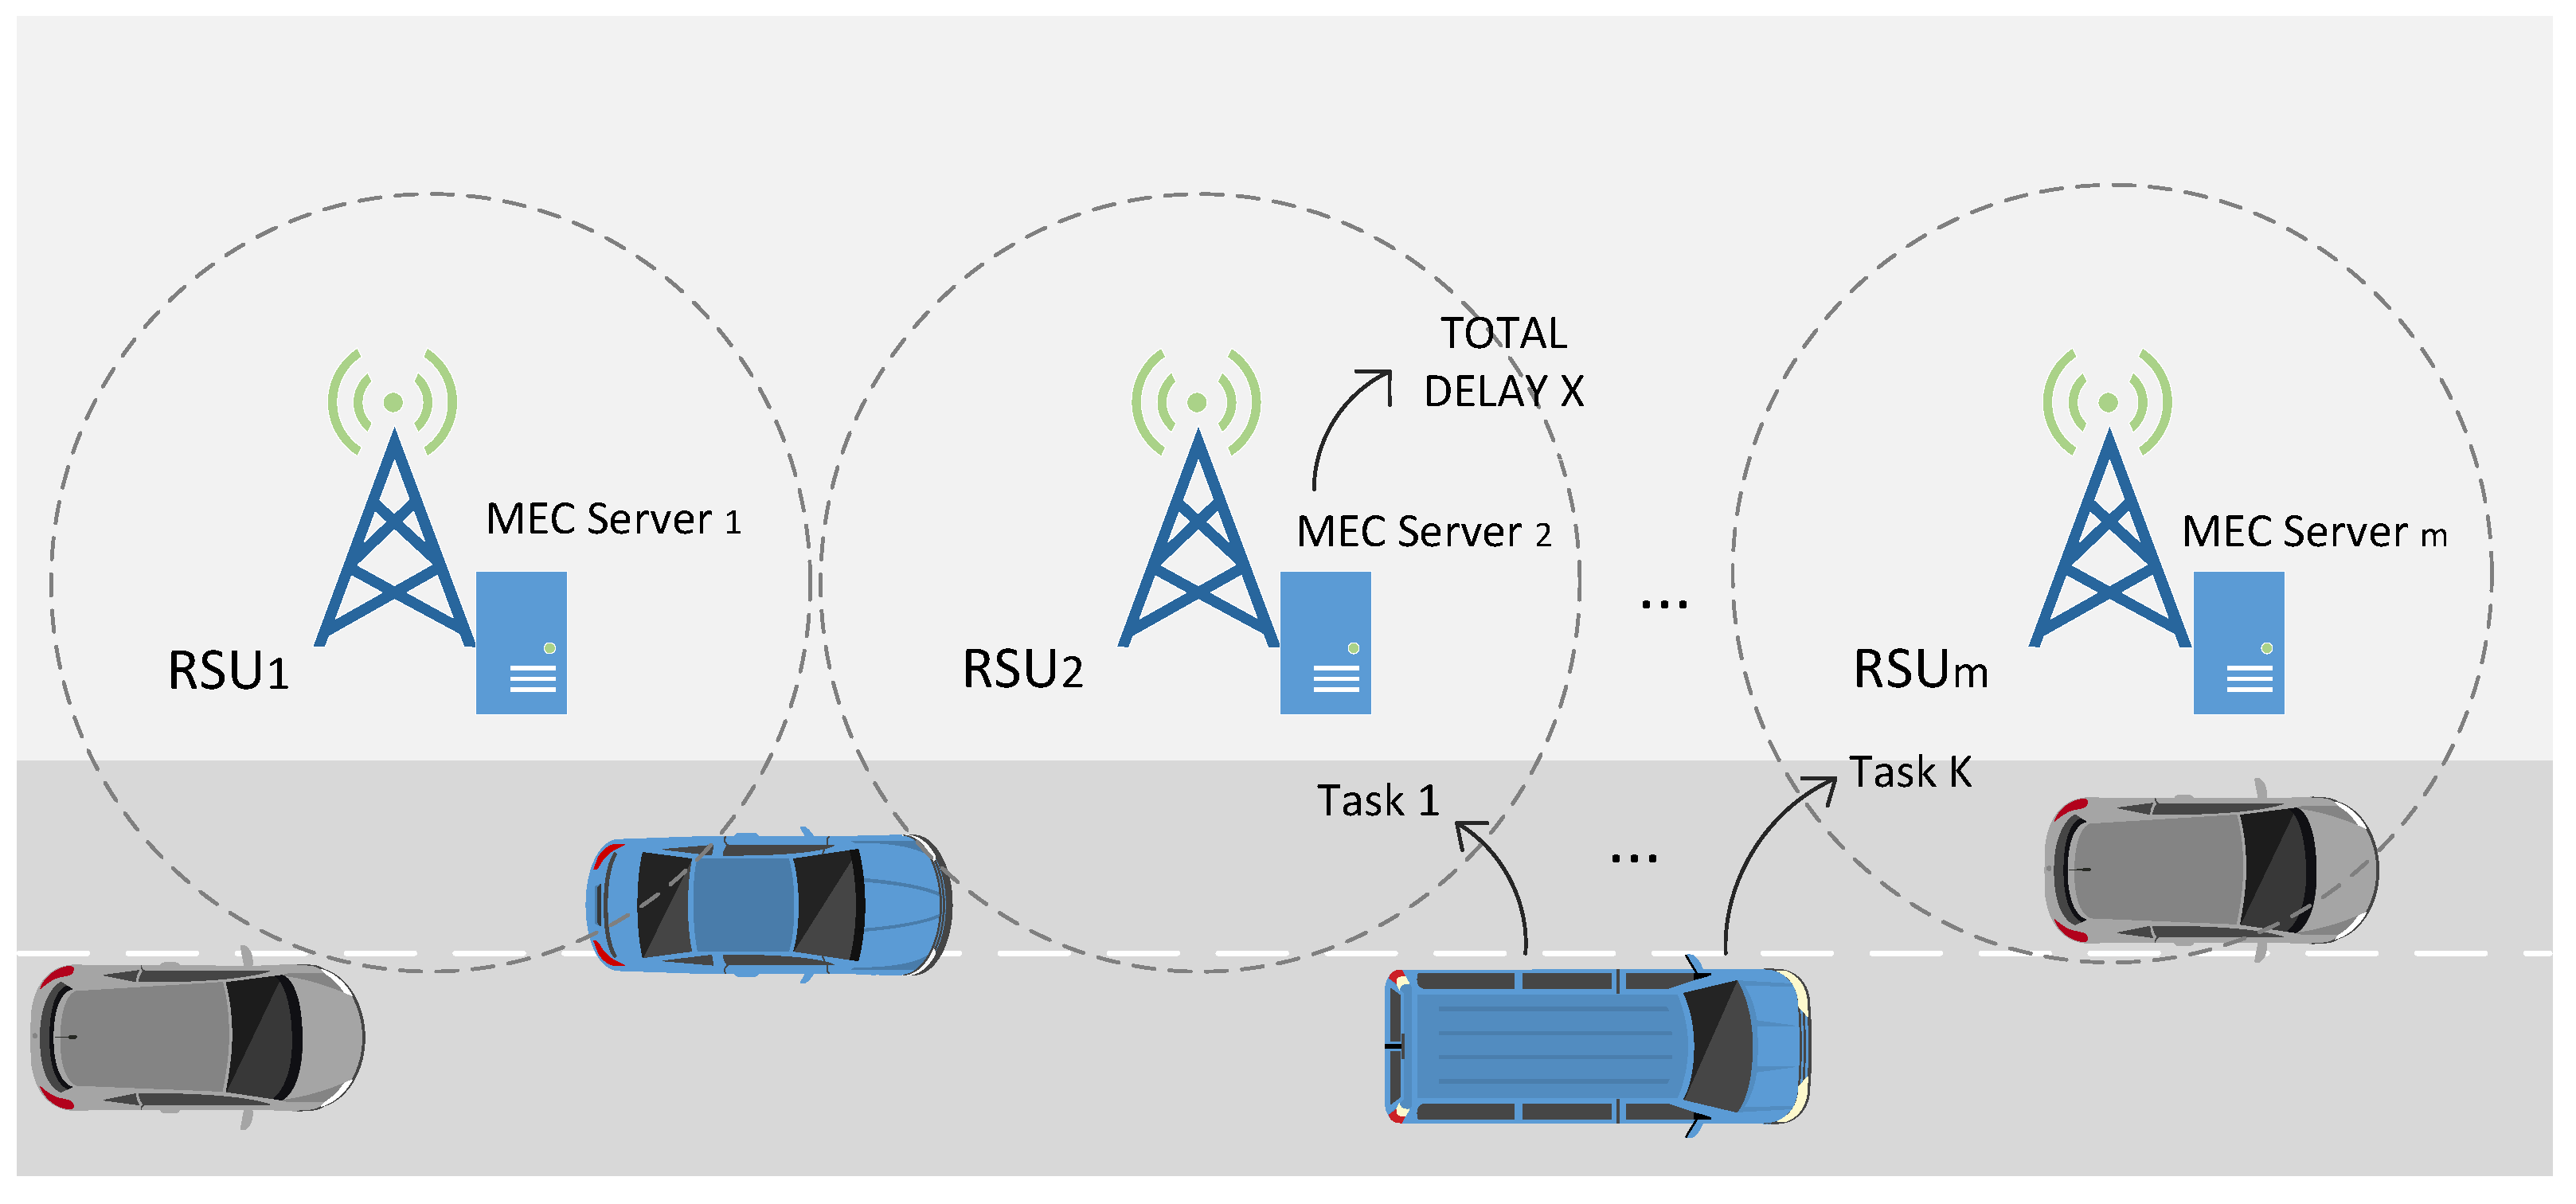
3. System Model and Problem Description
4. Computational Model
4.1. General Model
4.2. Time-Optimized Multi-Task Offloading Model
- T is linear non-increasing in i.
- When , the observable time starts, the value of T is maximum, .
- When , the observable time is over, the value of T is minimum.
- 1.
- For the general distribution scenarios of X, a time-optimized K-Best Choice (K-Best) strategy is proposed with the objective of maximizing the probability of selecting the best servers.
- 2.
- For some realistic road scenarios where the CPU utilization may have an approximately uniform distribution, a time-optimized K-Best selection based on Uniform distribution (KBU) strategy is proposed with the goal of minimizing the total processing time for K selections.
4.2.1. The K-Best Model
- (1)
- Compulsory candidate server : the current server utilization detected by the mobile node is ; if and the relative ranking , then it is a compulsory candidate server .
- (2)
- Marginal candidate server : the current server utilization detected by the mobile node is ; if or the relative ranking , then it is a marginal candidate server .
| Algorithm 1 The K-Best algorithm. |
| Require: stop node , random variables X, time optimization |
| function . |
| Ensure: total time delay. |
| for do |
| for do |
| if then |
| if and p = or then |
| perform offload; |
| ; |
| end if |
| else if and and then |
| perform offload; |
| ; |
| else if and no is in then |
| if and p = or then |
| perform offload; |
| ; |
| end if |
| end if |
| end for |
| end for |
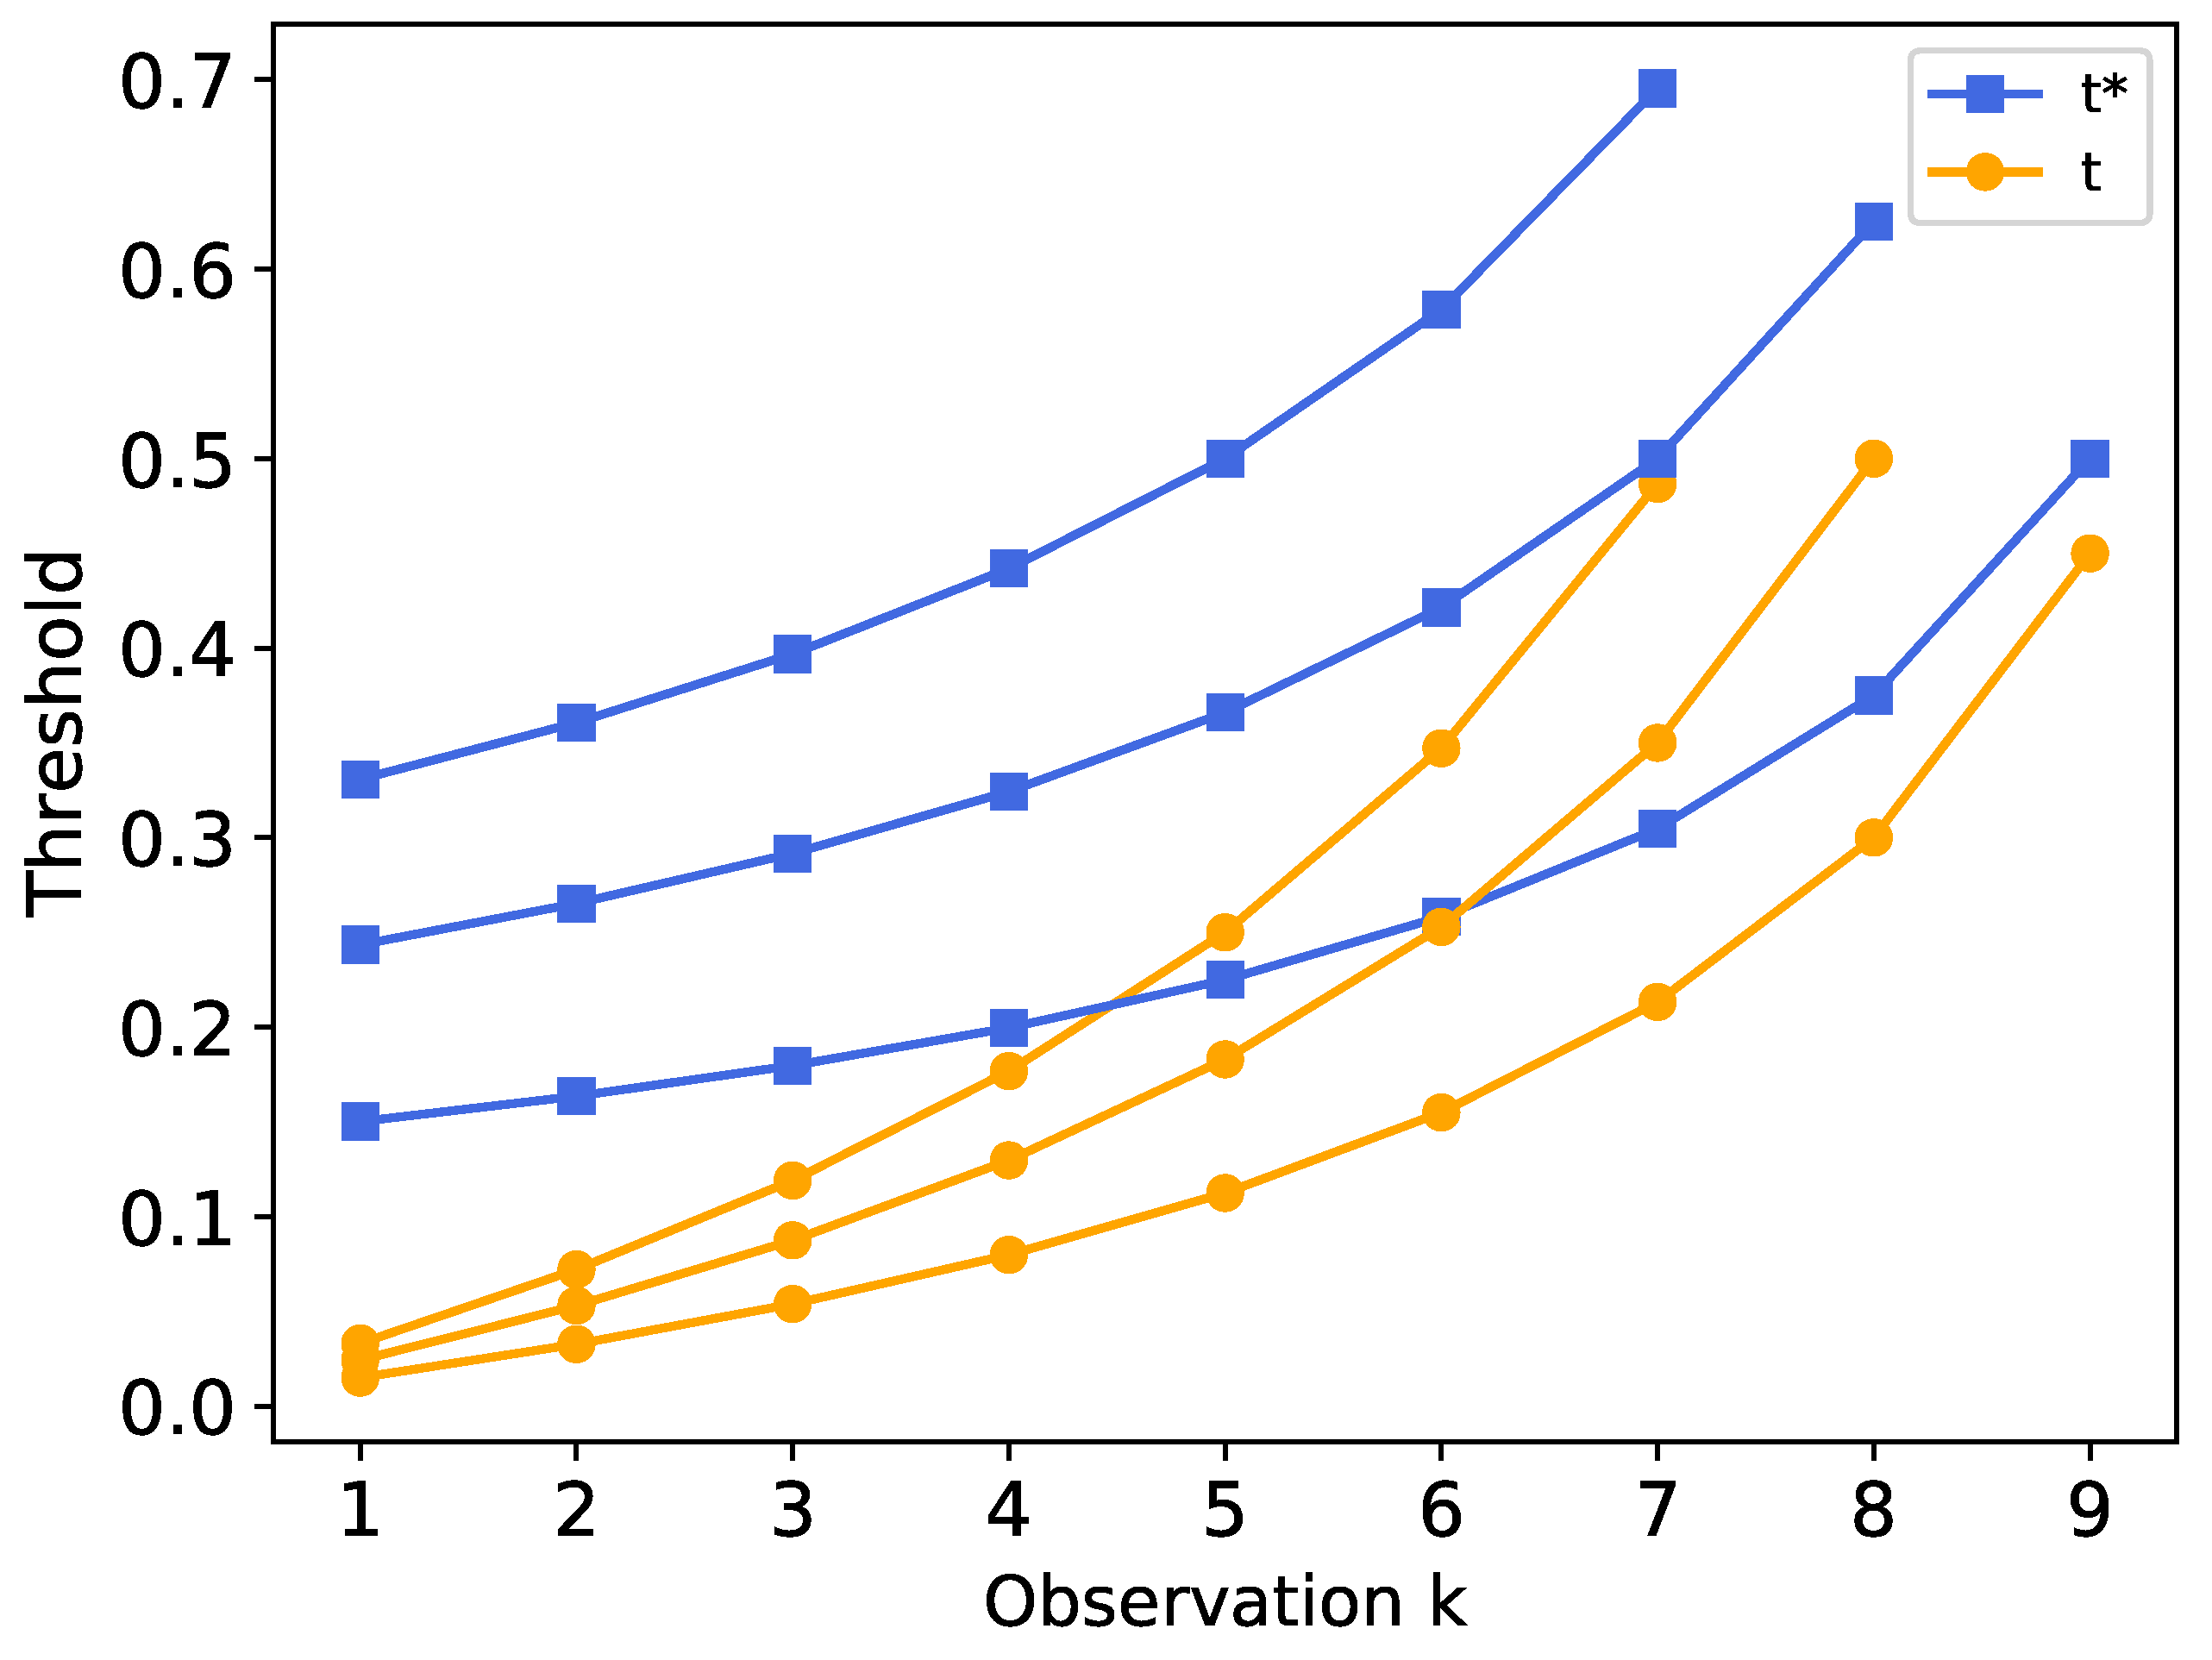
4.2.2. The KBU Model
| Algorithm 2 The KBU algorithm. |
| Require: distribution of random variable X, time-optimized function . |
| Ensure: total time delay . |
| A Obtain the minimum time delay: |
| (A1) |
| for do |
| ; |
| end for |
| (A2) |
| for ; do |
| ; |
| end for |
| (A3) |
| for and the initial conditions (A1) and (A2) do |
| ; |
| end for |
| B Obtain the optimal threshold: |
| (B1) |
| for do |
| ; |
| end for |
| (B2) |
| for do |
| for do |
| ; |
| end for |
| end for |
| ; |
| for do |
| for do |
| if number of nodes left ≤ number of unloaded tasks left then |
| perform offload; |
| else if then |
| perform offload; |
| end if |
| end for |
| end for |
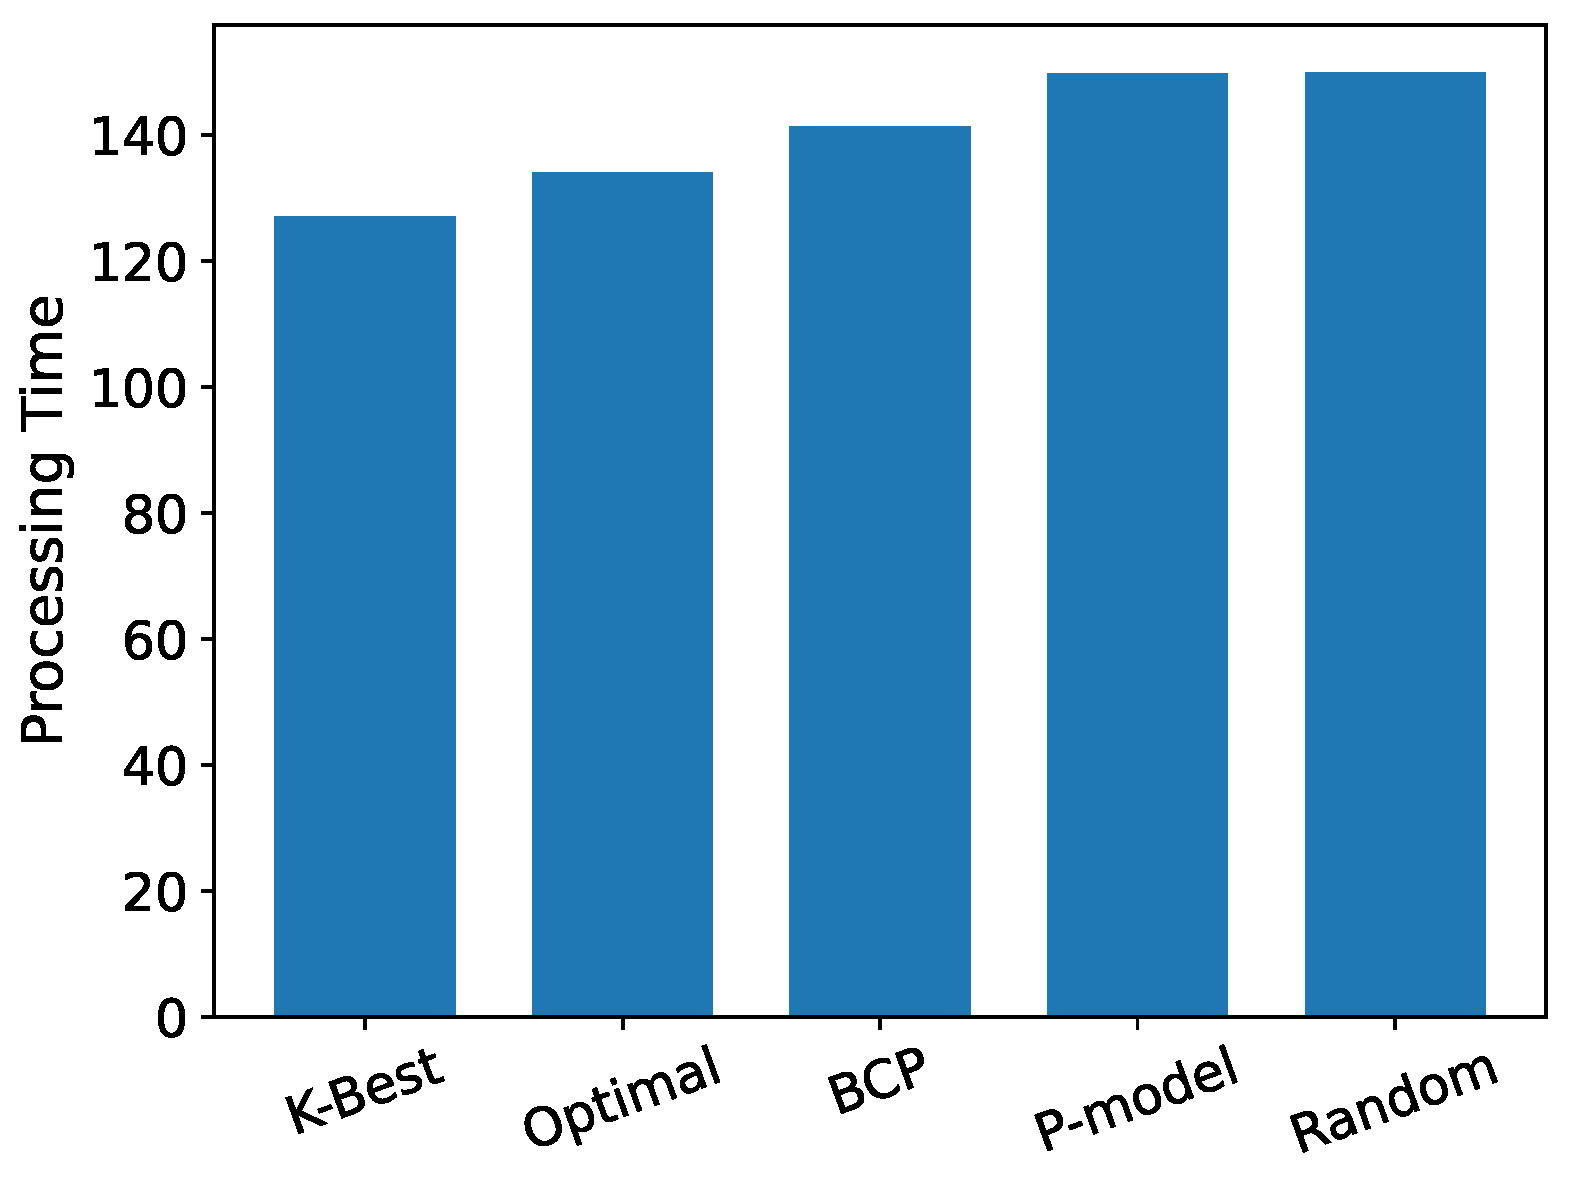
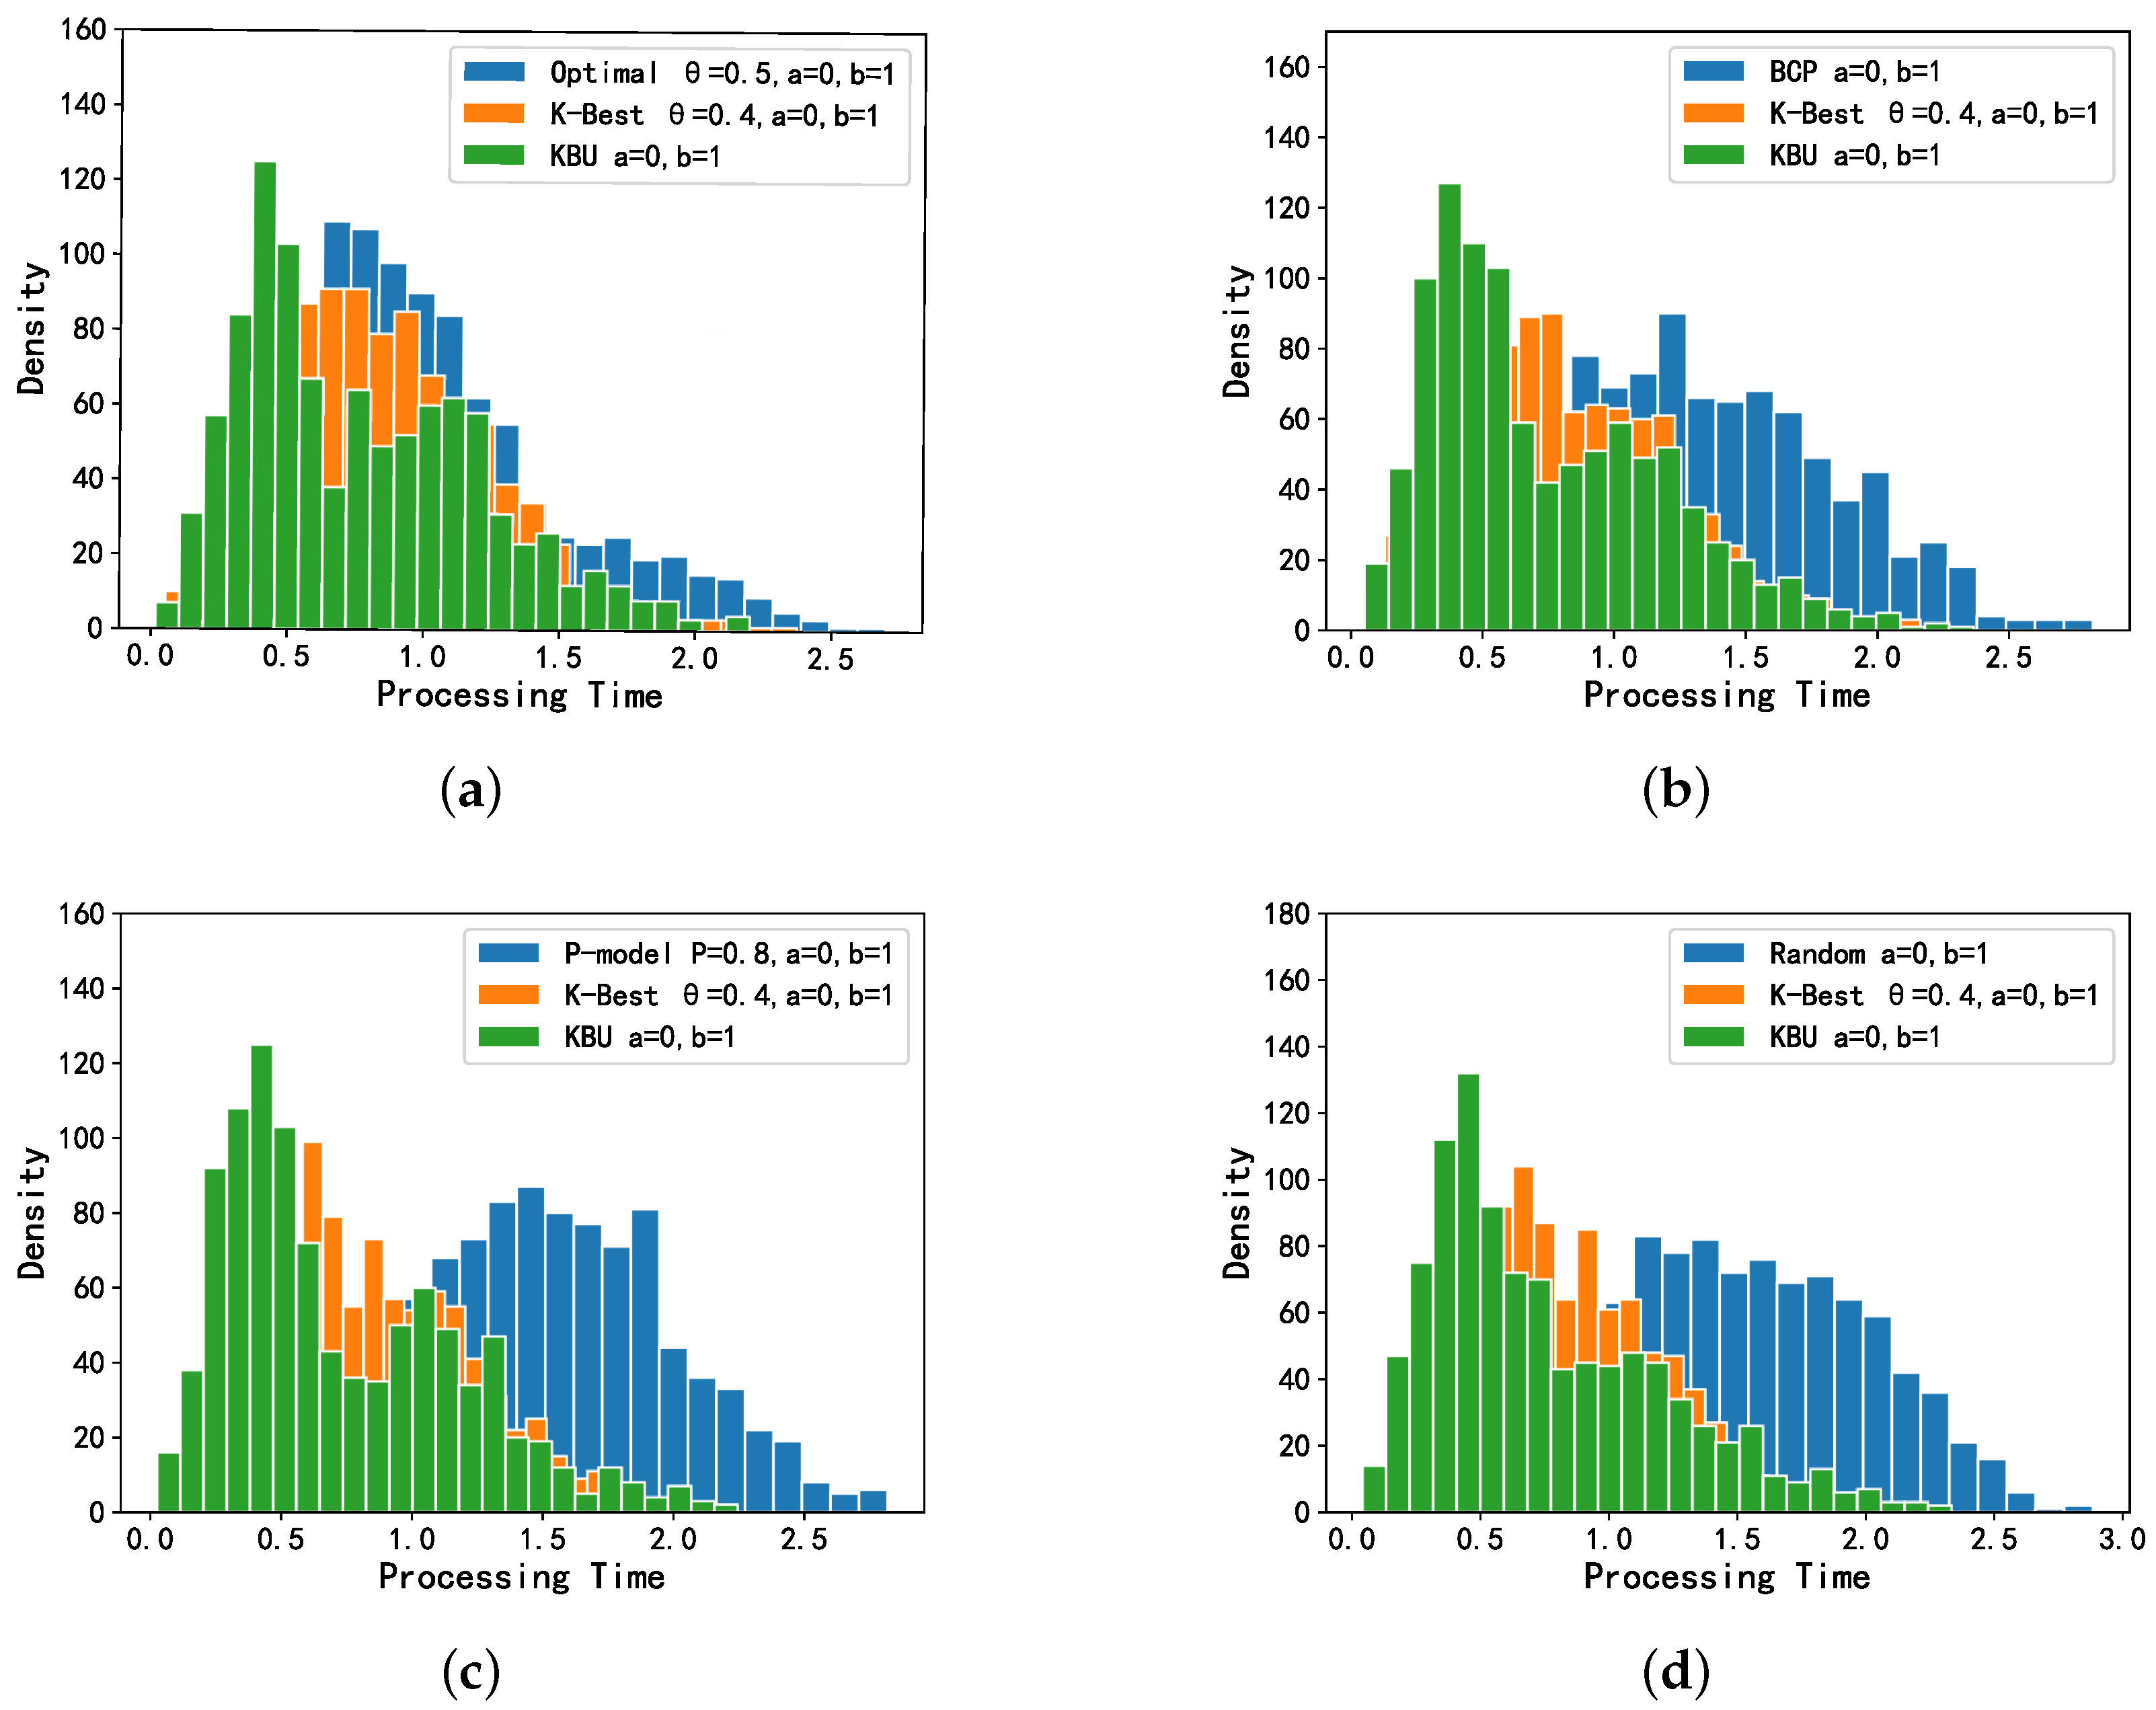
5. Experimental Evaluation
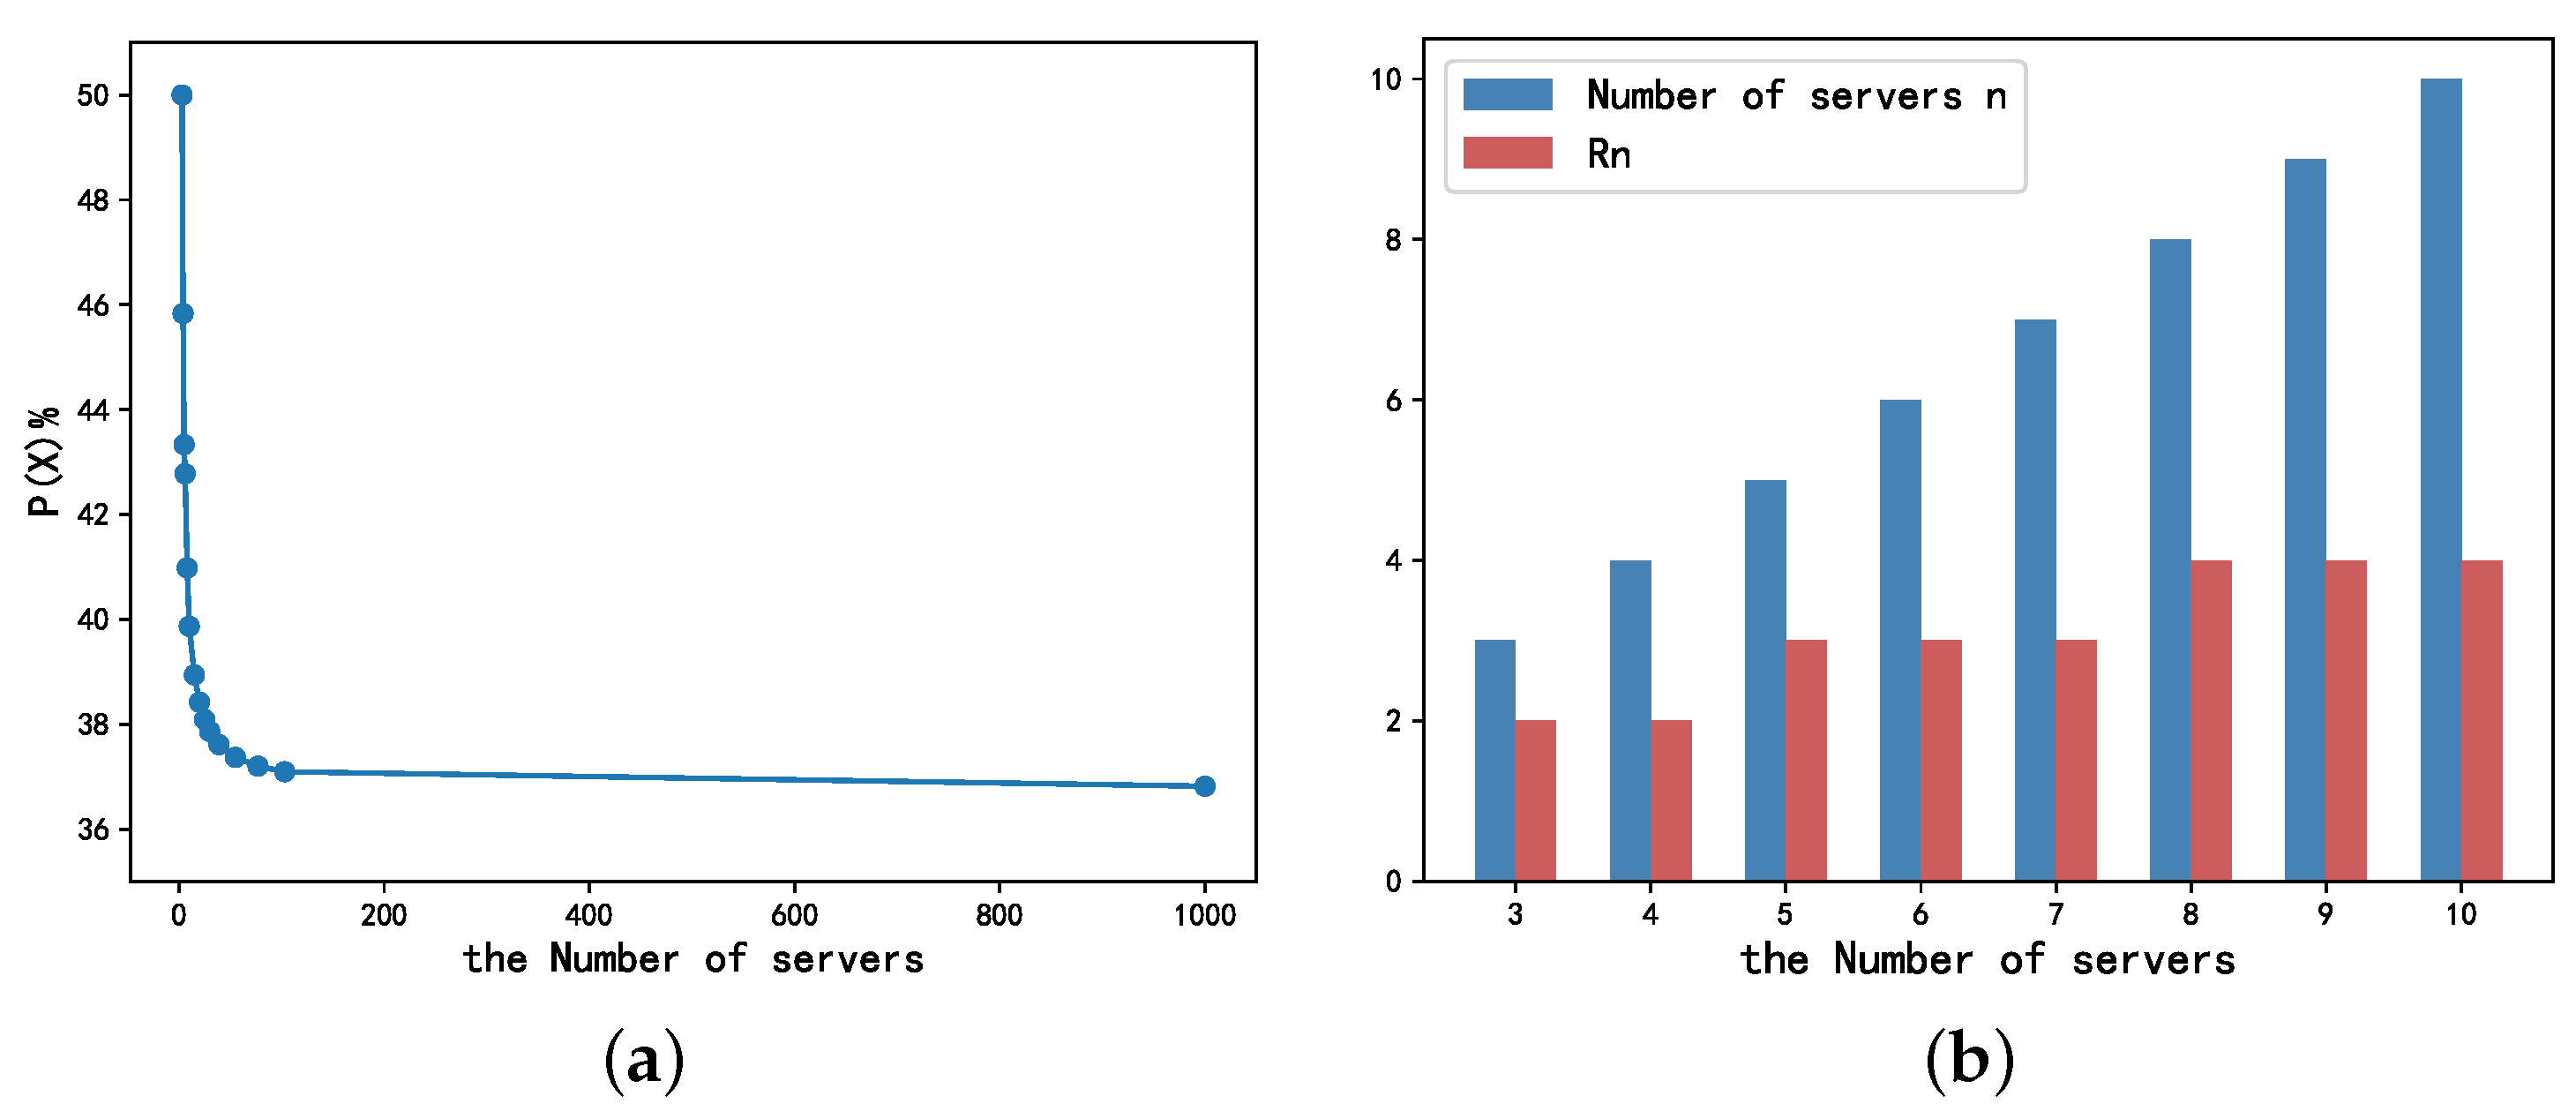
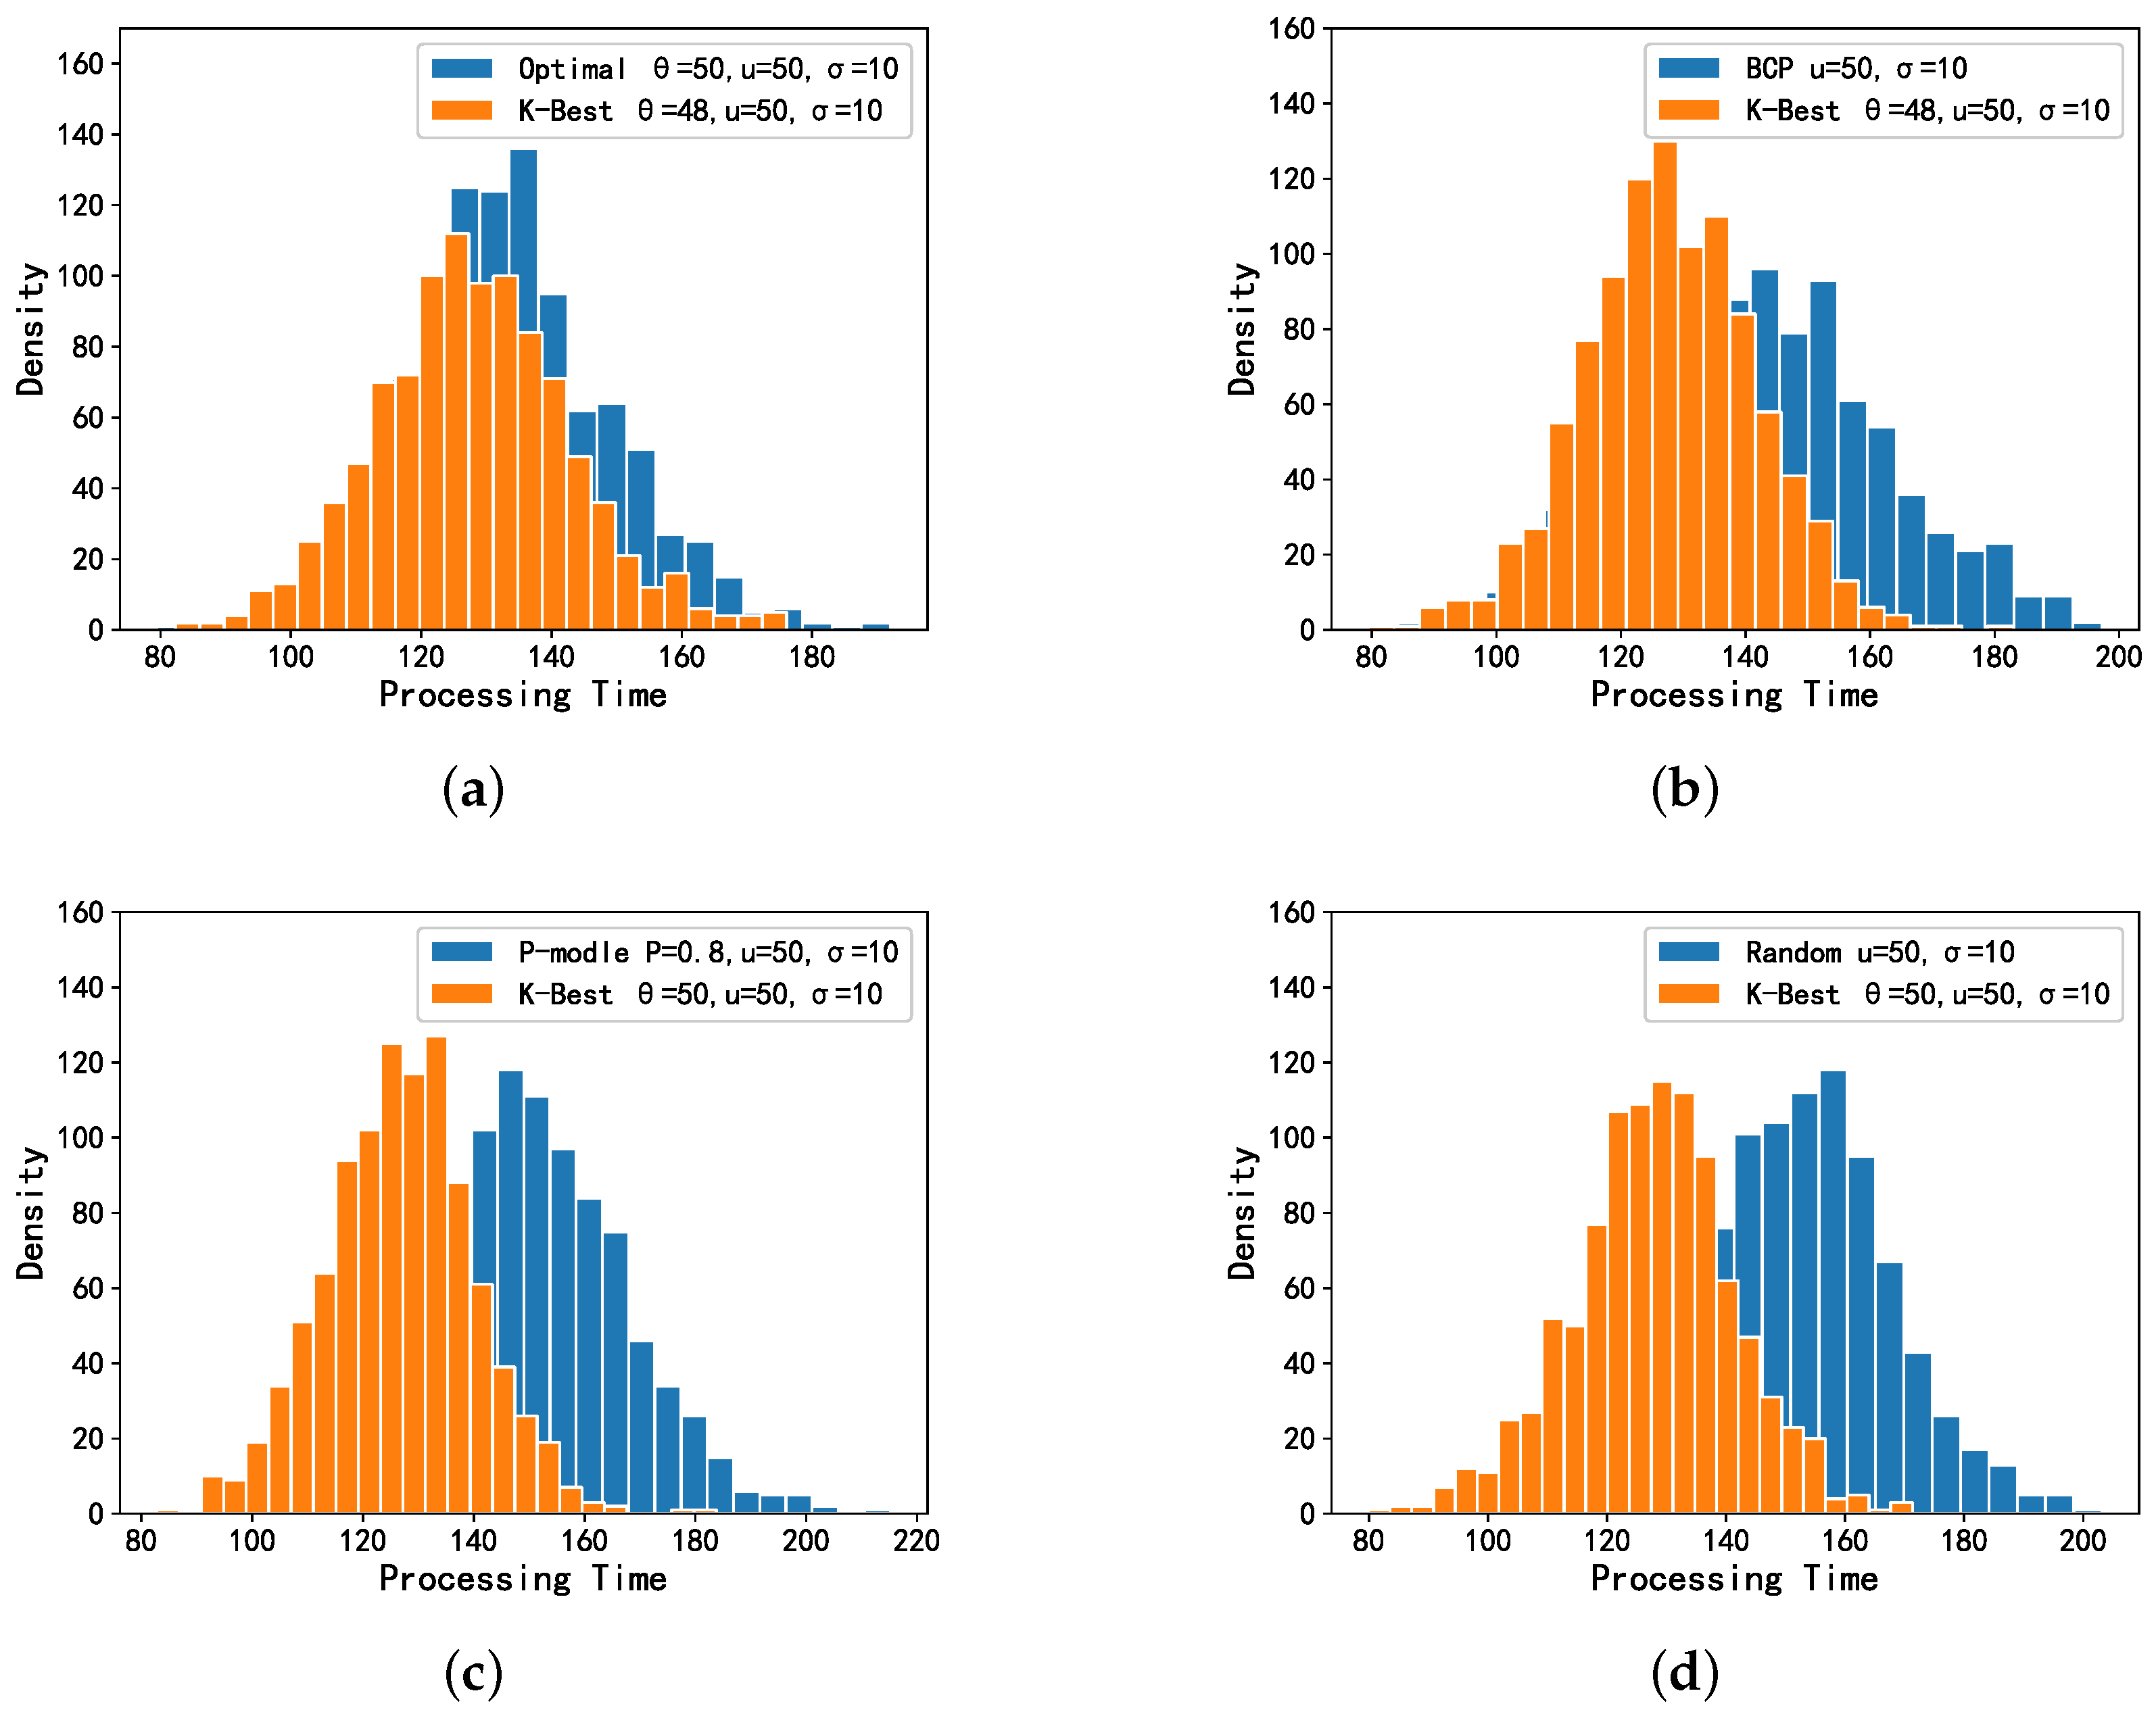
5.1. Evaluation Based on Simulated Data
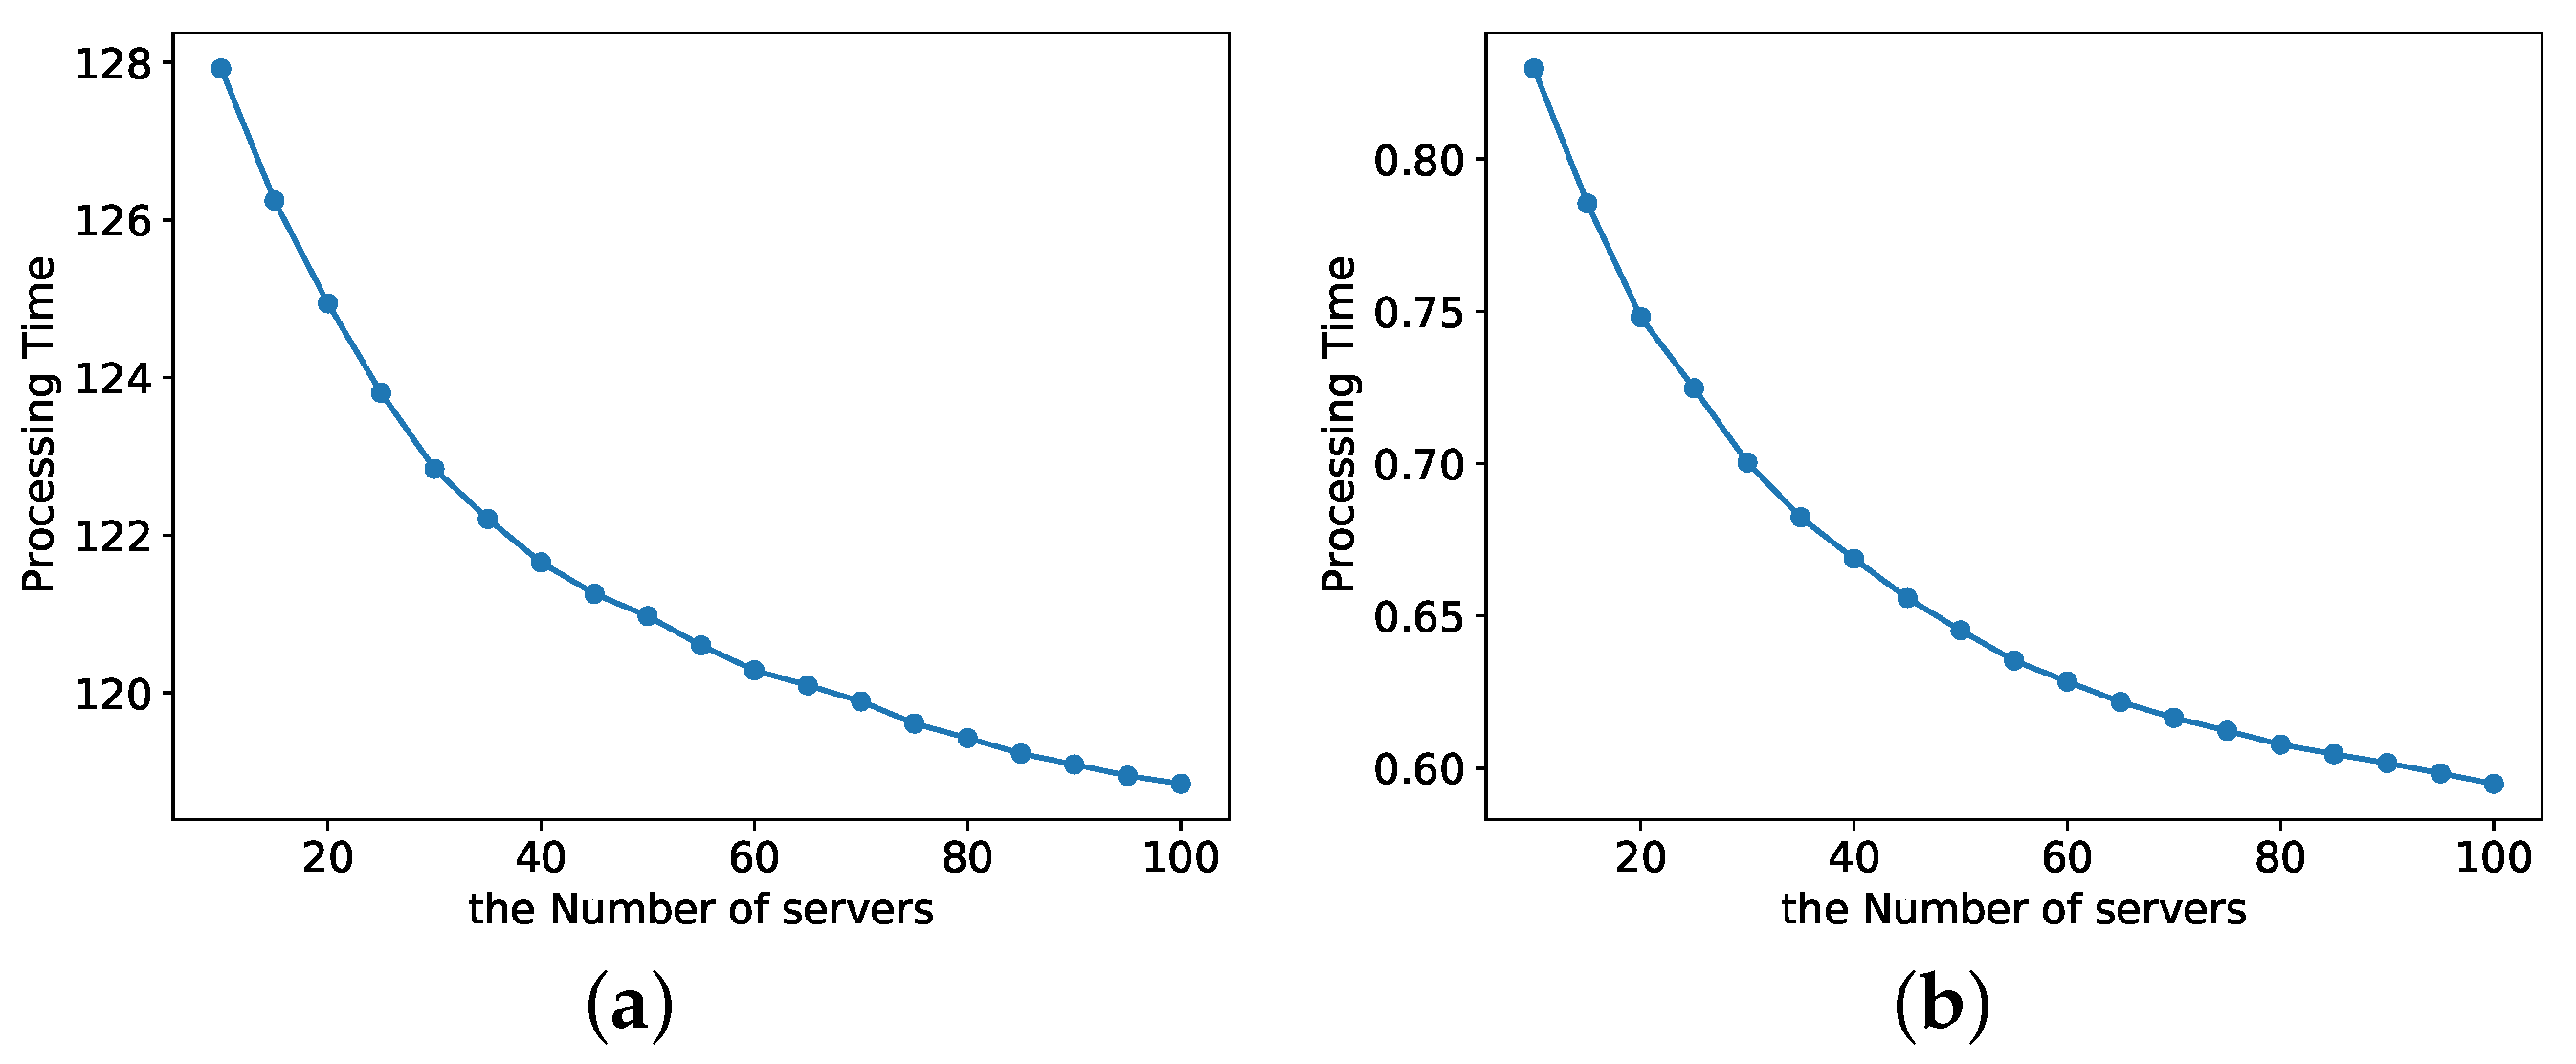
Sensitivity Analysis
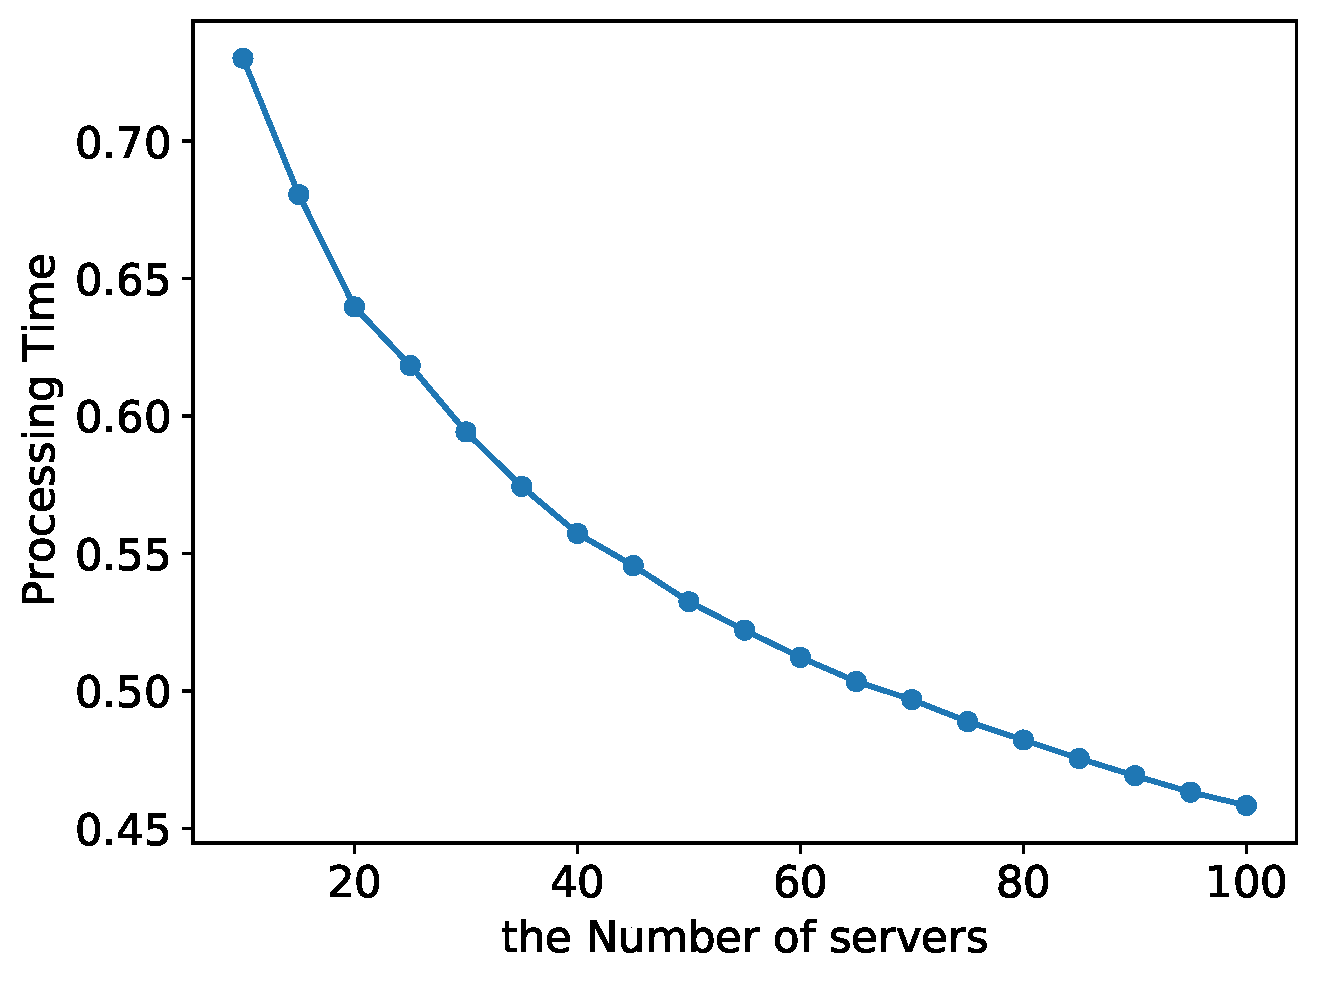
5.2. Evaluation Based on Real Data
Sensitivity Analysis
6. Conclusions
Author Contributions
Funding
Institutional Review Board Statement
Informed Consent Statement
Data Availability Statement
Conflicts of Interest
References
- Liyanage, M.; Porambage, P.; Ding, A.Y.; Kalla, A. Driving forces for Multi-Access Edge Computing (MEC) IoT integration in 5G. ICT Express 2021, 7, 127–137. [Google Scholar] [CrossRef]
- Kekki, S.; Featherstone, W.; Fang, Y.; Kuure, P.; Li, A.; Ranjan, A.; Purkayastha, D.; Jiangping, F.; Frydman, D.; Verin, G.; et al. MEC in 5G networks. ETSI White Pap. 2018, 28, 1–28. [Google Scholar]
- Pham, Q.V.; Fang, F.; Ha, V.N.; Piran, M.J.; Le, M.; Le, L.B.; Hwang, W.J.; Ding, Z. A survey of multi-access edge computing in 5G and beyond: Fundamentals, technology integration, and state-of-the-art. IEEE Access 2020, 8, 116974–117017. [Google Scholar] [CrossRef]
- Zhang, K.; Mao, Y.; Leng, S.; He, Y.; Zhang, Y. Mobile-edge computing for vehicular networks: A promising network paradigm with predictive off-loading. IEEE Veh. Technol. Mag. 2017, 12, 36–44. [Google Scholar] [CrossRef]
- Sabella, D.; Moustafa, H.; Kuure, P.; Kekki, S.; Zhou, Z.; Li, A.; Thein, C.; Fischer, E.; Vukovic, I.; Cardillo, J.; et al. Toward Fully Connected Vehicles: Edge Computing for Advanced Automotive Communications; 5GAA: Munich, Germany, 2017. [Google Scholar]
- Dziyauddin, R.A.; Niyato, D.; Luong, N.C.; Izhar, M.A.M.; Hadhari, M.; Daud, S. Computation offloading and content caching delivery in vehicular edge computing: A survey. arXiv 2019, arXiv:1912.07803. [Google Scholar]
- Feng, J.; Liu, Z.; Wu, C.; Ji, Y. Mobile edge computing for the internet of vehicles: Offloading framework and job scheduling. IEEE Veh. Technol. Mag. 2018, 14, 28–36. [Google Scholar] [CrossRef]
- Gao, H.; Huang, W.; Yang, X. Applying probabilistic model checking to path planning in an intelligent transportation system using mobility trajectories and their statistical data. Intell. Automat. Soft Comput. 2019, 25, 547–559. [Google Scholar] [CrossRef]
- Deng, S.; Huang, L.; Taheri, J.; Zomaya, A.Y. Computation offloading for service workflow in mobile cloud computing. IEEE Trans. Parallel Distrib. Syst. 2014, 26, 3317–3329. [Google Scholar] [CrossRef]
- Tang, W.; Zhao, X.; Rafique, W.; Qi, L.; Dou, W.; Ni, Q. An offloading method using decentralized P2P-enabled mobile edge servers in edge computing. J. Syst. Archit. 2019, 94, 1–13. [Google Scholar] [CrossRef]
- Li, M.; Si, P.; Zhang, Y. Delay-tolerant data traffic to software-defined vehicular networks with mobile edge computing in smart city. IEEE Trans. Veh. Technol. 2018, 67, 9073–9086. [Google Scholar] [CrossRef]
- Ferguson, T. Optimal Stopping and Applications; UCLA Department of Mathematics: Los Angeles, CA, USA, 2020. [Google Scholar]
- Ko, H.; Lee, J.; Pack, S. Spatial and temporal computation offloading decision algorithm in edge cloud-enabled heterogeneous networks. IEEE Access 2018, 6, 18920–18932. [Google Scholar] [CrossRef]
- Li, Z.; Hu, H.; Hu, H.; Huang, B.; Ge, J.; Chang, V. Security and Energy-aware Collaborative Task Offloading in D2D communication. Future Gener. Comput. Syst. 2021, 118, 358–373. [Google Scholar] [CrossRef]
- Ouyang, T.; Chen, X.; Zeng, L.; Zhou, Z. Cost-aware edge resource probing for infrastructure-free edge computing: From optimal stopping to layered learning. In Proceedings of the 2019 IEEE Real-Time Systems Symposium (RTSS), Hong Kong, China, 3–6 December 2019; IEEE: Piscataway, NJ, USA, 2019; pp. 380–391. [Google Scholar]
- Alghamdi, I.; Anagnostopoulos, C.; Pezaros, D.P. Time-optimized task offloading decision making in mobile edge computing. In Proceedings of the 2019 Wireless Days (WD), Manchester, UK, 24–26 April 2019; IEEE: Piscataway, NJ, USA, 2019; pp. 1–8. [Google Scholar]
- Alghamdi, I.; Anagnostopoulos, C.; P Pezaros, D. Delay-tolerant sequential decision making for task offloading in mobile edge computing environments. Information 2019, 10, 312. [Google Scholar] [CrossRef]
- Alghamdi, I.; Anagnostopoulos, C.; Pezaros, D.P. On the optimality of task offloading in mobile edge computing environments. In Proceedings of the 2019 IEEE Global Communications Conference (GLOBECOM), Big Island, HI, USA, 9–13 December 2019; IEEE: Piscataway, NJ, USA, 2019; pp. 1–6. [Google Scholar]
- Alghamdi, I.; Anagnostopoulos, C.; Pezaros, D.P. Data quality-aware task offloading in mobile edge computing: An optimal stopping theory approach. Future Gener. Comput. Syst. 2021, 117, 462–479. [Google Scholar] [CrossRef]
- Kuang, L.; Gong, T.; OuYang, S.; Gao, H.; Deng, S. Offloading decision methods for multiple users with structured tasks in edge computing for smart cities. Future Gener. Comput. Syst. 2020, 105, 717–729. [Google Scholar] [CrossRef]
- Zhang, J.; Letaief, K.B. Mobile edge intelligence and computing for the internet of vehicles. Proc. IEEE 2019, 108, 246–261. [Google Scholar] [CrossRef]
- Le Tan, C.N.; Klein, C.; Elmroth, E. Location-aware load prediction in edge data centers. In Proceedings of the 2017 Second International Conference on Fog and Mobile Edge Computing (FMEC), Valencia, Spain, 8–11 May 2017; IEEE: Piscataway, NJ, USA, 2017; pp. 25–31. [Google Scholar]
- Mach, P.; Becvar, Z. Mobile edge computing: A survey on architecture and computation offloading. IEEE Commun. Surv. Tutorials 2017, 19, 1628–1656. [Google Scholar] [CrossRef]
- Plachy, J.; Becvar, Z.; Mach, P. Path selection enabling user mobility and efficient distribution of data for computation at the edge of mobile network. Computer Net. 2016, 108, 357–370. [Google Scholar] [CrossRef]
- Silva, B.; Junior, W.; Dias, K.L. Network and cloudlet selection for computation offloading on a software-defined edge architecture. In Proceedings of the International Conference on Green, Pervasive, and Cloud Computing, Uberlândia, Brazil, 26–28 May 2019; Springer: Berlin/Heidelberg, Germany, 2019; pp. 147–161. [Google Scholar]
- Ferguson, T.S. Who solved the secretary problem? Stat. Sci. 1989, 4, 282–289. [Google Scholar] [CrossRef]
- Harth, N.; Anagnostopoulos, C.; Pezaros, D. Predictive intelligence to the edge: Impact on edge analytics. Evol. Syst. 2018, 9, 95–118. [Google Scholar] [CrossRef]
- Harth, N.; Anagnostopoulos, C. Edge-centric efficient regression analytics. In Proceedings of the 2018 IEEE International Conference on Edge Computing (EDGE), San Francisco, CA, USA, 2–7 July 2018; IEEE: Piscataway, NJ, USA, 2018; pp. 93–100. [Google Scholar]
- Anagnostopoulos, C.; Kolomvatsos, K. Predictive intelligence to the edge through approximate collaborative context reasoning. Appl. Intell. 2018, 48, 966–991. [Google Scholar] [CrossRef]
- Marjanović, M.; Antonić, A.; Žarko, I.P. Edge computing architecture for mobile crowdsensing. IEEE Access 2018, 6, 10662–10674. [Google Scholar] [CrossRef]
- Pu, L.; Chen, X.; Mao, G.; Xie, Q.; Xu, J. Chimera: An energy-efficient and deadline-aware hybrid edge computing framework for vehicular crowdsensing applications. IEEE Internet Things J. 2018, 6, 84–99. [Google Scholar] [CrossRef]
- Anagnostopoulos, C. Time-optimized contextual information forwarding in mobile sensor networks. J. Parallel Distrib. Comput. 2014, 74, 2317–2332. [Google Scholar] [CrossRef]
- Louchard, G.; Bruss, F.T. Finding the k Best Out of n Rankable Objects. A Consecutive Thresholds Algorithm. 2015. Available online: https://www.researchgate.net/publication/282580746_Finding_the_k_best_out_of_n_rankable_objects_A_consecutive_thresholds_Algorithm (accessed on 9 October 2021).
- Bruss, T. On a Class of Optimal Stopping Problems with Mixed Constraints. Discret. Math. Theor. Comput. Sci. 2010, 12, 363–380. [Google Scholar] [CrossRef]
- SimPy, T. Simpy: Discrete event simulation for python, Python Package Version 3 (9). 2017. Available online: https://simpy.readthedocs.io/en/latest/ (accessed on 1 August 2021).
- Zhang, D.; Zhao, J.; Zhang, F.; He, T. UrbanCPS: A cyber-physical system based on multi-source big infrastructure data for heterogeneous model integration. In Proceedings of the ACM/IEEE Sixth International Conference on Cyber-Physical Systems, Seattle, WA, USA, 14–16 April 2015; pp. 238–247. [Google Scholar]
- Alibaba Cluster Trace Program Cluster-Trace-v2018. 2018. Available online: https://github.com/alibaba/clusterdata/blob/master/cluster-trace-v2018/trace2018.md (accessed on 9 October 2021).


| Notation | Explanation |
|---|---|
| X | Random variable for server processing time |
| i | Random variable for server processing time |
| n | The serial number of the observed server |
| Threshold in the offloading model | |
| K | Number of tasks that need to offload |
| Stop node in the BCP model | |
| Maximum probability in the BCP model | |
| Time-optimized function | |
| The i-th decision number that has been selected | |
| The probability of the i-th possible offloading branch in the K-Best model | |
| Mandatory candidate in the K-Best model | |
| Edge candidate in the K-Best model | |
| Stop nodes in the K-Best model | |
| Total time delay in KBU model | |
| Optimal threshold after time optimization in KBU model | |
| P | The probability P in the p-model |
| Parameters | Value/Rang |
|---|---|
| X | N (50,10), U (0,1) |
| Number of mobile nodes | 1000 |
| K | 3 |
| n | 10 |
| Threshold of K-Best | 48 |
| Threshold of Optimal | 50 |
| P for the p-modle | 0.8 |
| Taxi ID | Movement ID | Location | Machine Name | CPU Utilization |
|---|---|---|---|---|
| 178 | 2014/10/22 8:00:20 | (22.5965, 114.114601) | m_1935 | (23) |
| 178 | 2014/10/22 8:00:50 | (22.5966, 114.1182 02) | m_1937 | (35) |
| 178 | 2014/10/22 8:01:20 | (22.5968, 114.1194) | m_1938 | (54) |
| 178 | 2014/10/22 8:01:50 | (22.5965, 114.119598) | m_1938 | (26) |
| Taxi ID | Movement ID |
|---|---|
| X | Real servers CPU utilization in |
| Number of mobile nodes | 1000 |
| K | 3 |
| n | 10 |
| Threshold of K-Best | 48 |
| Threshold of Optimal | 50 |
| P for the p-modle | 0.8 |
Publisher’s Note: MDPI stays neutral with regard to jurisdictional claims in published maps and institutional affiliations. |
© 2022 by the authors. Licensee MDPI, Basel, Switzerland. This article is an open access article distributed under the terms and conditions of the Creative Commons Attribution (CC BY) license (https://creativecommons.org/licenses/by/4.0/).
Share and Cite
Mu, L.; Ge, B.; Xia, C.; Wu, C. Multi-Task Offloading Based on Optimal Stopping Theory in Edge Computing Empowered Internet of Vehicles. Entropy 2022, 24, 814. https://doi.org/10.3390/e24060814
Mu L, Ge B, Xia C, Wu C. Multi-Task Offloading Based on Optimal Stopping Theory in Edge Computing Empowered Internet of Vehicles. Entropy. 2022; 24(6):814. https://doi.org/10.3390/e24060814
Chicago/Turabian StyleMu, Liting, Bin Ge, Chenxing Xia, and Cai Wu. 2022. "Multi-Task Offloading Based on Optimal Stopping Theory in Edge Computing Empowered Internet of Vehicles" Entropy 24, no. 6: 814. https://doi.org/10.3390/e24060814
APA StyleMu, L., Ge, B., Xia, C., & Wu, C. (2022). Multi-Task Offloading Based on Optimal Stopping Theory in Edge Computing Empowered Internet of Vehicles. Entropy, 24(6), 814. https://doi.org/10.3390/e24060814