1. Introduction
Data classification has recently become an essential activity in solving and handling problems in which large datasets are involved. When used as a tool for data classification, pattern recognition algorithms may have a fundamental implication in the decision-making process. There are two prominent methods defined for data classification: supervised classification, where the number of groups has to be defined before classification, and unsupervised classification, in which it is expected that the algorithm performs the clustering analysis by itself without requiring a previous setup of the parameters. Density clustering techniques are a subgroup of unsupervised pattern recognition algorithms. These algorithms involve methodologies to identify a particular density in the space of points from a specific dataset. Therefore, density interrelated elements will be included in a particular cluster. As a result, density-based clustering algorithms can determine clusters with a significant diversity of shapes and discriminate meaningful information from outliers [
1,
2].
Density-Based Spatial Clustering of Application with Noise (DBSCAN) is a density-based unsupervised classification method developed by Easter et al. and presented in 1996 [
3]; however, it is still recognized as a helpful method due to its simplicity and good overall performance [
4]. Density-based algorithms such as DBSCAN, Clustering Large Applications based on Randomized Search (CLARANS) [
5], and Ordering Points To Identify Clustering Structure (OPTICS) [
6], among others [
7,
8], are used for exploratory analysis, where classes belonging to a specific dataset
D are not completely defined or the set is by nature randomized. Furthermore, unlike popular clustering algorithms, such as K-means, DBSCAN does not require limiting the number of clusters or classes previously.
The DBSCAN algorithm is not entirely automatized, and defining two input parameters that depend on the analyzed dataset
D is thus needed to perform the clustering process. These input parameters are Eps and MinPts, which depend on the density and magnitude of the specific dataset
D being examined. Eps is the radius of an imaginary circumference where a minimum set of points is reachable when using the Euclidean distance defined by the parameter MinPts. Although DBSCAN was first introduced in 1996, the algorithm is still widely used today, being awarded the SIGKDD Test-of-Time Award in 2014. Its relevance is associated with its ease of implementation and reasonable computational cost,
, when used in large datasets [
4]. Nevertheless, the algorithm may achieve an acceptable computational cost, as well as its precision will vastly depend on the selection of parameters Eps and MinPts, since these parameters must be adjusted according to the specific dataset being analyzed.
The DBSCAN algorithm measures distance from point to point using the well-known Euclidean distance, i.e., DBSCAN could perform a clustering analysis in dimensional spaces greater than two. Even though the Euclidean distance can be measured in an n-dimensional space, the clustering process entails a lower computational complexity cost when performed in a two-dimensional space. Consequently, if the dataset being analyzed has a dimension higher than two, it is deemed necessary to evaluate the use of a strategy for dimensional reduction as part of pre-processing, such as Principal Component Analysis (PCA) or the Factor Analysis (FA) method. Datasets can be handled before clustering using a dimensionality reduction method. Although a fraction of information is lost, benefits can be expected in the overall clustering process by reducing computational costs.
Many variations of the DBSCAN algorithm have been developed to obtain a highly autonomous and precise algorithm with the lowest possible computational cost. In addition, different performance metrics can be used as algorithm evaluation metrics to improve their performance. BIRCHSCAN is an algorithm presented by de Moura [
9], where the BIRCH algorithm was merged with DBSCAN as a strategy for significant dataset clustering. The CF-Three method and a threshold were determined for the Eps parameter selection. The BIRCH algorithm is defined to evaluate the dataset to select a smaller representative biased sub-dataset, which is evaluated using DBSCAN. The evaluation metrics selected for this methodology are the Rand Index and the Adjusted Rand Index.
Lai et al. [
10] presented a method based on Multi-Verse Optimization (MVO) to improve the selection of DBSCAN parameters Eps and MinPts using the
r rates in the Accuracy of artificial datasets. In the study proposed by Wang et al. [
11], a method for automatic estimation of the DBSCAN parameter Eps was defined for LiDAR data segmentation clustering. The estimation of the parameter Eps was based on the average value in the population defined by the nearest neighbor function. The accuracy of the results was estimated using reference data.
The paper presented by Darong and Peng [
12] combined a grid partition technique with DBSCAN, calling the methodology GRPDBSCAN. The strategy implies partitioning the information on grids and then finding the suitable DBSCAN parameters considering the information contained in each partition. Although the authors emphasized the algorithm’s precision, it was not clear how the clustering performance was measured in this work. Ohadi et al. defined a new DBSCAN algorithm called SW-DBSCAN [
13] formulated on the sliding window grid-based model [
14]. Nevertheless, in this paper, the evaluation of the algorithm was measured using the Accuracy metric. The algorithm BDE-DBSCAN proposed by Karami and Johansson [
15] presents a methodology for automatic DBSCAN parameter definition using a hybrid optimization method called Binary Differential Evolution. An analytical process and the Tournament Selection (TS) technique were selected for Eps estimation. The performance of the algorithm was defined using the effectiveness metric.
The work presented by Kumar and Reddy [
16] adopted a methodology based on structures associated with specific groups that accelerate the neighborhood search queries. As a result, the clustering technique increased DBSCAN’s clustering performance by 2.2. This method is called G-DBSCAN, an accelerated DBSCAN algorithm that aims to find the nearest neighbor with the help of group methods. In short, the algorithm works by applying grouping partition methods to identify subgroups with similar patterns in a specific dataset
D, which is followed by a dimensional reduction method and the definition of the parameter Eps for each group.
Zhu et al. [
17] defined a methodology for an adaptive Eps parameter estimation implementing a Gauss kernel density method considering the clustering of unbalanced artificial datasets. Clustering performance was evaluated using the Rand Index and V-measure. A novel algorithm was presented in [
18]; this algorithm, called K-DBSCAN, is considered as an optimization algorithm called Harmony Search (HS), which designates the proper value of the clustering parameters. Here, the cluster number K is predefined by a partition clustering approach. The HS algorithm defines the optimal value for the DBSCAN parameters. The Rand Index and Jaccard coefficient are the evaluation metrics selected to measure the algorithm’s effectiveness.
A parameter-free method called Dsets-DBSCAN was reported by Hou et al. [
19]. A histogram equalization transformation of similarity matrices was executed in this work to create a dominant set of independent parameters. The quality of the results was estimated using the F-measure metric. The results showed a remarkable performance of the parameter-free algorithm. The methodology presented in [
20,
21] also used a parameter-free clustering process for DBSCAN using the nearest neighbor function commonly denoted as
k-
. The evaluation of the algorithm was performed by visual inspection of the results. Ozkok and Celik [
22] presented a novel algorithm called AE-DBSCAN, which included a method for the automatic definition of parameters Eps and MinPts. They also considered the
k-
by using the nearest neighbor function. Soni and Ganatra [
23] proposed a new algorithm called AGED. The methodology defines a group of densities extracted from the dataset clustered using the well-known nearest neighbor function, specifically the
k-
plot. This work evaluated a variety of performance metrics, including the Dunn Index, the Pearson Gamma coefficient, and the Entropy. Other methodologies based on the DBSCAN algorithm were presented in [
24,
25,
26,
27,
28].
As shown above, a large variety of metrics have been employed. However, Entropy as a metric has not been quite used for the performance evaluation of the DBSCAN algorithm and its variants. Here lies the intention of using Entropy as an evaluation metric considering the information given by DBSCAN after performing the clustering analysis. Entropy will manifest the orderly clustering in which results with values close to 0 are considered and grouped into datasets. In this work, the performance of a clustering hybrid algorithm called FA+GA-DBSCAN is presented, taking into account the DBSCAN algorithm as its core. This unsupervised pattern recognition algorithm was at first developed to identify the operational conditions in a structure under a variety of loads [
29]. Moreover, in order to define adequate values for Eps and MinPts, a Genetic Algorithm (GA) was implemented. The GA was based on a randomized population extracted from a particular dataset
D using distances selected by the nearest neighbor function and also included a set of points (x,y) belonging to the dataset
D being examined. Later, a radius that represents the parameter Eps was found. In this work, the data preprocessing, including normalization and data reduction, is shown in
Section 2. The definition of the DBSCAN parameters is specified in
Section 3. The evaluation of FA+GA-DBSCAN is performed in
Section 4. Two case studies using FA+GA-DBSCAN are presented in
Section 5. Conclusions are made in
Section 6.
3. Dbscan Algorithm
As previously mentioned, DBSCAN is an unsupervised density-based algorithm. It was designed to define specific clusters from a particular dataset, usually in a two-dimensional space
, without the need for predefined class labels. However, the algorithm is not fully automatized, thus the necessity to define two entry parameters Eps and MinPts. Nonetheless, the DBSCAN algorithm is still relevant due to its exploratory characteristics and its acceptable computational cost
, for large datasets [
37].
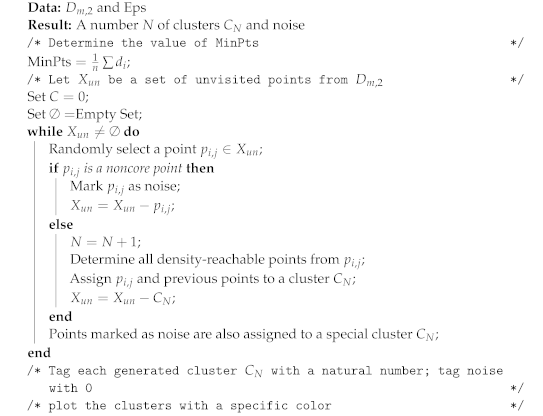
These initial parameters allow the algorithm to define a specific group of correlated points depending on their Euclidean distance defined by a circle with radii Eps and a minimum specified number of correlated elements MinPts. Moreover, these entry parameters define a group of points that may have no correlation with any of the discovered clusters and will be treated as noise. The pseudo-code of the DBSCAN algorithm is presented in Algorithm 2.
The DBSCAN algorithm follows a series of rules to define clusters from a specific dataset D, considering two arbitrary points p and q from D. These rules are defined as follows:
Eps-neighborhood of point: The Eps-neighborhood of a point p, denoted by , is defined by .
Directly density-reachable: A point p is directly density-reachable from a point q if:
- –
.
- –
The core point condition is reached, i.e., .
Density-reachable: A point p is density-reachable from a point q if there is a set of points , with and , such that is directly density-reachable from .
Density-connected: A point p is density-connected to a point q if there is a point o such that p and q are density-reachable from o.
Cluster: Let D be a specific dataset. A cluster is a non-empty subgroup from dataset D that meets the following criteria:
- –
Maximality : if and q is density-reachable from p, then .
- –
Connectivity , then p is density-connected to q.
Noise: Let be the clusters of dataset D. Noise is defined as the set of points in the dataset D not belonging to any cluster , that is .
| Algorithm 2: Clustering using DBSCAN algorithm. |
![Entropy 24 00875 i002]() |
As mentioned before, the selection of the initial parameters will impact the algorithm’s overall clustering precision and computational complexity. Therefore, a strategy is needed to define the parameters MinPts and Eps seeking to remove human handling and improve the precision in the overall process. Another important characteristic of the DBSCAN algorithm is its ability to automatically define outliers as noise, excluding undesired or redundant information.
3.1. Definition of Parameter MinPts
The function nearest neighbor is considered to define the parameter MinPts. The function nearest neighbor defines specific distances in the proximity of an element belonging to a dataset
using the Euclidean distance among variables. These distances can be assumed as particular densities in the cloud of points. As presented by Gaonkar and Sawant Gaonkar and Sawant [
38], the parameter MinPts can be defined using the function sample mean of the particular densities from a specific dataset
:
where
is every value of density assessed by the function nearest neighbor in a specific dataset
with
m number of samples.
3.2. Definition of Parameter Eps Using a Fitness Proportionate Selection
As presented in the previous section, the parameter Eps can be interpreted as an imaginary radius of a circumference inscribed around an arbitrary point included in a specific dataset of dimension two
. It is necessary to find an adequate Eps value since this parameter affects the overall clustering process of the hybrid algorithm in terms of computational cost and precision. According to the previous statement, the algorithm may lose its clustering capacity if the parameter Eps is selected arbitrarily as the user disregards the magnitude and density of the specific dataset being analyzed. As a solution, a Genetic Algorithm (GA) based on a fitness function is considered to define a particular Eps for a dataset
. The GA is defined using the model presented by [
39].
Typical distances or densities are determined using the function nearest neighbor for a specific dataset
to define the initial population of the selected GA model. These distances are defined as the standard radii from the specific dataset. The initial density population is defined in 50 elements with magnitudes between the average radius
and the maximum radius
. Points with coordinates belonging to the dimensionality-reduced dataset
are selected as additional alleles in the chromosome associated with the initial population to be optimized via the GA. These points are considered the center of the possible radii. Therefore, the chromosome could have the following structure presented in
Table 1.
Furthermore, the fitness function
to be optimized will have the following outline:
where
is considered as the coverage ratio and is calculated as follows:
being defined the Sum of Density and evaluated as follows:
while
is established as the Duplicate Ratio and is calculated as follows:
in general,
can defined as the chromosome of center
and radius
.
The crossover process was performed by selecting radii from the initial population and rearranging their position while points (x,y) remained in the same initial position. These new configurations are the offspring and are defined for a tournament selection by evaluating the fitness function. The definitions of parameters Eps and MinPts are described in Algorithm 3.
| Algorithm 3: Selection of DBSCAN parameters using a genetic algorithm. |
![Entropy 24 00875 i003]() |


 ,
, 


