1. Introduction
An image captured by a camera is a projection of an actual three-dimensional shape on a plane. The image textures can reflect the morphological features of the physical object. As a result, objects can be identified by evaluating the grayscale variations of an image. Textured surfaces, on the other hand, are inherently complex in natural scenes. Irregular and complex objects cannot be described using Euclidean geometry. Mandelbrot proposed utilizing fractal geometry to describe this type of phenomenon in 1983 [
1]. Fractal geometry is used to define self-similar scale-independent elements known as fractal sets. The irregularity of a fractal set can be computed using the fractal dimension. The fractal dimension is now widely utilized in computer vision applications such as texture analysis [
2], image segmentation [
3], shape recognition [
4], pattern recognition [
5], time series analysis [
6], complex network analysis [
7], landslide susceptibility assessment [
8], topography analysis of thin films [
9], cement-based materials analysis [
10], and description of urban morphology [
11].
Researchers have proposed many calculating methods to precisely estimate the fractal dimension. Mandelbrot first proposed calculating the fractal dimension when determining the length of the British coastline [
1]. Then, based on Mandelbrot’s idea, Pentland [
12], Peleg et al. [
13], Clarke et al. [
14], Dubuc et al. [
15], Keller et al. [
16], and Gagnepain et al. [
17] proposed various methods for determining fractal dimension.
In 1994, Sarkar et al. [
18] proposed the differential box-counting (DBC) method to compute the fractal dimension by counting the number of boxes. This method is extensively utilized since it is simple to understand and implement. However, the DBC approach has numerous flaws, including excessive counting of
z-direction boxes, inappropriate box heights, inaccurate box-counting in the
xy-direction, and inappropriate box sizes. These weaknesses frequently result in incorrect fractal dimensions, severe distance errors (DEs), and other problems.
For the DBC method, the fractal dimension is calculated by fitting a series of points (log1/r, logNr) in a log–log plot. The parameter associated with r is the grid size s, while the Nr value is influenced by many parameters, such as the box side length s and height h, the number of boxes nr of each gird, and the partitioning method of the xy plane. The calculation methods of these parameters directly impact the calculating accuracy of the DBC method. Many studies have been undertaken to increase the computational accuracy by improving each parameter of the DBC method to tackle the shortcomings of the original DBC approach.
Jin et al. [
19] discovered that, during the DBC calculation, the log–log plot presents “steps” under large s values. The central portion of the curve had a relatively constant gradient, while the plot started to level off for smaller values of s. This phenomenon decreased the accuracy of the calculation. Thus, the authors proposed the RDBC approach to lower the DE by optimizing the range of grid size s. Although this study indicates that the trend at both ends of the curve influences the calculation results, it does not give a complete examination of the origins of its phenomenon and does not fix the underlying problems.
Chen et al. [
20] presented the SDBC method to overcome the problem of overcounting boxes in the
z-direction, by introducing a box-shifting mechanism in the
z-direction to optimize the calculation of n
r. Li et al. proposed a new n
r strategy in 2006 [
21] and 2009 [
22] to overcome the problem of overcounting boxes in the
z-direction. They also proposed an overlapping grid partitioning approach to address box over- and undercounting problems along the
xy-axis, where two nearby grids overlap by one row and one column. However, several shortcomings in this method have been identified in previous literature [
23].
Long et al. [
24] proposed the integer ratio DBC (IRDBC) to estimate the FD of rectangular images. IRDBC avoided the overcounting of boxes along the
xy-axis by employing a new n
r formula that does not use the ceiling function. As a result, IRDBC generates authentic values for n
r. However, IRDBC employs only integer values for 1/r, resulting in very few grid sizes being used to compute the fractal dimension.
Liu et al. [
25] optimized the formula to compute n
r and introduced a grid-shifting mechanism to solve the undercounting of boxes along the
xy-direction; for non-trivial plane partitioning, the image size divisors were employed as the grid size s. Compared to DBC, they indicated that the improved method enhanced accuracy by 24.1%. Based on Liu’s work, Lai et al. [
26] improved the computation of box h. Panigrahy et al. have put in much effort to improve the DBC method. In 2017 [
27], they investigated the effect of box height on the accuracy of DBC computation and presented a new method of calculating box height, which considerably enhanced the accuracy of fractal dimension calculation. In 2020 [
28], they proposed three new DBC algorithms based on weighted least squares regression. These methods also use a new
xy-plane shifting mechanism and a modified formula for computing n
r. However, their method utilized the divisors of image size as the grid size, resulting in a larger DE. In 2021, Liu et al. [
29] proposed the IMDBC method, which improved the box-shifting mechanism. The proposed method not only solved the undercounting problem along the
xy-direction but also had superior stability for image rotation. Compared to DBC and its state-of-the-art methods, the IMDBC method has higher computational accuracy.
According to the studies mentioned above, each algorithm overcomes the shortcomings of the original DBC method by optimizing the calculation parameters to enhance the computing accuracy and minimize distance error. Various parameters affect the computation of the fractal dimension; different approaches have different optimization focuses. Nevertheless, they all achieved better results than the DBC method under their corresponding validation method. However, some studies failed to provide more persuasive evidence on the enhanced accuracy because their validations were not performed using images with known theoretical fractal dimensions, such as synthesized FBM Database [
25,
29].
Among the various parameters utilized in DBC calculations, the grid size s is crucial. The choice of grid size for a square image impacts how the plane is partitioned during computing. The original DBC approach was based on consecutive integer partitioning, which discards areas that cannot be partitioned in an integer manner [
23]. Currently, this strategy is frequently used in studies of state-of-the-art DBC methods [
22,
26,
30,
31]. However, in other works, such as those of Liu et al. [
25] and Panigrahy et al. [
28], the authors utilized a similar approach to that used in Biswas’ study [
32], employing divisors of the image size as the grid size s to partition the square image fully.
These two approaches for calculating s values are frequently used in DBC algorithms. Both strategies, however, have limitations. The consecutive integer partitioning method discards the boundary region; hence, the original image is not fully utilized, which will lead to the problem of undercounting boxes. Moreover, as noted previously, the curve of the consecutive integer method is shaped like “steps” at large s values in the log–log plots, which will also affect the calculation accuracy [
19]. Although the divisor method can partition the entire image, it omits a significant amount of information at other s values, which leads to result distortion and high DE values [
33].
The weight approach has been utilized to compute n
r in some methods [
23,
24,
30]. The weight technique is used to calculate n
r in a grid whose area is less than s × s and to assign weights based on the actual area of the grid. Long et al. [
24] were the first to propose the weight method for calculating the n
r values of the boundary grids. Nunsong et al. [
30] and Panigrahy et al. [
23] then applied the weight technique to the modified triangle box-counting (TBC) methods. In the work of Long et al., the grid partitioning approach is an integer multiple of r values. This strategy would result in fewer s values utilized for calculation and, sometimes, the same s for varied r values [
33]. In the studies of Nunsong and Panigrahy, on the other hand, the weight technique was utilized to calculate triangular grids. However, most current DBC algorithms are based on square grids, where the weight method is rarely used. Hence, we propose an improved continuous integer technique for square grid calculation based on the weight method to tackle the problems of the typical divisor method and consecutive integer method.
In order to further investigate the impact of the grid size selection on fractal dimension calculation, this study first introduces the principles of two typical grid size selection methods and assesses their advantages and disadvantages. Then, by processing the discarded edge regions of an image with the weight method, an improved strategy is proposed to tackle the undercounting problem of the original consecutive integer approach and the result distortion problem of the divisor method. Subsequently, based on three image sets (synthesized FBM database, Brodatz database, and Aerials database), the impacts of the three grid size selection methods (original consecutive integer, divisors of image size, and the improved method) were then analyzed, evaluated, and compared. The results reveal that, compared with the original consecutive integer method and the divisor method, the DBC technique based on the improved grid size selection strategy can better estimate fractal dimension values, produce lower DE values, and obtain more consistent goodness of fit values. The various notations and abbreviated terms used in this work are summarized in Abbreviations.
The remaining parts of the paper are as follows:
Section 2 describes the classic DBC method, the typical grid size selection strategies, and the drawbacks of each strategy. In the third section, an improved grid size selection strategy based on the consecutive integer method is proposed.
Section 4 discusses the three image databases (FBM, Brodatz, Aerials) utilized for validation and evaluation metrics.
Section 5 describes and discusses the results of the two typical grid size selection strategies and the improved one based on three image databases.
Section 6 presents the conclusions.
3. Improved Consecutive Integer Method
As mentioned above, the divisor method can thoroughly partition the image, but the number of s values is minimal, which can easily lead to distorted results. Although more s values are used in the consecutive integer technique, most of the s values, which cannot entirely partition the image, are prone to the undercounting problem of boxes, especially at large grid size s. Thus, we expect an improved method that can entirely partition the image like the divisor method, but also has numerous s values involved in FD calculation like the consecutive integer method.
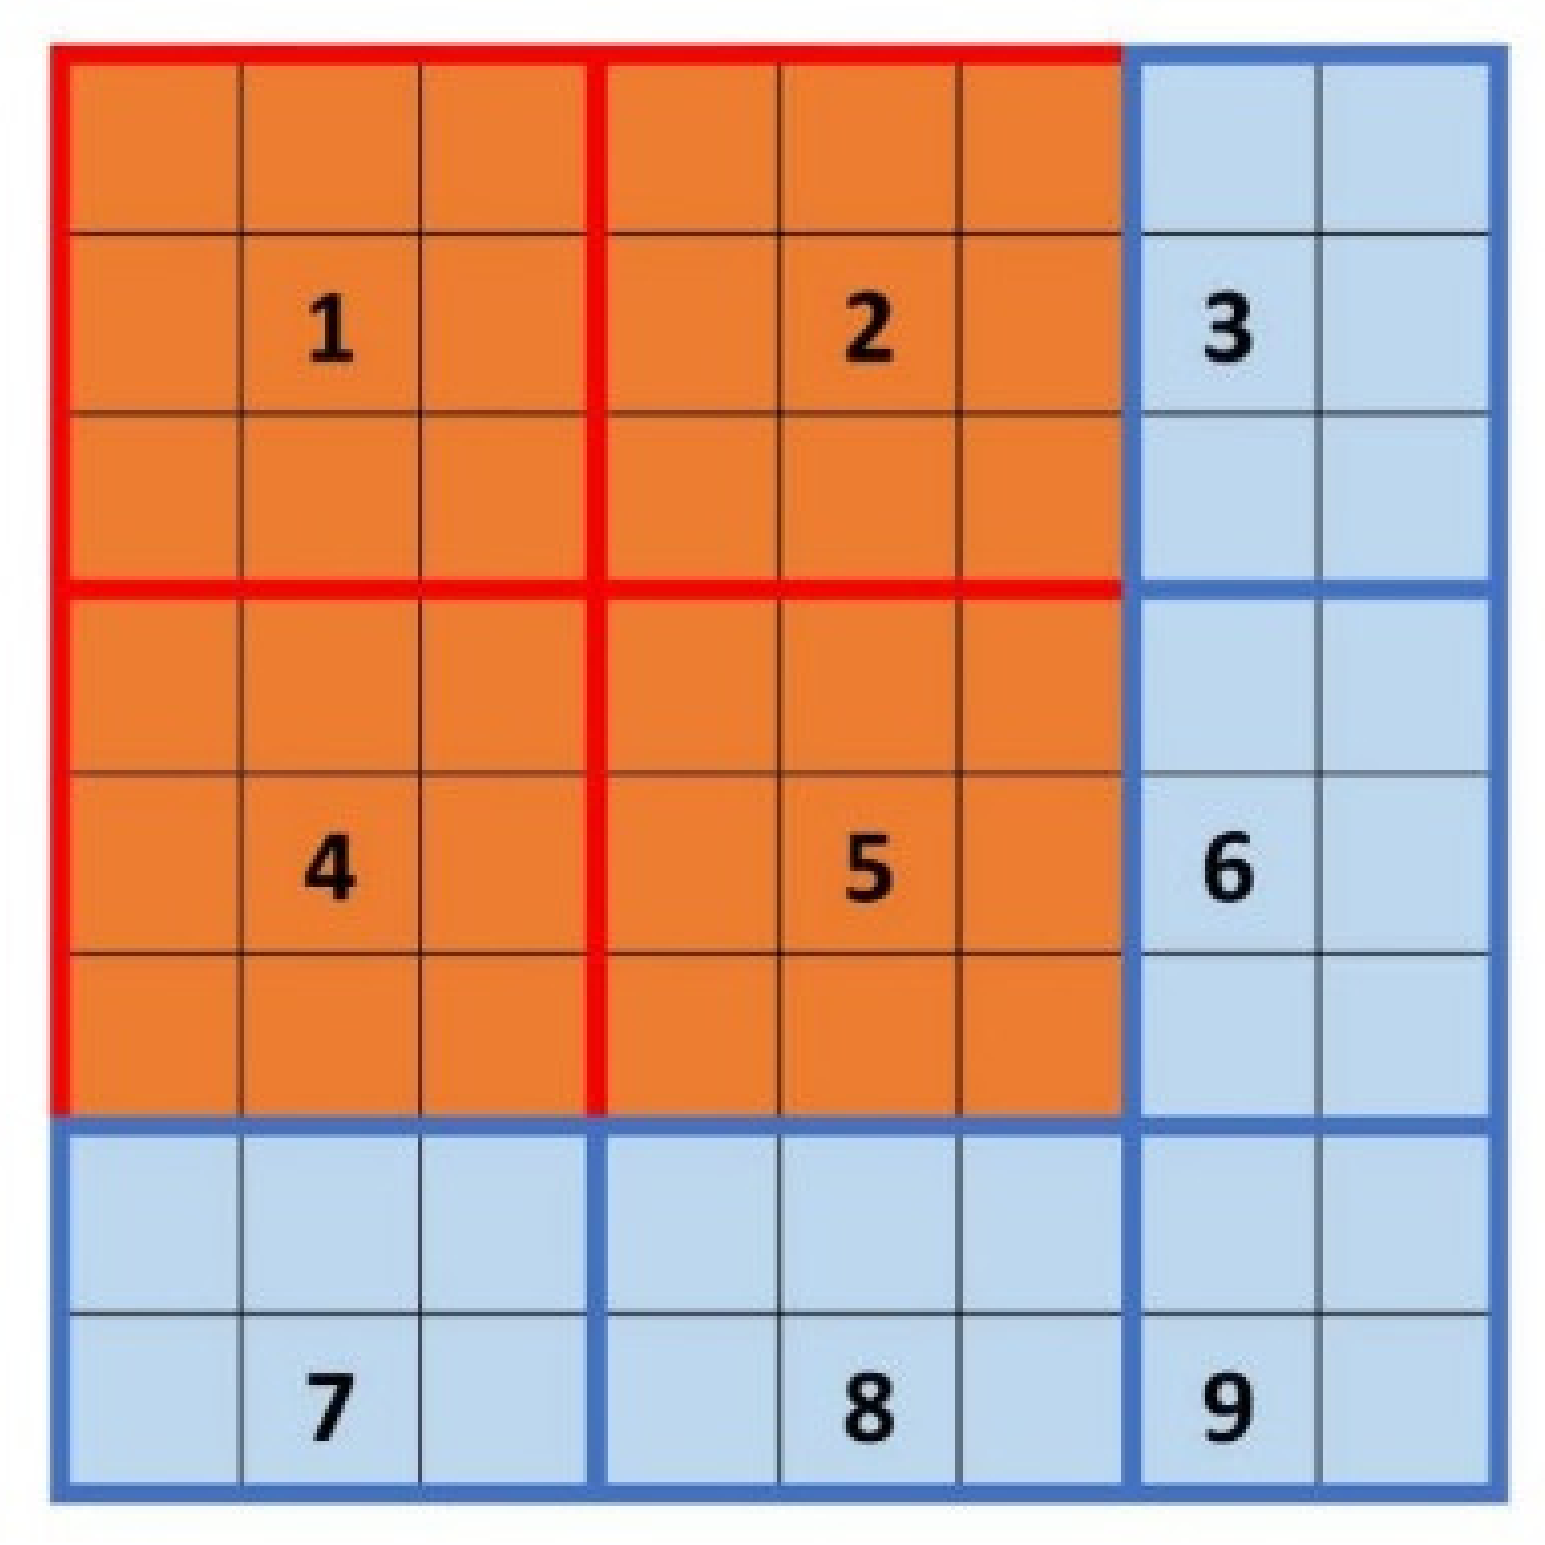
To achieve this, we can improve the consecutive integer method by supplementing it with the undercounting boxes. If a given value of s does not completely partition the image, a zone with a width less than s is generated at the boundaries. This is depicted in the blue region of
Figure 4. Although the area of each grid in the blue region is less than s × s, it also corresponds to a part of a two-dimensional surface with grayscale variations inside, and the n
r value can be computed using Equation (2). However, because the area is less than s × s, the n
r value cannot be determined directly as other grids. Thus, the weight approach is introduced here.
The weight method would assign the corresponding weights according to the actual area of the grids [
24]. The number of boxes and the area weights need to be considered simultaneously in calculating the n
r value of grid (i, j)th. The weight factor F is calculated as shown in Equation (4). A(i, j) is the actual area of the (i, j)th square, and S stands for s × s, which is the area of a grid. F is the ratio of the actual grid area to the theoretical grid area. The corresponding n
r value calculation can be obtained from Equation (5).
The code of the DBC method based on two consecutive integer methods is shown in
Figure 5. The improved method’s specifics are as follows:
Partition an
image into tiny square grids with size s. The number of grids is
. If M is not divisible by s at this point, non-square regions will form at the margins. As shown in
Figure 4, grids 1, 2, 4, and 5 are square regions while grids 3, 6, 7, 8, and 9 are irregular edge regions.
Figure 5.
Algorithm code of the DBC method with different consecutive integer methods (Left: the original one; Right: the improved one).
Figure 5.
Algorithm code of the DBC method with different consecutive integer methods (Left: the original one; Right: the improved one).
By replacing Equation (2) with Equation (5), the n
r value for each grid of the image can be calculated. Subsequently, summing the n
r values for each grid gives N
r (Equation (6)).
Finally, linear least squares regression (LLS) is used to fit the obtained points (log1/r, logN
r) ∀r to calculate the fractal dimension D.
Section 5 of the study will further investigate the validity of the method.


