1. Introduction
Ref. [
1] proposed the use of cross-validation Bayes factors in the classic two-sample problem of comparing two distributions. Their basic idea is to randomly divide the data into two distinct parts, call them
A and
B, and to define two models based on kernel density estimates from part
A. One model assumes that the two distributions are the same and the other allows them to be different. A Bayes factor comparing the two part
A models is then defined from the part
B data. In order to stabilize the Bayes factor, Ref. [
1] suggest that a number of different random data splits be used, and the resulting log-Bayes factors averaged.
In the current paper we consider a special case of this approach in which the part A data consists of all the available observations save one. If the sample sizes of the two data sets are m and n, this entails that a total of log-Bayes factors may be calculated. The average of these quantities becomes the test statistic here considered, and is termed .
Although
is an average of log-Bayes factors, it does not lead to a consistent Bayes test because each of the log-Bayes factors is based on just a single observation. Ref. [
1] suppose that the validation set size grows to
∞, while in our case it remains of size 1. This results in the
converging to the Kullback–Leibler divergence of the two densities, and not
∞ as in the case of [
1]. We therefore use frequentist ideas to construct our test. The exact null distribution of
conditional on order statistics is obtained using permutations of the data. Doing so leads to a consistent frequentist test whose size is controlled exactly. The problem of bandwidth selection is dealt with by using leave-one-out likelihood cross-validation applied to the combination of the two data sets. This method is computationally efficient in that the resulting bandwidth is invariant to permutations of the combined data, and therefore has to be computed just once. Our methodology is easily extended to bivariate data, and we do so in a real data example.
Ref. [
2] also use a permutation test based on kernel estimates for the two-sample problem, their statistic being based on an
distance. Ref. [
3] shows how other distances and divergences compare when applying them to the general
k-sample problem, restricting their comparisons to the one-dimensional case. Our method mainly differs from these procedures by virtue of its Bayesian motivation. Existing methodology that most closely resembles ours is that of [
4], who use a kernel-based marginal likelihood ratio to test goodness of fit of parametric models for a distribution. Their marginal likelihood employs a prior for a bandwidth, as does ours.
3. Simulations
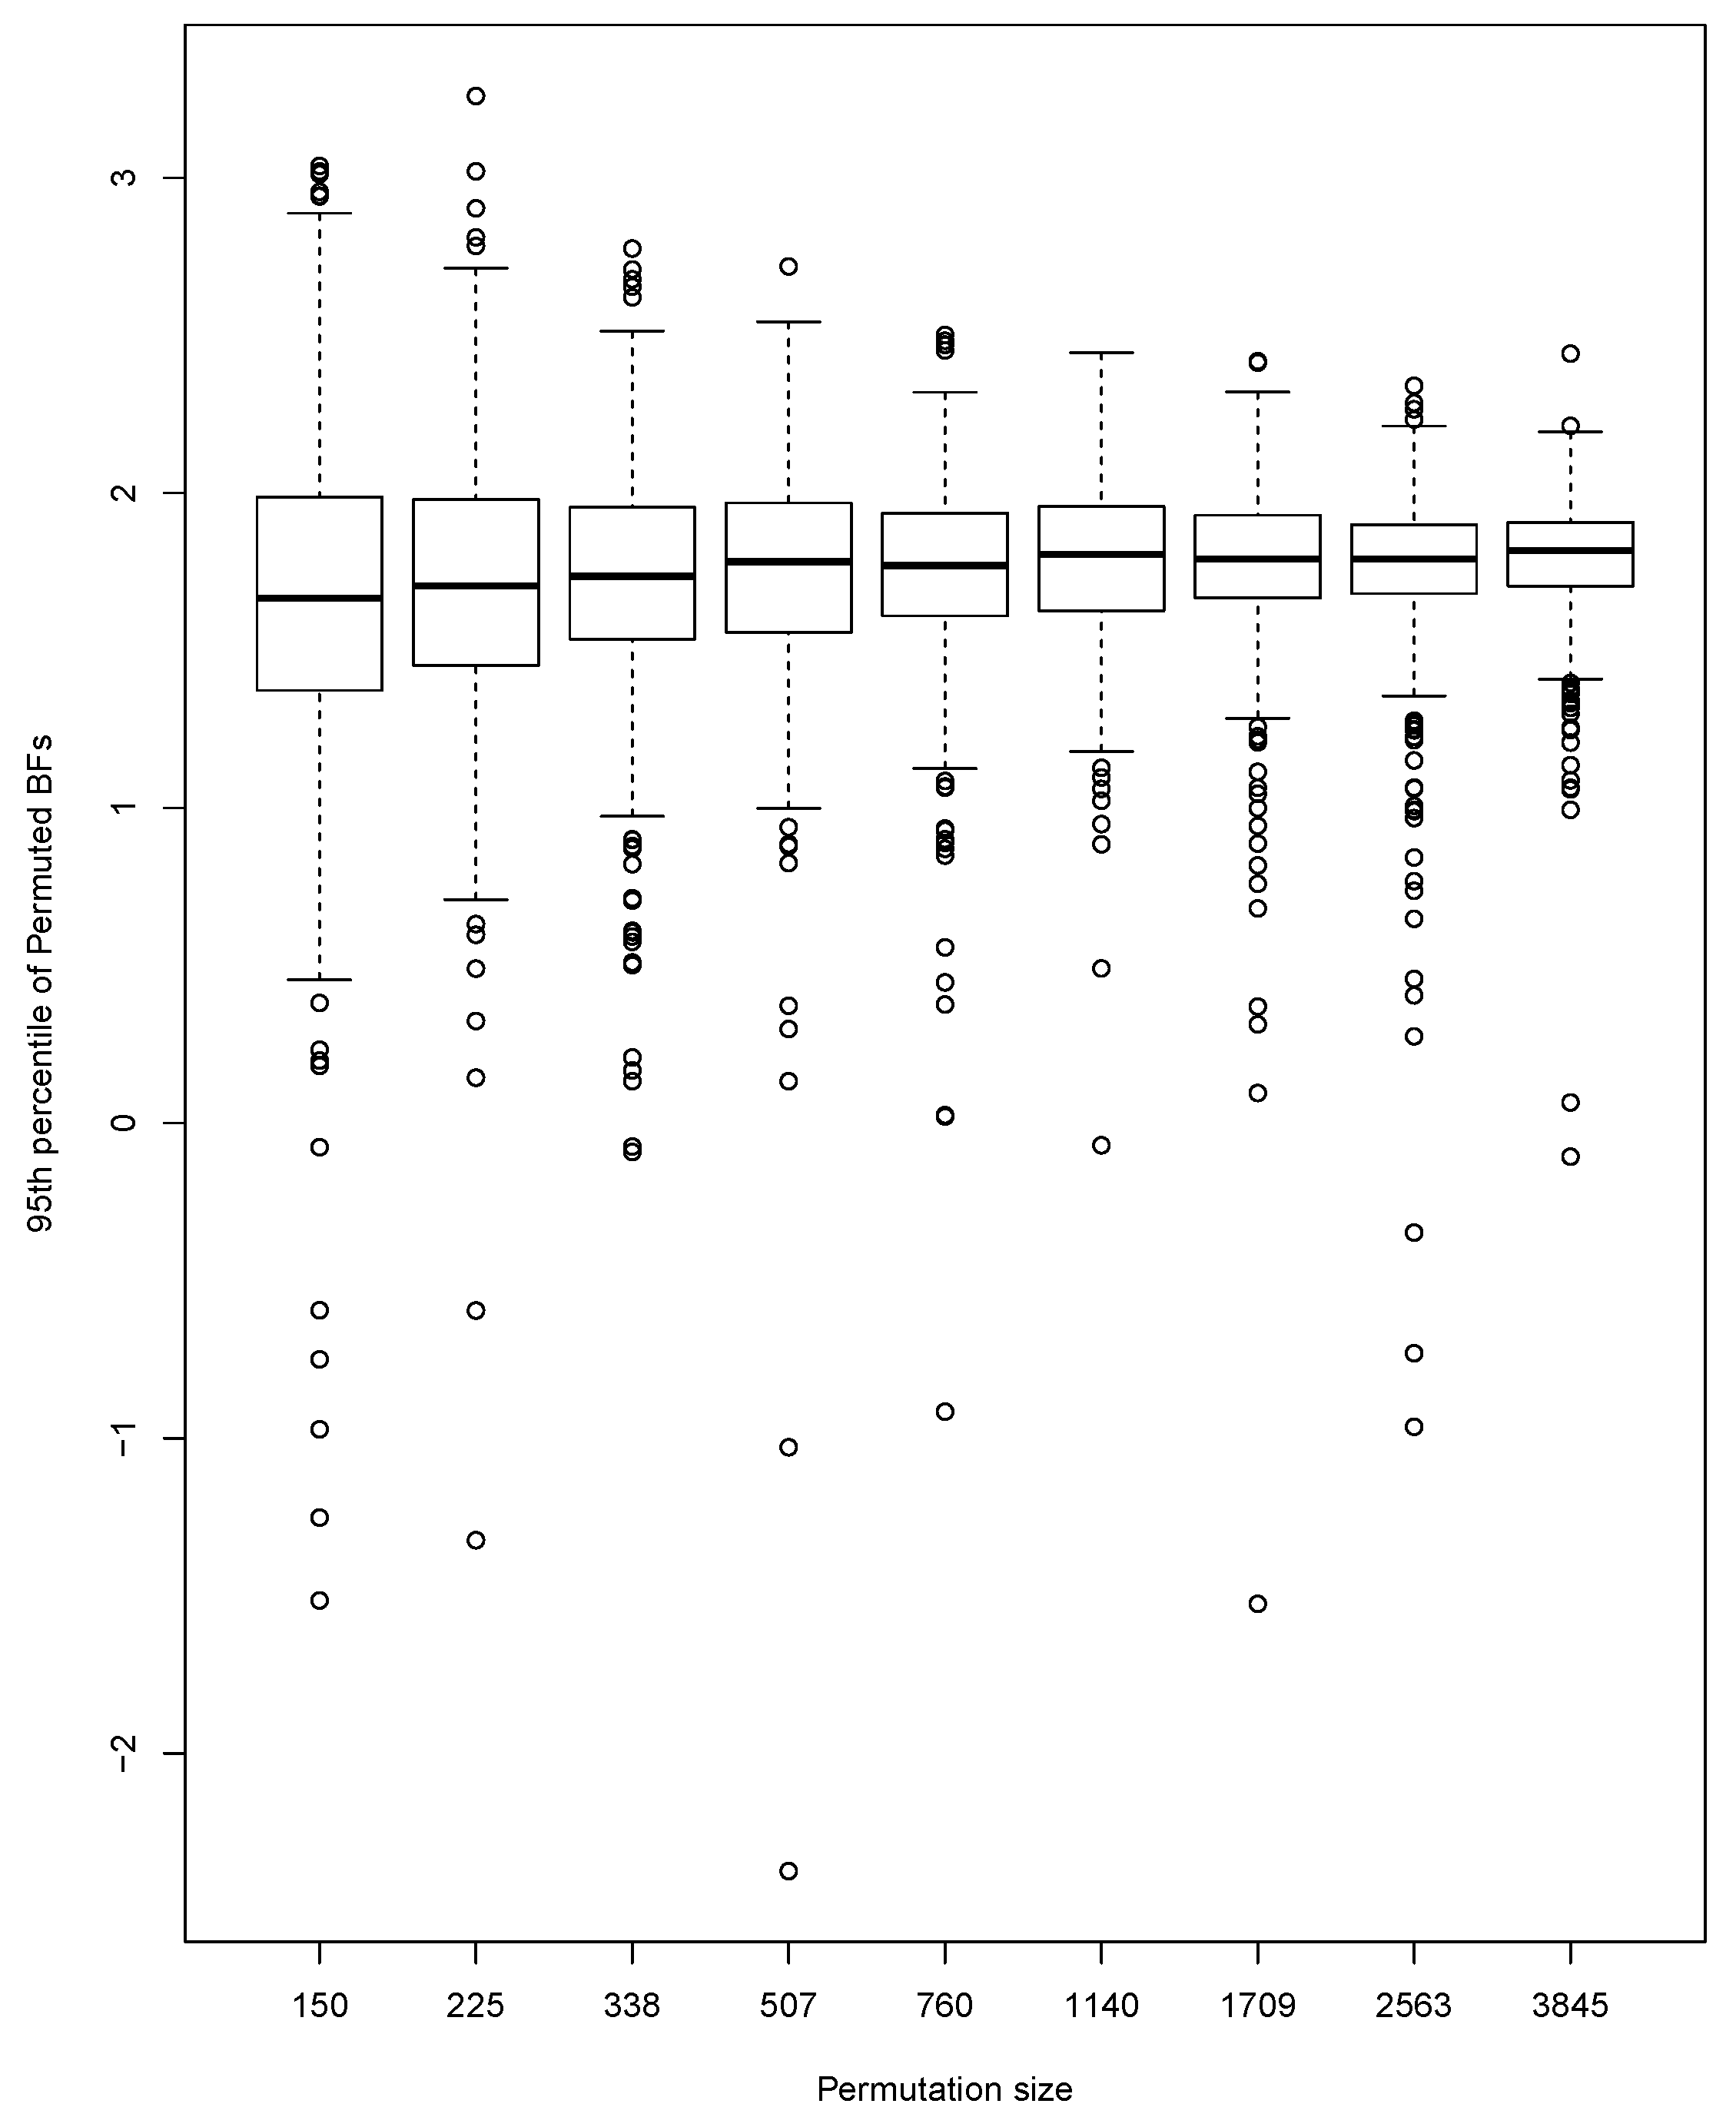
We perform a small simulation study to investigate the size and power of our test. To explore the effect of the number of permutations, we generate 500 pairs of data sets, with one data set being a random sample of size
from a standard normal distribution, and the other a random sample of size
from a normal distribution with mean 0 and standard deviation 2. For each of the 500 pairs of data sets, the 95th percentile of
s is approximated using a range of different numbers (
N) of permutations starting at 100 and increasing by a factor of 1.5 up to 3845. Results are indicated by the boxplots in
Figure 3. The percentiles are centered at approximately the same value for all
N. Not surprisingly, the variability of the percentiles becomes smaller as
N increases. This implies a certain amount of mismatch between percentiles at
and those at smaller
N.
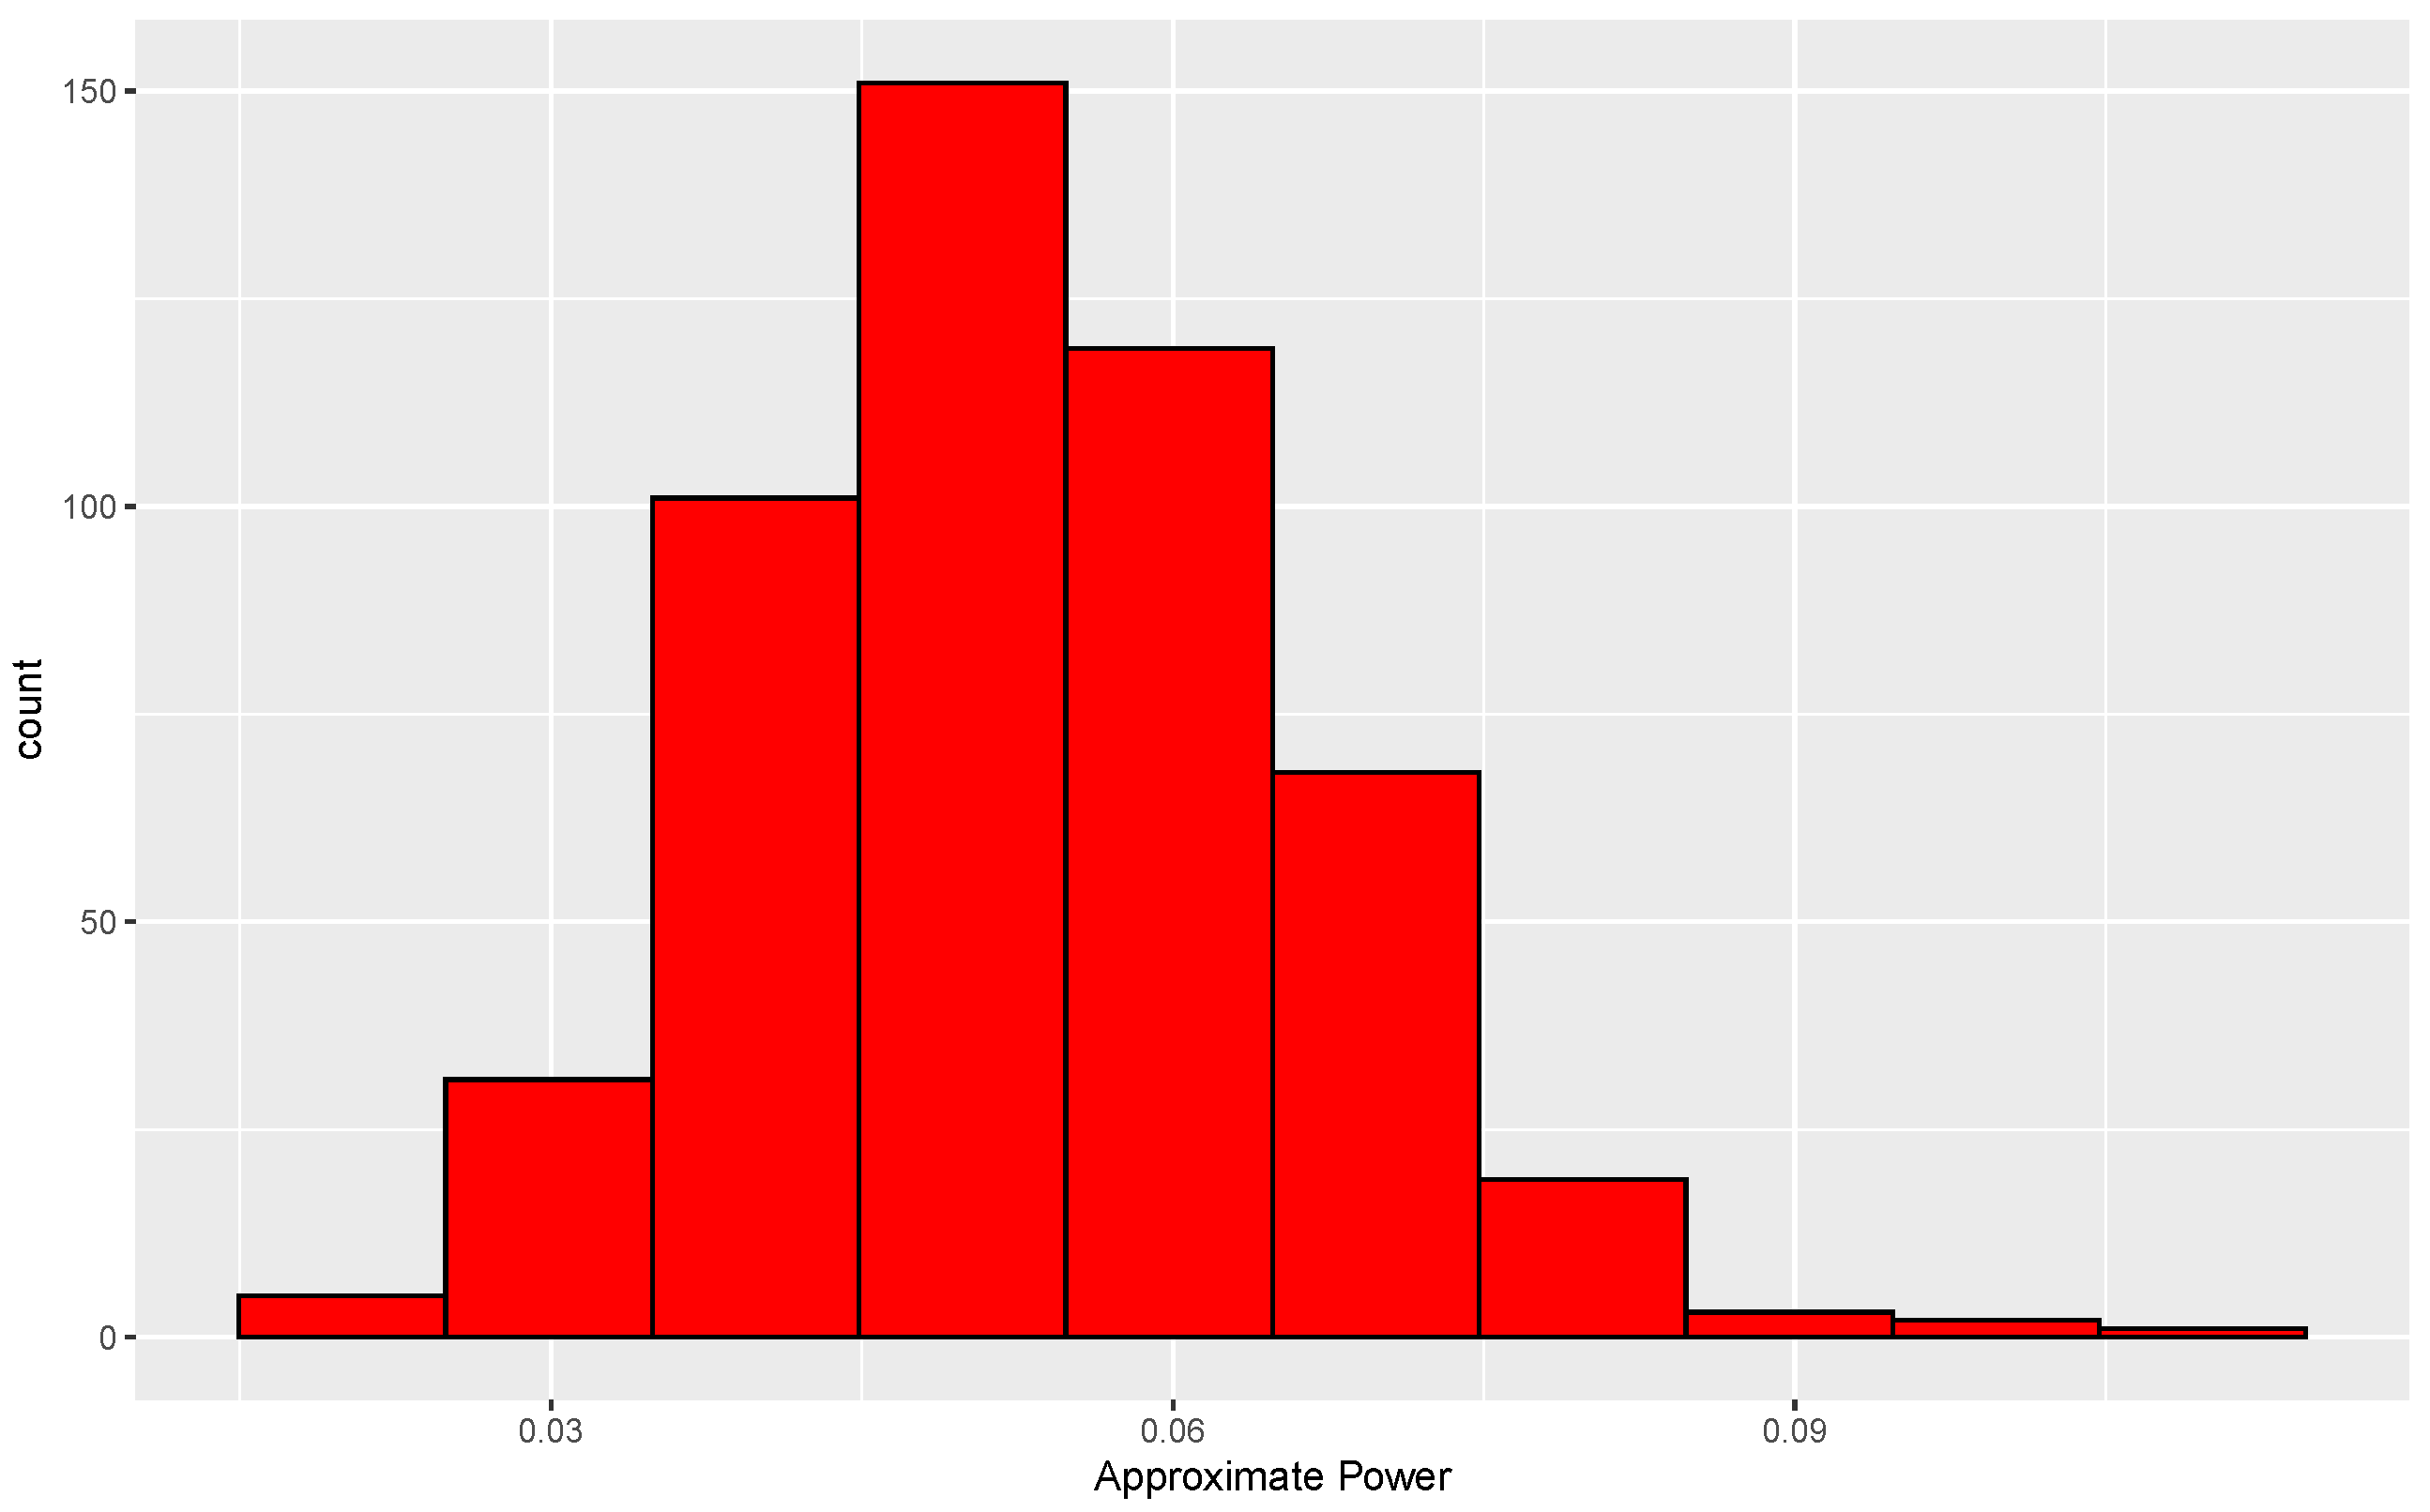
The consequence of the mismatch just alluded to can be investigated by determining the true conditional and unconditional levels of tests based on small
N. For the null case, two data sets, each of size 50, are generated from a common normal distribution. Since the distribution of
is invariant to location and scale in the null case, we use a standard normal without loss of generality. For each pair of data sets, the data are randomly permuted 338 times, which leads to 338 values of
. A second set of 3845 permutations is then performed, leading to 3845 more values of
. The proportion of
s from the second set that exceed the 95th percentile of the
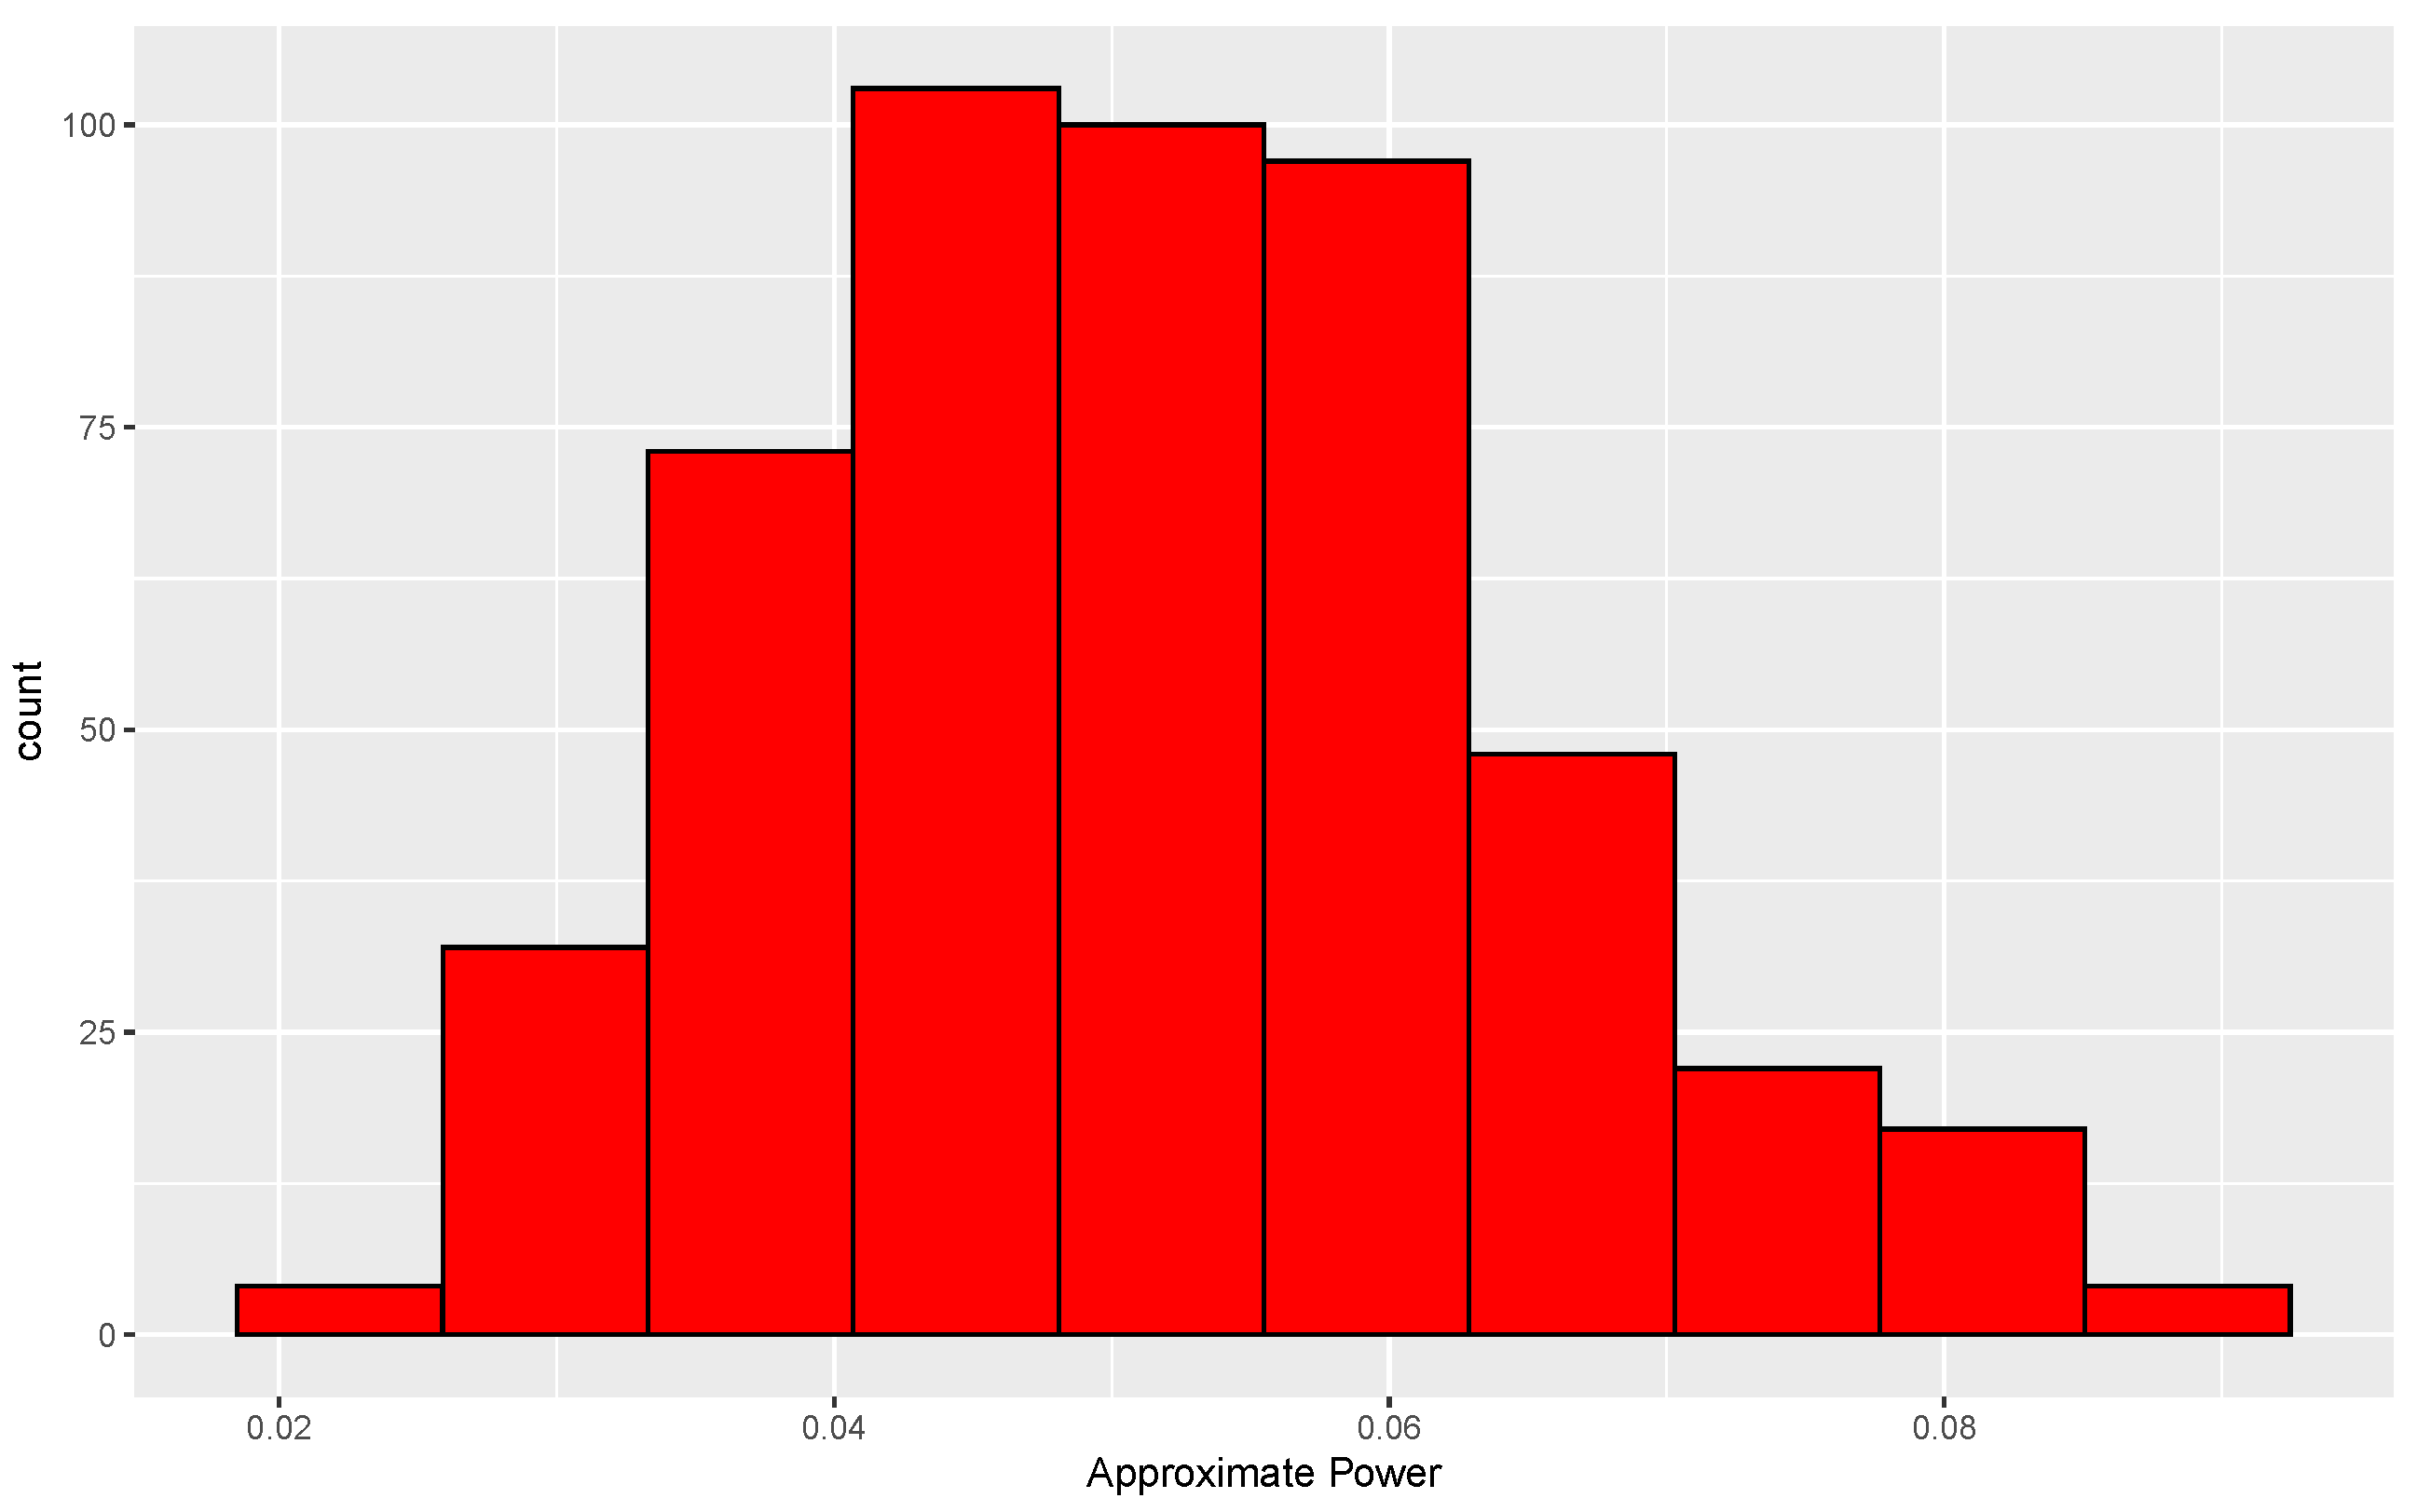
s formed from the first set is then determined. This proportion is approximately equal to the conditional level of the test based on 338 permutations. This same procedure is used for each of 500 data sets, and the resulting distribution of approximate levels is shown in
Figure 4.
The histogram is centered near 0.05, and 87% of the conditional levels are between 0.03 and 0.07. Furthermore, an approximation to the unconditional level is , where is the approximate conditional level for the ith data set, . Based on these results, use of only 338 permutations is arguably adequate.
The same experiment is repeated except now the two data sets are drawn from different distributions, a standard normal and a normal with mean 0 and standard deviation 2. Results from this experiment are given in
Figure 5.
As in the null case, the conditional levels based on the use of 338 permutations are quite good. Eighty-eight percent of the levels are between 0.03 and 0.07, and the approximate unconditional level is 0.051.
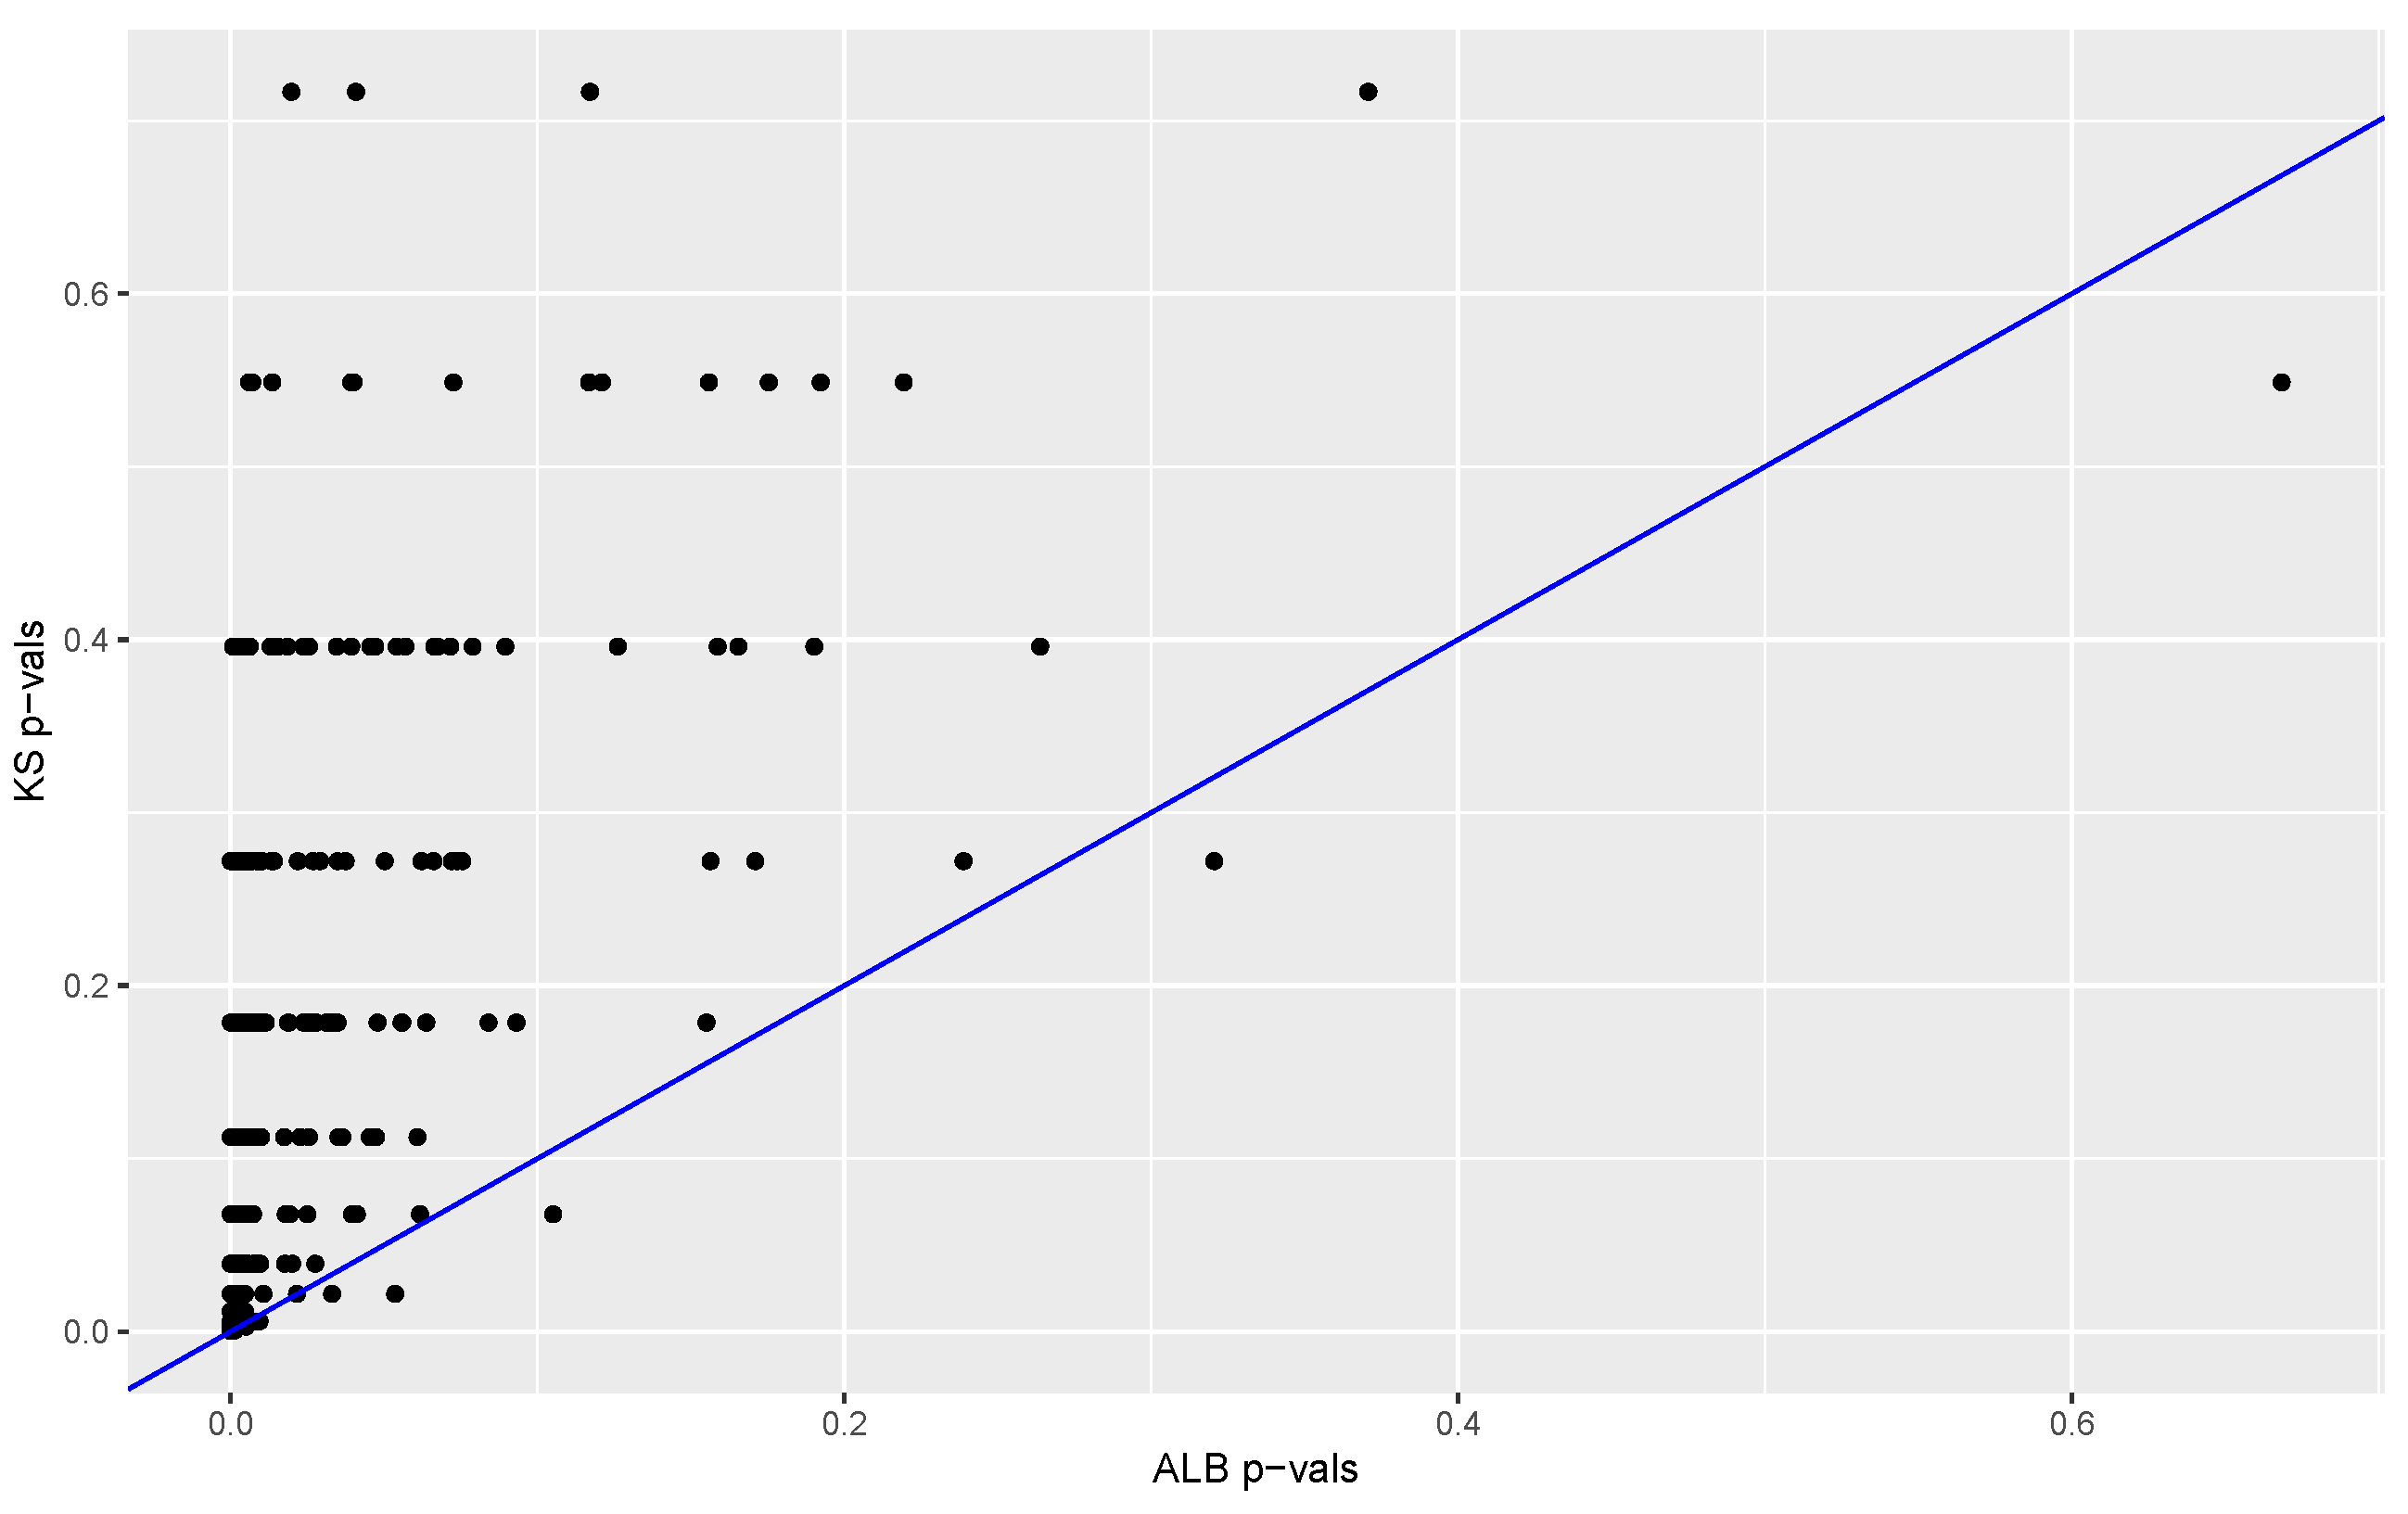
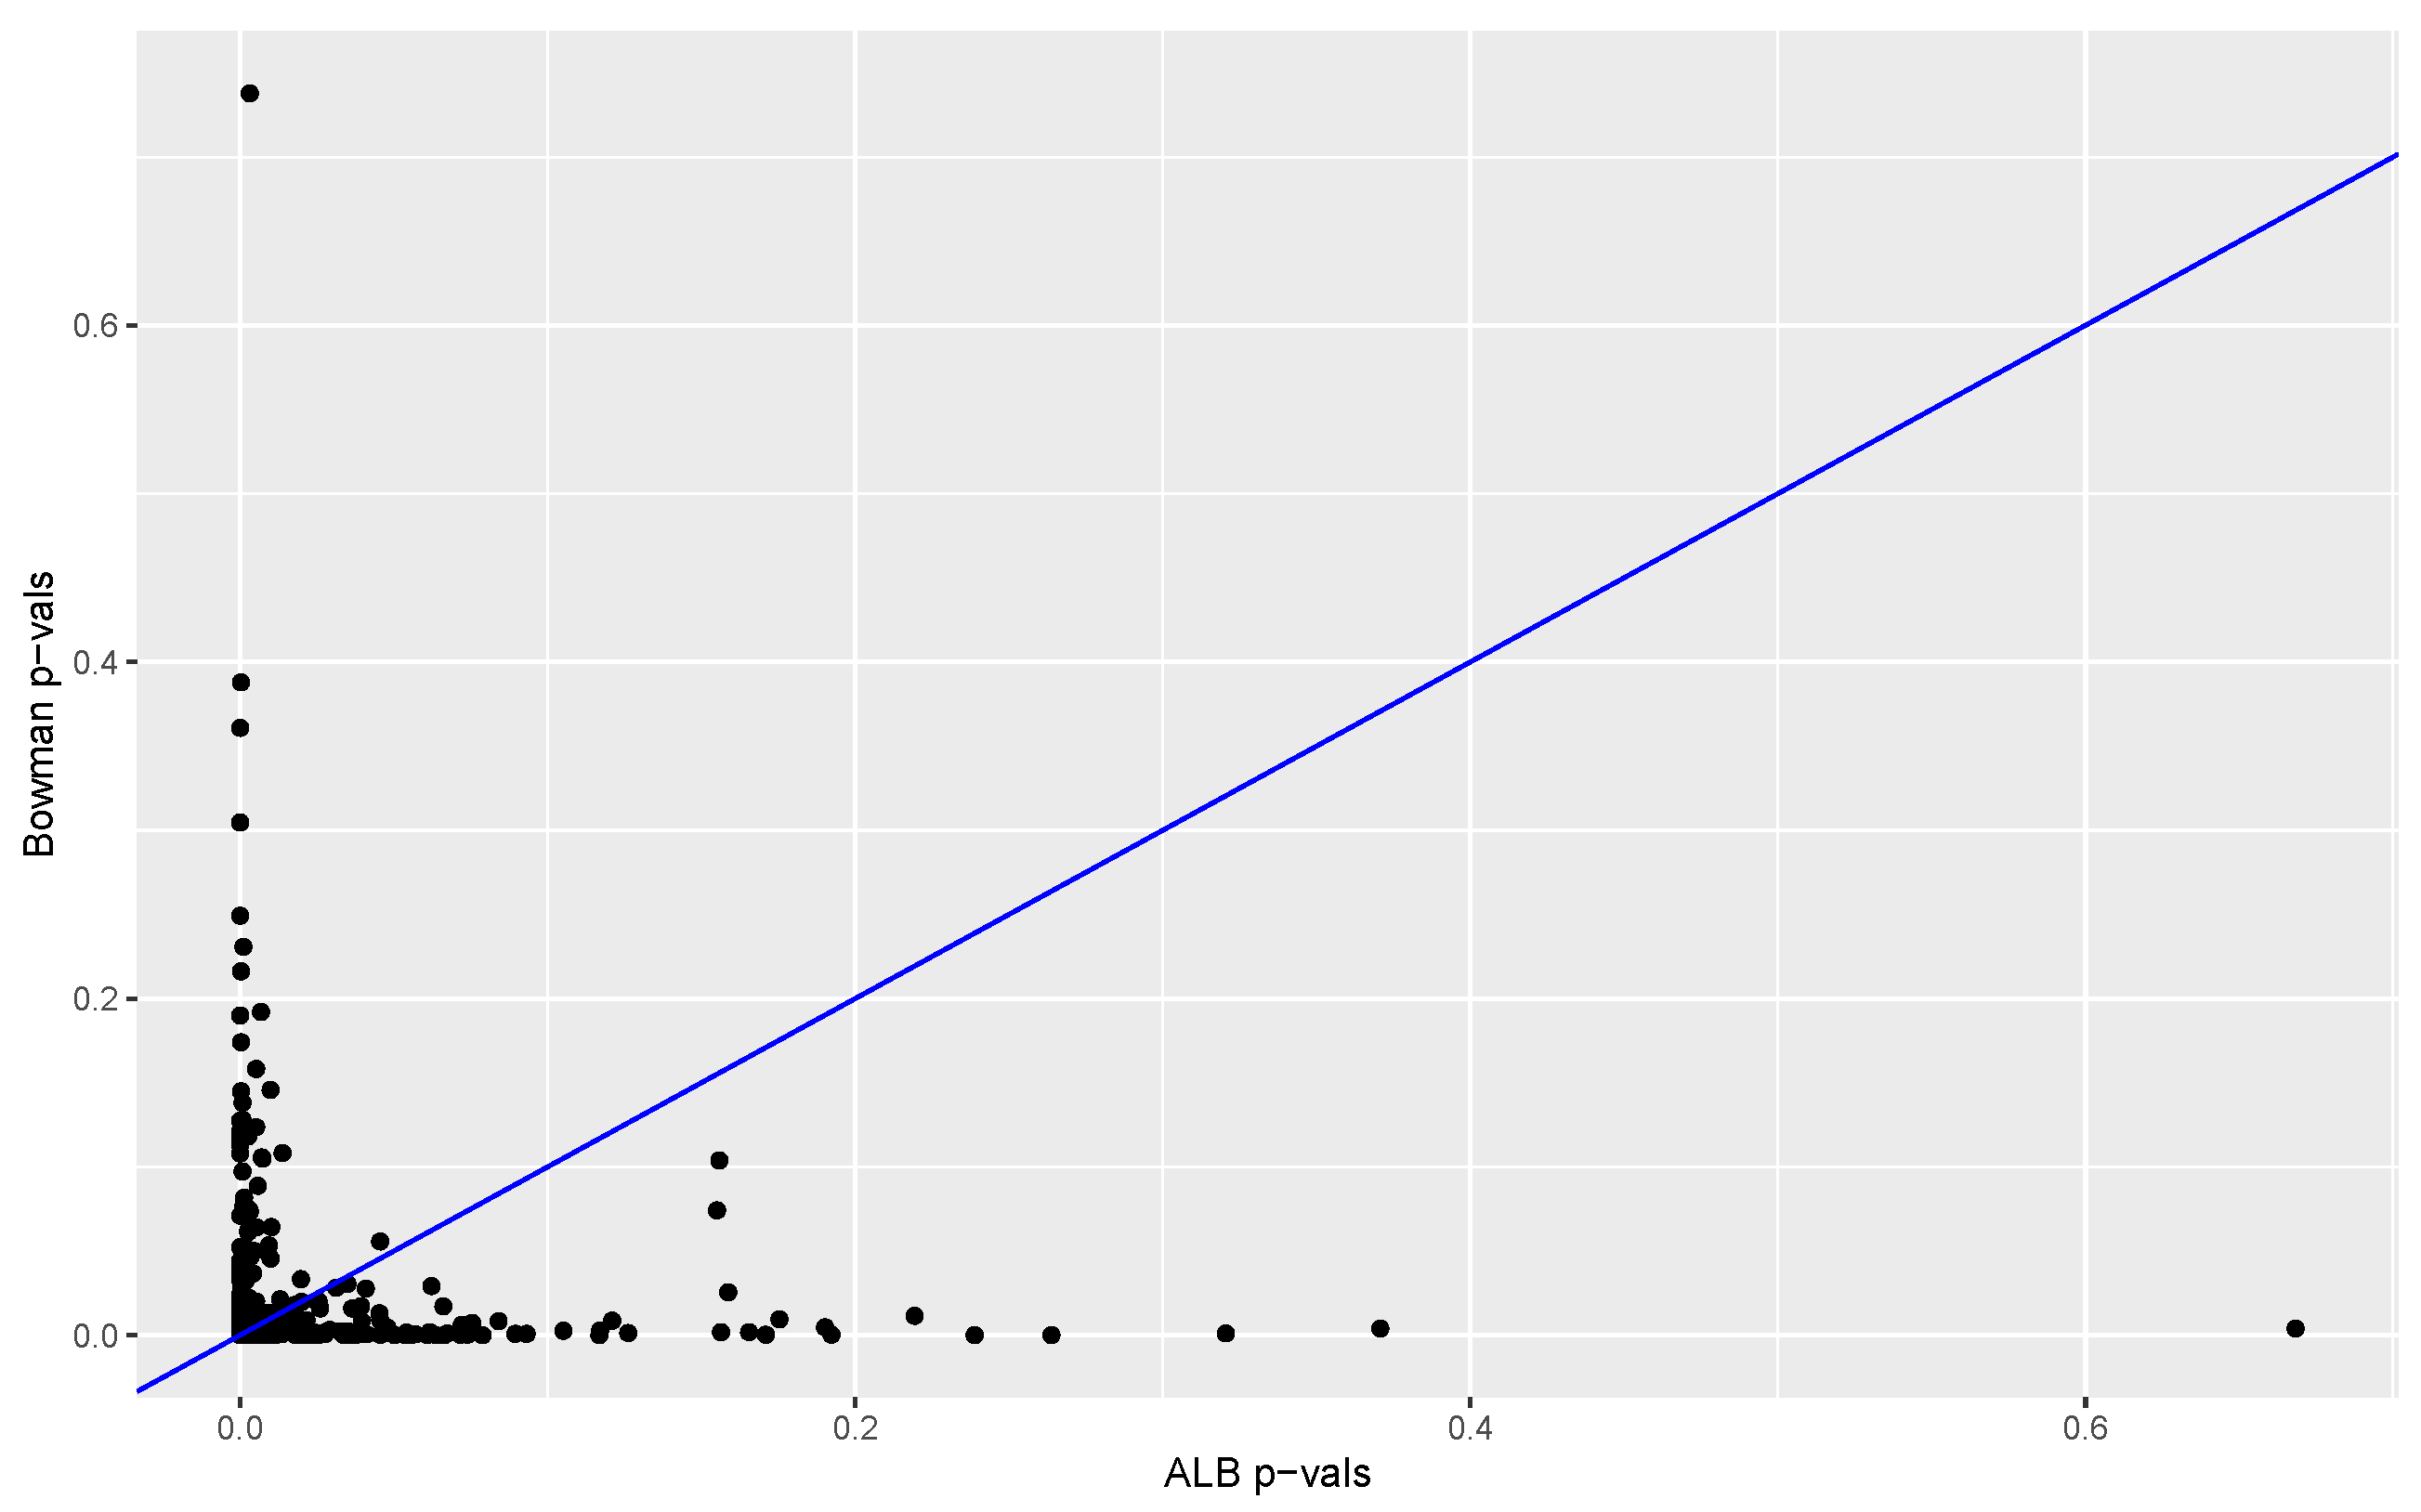
The proportion of
s from permuted data sets that are larger than the
computed from the original data provides a
p-value. The
p-values obtained with our method (based on 3845 permutations) are compared to the
p-values obtained with the Kolmogorov–Smirnov test and Bowman’s two-sample test. Results are summarized in
Figure 6 and
Figure 7. In 98% of the replications the K-S
p-value was larger than the
p-value, and in 57% of the cases the Bowman
p-value was equal to or larger than the
p-value. These results suggest that in this case our test has much better power than that of the Kolmogorov–Smirnov test and power at least comparable to that of Bowman’s test.
4. A Bivariate Extension of the Two-Sample Test and Application to Connectionist Bench Data
Our method can be extended to the bivariate case by using a bivariate kernel density estimate. Assume now that are independent and identically distributed from density f and are independent and identically distributed from g, where and are each bivariate observations, , .
A product kernel
K will be used, i.e., the bivariate kernel
K is the product of two univariate kernels. For
k arbitrary bivariate observations
,
,
, and
, the kernel estimate is defined by
where
,
and
is a two-vector of (positive) bandwidths.
We will use the same sort of notation as before, i.e.,
,
,
,
,
and
is the object
with all its components except
,
. In this case the
ith Bayes factor is defined as
and similarly for
. As before the test statistic is
.
This form may seem daunting, but reduces to a more familiar form if we take
. In this case, proceeding exactly as in
Section 2,
has the form
and similarly for
, where
and
L is defined by (
2).
We will analyze a subset of the connectionist bench data, which consist of measurements obtained after bouncing sonar waves off of either rocks or metal cylinders. The data may be found at the UCI Machine Learning repository, Ref. [
8]. There are 60 variables in the data set, with
and
measurements of each variable for the metal cylinders and rocks, respectively. Variable numbers (1 to 60) correspond to increasing aspect angles at which signals are bounced off of either metal or rock, and each of the 60 numbers is an amount of energy within a particular frequency band, integrated over a certain period of time. We will apply our test to see if the first two variables (corresponding to the smallest aspect angles) have a different distribution for rocks than they do for metal cylinders. In our analysis
K is taken to be
, the standard normal density, and
to be of the form (
A1). In this event
L is a
t-density with
degrees of freedom. We will use
, leading to a fairly heavy-tailed kernel, which is desirable for reasons discussed previously.
The data for each variable are inherently between 0 and 1, and bivariate kernel estimates display boundary effects along the lines and , with the largest bias near the origin. We therefore use a reflection technique to reduce bias along these two lines. Suppose one has k observations on the unit square. Each observation is reflected to create three new observations: , and , . One then simply computes, at points in the unit square, a standard kernel density estimate from the data set of size , and multiplies it by 4 to ensure integration to 1. The value of is computed as described previously except that each leave-out estimate leaves out four values: the observation at which the estimate is evaluated plus its three reflected versions. In this way the kde is constructed from data that are independent of the value at which the kde is evaluated.
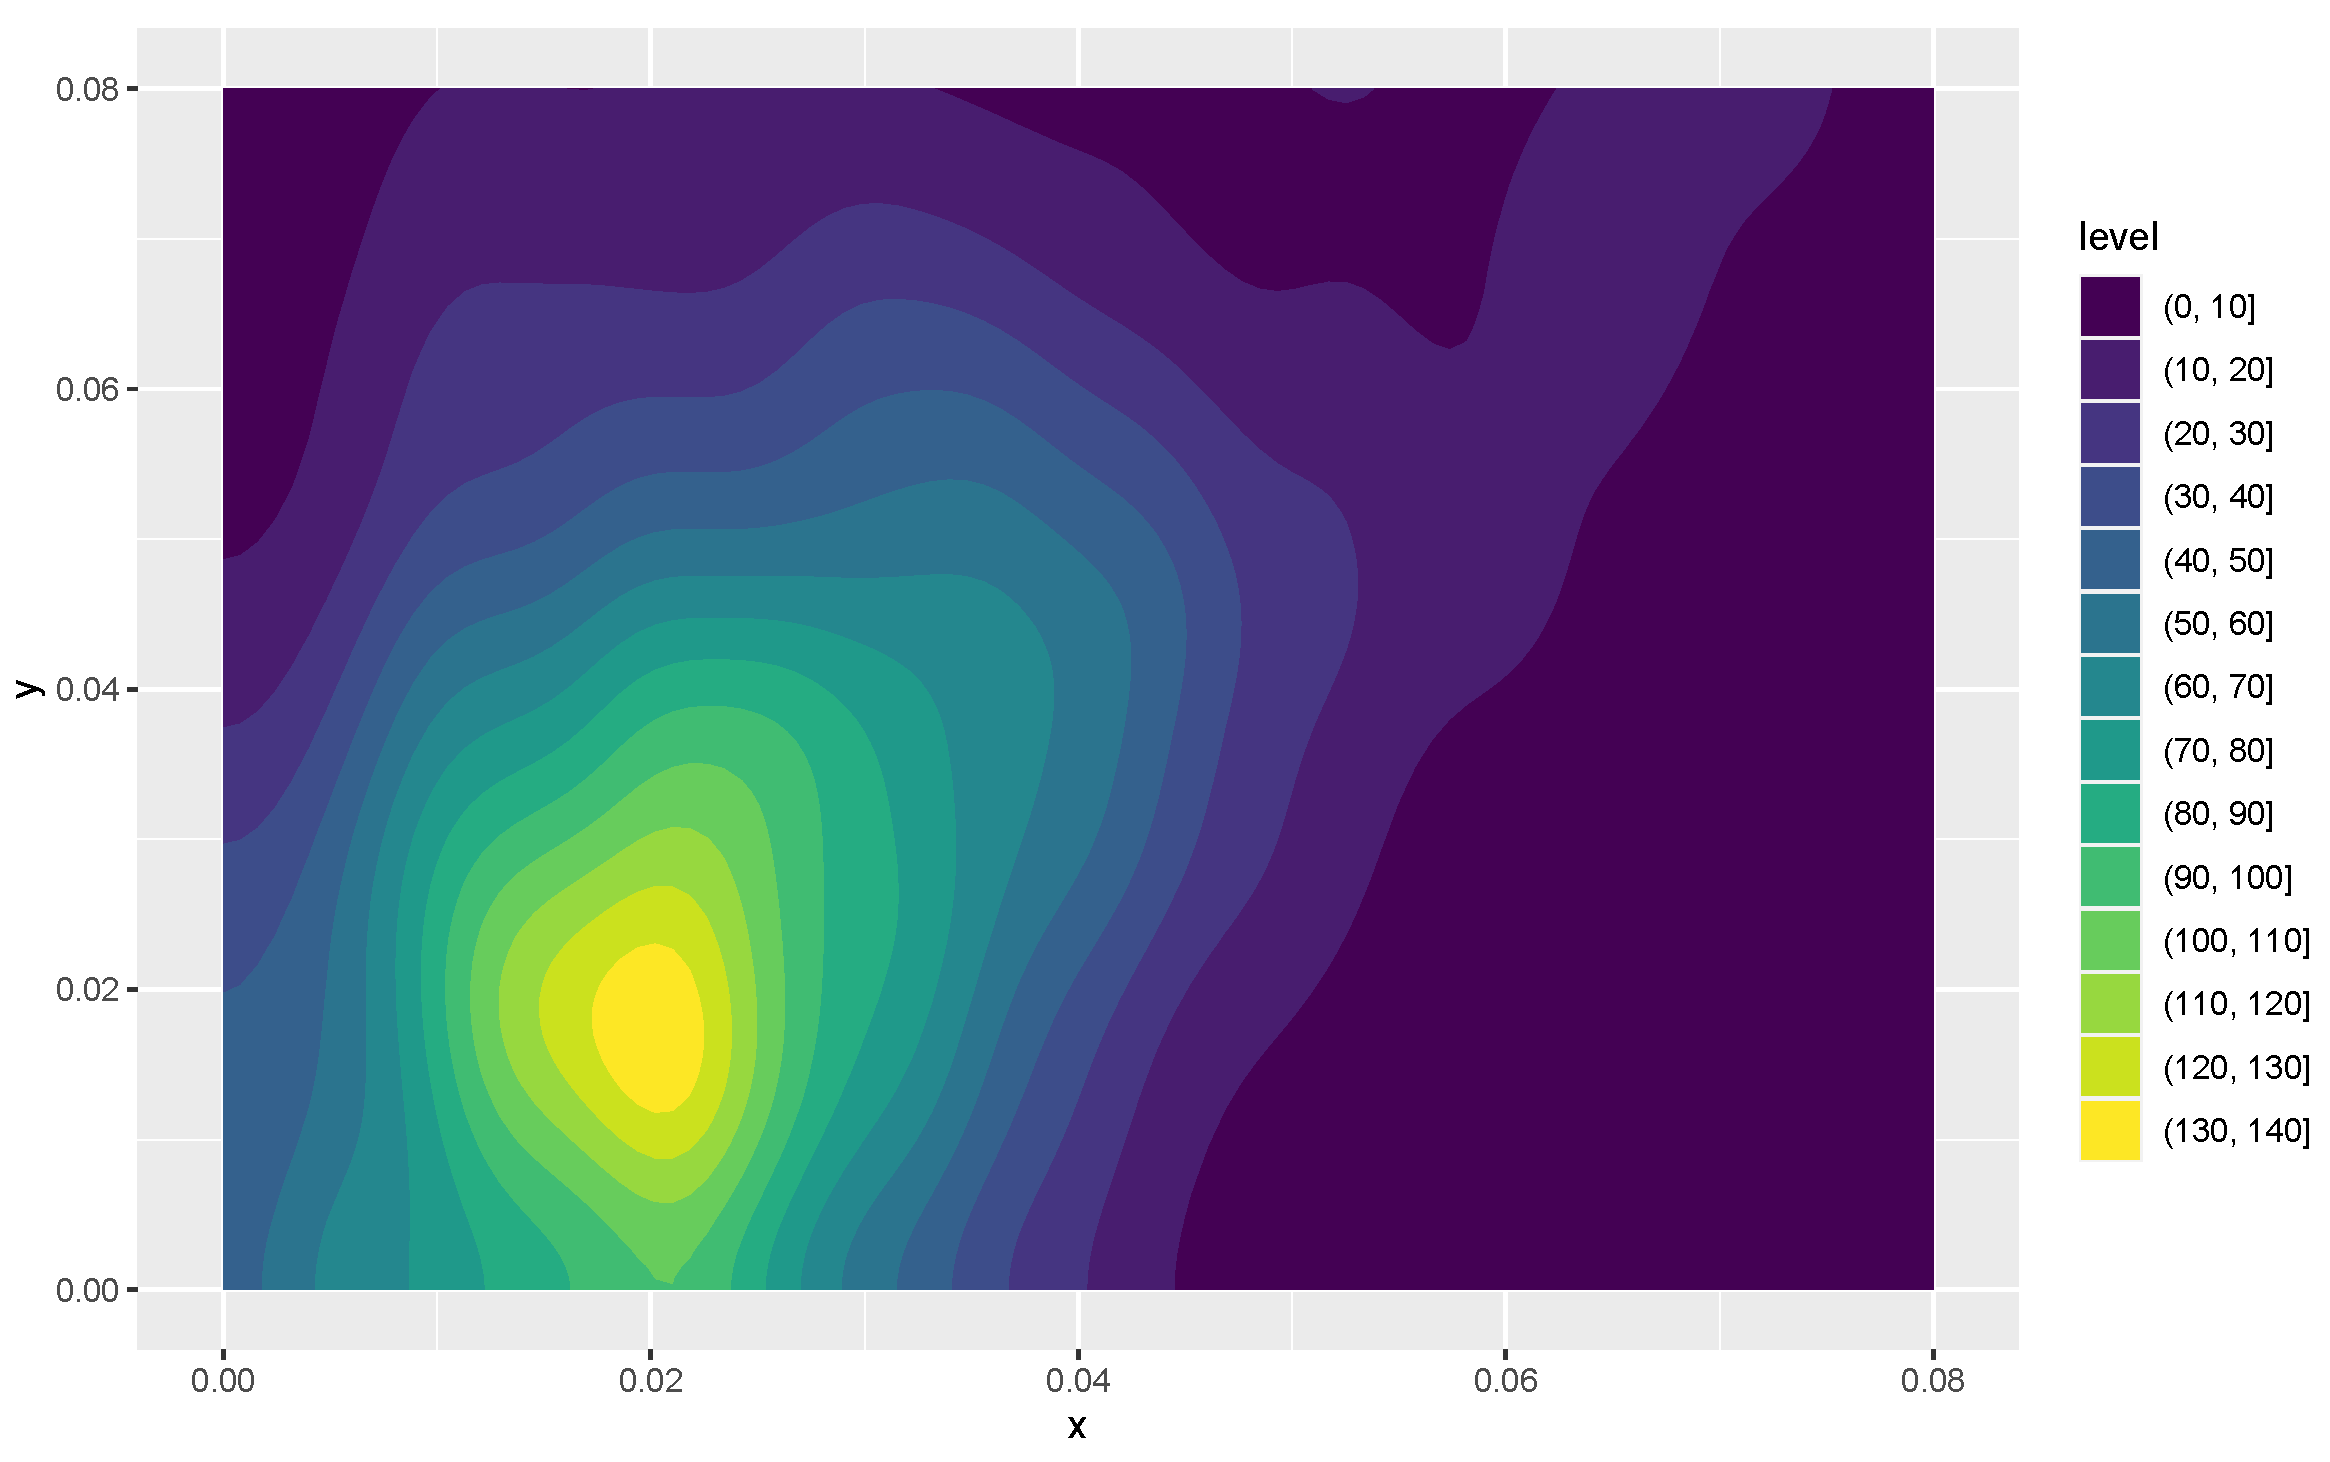
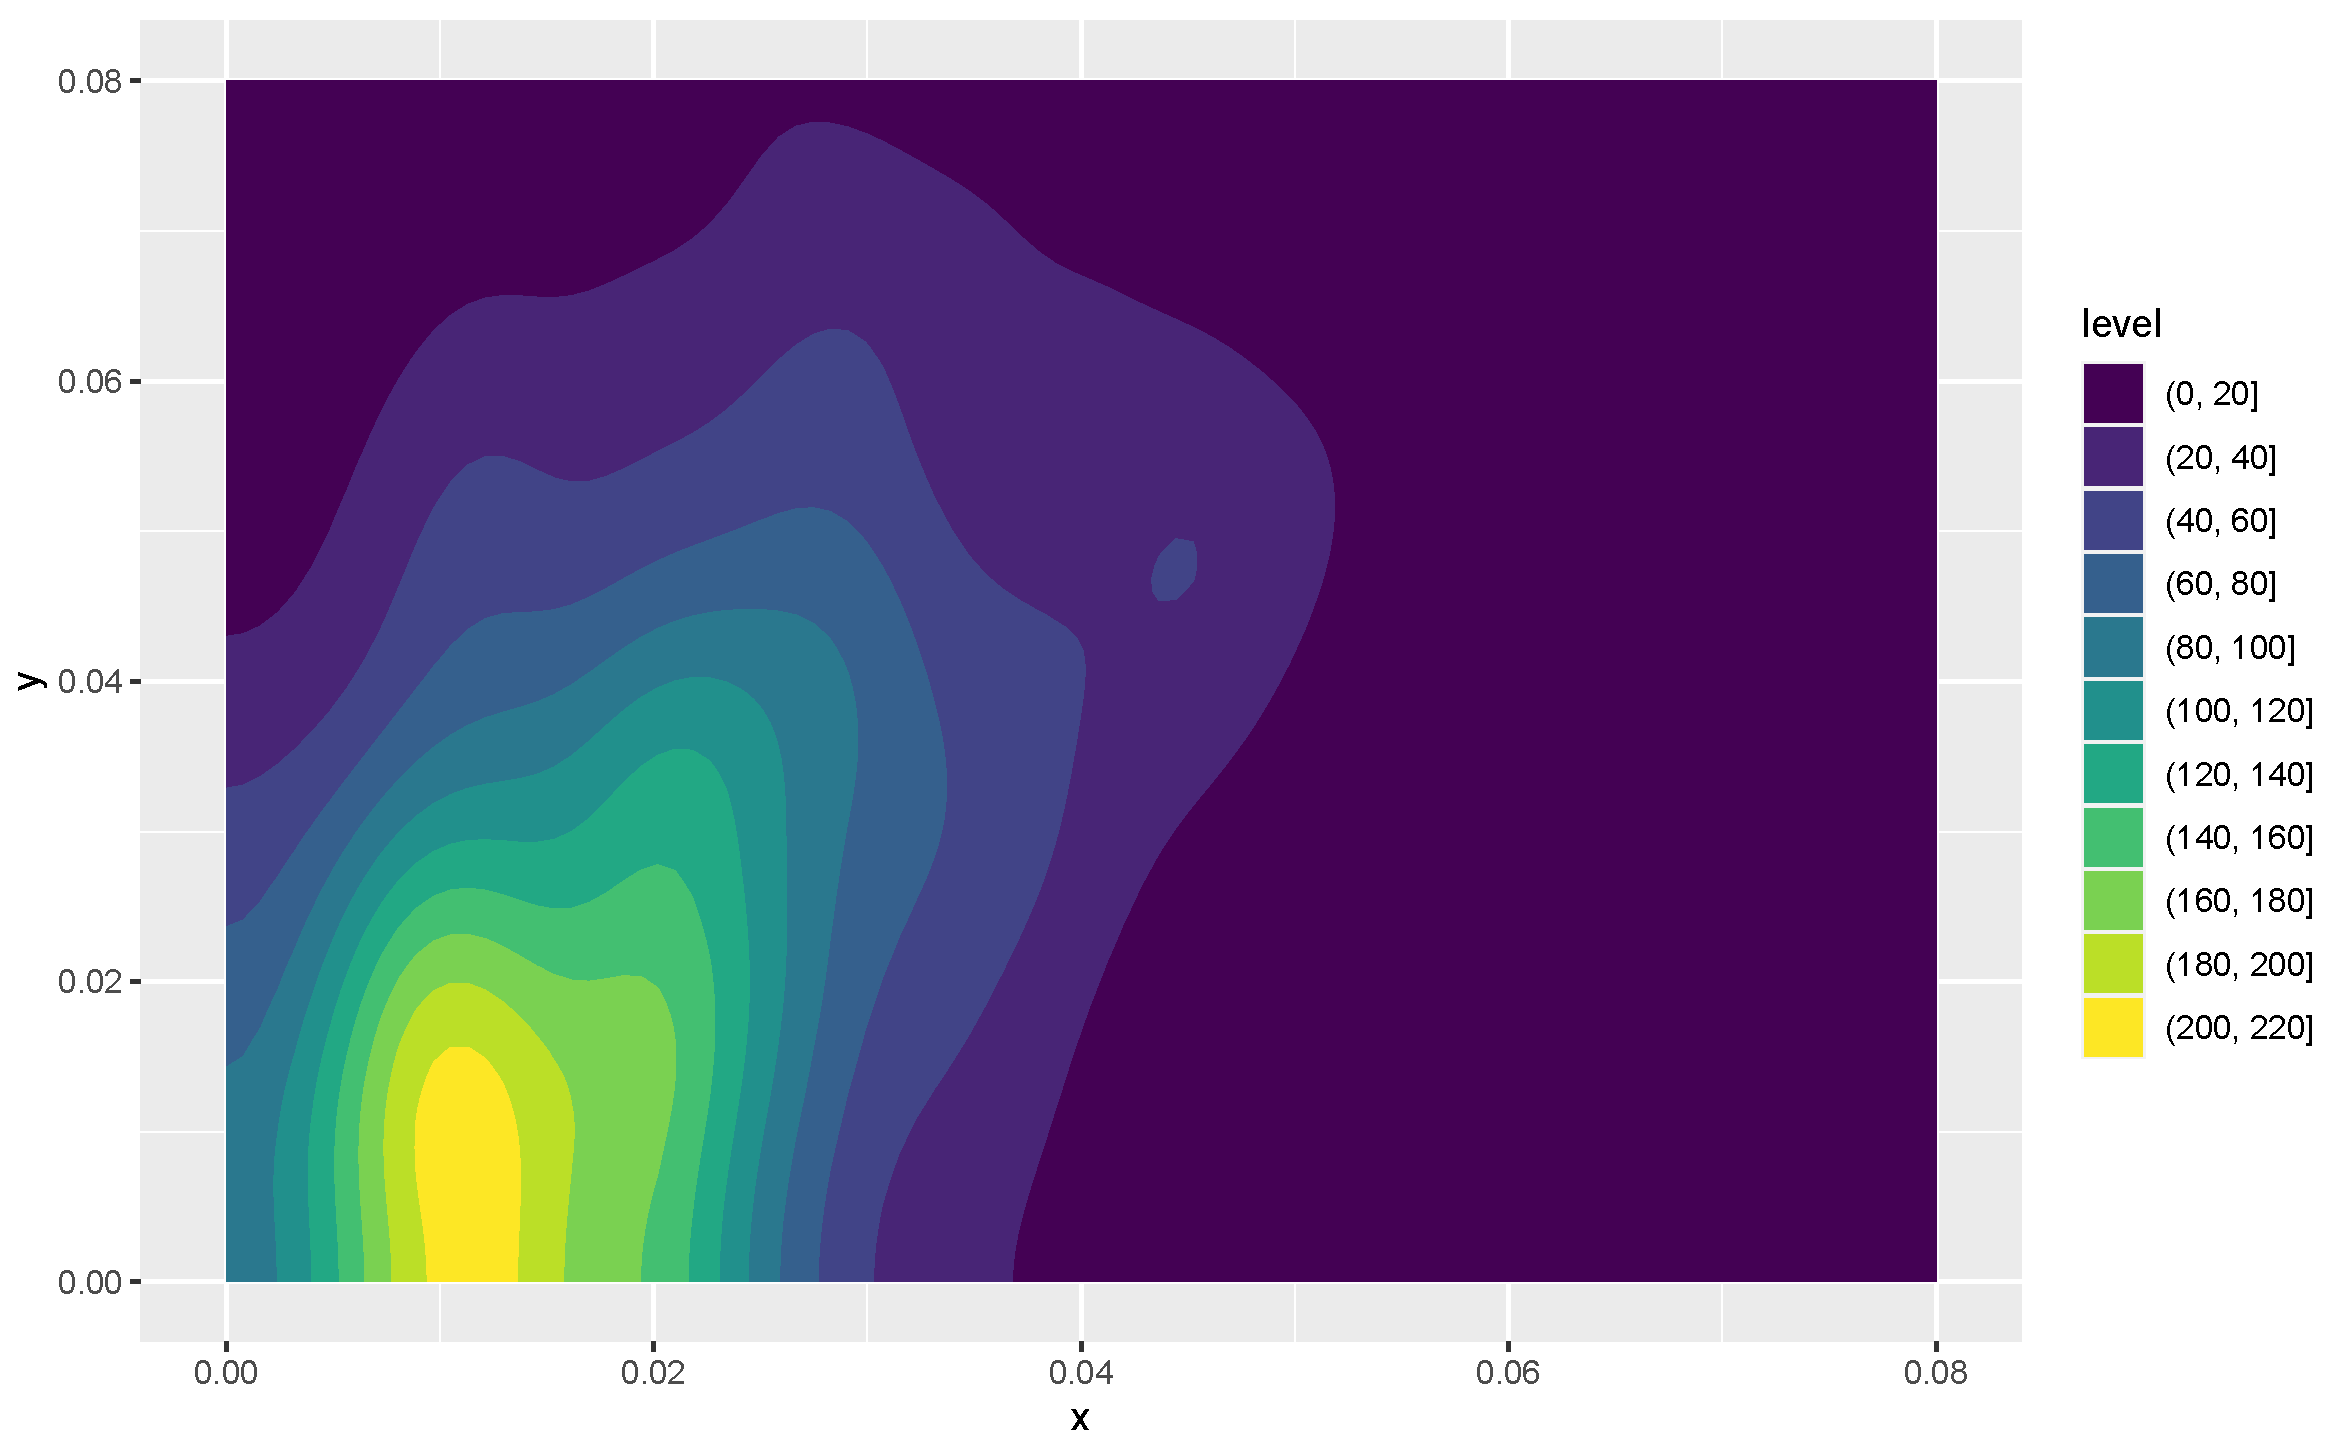
Kernel density estimates for variables 1 and 2 in the form of heat maps are shown in
Figure 8 and
Figure 9, and contours of the estimates are given in
Figure 10. The latter figure suggests that the distributions for metal cylinders and rock are different. The value of
turned out to be
, and an approximate
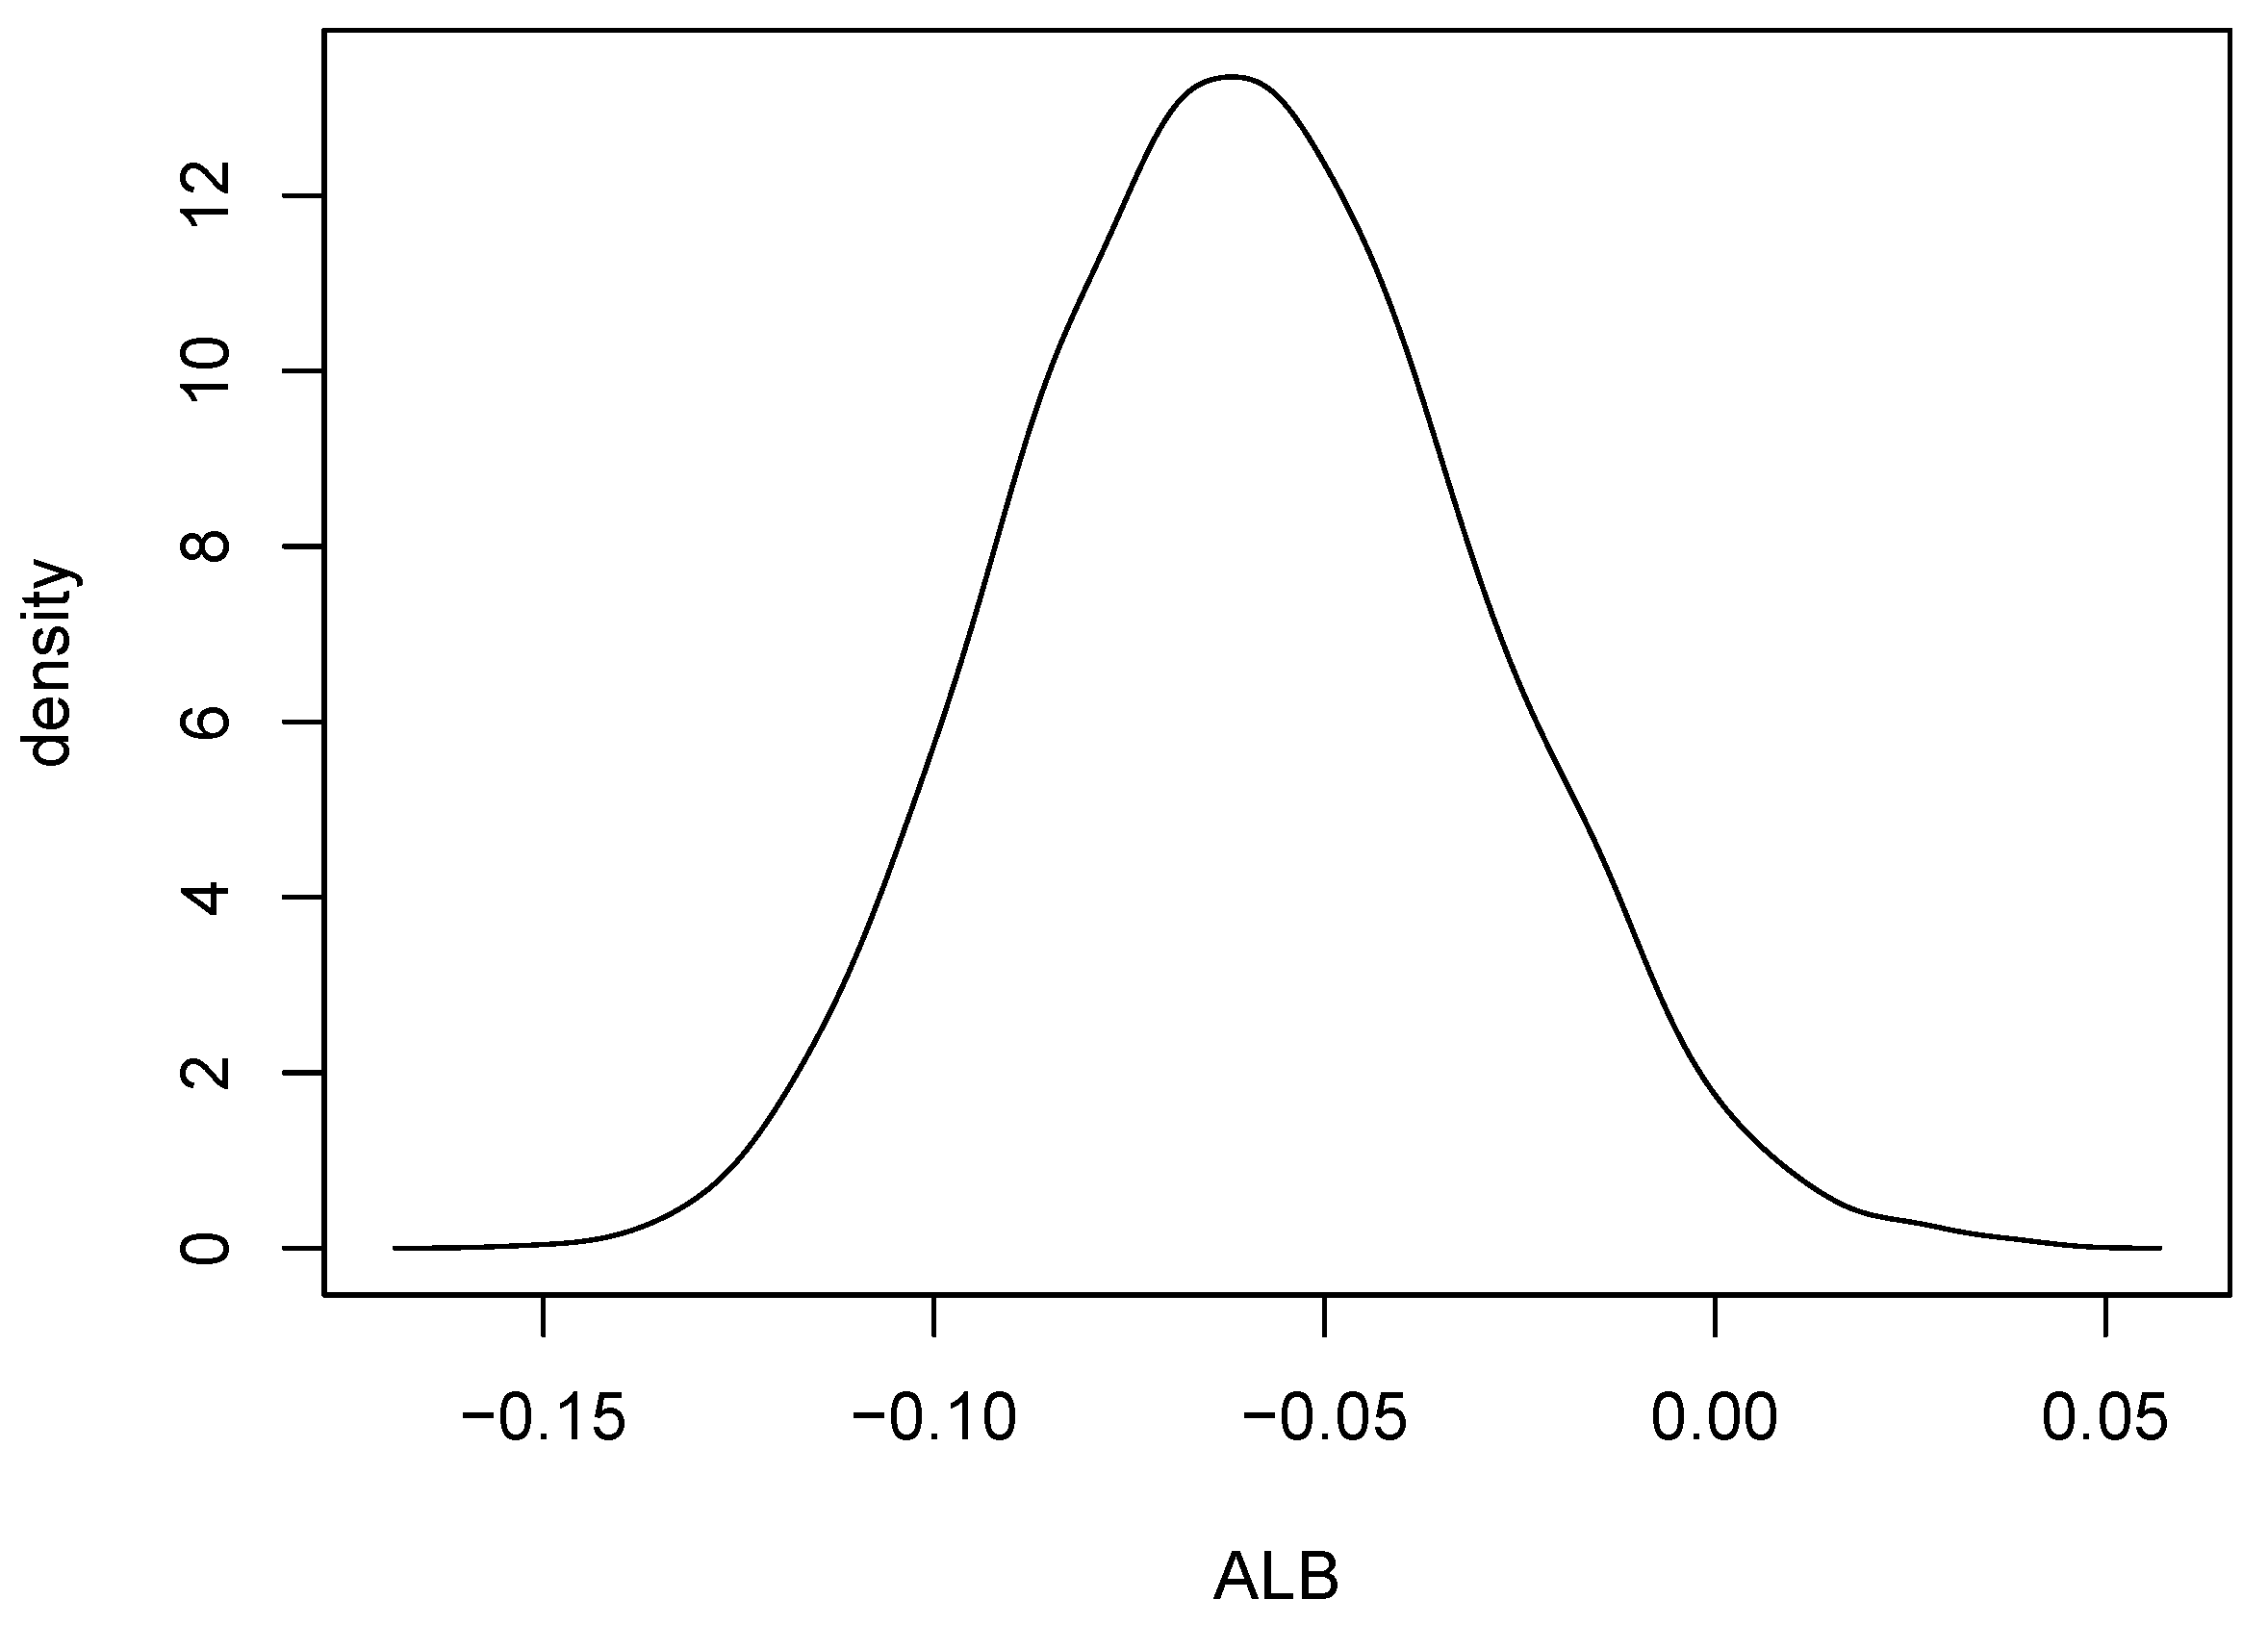
p-value based on 10,000 permuted data sets was 0.0076. So, there is strong evidence of a difference between the rock and metal bivariate distributions. Interestingly, the percentage of negative
s among the 10,000 permutations was
. A kernel density estimate based on the 10,000 values of
is shown in
Figure 11.


