Article

Quantifying Information of Dynamical Biochemical Reaction Networks

1
School of Science, Shenyang University of Technology, Shenyang 110870, China
2
School of Mathematics and Statistics, Xuzhou University of Technology, Xuzhou 221018, China
*
Author to whom correspondence should be addressed.
Entropy 2023, 25(6), 887; https://doi.org/10.3390/e25060887
Submission received: 27 March 2023 / Revised: 10 May 2023 / Accepted: 26 May 2023 / Published: 1 June 2023
(This article belongs to the Special Issue Entropy in Biological Systems)

Abstract

:
A large number of complex biochemical reaction networks are included in the gene expression, cell development, and cell differentiation of in vivo cells, among other processes. Biochemical reaction-underlying processes are the ones transmitting information from cellular internal or external signaling. However, how this information is measured remains an open question. In this paper, we apply the method of information length, based on the combination of Fisher information and information geometry, to study linear and nonlinear biochemical reaction chains, respectively. Through a lot of random simulations, we find that the amount of information does not always increase with the length of the linear reaction chain; instead, the amount of information varies significantly when this length is not very large. When the length of the linear reaction chain reaches a certain value, the amount of information hardly changes. For nonlinear reaction chains, the amount of information changes not only with the length of this chain, but also with reaction coefficients and rates, and this amount also increases with the length of the nonlinear reaction chain. Our results will help to understand the role of the biochemical reaction networks in cells.

1. Introduction

The basic unit of life is cells, and inside cells, a large number of biochemical reactions are constantly taking place. These reactions govern the differentiation of cells and the growth and development of individual organisms. They in general constitute a network of reactions that can regulate cellular behaviors. Recently, a large number of the biochemical reaction networks are identified for their functions. For instance, the signaling network of Dpp in Drosophila embryo [1,2,3,4] can regulate stem cell differentiation and control the rate of tissue growth; the signaling network of the P53 protein can protect and control cell cycle phase transitions [5,6,7,8]. In gene expression regulation networks, the transcription factors are recruited to the promoters, and biochemical reactions between them occur, resulting in activating the promoters [9,10,11,12]. The signaling network of JNK and P38 protein plays important roles in regulating cell inflammation and apoptosis, and can promote the apoptosis of cancer cells by activating these two information pathways [13,14,15,16,17]. The gene regulatory network of PTEN can regulate the synthesis of particular proteins and regulate the cell division cycle, inhibiting cancer cells [18,19,20]. Through phosphorylation, the signaling network of P13k-AKT forwardly or backwardly regulates substrate proteins to alter their intracellular localization or change their protein stability [21]. Aberrant activation of P13k-AKT causes uncontrolled cell proliferation and cell cycle dysregulation, inhibits apoptosis, and is associated with drug resistance in cancer therapy [22,23,24]. The regulatory network of CK2 can exert anti-apoptotic roles by protecting regulatory proteins from caspase-mediated degradation [25]. In the Xp10 phage regulatory network, P7 regulatory protein turns off host gene transcription or control the sequential expression of phage genes from early genes to late genes [26]. Therefore, studying the biochemical reaction networks is of great importance for understanding cell behaviors.
In fact, the biochemical reactions in cells are the processes of transmitting information between the upper and lower biochemical reactions [27,28], and the biochemical reaction networks in cells can transmit information from internal or external signals [29,30,31]. On the other hand, transmitting information through the biochemical reaction networks are also dynamical processes, possessing precise real-time information of controlling cell behaviors. For example, Dpp gradient always dynamically changes due to noise inside the embryos, but it is still precisely decoded by the downstream signaling pathway. A growing number of studies reveal that cells can encode and decode information by controlling temporal behavior of their signaling molecules [32]. This implies that the dynamical behavior of the signaling molecules can produce some information. How this information can be quantified is one of the hot topics in the field of system biology.
At present, information length, based on Fisher information and information geometry, is one method of measuring the information on dynamical behaviors. This method can explain the effect of different spatially periodic and deterministic forces [33]. Moreover, information length is linked with stochastic thermodynamics considering information geometry [34]. It can uncover the physical limitations in bacterial growth [35], and quantify the amount of information of morphogen gradient from its initial state to its steady state [36]. Here, we will apply this method to explore information of dynamical biochemical reaction networks, and measure the amount of information generated by the networks. This problem is, as far as we know, rarely studied.
In this paper, we mainly consider a simple biochemical reaction network by using the combination of information length and information geometry; we find that, in the linear biochemical reaction chain, with the increase of the reaction chain length, the amount of information does not always increase, and when the number of this length is not very large, the change of information transmission is larger. When this number reaches a critical value, the change of information transmission is less, and this phenomenon also confirms that some biochemical reaction networks are usually completed in 5–6 steps. For example, the degradation of mRNA and protein is only 2–3 steps, and the activation of the promoter is accomplished by regulating transcription factors in at most 8 steps [37,38]. In the nonlinear biochemical reaction chain, the change in the amount of information is not only related to the length of the reaction chain, but also to the reaction coefficients and the reaction rates.
This paper is organized as follows. In Section 2, information geometry is introduced. In Section 3, we build respectively the linear and nonlinear biochemical reaction chains and explore the character of information transmitted in these two models. Finally, a brief discussion and conclusion are given.

2. Method of Information Geometry

In order to investigate the reaction network from the perspective of information geometry, we firstly introduce the information geometry on the discrete distribution. Due to the normalization of the probability distribution, a set of possible distributions can generate a Riemannian manifold. In this article, we only consider a set of discrete distribution group p = p 0 , p 1 , , p n , p i 0 for any i , and i = 0 n p i = 1 . We conventionally consider the Kullback–Leibler divergence between the two distributions p and p , defined as
D k l ( p p ) = i = 0 n p i ln p i p i ·
In information geometry, the square of the line element d s is defined as the second-order Taylor series of the Kullback–Leibler divergence [39,40] between two probability distributions p and p + d p = ( p 0 + d p 0 , p 1 + d p 1 , , p n + d p n ) ,
d l 2 = i = 0 n ( d p i ) 2 p i ,
where d p = ( d p 0 , d p 1 , , d p n ) is the infinitesimal displacement that satisfies i = 0 n d p i = 0 . The square of the line element is directly related to the Fisher information metric. Any probability distribution p = p 0 , p 1 , p 2 , , p n corresponds with a point on the spherical surface by replacing the coordinate axis p 0 , p 1 , p 2 , , p n with 2 p 0 , 2 p 1 , 2 p 2 , , 2 p n . Using this method, the simplex composed of the coordinate axis p 0 , p 1 , p 2 , , p n turns into a manifold S n with an n-dimension spherical surface of radius 2 [17,33,34]. Next, we introduce the statistical length L [41,42,43],
L = d l = d l d t d t ,
which can quantify the information change [40]. It is well known that the shortest of the curves connecting the two points on the spherical surface is the geodesic. The following relationship has been given out in [34,35].
L D r i n i . r f i n = 2 arccos r i n i . r f i n ,
where “ · ” denotes the inner product; r is the unit vector defined as r = r 0 , r 1 , , r n = ( p 0 , p 1 , , p n ) . D r i n i , r f i n stands for the geodesic (that is, the shortest arc) between r i n i and r f i n in the manifold S n , and a r c c o s r i n i , r f i n is the included angle between r i n i and r i n i . Unlike the Kullback–Leibler divergence, the geodesic D is symmetric and satisfies the triangle inequality, so it can be treated as a true distance [41,44,45,46,47,48,49,50,51,52].

3. Model and Analysis

Here, we consider a general biochemical reaction chain(model 1),
X 1 k 1 k 1 n 2 X 2 k 2 k 2 n 3 X 3 k 3 k 3 n 4 X 4 k 4 k 4 k ( n 2 ) k n 2 n n 1 X n 1 k ( n 1 ) k n 1 n n X n ,
where X 1 , X 2 , X 3 , X 4 , , X n 1 , X n are reactants; n 2 , n 3 , n 4 , , n n 1 , n n are the reaction coefficient; k 1 , k 1 , k 2 , k 2 , , k n 1 , k ( n 1 ) are the reaction rate constants. Here, we assume that the concentration of the first reactant is not zero and that the concentrations of the other reactants are zero, because only when the first reactant is involved in the reaction, the later reactants will occur.
For this kind of biochemical reaction network, in bacteria such as E. coli and Salmonella, and in eukaryotic cells such as Drosophila, their transcription processes are a cascade reaction as the above model, so it is interesting for us to study this reaction network.

3.1. Linear Biochemical Reaction Network

To uncover the underlying principle of information transformation via this network, we firstly consider a simple case of this network (model 2) by assuming the reaction coefficients to be 1, i.e.,
X 1 k 1 k 1 X 2 k 2 k 2 X 3 k 3 k 3 X 4 k 4 k 4 k n 2 k n 2 X n 1 k n 1 k n 1 X n .
Obviously, this model is a linear network of biochemical reactions, and is governed by the following master equation,
d p X 1 t d t = k 1 p X 2 t k 1 p X 1 t , d p X 2 t d t = k 1 p X 1 t k 1 p X 2 t + k 2 p X 3 t k 2 p X 2 t , d p X 3 t d t = k 2 p X 2 t k 2 p X 3 t + k 3 p X 4 t k 3 p X 3 t , d p X n t d t = k n 1 p X n 1 t k n 1 p X n t .
Because the large number of coupled equations in Equation (7) is larger, we hardly provide the analytic expression of the solution with respect to time t . Its corresponding steady state equation is
0 = k 1 p X 2 t k 1 p X 1 t , 0 = k 1 p X 1 t k 1 p X 2 t + k 2 p X 3 t k 2 p X 2 t , 0 = k 2 p X 2 t k 2 p X 3 t + k 3 p X 4 t k 3 p X 3 t , 0 = k n 1 p X n 1 t k n 1 p X n t .
In help of the conservation rule of the probability, we can obtain its analytical solution,
p X 1 = k 1 k 2 k 3 k 4 k n 1 k 1 k 2 k 3 k 4 k n 1 + k 1 k 2 k 3 k 4 k n 1 + + k 1 k 2 k 3 k 4 k n 1 , p X 2 = k 1 k 1 p X 1 , p X 3 = k 1 k 2 k 1 k 2 p X 1 , p X n = k 1 k 2 k 3 k 4 k n 1 k 1 k 2 k 3 k 4 k n 1 p X 1 .
This expression is a recursive formula.

3.2. Numerical Simulations and Results

In this section, we will numerically investigate information involved in the linear reaction Chain (See Equation (6)) from its initial state to its steady state. Since the reaction species in Model 2 (See Equation (6)) is usually a lot, numerical simulations are performed for Equation (7). In order to obtain general results, through this paper, the reaction rates in model 2(See Equation (6)) are randomly taken from the uniform distribution U (0.1,1), and then according to Equations (3) and (4), the geodesic curve and the information in Model 2 (See Equation (6)) from its initial state to its steady state can be, respectively, calculated numerically. This process is repeatedly performed for 2000 times. In Figure 1, we first show four geodesic curves of Model 2 (See Equation (6)), which are randomly chosen from the 2000-time random experiments. We can find that the length of the geodesic curves increases with the number of the reaction chain, and that the geodesics of the whole biochemical reaction will reach a stationary state when the number of the reactant species reaches a certain critical value. Of course, this critical value of the reaction chain is different for different reaction rates.
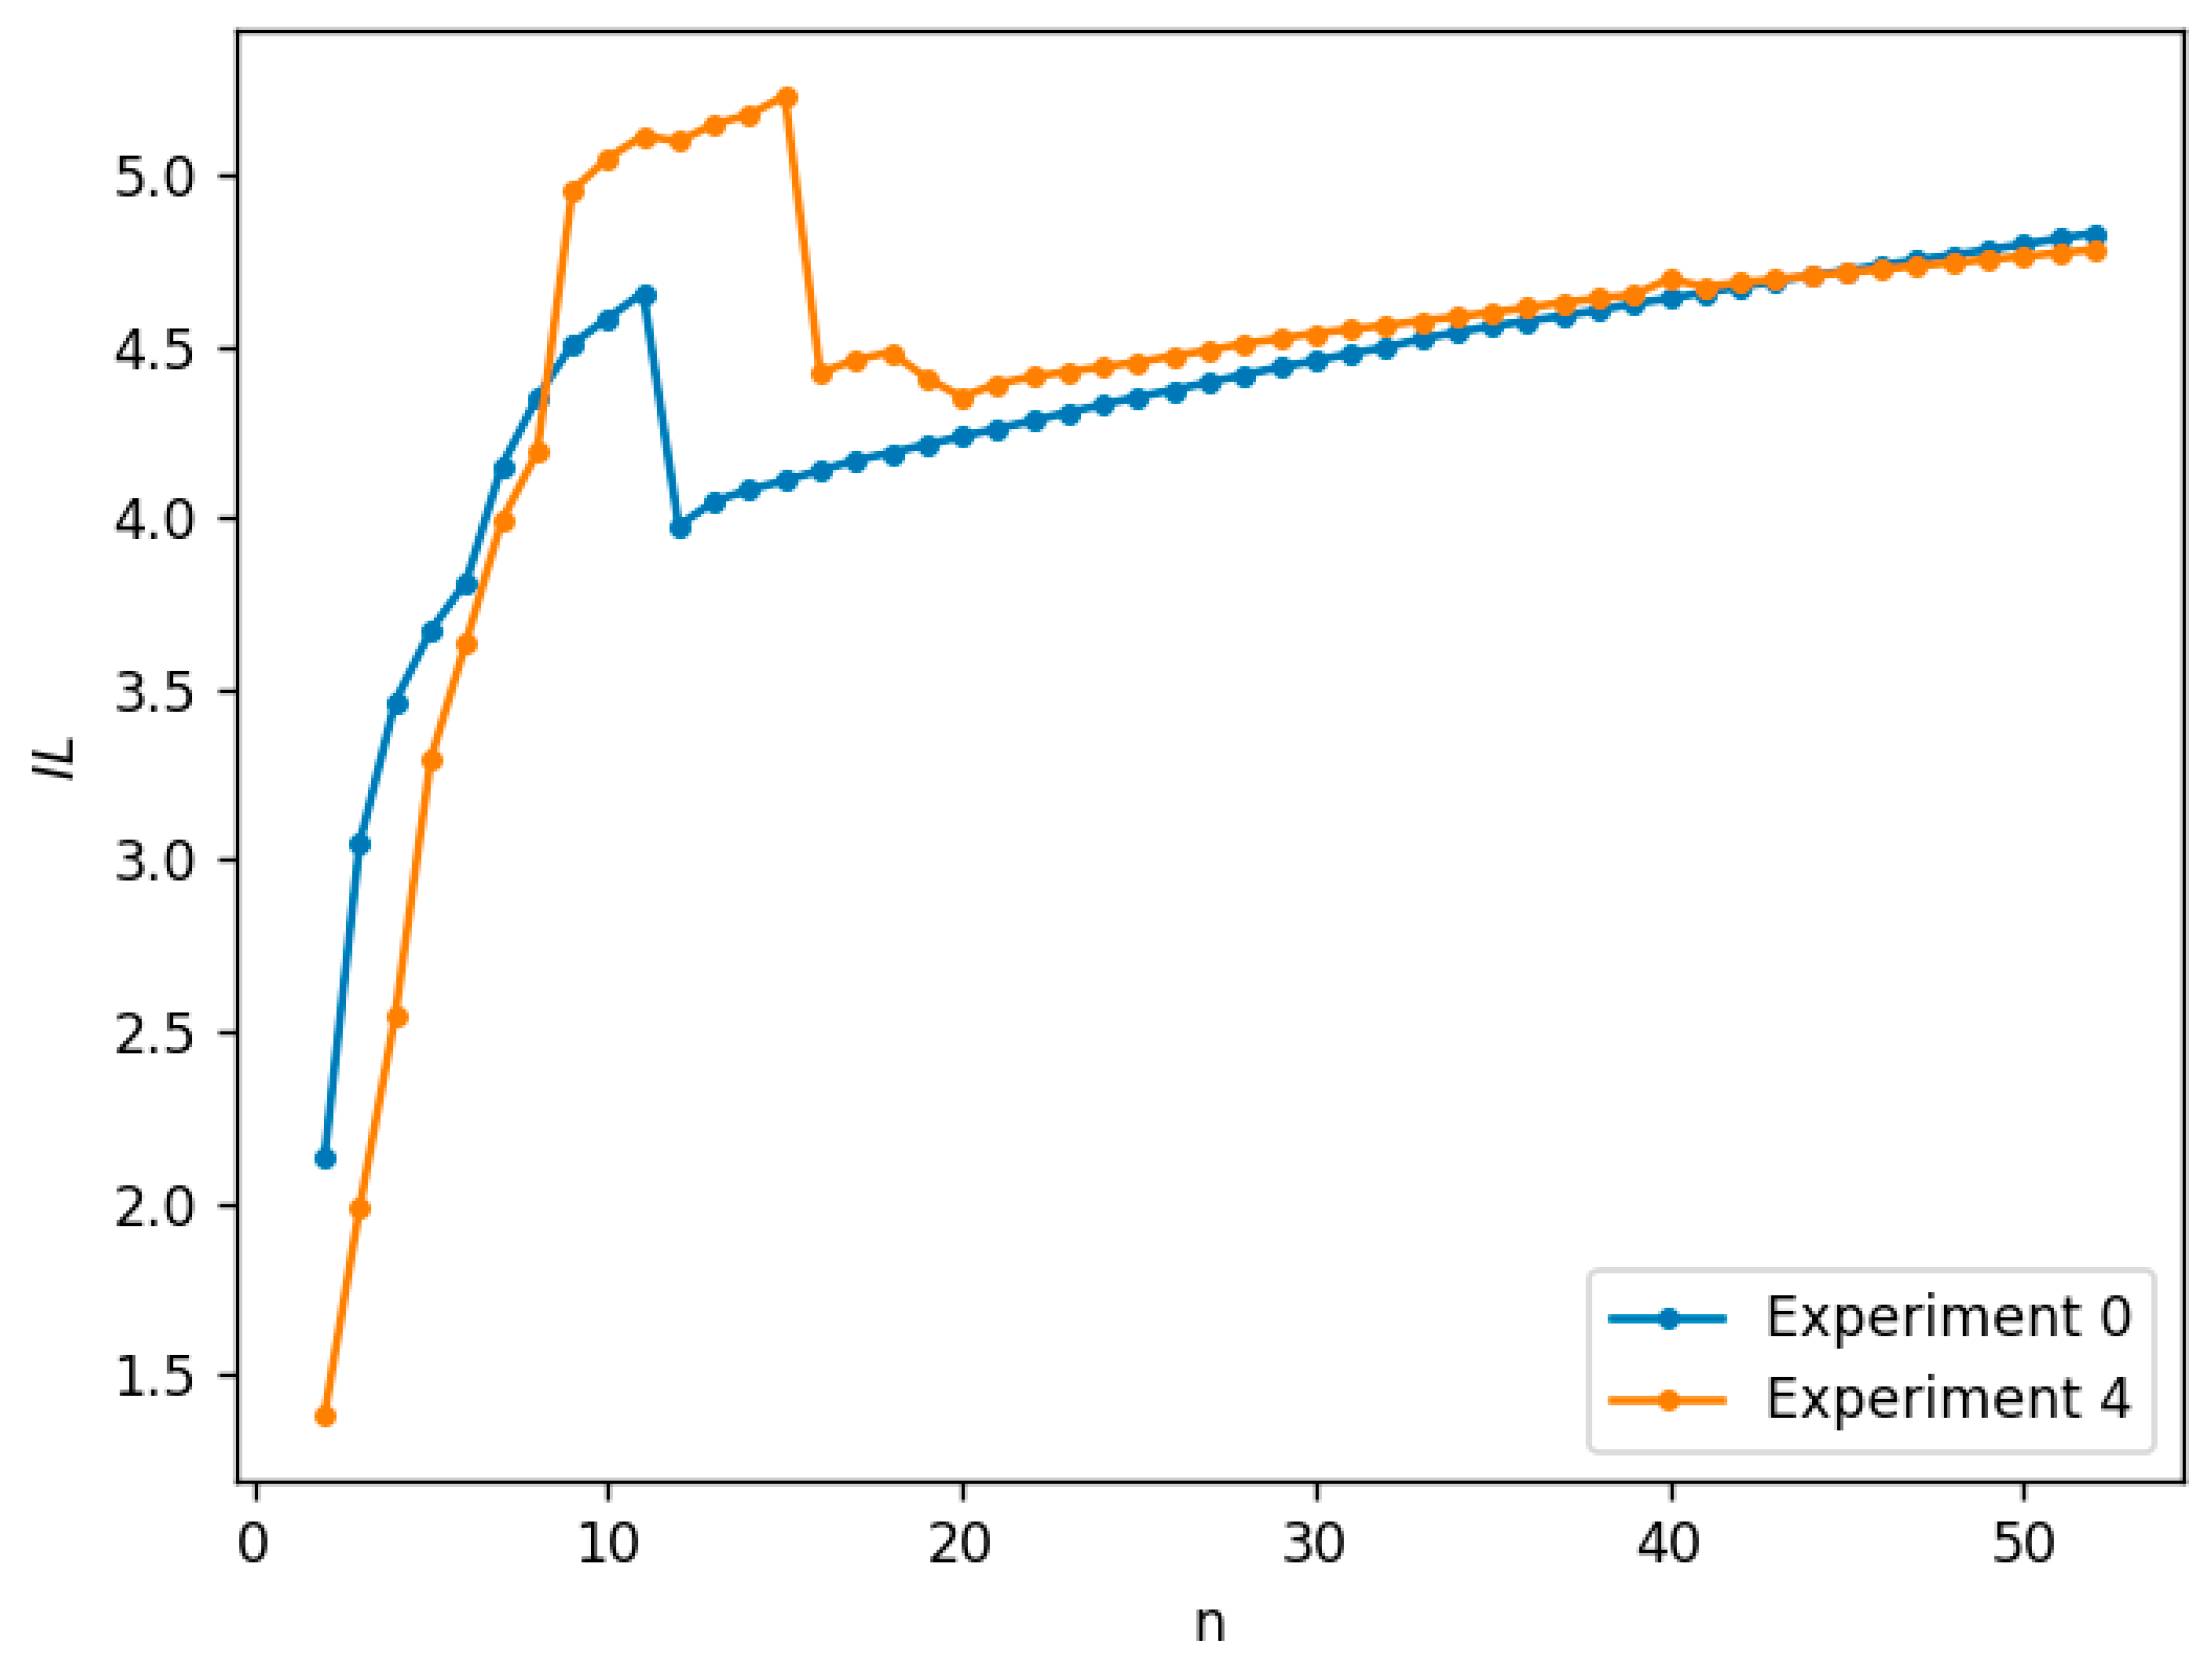
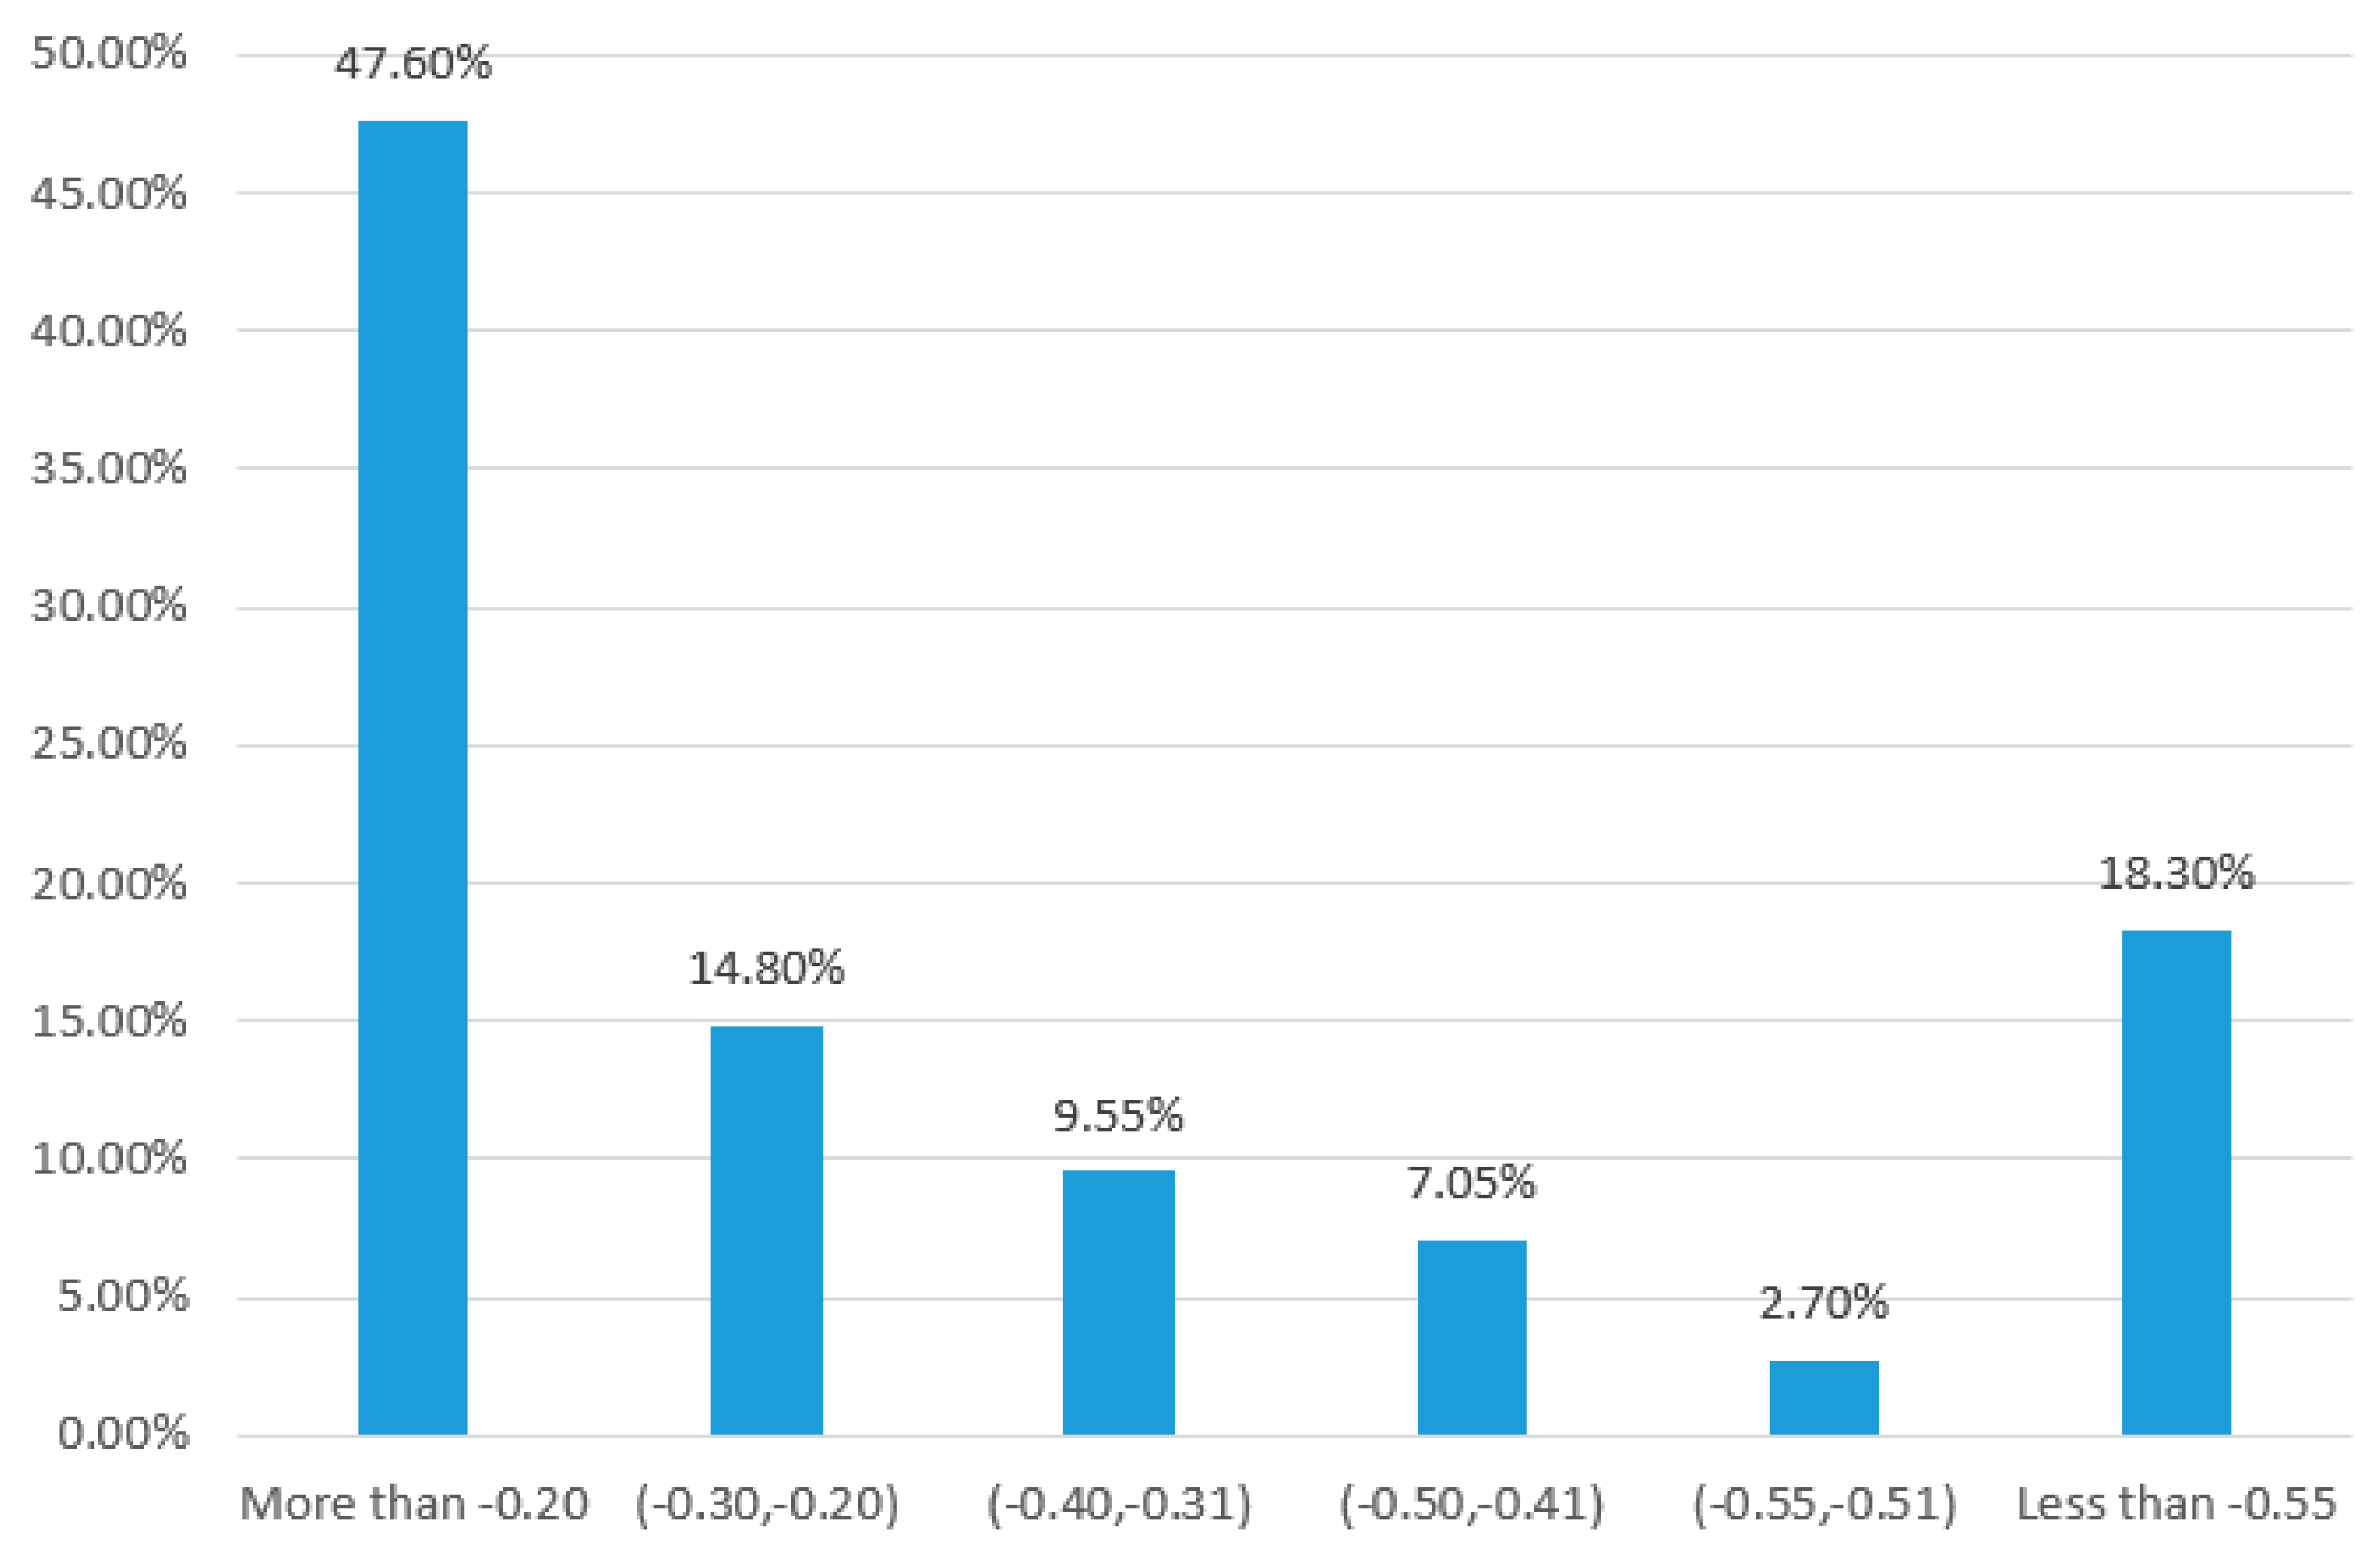
Next, the amount of information in Model 2 (See Equation (6)) from its initial state to its steady state will be examined. First, we choose 2000 groups of random numbers from the uniform distribution U (0.1,1). Each of these groups is settled as the reaction rates in Model 2 (See Equation (6)), and calculate the amount of information. We find that the amount of information in Model 2 (See Equation (6)) almost increases with the number of the reaction chain, see Figure 2. Although this amount may slightly drop once for the special reaction rates at a certain number of the linear reaction chain, the later amount of information will continuously increase, see Figure 3. To further uncover the dropping range of the information amount, we count the statistical frequency of the drop in the information amount, see Figure 4. This figure shows the frequencies for less dropping ranges, and that the frequency of the dropping range of 0.5 or more counts for 18.3%, implying the amount of the information may always increase if calculation errors are ignored. Of course, through 2000 random simulations, we find that the critical values, at which the amount of information in the reaction chain reaches stationary states, are different when the forward and backward reaction rates are different.

3.3. Nonlinear Biochemical Reaction Network

Next, we obtain the nonlinear network of biochemical reactions, while reaction coefficients are not all one (model 3).
X 1 k 1 k 1 n 2 X 2 k 2 k 2 n 3 X 3 k 3 k 3 n 4 X 4 k 4 k 4 k n 2 k n 2 n n 1 X n 1 k n 1 k n 1 n n X n .
Its master equation is
d p X 1 t d t = k 1 p X 2 t n 2 k 1 p X 1 t , d p X 2 t d t = k 1 p X 1 t k 1 p X 2 t n 2 + k 2 p X 3 t n 3 k 2 p X 2 t n 2 , d p X 3 t d t = k 2 p X 2 t n 2 k 2 p X 3 t n 3 + k 3 p X 4 t n 4 k 3 p X 3 t n 3 , d p X n t d t = k n 1 p X n 1 t n n 1 k n 1 p X n t n n .
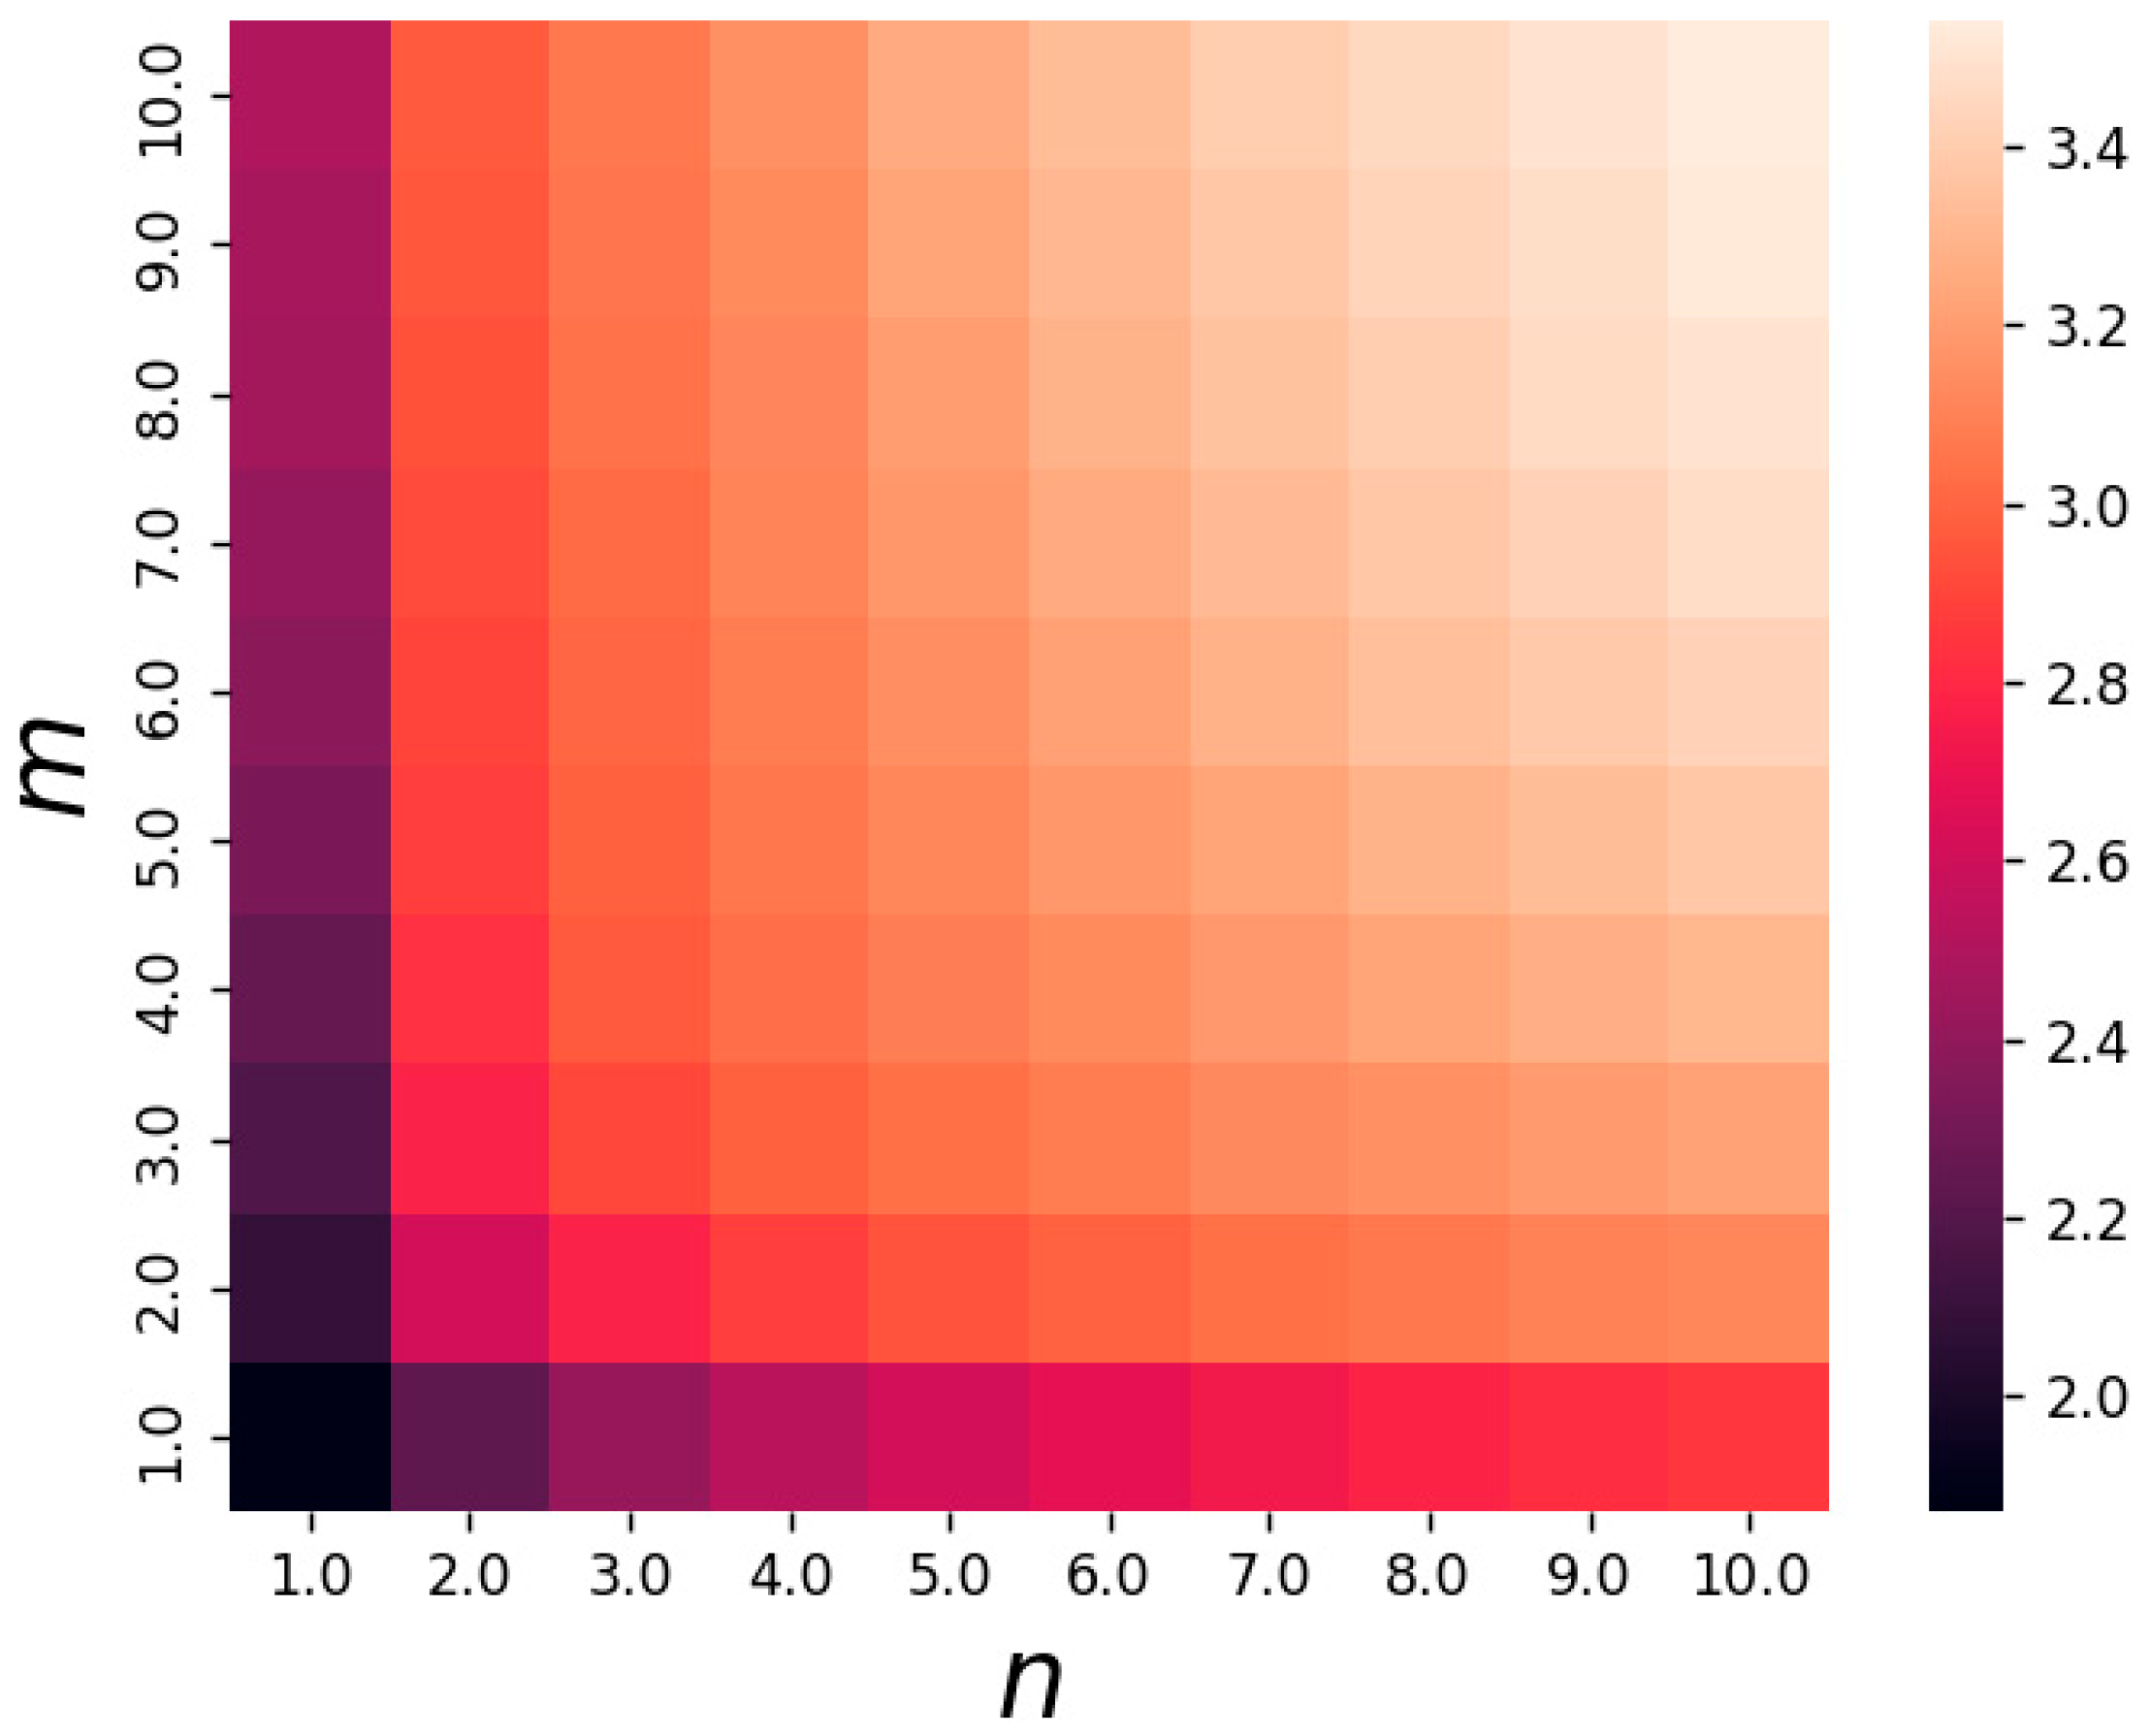
Since, the equation is a nonlinear coupled master equation, we cannot obtain its analytical solution; we can only perform some numerical results via random simulation and calculate the probability of each reactant. Thus, we can obtain the amount of information through the method of information geometry. In Figure 5, we consider a nonlinear biochemical reaction network with the chain length 3 (model 4), as follows:
X 1 k 1 k 1 m X 2 k 2 k 2 n X 3 ,
and plot the heat map of the information for Model 4 (See Equation (12)), which finds that it increases with the number of reactants involved in the reaction.
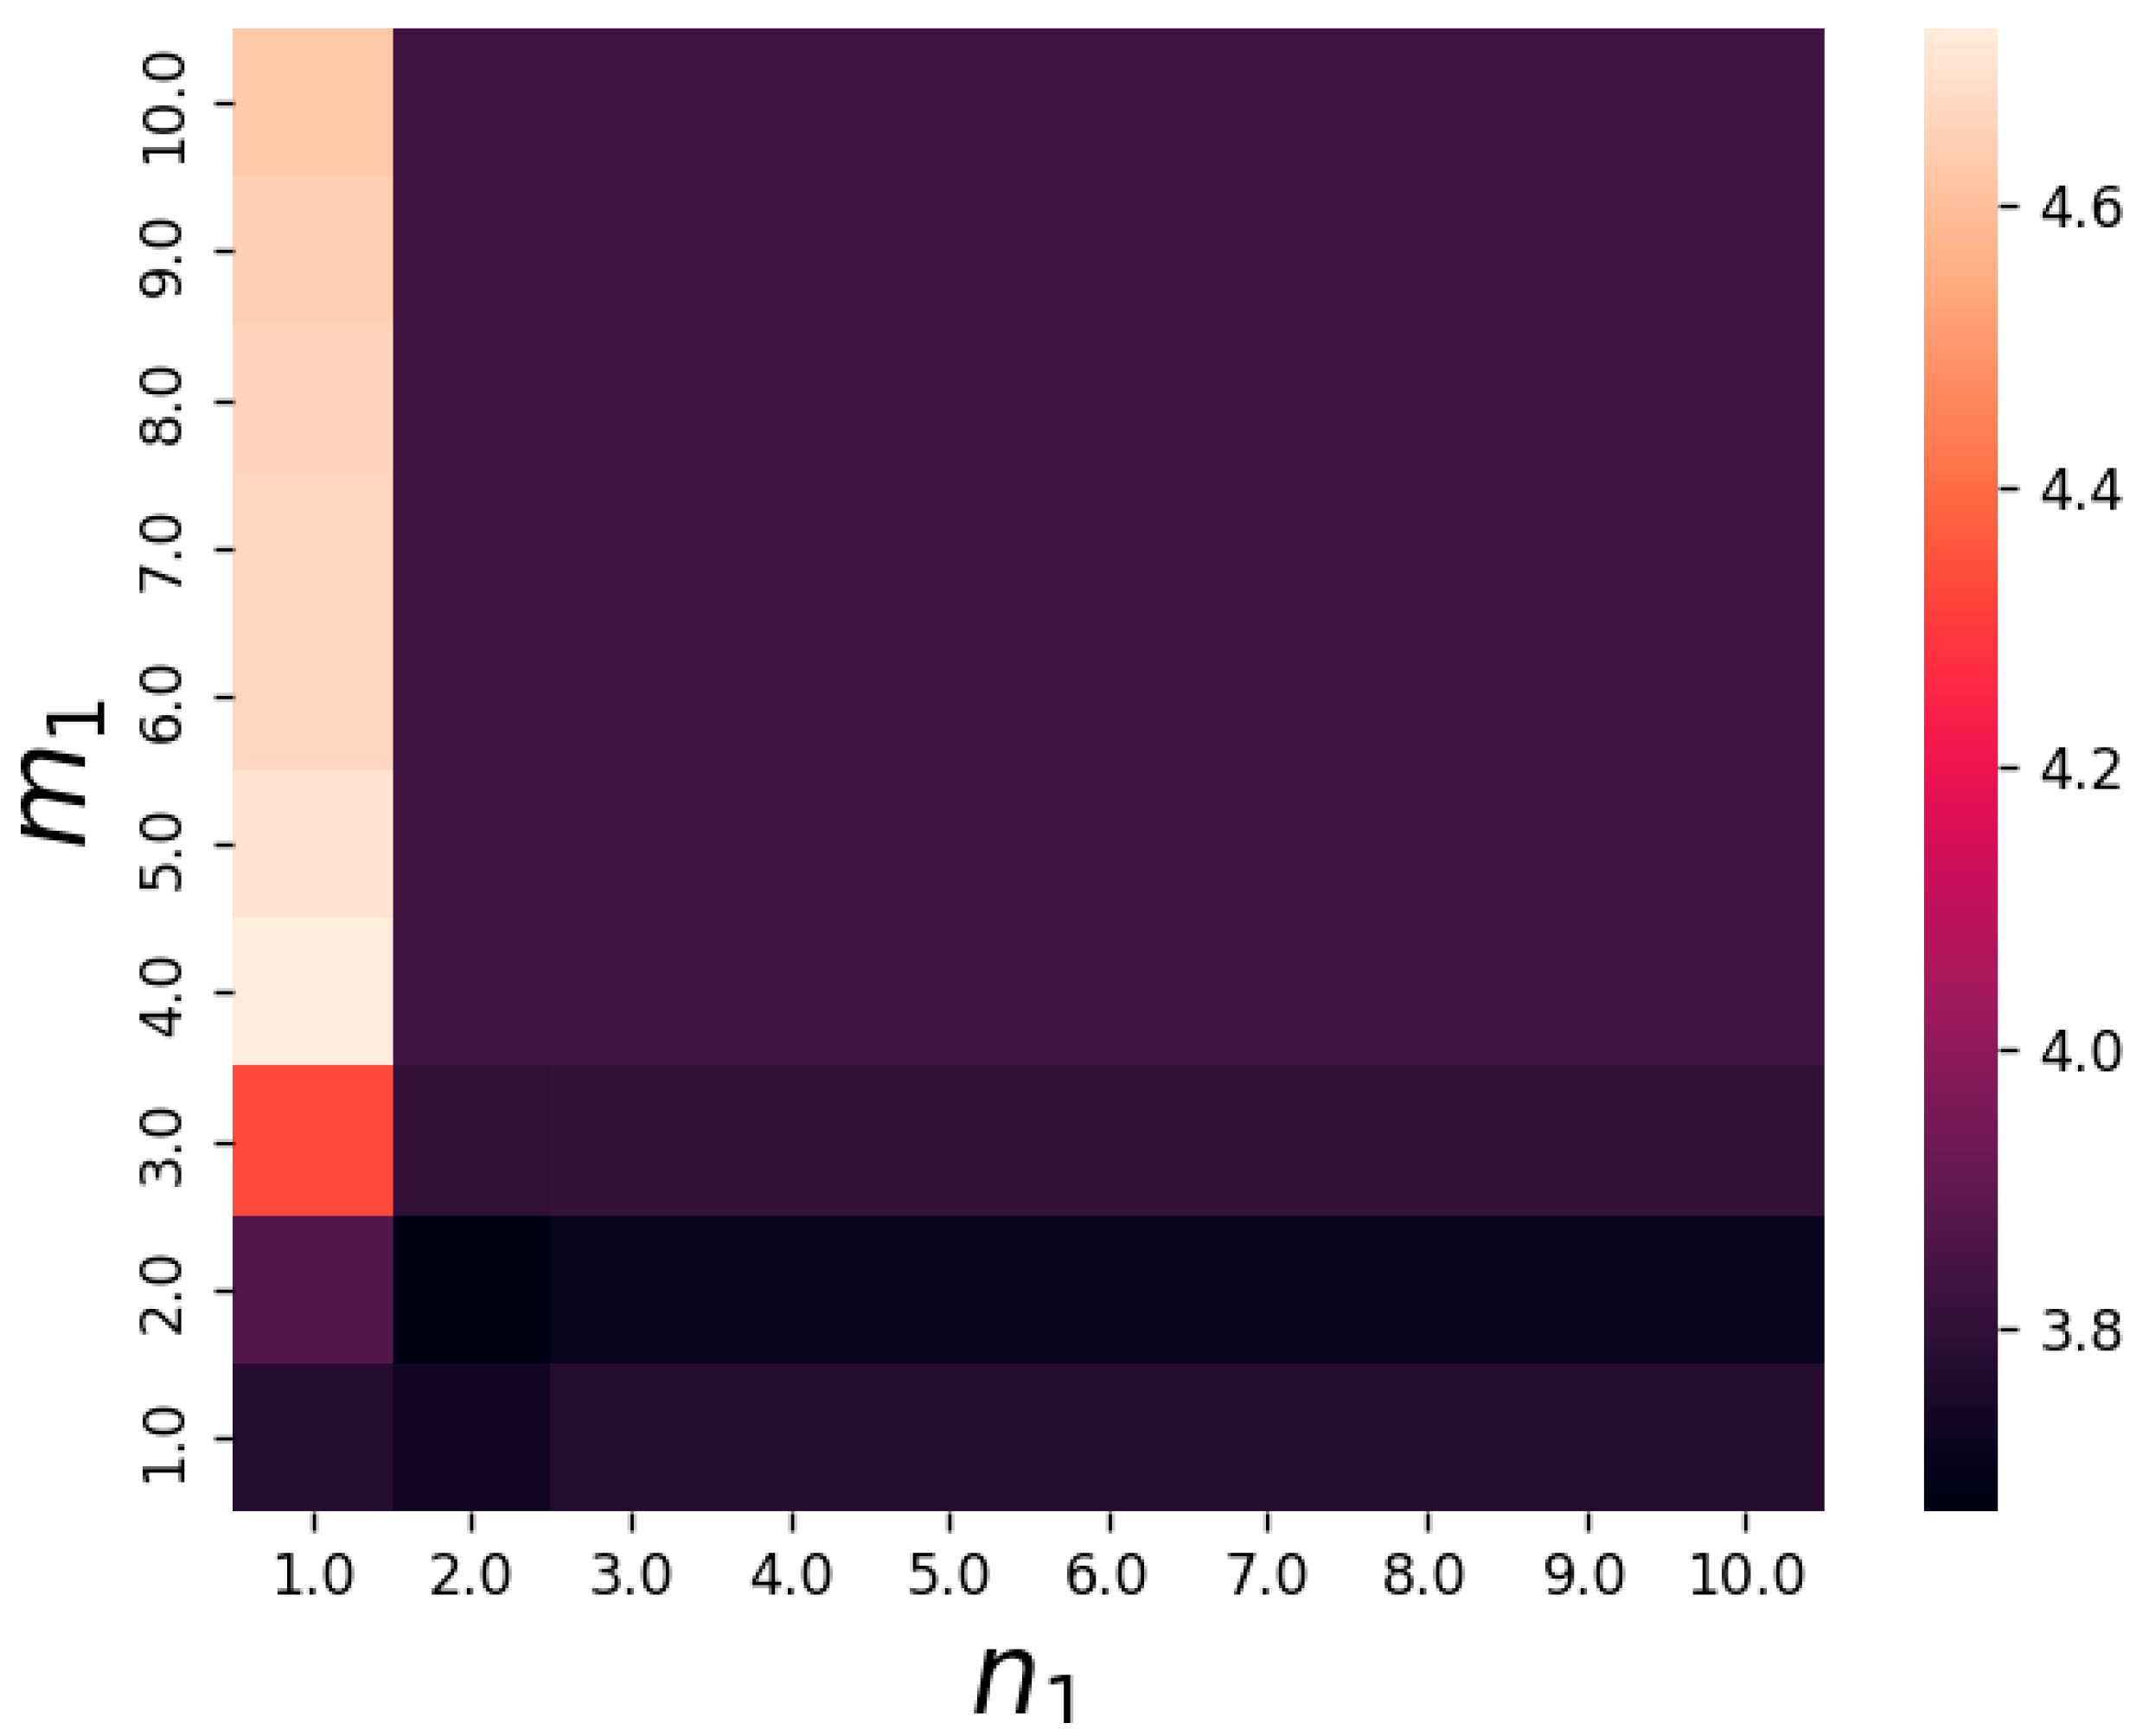
In Figure 5, we find that the chain reaction is most informative when m = 10 and n = 10 . In the following, we will increase the length of the reactants and fix m = 10 , n = 10 , change the size of m 1 , n 1 behind, and observe when the combination of reactants in the chain reaction is the maximum amount of information. Thus, we will consider a nonlinear biochemical reaction network with a chain length of 5 (model 5)as follows:
X 1 k 1 k 1 m X 2 k 2 k 2 n X 3 k 2 k 2 m 1 X 4 k 2 k 2 n 1 X 5 ,
and plot the heat map of the information for Model 5 (See Equation (13))
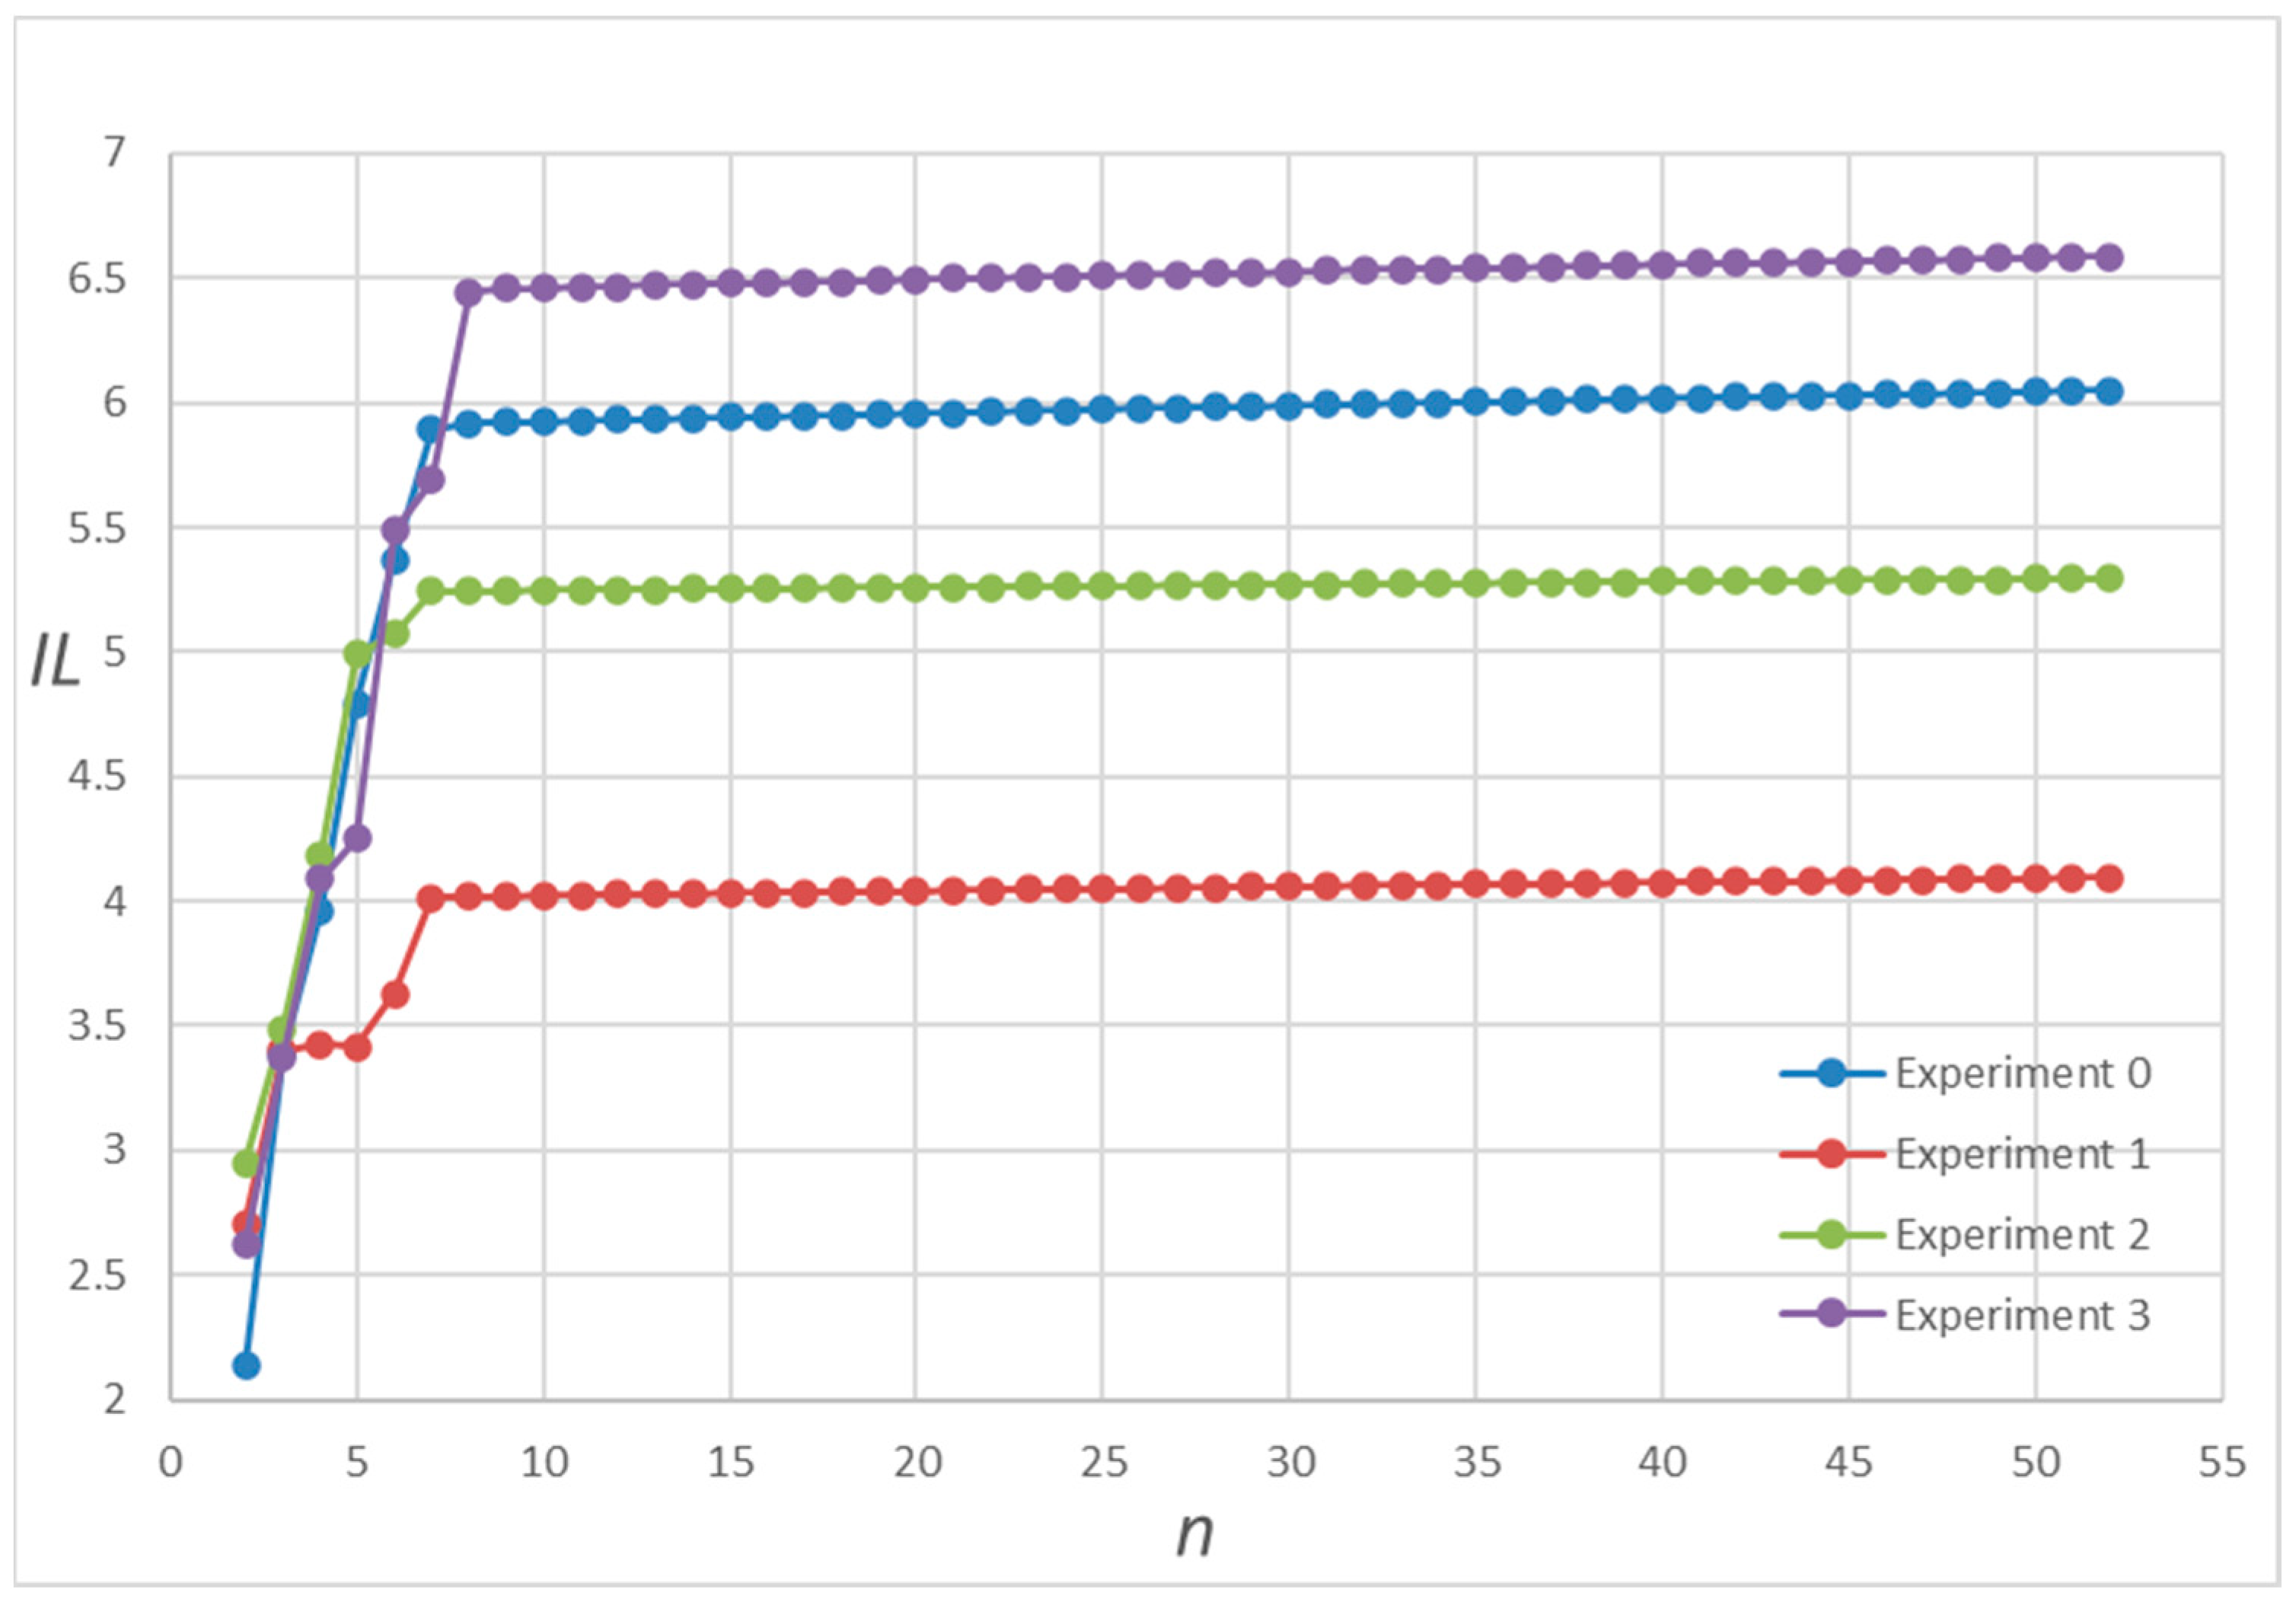
In Figure 6, we find that the reaction chain has the most information when m 1 = 4 and n 2 = 1 . We perform another 2000 random simulation experiments on the nonlinear network Model 3 (See Equation (10)), where the reaction coefficients are also randomly chosen from the uniform integer distribution in the range [1, 10], and we randomly select four random simulations to show the results in Figure 7. In Figure 7, we can find that in Model 3 (See Equation (10)), the amount of information increases with the length of the nonlinear reaction chain, and hardly changes after a certain critical length of the chain. Such a phenomenon is presented in all these 2000 random simulation experiments.
Metabolic networks need to contain multiple cascades of enzyme-catalyzed reactions, and the substrate and product of each reaction are a substrate or product of another reaction. In this case, the interdependence between these catalytic reactions will lead to a nonlinear kinetic behavior of the metabolic network.
A good example is the enzyme-catalyzed reactions in the glycogen metabolic network, where multiple cascades of enzyme-catalyzed reactions lead to the synthesis and degradation of glycogen. In addition, many other metabolic networks, such as the glucose metabolic network, the fatty acid metabolic network, and the amino acid metabolic network, also fit this condition. The enzyme-catalyzed reactions in each of these metabolic networks can be described using the above results to better understand their nonlinear kinetic behavior.

4. Conclusions

In conclusion, studying biochemical reaction networks is of great importance for understanding cellular behaviors, and the networks regulating cellular differentiation, growth, and development. Biochemical reaction networks are signaling pathways that transmit information, and the dynamic behavior of signaling molecules can generate information that can be quantified by using information length based on Fisher information. In this paper, we explore the amount of information generated via linear and nonlinear biochemical reaction networks. We find that in linear networks, the amount of information does not increase always with the length of the reaction chain; instead, the amount of information varies significantly when the number the reactant participation is not very large. When the number of reactants involved reaches a critical value, the amount of information rarely changes. This phenomenon confirms that some biochemical reaction networks are usually completed in 5–6 steps. In nonlinear networks, the change in the amount of information is not only related to the participation of reactants, but also to the combination of reaction coefficients and the change in the reaction rate.
It is worth noting that our results are novel and different from previous results, which showed that the reaction cascade can strengthen noise [53]. On the other hand, our model is simple and does not consider complex cases, such as the feedback in our model and polymerization reactions and so on. These problems will be investigated in our future works.

Author Contributions

Validation, Z.J.; Writing—review & editing, Y.-H.S.; Supervision, H.Y. All authors have read and agreed to the published version of the manuscript.

Funding

62066026: 12071408, 61563033 and 11563005 from the National Natural Science Foundation of China.

Acknowledgments

The authors gratefully acknowledge the anonymous reviewers for improving our paper. This work is supported by grants PhD program of Entrepreneurship and Innovation.

Conflicts of Interest

The authors declare no conflict of interest.

Appendix A

Table A1. Reaction rate.
ExpE0E1E2E3E4ExpE0E1E2E3E4
RateRate
k10.5940.4750.8240.9860.147k−10.7440.7480.9810.1900.304
k20.6420.1000.7570.7420.343k−20.5900.3720.7510.2290.554
k30.4810.2320.9270.6770.637k−30.6810.1830.1190.9160.573
k40.4940.2680.7200.6260.767k−40.9030.4110.4890.4200.115
k50.9670.4570.9760.5290.952k−50.4450.5850.8880.4970.522
k60.8130.4770.2770.6900.701k−60.5760.7170.9370.9470.410
k70.6110.2840.1340.8050.424k−70.9330.8900.5480.9920.894
k80.1640.1250.2080.1410.753k−80.1780.7030.1420.6870.600
k90.1180.4760.5340.7440.125k−90.8490.6030.5150.1360.346
k100.8000.2260.3750.3930.748k−100.8830.2780.9510.7260.914
k110.9810.8210.5660.4780.611k−110.8190.9710.5650.2420.260
k120.5150.3820.7710.9870.208k−120.8020.7230.2870.2550.752
k130.2060.8890.8470.1780.324k−130.6760.9050.3880.5190.716
k140.2290.1770.4230.6840.792k−140.9500.1350.6410.1980.643
k150.5700.2530.5860.9320.913k−150.4730.8900.8630.3380.255
k160.3380.1890.5350.2250.217k−160.7970.4790.7110.1620.819
k170.5110.9620.8440.1660.266k−170.6120.5800.8820.9230.742
k180.1170.7230.8730.1090.960k−180.6560.3840.4610.7350.848
k190.6510.7180.9990.3540.528k−190.6550.8510.2200.1340.986
k200.9490.1160.9880.5860.973k−200.7140.7750.8470.7530.319
k210.4240.9900.4630.7170.273k−210.4930.7730.2530.7460.575
k220.7280.3520.2270.6820.178k−220.1540.8100.5140.9030.507
k230.7000.1930.7220.5890.156k−230.7040.5030.1370.7350.333
k240.2890.9180.9190.2420.603k−240.2160.3640.1980.4220.470
k250.3840.3590.5580.7510.786k−250.4270.2170.1120.2500.260
k260.6130.1170.7640.5510.873k−260.4950.7110.3630.6970.952
k270.9900.2900.3340.8210.590k−270.1920.3390.3380.3250.469
k280.2880.5420.9200.9000.491k−280.2450.1480.3830.6620.962
k290.6880.6170.2910.8770.895k−290.3280.2320.6420.8710.562
k300.5200.6300.2280.9890.137k−300.3200.7300.6890.8780.917
k310.2430.1920.5330.2860.841k−310.1990.4730.5700.4320.786
k320.6910.7250.4560.4770.724k−320.2240.4730.9680.4830.188
k330.2770.1450.3160.7380.658k−330.4320.5820.4170.6470.954
k340.8390.6970.6560.3750.505k−340.1870.5630.5360.5820.388
k350.8540.9500.5790.9880.598k−350.1860.6280.7310.3280.351
k360.9790.9130.7920.1460.591k−360.5220.2240.7880.2000.426
k370.9790.2250.9210.3640.460k−370.6440.8270.4180.3280.612
k380.7650.4580.3630.3510.145k−380.1350.2490.1900.7790.735
k390.3550.9350.3060.7260.756k−390.2080.4130.4070.8620.120
k400.3670.7760.5010.7110.587k−400.2070.7530.4440.9480.844
k410.3860.8950.4920.5250.694k−410.4730.6610.4090.5140.497
k420.1580.7760.4380.7310.331k−420.7230.4140.6830.8730.569
k430.6100.3430.2410.2070.468k−430.3390.9060.7450.8400.970
k440.5710.4850.2730.4300.993k−440.1850.9680.9570.5850.863
k450.6180.6970.3690.1600.421k−450.9360.6600.8130.1580.571
k460.3870.2030.4840.3430.456k−460.7010.9550.8080.9820.170
k470.2190.5050.4010.1470.984k−470.7450.6210.2220.8790.417
k480.3600.4670.8510.3150.309k−480.2650.3130.8990.5810.661
k490.6280.9130.4880.3280.709k−490.1180.6160.2650.3240.798
k500.8460.1030.8490.2430.676k−500.1040.6550.6100.4910.228
k510.7100.3940.9690.1190.230k−510.3430.5740.9860.7220.170
k520.7620.8970.6670.1810.415k−520.9660.4220.9820.7670.383
Note: Data retain 3 valid digits.
Table A2. Reaction coefficients.
ExpE0E1E2E3ExpE0E1E2E3
nn
11111271949
21952283918
34693294449
44134309937
58171312827
64229324428
76862334792
83758344649
95358358295
108532361431
117638372511
129383381916
139533395233
142326408593
157572414189
168811423466
178854438389
189255443135
192814451528
206154461388
219755475854
225892486863
234791496929
241221507727
254163519434
266295525894

References

  1. Upadhyay, A.; Moss-Taylor, L.; Kim, M.J.; Ghosh, A.C.; O’Connor, M.B. TGF-β Family Signaling in Drosophila. Cold Spring Harb. Perspect. Biol. 2017, 9, a022152. [Google Scholar] [CrossRef] [PubMed]
  2. Barkai, N.; Shilo, B.Z. Robust generation and decoding of morphogen gradients. Cold Spring Harb. Perspect. Biol. 2009, 1, a001990. [Google Scholar] [CrossRef] [PubMed]
  3. Wartlick, O.; Kicheva, A.; González-Gaitán, M. Morphogen gradient formation. Cold Spring Harb. Perspect. Biol. 2009, 1, a001255. [Google Scholar] [CrossRef] [PubMed]
  4. Porcher, A.; Dostatni, N. The bicoid morphogen system. Curr. Biol. 2010, 20, R249–R254. [Google Scholar] [CrossRef]
  5. Demirkıran, G.; Kalaycı Demir, G.; Güzeliş, C. Two-dimensional polynomial type canonical relaxation oscillator model for p53 dynamics. IET Syst. Biol. 2018, 12, 138–147. [Google Scholar] [CrossRef]
  6. Cruz-Rodríguez, L.; Figueroa-Morales, N.; Mulet, R. On the role of intrinsic noise on the response of the p53-Mdm2 module. J. Stat. Mech. Theory Exp. 2015, 2015, P09015. [Google Scholar] [CrossRef]
  7. Zhang, X.P.; Liu, F.; Wang, W. Two-phase dynamics of p53 in the DNA damage response. Proc. Natl. Acad. Sci. USA 2011, 108, 8990. [Google Scholar] [CrossRef]
  8. Zhang, X.P.; Liu, F.; Cheng, Z.; Wang, W. Cell fate decision mediated by p53 pulses. Proc. Natl. Acad. Sci. USA 2009, 106, 12245–12250. [Google Scholar] [CrossRef]
  9. Zhang, J.; Chen, L.; Zhou, T. Analytical Distribution and Tunability of Noise in a Model of Promoter Progress. Biophys. J. 2012, 102, 1247–1257. [Google Scholar] [CrossRef]
  10. Zhang, J.; Zhou, T. Promoter-mediated Transcriptional Dynamics. Biophys. J. 2014, 106, 479–488. [Google Scholar] [CrossRef]
  11. Kumar, N.; Kulkarni, R.V. Constraining the complexity of promoter dynamics using fluctuations in gene expression. Phys. Biol. 2019, 17, 015001. [Google Scholar] [CrossRef] [PubMed]
  12. Thattai, M.; van Oudenaarden, A. Intrinsic Noise in Gene Regulatory Networks. Proc. Natl. Acad. Sci. USA 2001, 98, 8614–8619. [Google Scholar] [CrossRef] [PubMed]
  13. Zarubin, T.; Han, J. Activation and signaling of the p38 MAP kinase pathway. Cell Res. 2005, 15, 11–18. [Google Scholar] [CrossRef] [PubMed]
  14. Lee, J.C.; Kumar, S.; Griswold, D.E.; Underwood, D.C.; Votta, B.J.; Adams, J.L. Inhibition of p38 MAP kinase as a therapeutic strategy. Immunopharmacology 2000, 47, 185–201. [Google Scholar] [CrossRef] [PubMed]
  15. Ono, K.; Han, J. The p38 signal transduction pathway activation and function. Cell. Signal. 2000, 12, 1–13. [Google Scholar] [CrossRef]
  16. Weston, C.R.; Davis, R.J. The JNK signal transduction pathway. Curr. Opin. Cell Biol. 2007, 19, 142–149. [Google Scholar] [CrossRef]
  17. Dhanasekaran, D.N.; Reddy, E.P. JNK signaling in apoptosis. Oncogene 2008, 27, 6245–6251. [Google Scholar] [CrossRef]
  18. Song, M.S.; Salmena, L.; Pandolfi, P.P. The functions and regulation of the PTEN tumour suppressor. Nat. Rev. Mol. Cell Biol. 2012, 13, 283–296. [Google Scholar] [CrossRef]
  19. Chu, E.C.; Tarnawski, A.S. PTEN regulatory functions in tumor suppression and cell biology. Med. Sci. Monit. Int. Med. J. Exp. Clin. Res. 2004, 10, RA235–RA241. [Google Scholar]
  20. Tamura, M.; Gu, J.; Matsumoto, K.; Aota, S.-I.; Parsons, R.; Yamada, K.M. Inhibition of cell migration, spreading, and focal adhesions by tumor suppressor PTEN. Science 1998, 280, 1614–1617. [Google Scholar] [CrossRef]
  21. Fruman, D.A.; Chiu, H.; Hopkins, B.D.; Bagrodia, S.; Cantley, L.C.; Abraham, R.T. The PI3K pathway in human disease. Cell 2017, 170, 605–635. [Google Scholar] [CrossRef]
  22. Assinder, S.J.; Dong, Q.; Kovacevic, Z.; Richardson, D.R. The TGF-β, PI3K/Akt and PTEN pathways: Established and proposed biochemical integration in prostate cancer. Biochem. J. 2009, 417, 411–421. [Google Scholar]
  23. Kim, K.M.; Lee, Y.J. Amiloride augments TRAIL-induced apoptotic death by inhibiting phosphorylation of kinases and phosphatases associated with the P13K-Akt pathway. Oncogene 2005, 24, 355–366. [Google Scholar] [CrossRef]
  24. Kreisberg, J.I.; Malik, S.N.; Prihoda, T.J.; Bedolla, R.G.; Troyer, D.A.; Kreisberg, S.; Ghosh, P.M. Phosphorylation of Akt (Ser473) is an excellent predictor of poor clinical outcome in prostate cancer. Cancer Res. 2004, 64, 5232–5236. [Google Scholar] [CrossRef]
  25. Litchfield, D.W. Protein kinase CK2: Structure, regulation and role in cellular decisions of life and death. Biochem. J. 2003, 369, 1–15. [Google Scholar] [CrossRef]
  26. You, L.; Shi, J.; Shen, L.; Li, L.; Fang, C.; Yu, C.; Cheng, W.; Feng, Y.; Zhang, Y. Structural basis for transcription antitermination at bacterial intrinsic terminator. Nat. Commun. 2019, 10, 3048. [Google Scholar] [CrossRef]
  27. Bhalla, U.S.; Iyengar, R. Emergent properties of networks of biological signaling pathways. Science 1999, 283, 381–387. [Google Scholar] [CrossRef]
  28. Weng, G.; Bhalla, U.S.; Iyengar, R. Complexity in biological signaling systems. Science 1999, 284, 92–96. [Google Scholar] [CrossRef]
  29. Kolch, W.; Halasz, M.; Granovskaya, M.; Kholodenko, B.N. The dynamic control of signal transduction networks in cancer cells. Nat. Rev. Cancer 2015, 15, 515–527. [Google Scholar] [CrossRef]
  30. Cheong, R.; Rhee, A.; Wang, C.J.; Nemenman, I.; Levchenko, A. Information transduction capacity of noisy biochemical signaling networks. Science 2011, 334, 354–358. [Google Scholar] [CrossRef]
  31. Kholodenko, B.N. Cell-signalling dynamics in time and space. Nat. Rev. Mol. Cell Biol. 2006, 7, 165–176. [Google Scholar] [CrossRef] [PubMed]
  32. Purvis, J.E.; Lahav, G. Encoding and decoding cellular information through signaling dynamics. Cell 2013, 152, 945–956. [Google Scholar] [CrossRef] [PubMed]
  33. Kim, E. Information geometry, fluctuations, non-equilibrium thermodynamics, and geodesics in complex systems. Entropy 2021, 23, 1393. [Google Scholar] [CrossRef] [PubMed]
  34. Ito, S. Stochastic Thermodynamic Interpretation of Information Geometry. Phys. Rev. Lett. 2018, 121, 030605. [Google Scholar] [CrossRef]
  35. Zhang, Z.; Guan, S.; Shi, H. Information geometry in the population dynamics of bacteria. J. Stat. Mech. Theory Exp. 2020, 2020, 073501. [Google Scholar] [CrossRef]
  36. Yin, H.; Li, Q.; Wen, X. Formation of morphogen gradient based on information geometry. Int. J. Mod. Phys. B 2022, 36, 2250143. [Google Scholar] [CrossRef]
  37. Beelman, C.A.; Parker, R. Degradation of mRNA in eukaryotes. Cell 1995, 81, 179–183. [Google Scholar] [CrossRef]
  38. Schoenfelder, S.; Fraser, P. Long-range enhancer–promoter contacts in gene expression control. Nat. Rev. Genet. 2019, 20, 437–455. [Google Scholar] [CrossRef]
  39. Cover, T.M. Elements of Information Theory; John Wiley & Sons: Hoboken, NJ, USA, 1999. [Google Scholar]
  40. Braunstein, S.L.; Caves, C.M. Statistical distance and the geometry of quantum states. Phys. Rev. Lett. 1994, 72, 3439. [Google Scholar] [CrossRef]
  41. Wootters, W.K. Statistical distance and Hilbert space. Phys. Rev. D 1981, 23, 357. [Google Scholar] [CrossRef]
  42. Kim, E. Investigating information geometry in classical and quantum systems through information length. Entropy 2018, 20, 574. [Google Scholar] [CrossRef]
  43. Kim, E.; Lewis, P. Information length in quantum systems. J. Stat. Mech. Theory Exp. 2018, 2018, 043106. [Google Scholar] [CrossRef]
  44. Amari, S.; Nagaoka, H. Methods of Information Geometry; American Mathematical Society: Providence, RI, USA, 2000. [Google Scholar]
  45. Filatova, T.; Popović, N.; Grima, R. Modulation of nuclear and cytoplasmic mRNA fluctuations by time-dependent stimuli: Analytical distributions. Math. Biosci. 2022, 347, 108828. [Google Scholar] [CrossRef]
  46. Li, R.; Turaga, P.; Srivastava, A.; Chellappa, R. Differential geometric representations and algorithms for some pattern recognition and computer vision problems. Pattern Recognit. Lett. 2014, 43, 3–16. [Google Scholar] [CrossRef]
  47. Zhang, Z.; Sun, H.; Zhong, F. Natural gradient-projection algorithm for distribution control. Optim. Control. Appl. Methods 2009, 30, 495–504. [Google Scholar] [CrossRef]
  48. Duan, X.; Sun, H.; Peng, L.; Zhao, X. A natural gradient descent algorithm for the solution of discrete algebraic Lyapunov equations based on the geodesic distance. Appl. Math. Comput. 2013, 219, 9899–9905. [Google Scholar] [CrossRef]
  49. Amari, S.; Kurata, K.; Nagaoka, H. Information geometry of Boltzmann machines. IEEE Trans. Neural Netw. 1992, 3, 260–271. [Google Scholar] [CrossRef]
  50. Yang, Z.; Laaksonen, J. Principal whitened gradient for information geometry. Neural Netw. 2008, 21, 232–240. [Google Scholar] [CrossRef]
  51. Desjardins, G.; Pascanu, R.; Courville, A.; Bengio, Y. Metric-free natural gradient for joint-training of boltzmann machines. arXiv 2013, arXiv:1301.3545. [Google Scholar]
  52. Sun, K.; Nielsen, F. Relative natural gradient for learning large complex models. arXiv 2016, arXiv:1606.06069. [Google Scholar]
  53. Berezhkovskii, A.M.; Coppey, M.; Shvartsman, S.Y. Signaling gradients in cascades of two-state reaction-diffusion systems. Proc. Natl. Acad. Sci. USA 2009, 106, 1087–1092. [Google Scholar] [CrossRef] [PubMed]
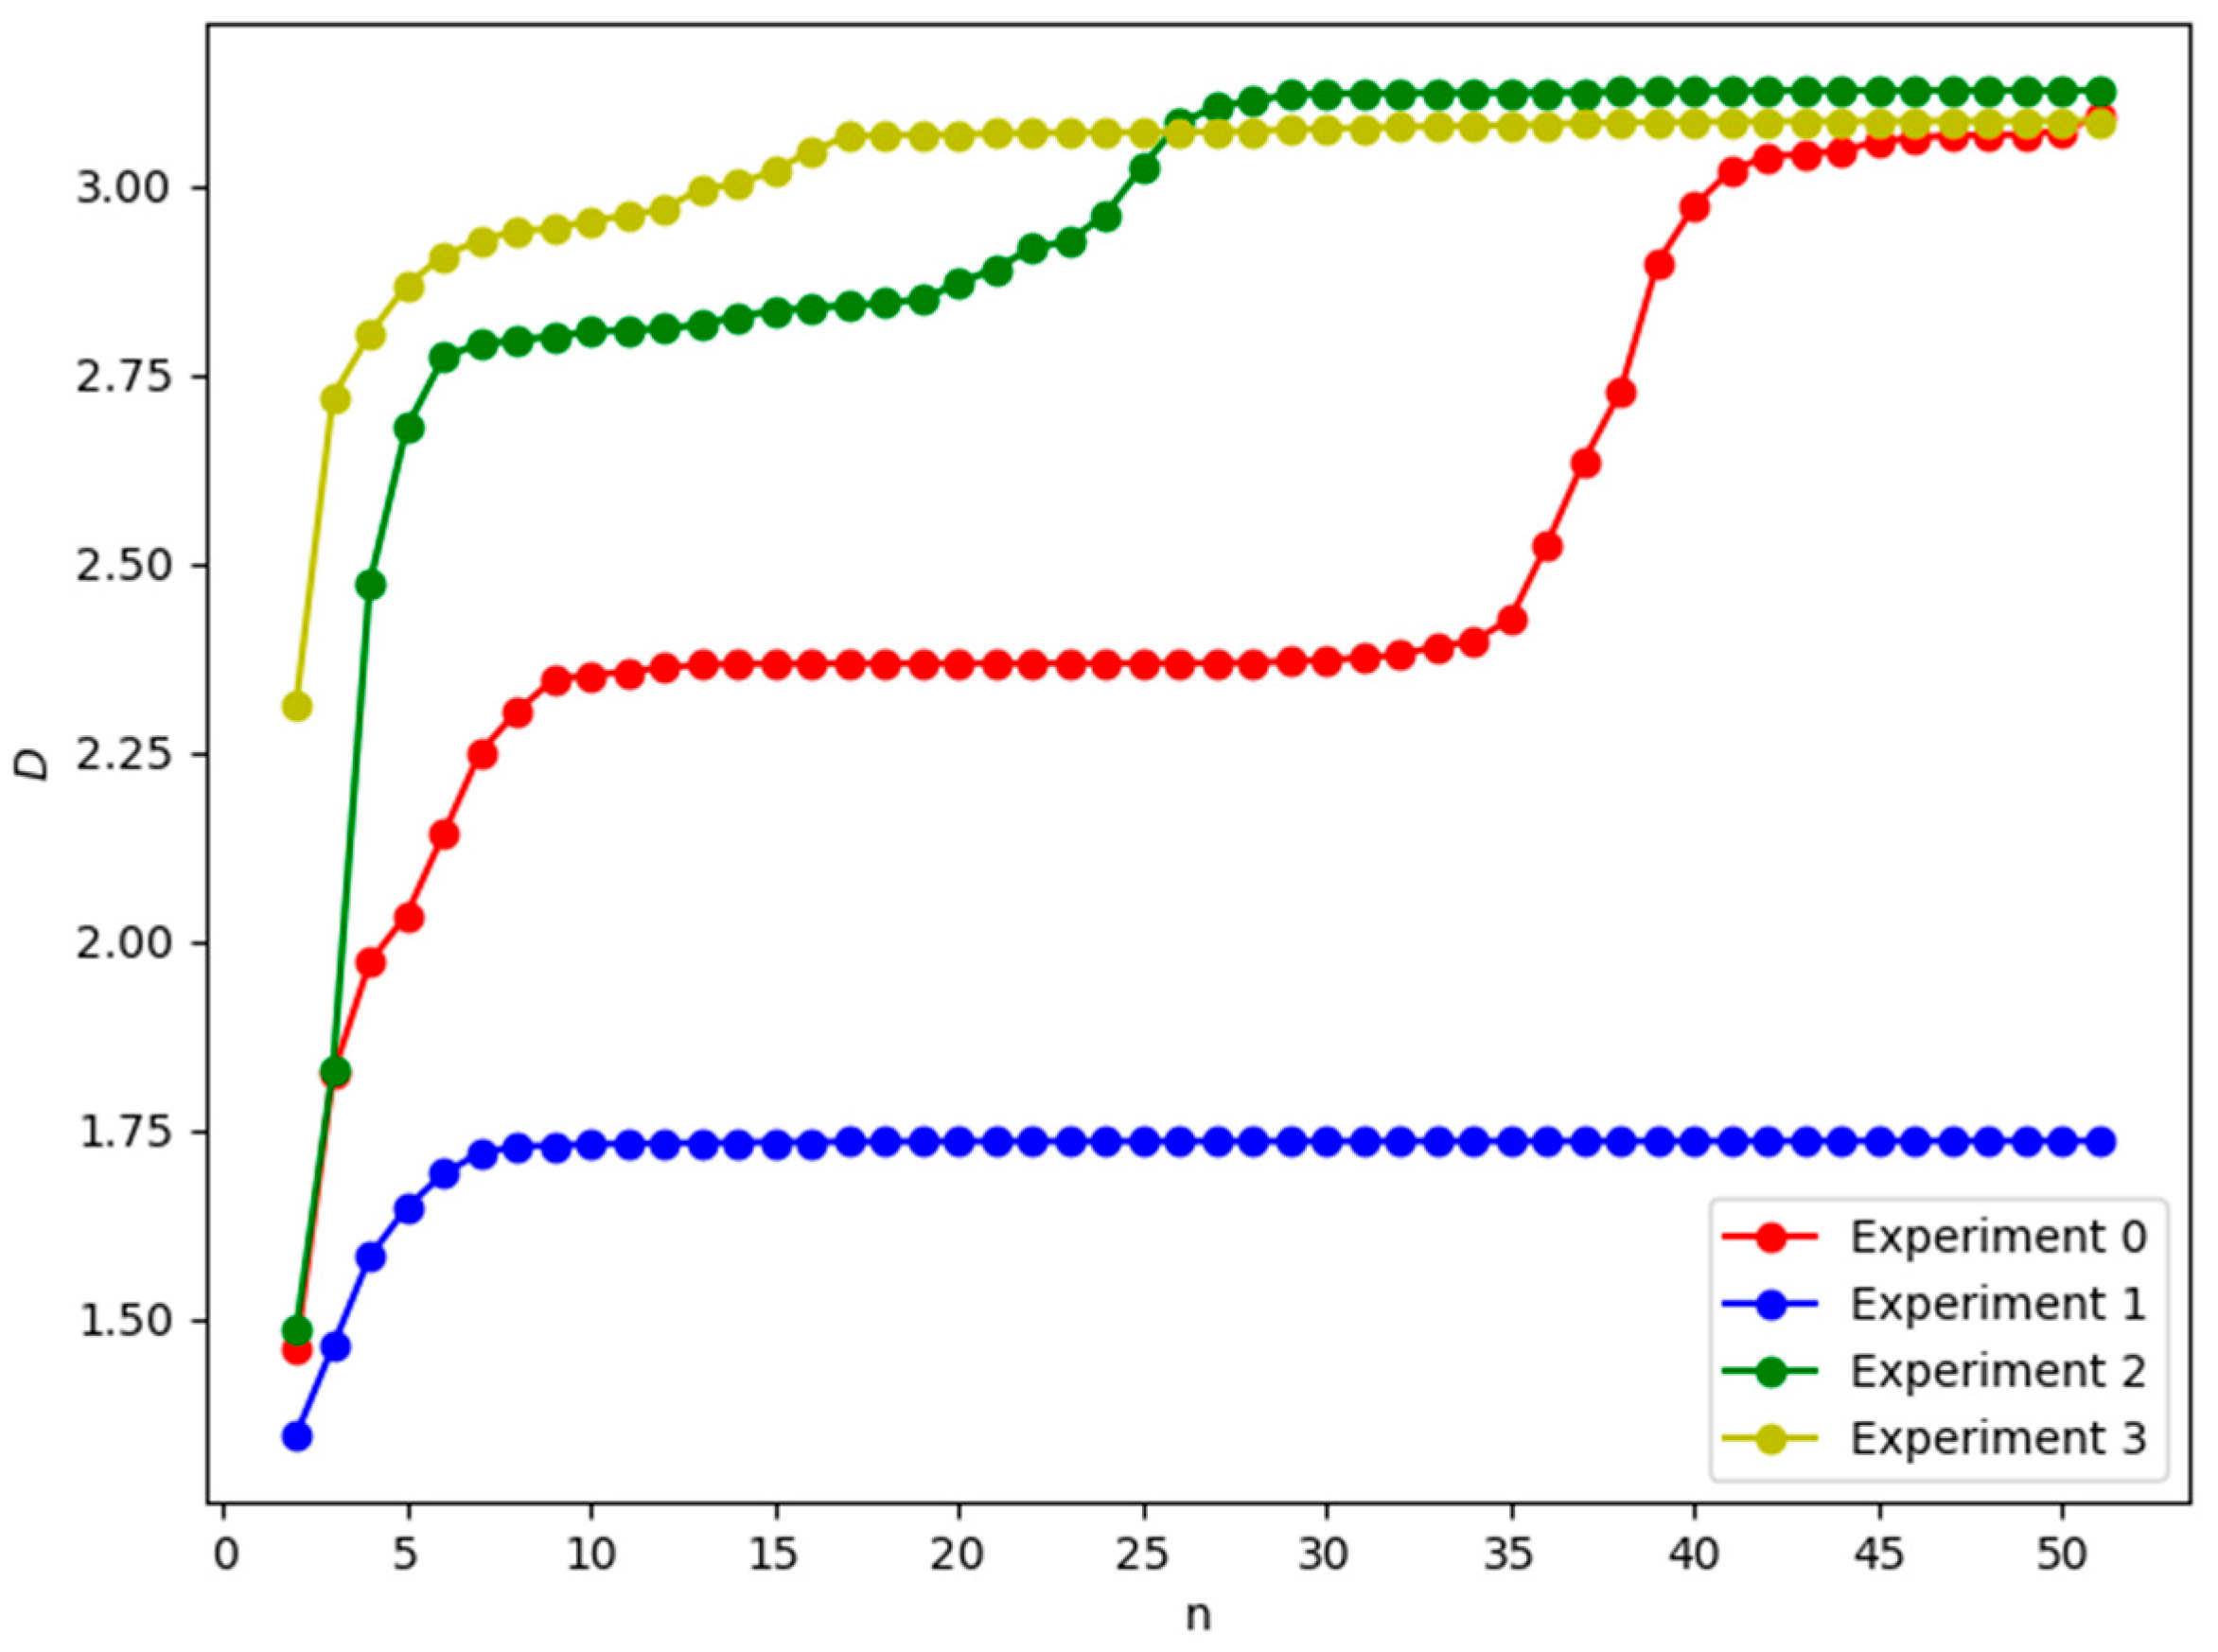
Figure 1. The geodesic of Model 2 (See Equation (6)). n indicates the number of the reaction chain in the linear network, and D indicates the geodesic curve, where the rates are shown in Table A1 in Appendix A.
Entropy 25 00887 g001
Figure 2. The amount of information of Model 2 (See Equation (6)). n represents the length of the chains in the linear network, and IL represents the amount of information.
Entropy 25 00887 g002
Figure 3. Information scatter plot of the linear biochemical Reaction Network Equation (6). n represents the length of the chains in the linear network, and IL represents the amount of information. The reactant coefficients and reaction rates for each randomized simulation experiment are shown in Table A1, in Appendix A.
Entropy 25 00887 g003
Figure 4. Statistical chart of dropping in the information in different ranges. Calculating the information amount in Model 2 (See Equation (6)) is performed for 2000 times by choosing random values from U (0.1, 1) as the reaction rates.
Entropy 25 00887 g004
Figure 5. The heat map of information. m , n are the coefficients of X 2 , X 3 reactants, and k 1 = 0.21 , k 2 = 0.32 , k 1 = 0.56 , k 2 = 0.67 . Brighter color in the diagram implies more information.
Entropy 25 00887 g005
Figure 6. The heat map of information. m 1 , n 1 are the coefficients of X 4 , X 5 reactants, and k 1 = 0.21 , k 2 = 0.32 , k 3 = 0.1 , k 4 = 0.2 , k 1 = 0.56 , k 2 = 0.67 , k 3 = 0.92 , k 4 = 0.8 . The brighter color in the diagram implies more information.
Entropy 25 00887 g006
Figure 7. Information scatter plot of the nonlinear biochemical Reaction Network (Equation (10)). n represents the length of the chains in the linear network, and IL represents the amount of information. The reactant coefficients and reaction rates for each randomized simulation experiment are shown in Table A1 and Table A2 in Appendix A.
Entropy 25 00887 g007
Disclaimer/Publisher’s Note: The statements, opinions and data contained in all publications are solely those of the individual author(s) and contributor(s) and not of MDPI and/or the editor(s). MDPI and/or the editor(s) disclaim responsibility for any injury to people or property resulting from any ideas, methods, instructions or products referred to in the content.