Article

Information-Theoretic Analysis of Cardio-Respiratory Interactions in Heart Failure Patients: Effects of Arrhythmias and Cardiac Resynchronization Therapy

1
Laboratory for Biosignals, Institute of Biophysics, Faculty of Medicine, University of Belgrade, Višegradska 26-2, 11000 Belgrade, Serbia
2
Pacemaker Center, University Clinical Center of Serbia, University of Belgrade, 11000 Belgrade, Serbia
3
Department of Engineering, University of Palermo, Viale delle Scienze, Building 9, 90128 Palermo, Italy
*
Authors to whom correspondence should be addressed.
Entropy 2023, 25(7), 1072; https://doi.org/10.3390/e25071072
Submission received: 31 May 2023 / Revised: 6 July 2023 / Accepted: 13 July 2023 / Published: 17 July 2023
(This article belongs to the Special Issue Nonlinear Dynamics in Cardiovascular Signals)

Abstract

:
The properties of cardio-respiratory coupling (CRC) are affected by various pathological conditions related to the cardiovascular and/or respiratory systems. In heart failure, one of the most common cardiac pathological conditions, the degree of CRC changes primarily depend on the type of heart-rhythm alterations. In this work, we investigated CRC in heart-failure patients, applying measures from information theory, i.e., Granger Causality (GC), Transfer Entropy (TE) and Cross Entropy (CE), to quantify the directed coupling and causality between cardiac (RR interval) and respiratory (Resp) time series. Patients were divided into three groups depending on their heart rhythm (sinus rhythm and presence of low/high number of ventricular extrasystoles) and were studied also after cardiac resynchronization therapy (CRT), distinguishing responders and non-responders to the therapy. The information-theoretic analysis of bidirectional cardio-respiratory interactions in HF patients revealed the strong effect of nonlinear components in the RR (high number of ventricular extrasystoles) and in the Resp time series (respiratory sinus arrhythmia) as well as in their causal interactions. We showed that GC as a linear model measure is not sensitive to both nonlinear components and only model free measures as TE and CE may quantify them. CRT responders mainly exhibit unchanged asymmetry in the TE values, with statistically significant dominance of the information flow from Resp to RR over the opposite flow from RR to Resp, before and after CRT. In non-responders this asymmetry was statistically significant only after CRT. Our results indicate that the success of CRT is related to corresponding information transfer between the cardiac and respiratory signal quantified at baseline measurements, which could contribute to a better selection of patients for this type of therapy.

1. Introduction

The coordination between beat-to-beat (RR) interval and respiratory signals is crucial for maintaining homeostasis in the coupled cardio-respiratory systems. In the last several years, approaches proposing unidirectional and bidirectional quantities of relationship between cardiac cycles and respiratory rhythm have been increasingly used, with potential applicability in revealing new insights in many physiological and pathological conditions [1,2,3,4,5,6,7,8,9,10].
Many of these approaches work in the so-called framework of information dynamics, which provides measures able to assess the ‘information content’ of individual dynamic processes or collections of processes, and the information exchange among them [9,11,12,13]. A dynamical approach takes into account the flow of time by investigating how much the past system history contributes to reduce the uncertainty about the present state [11]. In this context, well-established tools like Granger Causality (GC) and Transfer Entropy (TE) assess pairwise directional interactions between two subsystems of a complex system, quantifying the directed flow of information from one subsystem to another [14,15,16,17]. On the other hand, measures of cross-predictability like cross-entropy (CE) quantify how much one process can be predicted from the other, returning asymmetric measures of coupling without implementing the Granger concept of causality [18]. All these measures have been widely applied in physiological contexts, e.g., for investigating cardiovascular variability [19,20], but also for studying cardiorespiratory interactions in healthy subjects [11] or in patients suffering of various types of sleep apnea [9].
In previous works, we investigated cardio-respiratory interactions in heart-failure patients using unidirectional markers and bidirectional markers based on linear models at baseline measurements [6,21]. The potential of the information-theoretic approaches described above has still not been tested for evaluating the effects of cardiac resynchronization therapy (CRT) in heart failure (HF). CRT has been used for more than 20 years in the treatment of symptomatic patients with heart failure with reduced left ventricular ejection fraction (LVEF) and abnormal QRS duration and morphology [22,23]. CRT leads to restoration of electromechanical synchrony, resulting in an improvement in the cardiac pump function, ejection fraction and reverse remodeling of the left ventricle. In most patients, these mechanical effects are associated with an improvement in the functional capacity and with a reduction in morbidity and mortality [24]. Nowadays, we know that, in addition to restoring ventricular mechanical synchronization, there are various cardiac and extra-cardiac effects of CRT, which are also responsible for its beneficial outcomes. One such effect is the remodeling of β-adrenergic signaling pathways and the restoration of sympathovagal balance [25]. The effect of CRT on cholinergic signaling has not been fully investigated in the literature yet, nor has the significance of CRT-induced neurohumoral modulation and its influence on cardio-respiratory interactions in these patients [26]. In recent years, significant advancements have been made in patient selection, implantation approaches, implant material performances, post-implantation device programming and medical therapy optimization. However, still a third of patients do not achieve the expected benefit from CRT implantation [27]. Therefore, it is very important—but also challenging—to use new approaches in the analysis of heart-failure patients who are candidates for CRT implantation, to preoperatively separate future responders from non-responders, according to parameters that have not yet been used. In this context, parameters that define autonomic function and cardio-respiratory interactions can certainly be of great importance.
In this work, we evaluate the cardio-respiratory interactions in terms of information flows between the coupled RR and respiratory signal dynamics. We used both the linear parametric and the nonlinear model-free implementations of the concept of Granger causality provided by GC and TE measures, as well as cross entropy, to investigate asymmetric coupling on different HF CRT responders and non-responders.

2. Materials and Methods

2.1. Subjects and Experimental Protocol

The data analyzed in this study consist in part of the raw data obtained from previously recruited patients with heart failure (reduced left ventricular ejection fraction, LVEF < 35%), and indication for CRT device implantation published in our previous work where the pool of results from all patients were analyzed together [21]. The study was approved by the Ethics Committee of the Faculty of Medicine the University of Belgrade, and each subject signed an informed consent form (Approve Date: 17 March 2017, Ref. Numb.29/III-4). Since the techniques applied in this work are sensitive to the type of heart rhythm, we excluded data from 8 patients (2 responders to CRT) with permanent atrial fibrillation from the group of 47 heart-failure patients. The main reason is that, since the cardiac rhythm in atrial fibrillation is highly irregular, the corresponding data would not satisfy stationarity criteria needed for our analysis; moreover, we have previously shown that the influence of respiration on cardiac rhythm and in the opposite direction is very small in patients with atrial fibrillation [6]. Contrary to our previous study [21] where we did not separate groups by arrhythmias, in this study we examined the effects of a low and high number of VESs on cardio-respiratory coupling before and after CRT. For this study, we divided the analyzed 39 HF patients into 3 groups: a first group of 14 patients with sinus rhythm (HFSin), a second group of 11 patients with a low number (<6) of ventricular extrasystoles (HFVES1), and a third group of 14 patients with 6 and more ventricular extrasystoles (HFVES2). Measurements were performed before (baseline) and approximately 9 months after CRT device implantation (follow-up). After follow-up, patients were divided into two groups, i.e., responders (N = 25) and non-responders (N = 14), in relation to the response to CRT, which was assessed according to changes in certain clinical and echocardiographic parameters. We defined an echocardiographic responder to CRT as a patient with increased left ventricular EF by 5% or more, and functional (clinical) who improved at least one class category in the New York Heart Association functional classification and/or the six-minute walk test by at least 10% at follow-up. In this study, a responder to resynchronization therapy had to meet both echocardiographic and functional criteria. Both baseline and follow-up experiments were conducted in the morning, between 7 and 8 a.m., in a quiet room surrounding at the Pacemaker Center of the University Clinical Center of Serbia. Baseline measurements were carried out immediately before device implantation. Data were acquired from 20 min of electrocardiographic (ECG) and respiratory (Resp)-signal measurements of relaxed subjects in the supine position and at a spontaneous breathing frequency by the Biopac MP100 system and AcqKnowledge 3.9.1 software (BIOPAC System, Inc., Santa Barbara, CA, USA) using a sampling rate equal to 1 kHz [21]. ECG data were acquired using the ECG 100C electrocardiogram amplifier module, while an RSP 100C respiratory pneumogram amplifier module with TSD 201 transducer attached to the belt (using an adjustable nylon strap) was used to measure abdominal expansion and contraction. The interbeat interval (i.e., ECG RR intervals) time series in patients with sinus rhythm and sinus rhythm with ventricular extrasystoles were analyzed. Interbeat (RR) intervals and interbreath (BB) intervals were extracted from signals recorded using the tool Pick Peaks from OriginPro 8.6 (OriginLab Corporation, Northampton, MA, USA). In the ECG with ventricular extrasystoles (VES), we used the time coordinate of the peak from VES as R peak coordinate for the subsequent analyses.
The first analysis consisted in evaluating the changes in RR and BB intervals by computing their mean and standard error. Furthermore, given that the RR and respiration samples obtained in this way were unequally positioned, an equal equidistant resampling of both series was carried out using the mean RR value of each individual as the resampling interval. The resampling procedure was performed via linear interpolation between two corresponding adjacent existing samples [3]. In this way, the resampling frequency was different for each subject, and fell within the range (0.8–1.5) Hz. The final analyzed RR and Resp time series were measured from signal lasting 20 min, resulting in a different numbers of samples according to the individually varying resampling frequency (Table 1).

2.2. Information-Theoretic Measures and Data Analysis

For the analysis of RR and BB intervals, we computed the mean and standard error taking into account HFSin, HFVES1, HFVES2 groups, both at baseline and at follow-up for both responders and non-responders to CRT. Then, to investigate the dynamics of coupling and causality within the cardio-respiratory system, the information-theoretic measures of GC, TE and CE were computed on the RR and Resp time series.
These measures are defined, in the context of dynamic systems mapped by random processes, considering a bivariate random process S = X , Y composed of two interacting processes X and Y, respectively, considered as the driver and target process. In this context, the concept of Granger causality from X to Y is formalized through the measure of Transfer Entropy, which quantifies the information that the past states of driver process, X n = [ X n 1 , X n 2 , ] , transfer to the present state of the target process, Y n , when the past states of the target itself, Y n = [ Y n 1 , Y n 2 , ] , are known. The TE is defined as:
T E X Y = I Y n ; X n Y n
where I Y n ; X n Y n is the conditional mutual information. On the other hand, the predictability of the present state of the target process Y n from the past states of the driver process X n is quantified through the cross entropy defined as:
C E X Y = I Y n ; X n
where I Y n ; X n is the mutual information.
In addition to the standard definitions given in (1) and (2), when assessing influences within physiological systems, it may be important to take into account the so-called instantaneous effects, i.e., the influence that the current state of driver process X n can have on the target state Y n [28,29]. To this end, the definitions of TE and CE can be modified as follows [28]:
i T E X Y = I Y n ; X n , X n Y n
i C E X Y = I Y n ; X n , X n
The so-called instantaneous TE and instantaneous CE defined in (3) and (4) are used when the instantaneous effects are deemed as physiologically relevant, i.e., in the direction from Resp to RR but not in the direction from RR to Resp.
In this work, the above presented measures were implemented in practice using both a linear model-based and a non-linear model-free estimator. The first approach makes use of linear regression models whereby the present state of the target process Y n is described as a linear combination of its p past states, Y n p = [ Y n 1 , , Y n p ] , or of the p past states of both processes, [ X n p , Y n p ] . These linear regression models return prediction errors, or residuals, whose variance can be related to the concept of conditional entropy under the assumption of Gaussianity and can be exploited to provide a measure of predictability improvement related to the TE [11]. Specifically, denoted as σ Y n Y n p 2 , and σ Y n X n p , Y n p 2 the prediction error variances of the two regression models, the measure of GC was computed as [30]
G C X Y = ln σ Y n Y n p 2 σ Y n X n p , Y n p 2
Moreover, an extended measure of GC incorporating the instantaneous effect from X to Y and denoted as i G C X Y was computed, augmenting the vector X n p with the inclusion of X n in (5) [31].
The second method is a model-free approach that makes use of nearest-neighbors to compute the probability density functions needed for the estimation of entropy measures [32]. Here, we used the formulation reported in [33] which performs, for each pattern forming a realization of the present and past states of the analyzed processes, the search for its k nearest neighbors to compute the entropy in the highest-dimensional space, and then adopts a distance-projection strategy to compute the entropies in the spaces of lower dimension. The resulting estimator has the form (see [34] for details)
T E X Y = ψ k + ψ N Y n q + 1 ψ N Y n Y n q + 1 ψ N X n q Y n q + 1
where ψ is the digamma function, k is the number of neighbors considered in the highest dimensional space, ε n , k is twice the distance of the n-th reference pattern y n , y n q , x n q to its k th neighbor in the highest dimensional space, and N X n q Y n q , N Y n Y n q and N Y n q are the number of patterns whose distance from the projected reference pattern ( ( y n q , x n q ), ( y n , y n q ) and y n q , respectively) is lower than ε n , k / 2 . A similar treatment leads to estimating the cross entropy measure as:
C E X Y = ψ k + ψ N ψ ( N Y n + 1 ) + ψ N X n q + 1
where N is the number of available patterns and the other symbols have the same meaning as in (6) (thus N X n q and N Y n are the number of patterns whose distance from the projected x n q and y n is lower than ε n , k / 2 ). As for the linear estimation of GC, extended measures of TE and CE were also obtained augmenting the vector X n q with the inclusion of X n in (6) and (7) when the instantaneous effect from X to Y was deemed as causally relevant.
In the analyzed dataset, the measures defined above were computed along the two directions of interaction from Resp to RR and from RR to Resp, to analyze closed-loop bidirectional cardiorespiratory interactions. Given the adopted measurement convention, the heartbeat cannot transfer information at zero-lag to the respiratory system, since the i-th breath sample is simultaneous with the onset of the i-th cardiac period. Therefore, the standard measures of GC, TE and CE given in (5)–(7) computed without incorporating the instantaneous effect were used when X = RR and Y = Resp, while the extended measures in which the vector of the past driver states is augmented with the present driver state were used when X = Resp and Y = RR.
With regard to GC computation, the model order p was set according to the Akaike information criterion (AIC), taking care to consider the present state of the driver in defining the model in the direction of analysis from Resp to RR. Even if the choice of the model order can influence the value of the achieved information measures and thus their physiological significance, in this work a sufficiently high value was selected in order to have enough ‘memory’ of the two processes involved in the interaction [34].
Regarding the non-linear implementation of CE and TE measures, the number of neighbors k was fixed to 10 and the number of considered past states q to 2, as commonly performed in the literature in the field [35].

2.3. Statistical Analysis

In order to assess the statistical significance of the differences of the various indexes between groups and conditions, we employed nonparametric tests. For each measure, the distributions of the results were tested against normality through a Shapiro–Wilk test and since the most of the measures did not follow a normal distribution, we performed nonparametric tests for their comparison.
We performed the Wilcoxon test to compare the mean values of sample numbers in each group before and after CRT, and the Mann–Whitney U test to compare CRT groups in each condition. The Kruskal–Wallis H test was applied to compare the mean values among the HF groups (HFSin, HFVES1 and HFVES2) in each condition (Table 1).
For RR and BB intervals analyses we tested (1) the baseline versus follow-up condition using the Wilcoxon test for each HF group, and the CRT group; (2) responders versus non-responders performing the Mann–Whitney U test in both conditions; and (3) differences between the HF groups, before and after CRT, using also the Mann–Whitney U test (n = 3: HFSin vs. HFVES1, HFSin vs. HFVES2, and HFVES1 vs. HFVES2), Table 2.
For information-theoretic measures, the following statistical analyses were performed in HF groups and in CRT groups separately. We used the Mann–Whitney U test to compare groups at baseline and at follow-up measurements. In each group, significant differences between bidirectional measures distributions were recognized by a Wilcoxon non-parametric pairwise test. For comparison of these parameters between baseline and follow-up measurements, we also used a Wilcoxon test.
For all analyses, probability values p < 0.05 were considered statistically significant. Statistical analyses were carried out in SPSS (SPSS Inc., Chicago, IL, USA) version 17.

3. Results

In Table 2, the analysis of RR intervals and BB intervals in the analyzed groups is shown, with regard to descriptive statistics measures (mean and standard error). Responders to CRT exhibited statistically significantly prolonged RR intervals (p = 0.028) and BB intervals (p = 0.014) compared to baseline, while non-responders did not change these markers (p > 0.05). Also, there was no difference between the responder and non-responder groups, except for BB intervals at follow-up measurements (p = 0.013).
Figure 1, Figure 2 and Figure 3 present, as bar graphs, the results obtained with regard to linear and nonlinear measures of GC, TE, and CE computed along the two directions of interaction from Resp to RR and from RR to Resp. There was a tendency for GC(Resp-RR) to be higher than GC(RR-Resp) in all patients at baseline condition, but only after CRT device implantation in the HFSin and HFVES2 group the difference was statistically significant, with p < 0.05 (Figure 1).
Moreover, compared with the baseline measurement, in the group of HFSin patients, CRT showed significantly decreased GC(RR-Resp), p = 0.048 (not shown in Figure 1), resulting in a significant difference between GC(Resp-RR) and GC(RR-Resp) (p < 0.05) (Figure 1B). In the group of HFVES1 patients, there was no statistically significant difference between GC in both measurements (Figure 1).
In Table 3, the results of the comparisons between coupling and causality measures computed in the HF groups at baseline and at follow-up measurements are presented. Linear Granger causality measures were sensitive to a higher number of VESs and at baseline measurements they significantly decreased with the number of VESs in both directions. After CRT implementation, a statistically significant difference was found in GC(Resp-RR) between the HFSin patients’ group and the two other groups and in GC(RR-Resp) between the HFSin and the HFVES2 group.
Figure 2 shows the measures of TE computed along the two directions of interaction between Resp and RR. A statistically significant difference between TE(Resp-RR) and TE(RR-Resp) in the HFSin and HFVES2 groups of patients was present at the baseline and was maintained after CRT implantation (p < 0.01), also showing a tendency to become more marked. Only in the HFVES1 group, TE(Resp-RR) was not significantly greater than TE(RR-Resp). In the comparison between groups at the baseline measurement, we found a statistically significant difference in TE(RR-Resp) between groups of patients with VES (Table 3). CRT influenced TE(RR-Resp) in the HFSin and HFVES1 group with decreasing values but only towards to the tendency of statistical significance (p = 0.08) and (p = 0.12).
Contrary to GC and TE, where RR to Resp measures were lower than Resp to RR measures, CE(RR-Resp) were higher than CE(Resp-RR) in all analyzed groups (Figure 3). Statistically significant differences were preserved only in HFSin group during both baseline and follow-up. In the other two groups, statistically significant differences were reported only after CRT implantation. Comparison between groups did not reveal any statistically significant difference in CE measures.
Figure 4 presents the results of the comparison between baseline and follow-up markers and between the two directions, in both groups of responders and non-responders. In the group of CRT responders, the two GC measures did not change after CRT, while in the group of non-responders, follow-up measurements indicated a reduction in GC(RR-Resp). In this group, although unchanged, GC(Resp-RR) became significantly higher than GC(RR-Resp) after the follow-up measurement. Further, TE(Resp-RR) was significantly higher than TE(RR-Resp) in both baseline and follow-up measurements in responders, and in non-responders only after follow-up measurement. Contrary, CE(Resp-RR) was significantly lower than CE(RR-Resp) in both measurements in responders and in non-responders only after follow-up measurement. No significant differences between directed measures for any measure were found at baseline in non-responders while significant differences were obtained for all information-theoretic measures at baseline in the group of CRT responders.

4. Discussion

4.1. Heart Rate and Respiratory Rate

The analysis of the mean heart and respiratory rates confirms the results from previous works, and here it is complemented with a dynamic analysis of the variability of RR and BB intervals [6]. The results of our research indicate that in patients with heart failure, resting heart and respiratory rates are the highest in patients with a large number of ventricular extrasystoles before CRT. When we separately analyze CRT responders and non-responders, we observe that during follow-up there is a decrease in heart rate in all HF patients, but that it is statistically significant only in CRT responders. The reasons for this result are related to the intensification of antiarrhythmic therapy in all patients after CRT implantation, as well as to the improvement in clinical status and the recovery of vagal tone, which dominantly determines this parameter, in patients who benefited from device implantation [36,37].
Respiratory rate also significantly decreases in CRT responders during follow-up, but increases slightly in non-responders, resulting in a statistically significant difference in the values of this parameter between these two groups at control examination. An improvement in cardiac function enables better perfusion, i.e., a reduction in tissue hypoxia, which leads to reduction in chemoreceptor stimulation, and this can explain the decrease in respiratory rate in CRT responders [38]. Our results also confirm that better functional capacity, according to the NYHA (New York Heart Association) classification of HF, and higher LVEF, are associated with lower respiratory frequency [39].

4.2. Granger Causality and Transfer Entropy
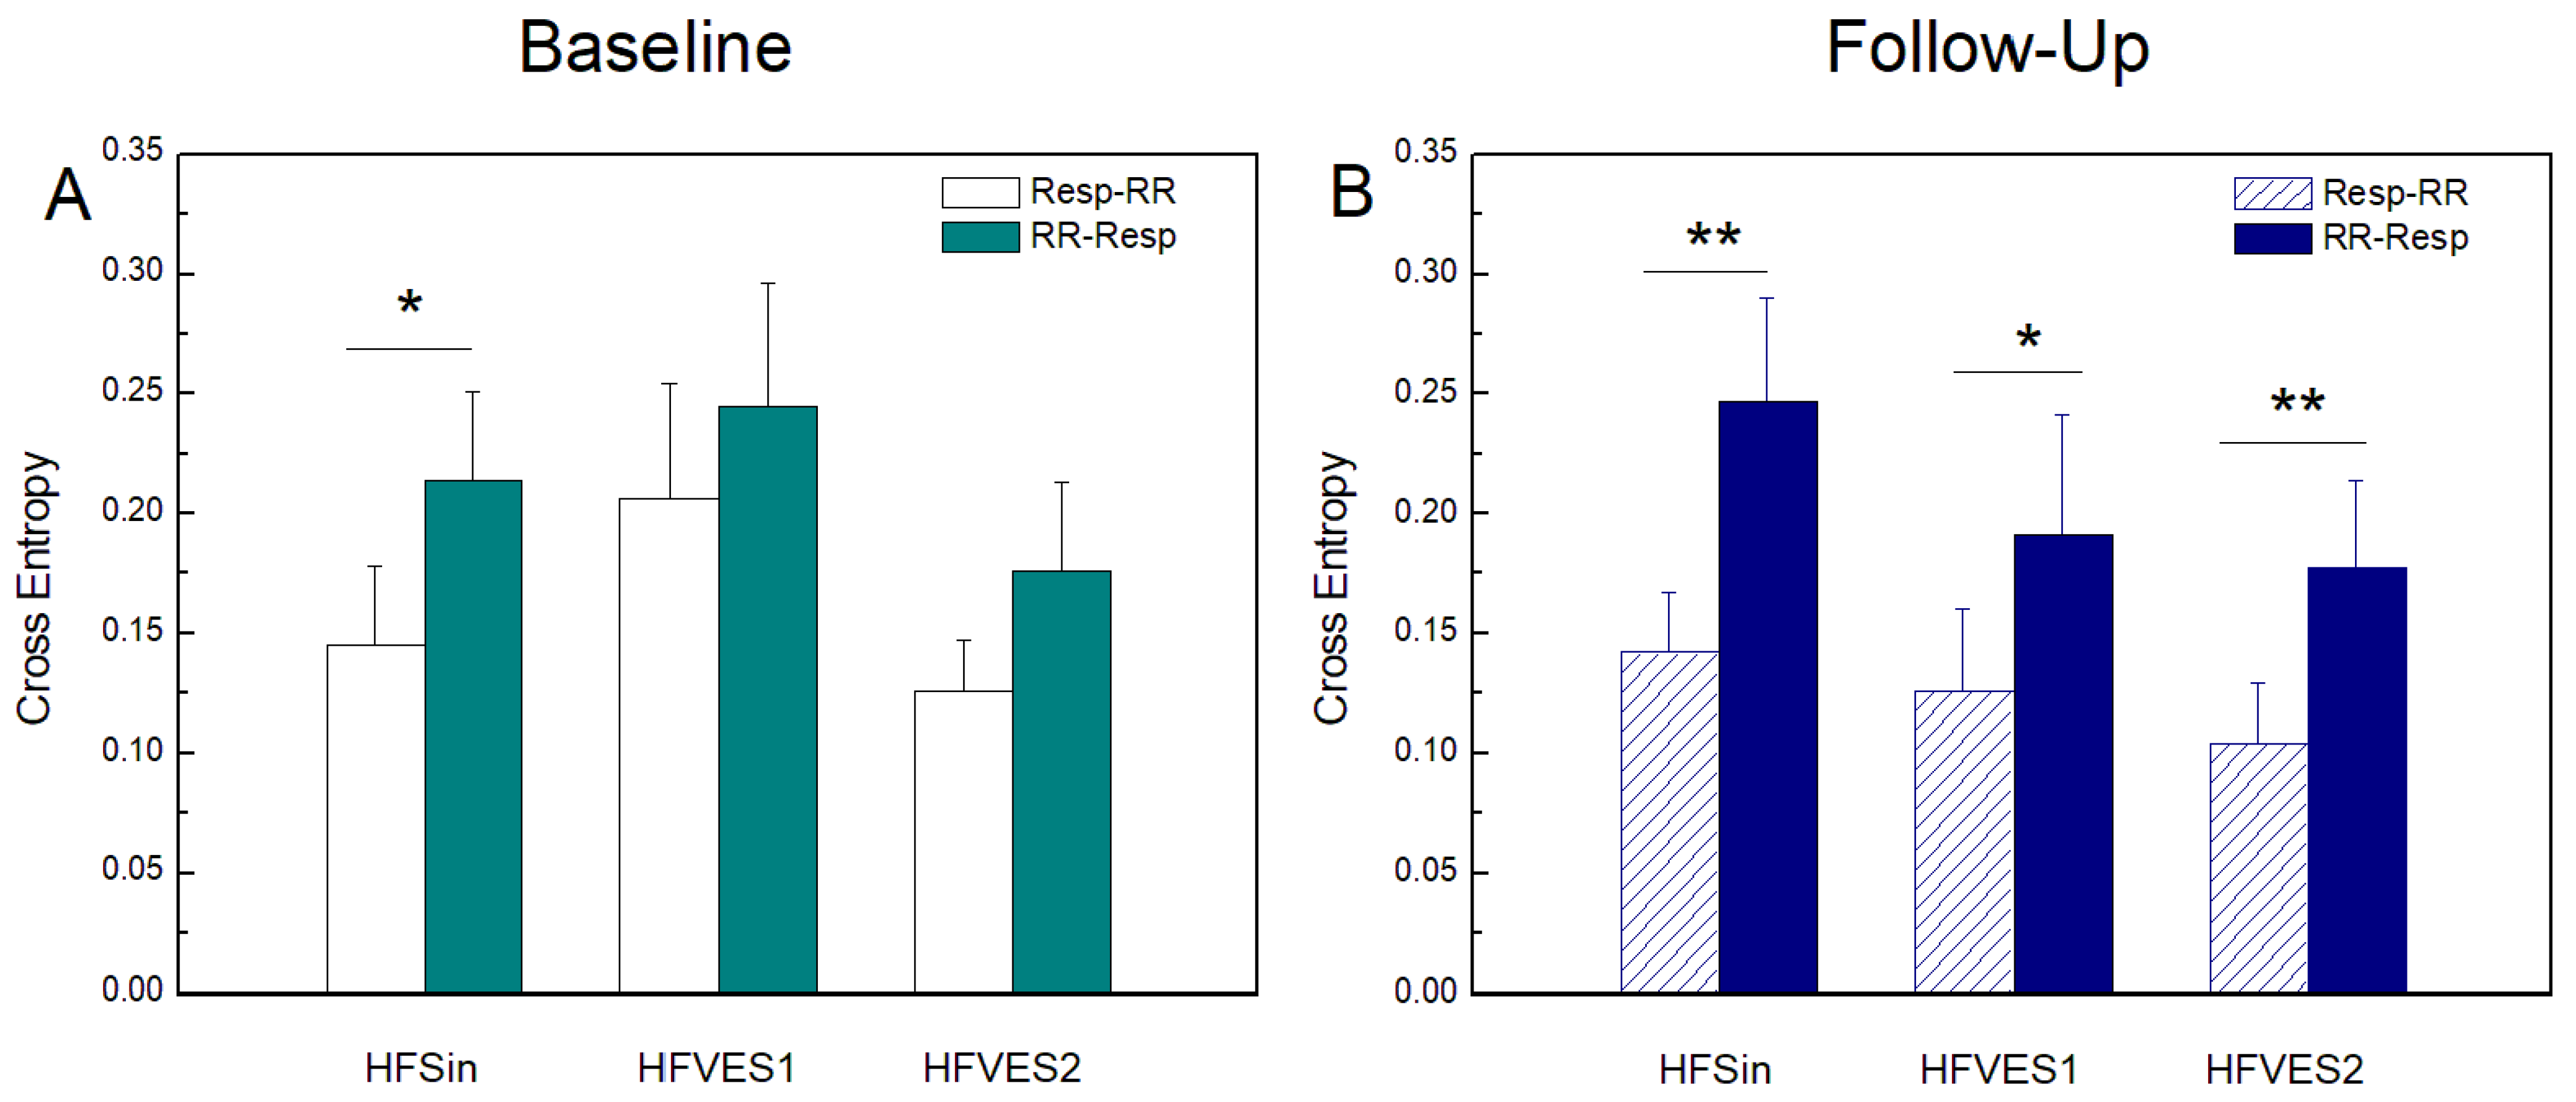
In this study the model-based Granger causality analysis showed a stronger influence of respiration on heart rhythm in all HF patients. The reasons for small discrepancies in GC analysis comparing these results and the findings reported in our previous study in the HF groups are probably methodological, since we used a different GC algorithm in the last paper [40]. In addition, the groups with VES were not equally defined: in our previous work, the HFVES group was defined by more than 20 premature ventricular ectopic beats during signal recording [6]. According to Granger causal analyses, such as the GC measure (model-based) and the TE measure (model-free), it is expected that respiration would have a stronger impact on the heart rate than vice versa. This result can be documented in healthy subjects and describes the well-known phenomenon of respiratory sinus arrhythmia (RSA) whereby Resp changes modulate the heart period duration differently during inspiration than during expiration. Our results, for the HF patients in sinus rhythm, document this effect only when the TE was used (Figure 2A), but not using the GC (Figure 1A), suggesting that RSA mechanisms are nonlinear and cannot be fully captured using the linear GC analysis.
Furthermore, the GC decreased progressively from sinus rhythm to the HFVES1 and the HFVES2 group during baseline (Figure 1A), while the TE did not show an evident similar trend (Figure 2A). This suggests that in HF patients, the cardiorespiratory interactions evaluated in the presence of extrasystoles have a strong nonlinear component which can be properly captured only when TE is estimated.
A similar influence of cardiac rhythm on respiration and vice versa in the HFVES1 group at the control recording is difficult to interpret. The effect of respiration on cardiac rhythm is determined by various factors even under physiological conditions. For instance, it has been shown that this influence loses its importance in the elderly, i.e., the strength of direct respiratory modulation of cardiac rhythm decreases with aging, as well as the indirect effects of respiration on heart rate due to the reduction in baroreflex sensitivity [41,42,43,44]. When autonomic imbalance occurs (as in HF), this bidirectional interaction is certainly altered, with the activation of compensatory mechanisms that are still poorly understood. In the previous paper [6], we presented the assumption that the stronger influence of the heart rhythm on the respiratory signal in patients with HF and VES is due to compensatory mechanisms that restore the regularity of the heart rhythm and increase its influence on breathing. However, after this study, it is clear that the frequency of extrasystoles, as well as possible other factors such as the HF stage or age, have an impact on bidirectional cardio-respiratory interactions. On the other hand, we observed that during follow-up, the influence of breathing on heart rhythm significantly weakened in patients with a low number of VESs, thus demonstrating a stronger influence of the cardiac rhythm on the respiratory signal in the HFVES1 group.
Regarding the TE values in HFVES patients, we noticed that causality along the direction from the RR to Resp in the follow up measurements was not sensitive to the higher frequency of extrasystoles, as it was in baseline recordings (Table 3). On the other hand, the prevalence of the causal interaction along the direction Resp to RR becomes much more marked after CRT, and this was detected using both GC and TE (Figure 1B and Figure 2B). This suggests that resynchronization therapy is successful in restoring RSA in HF patients, activating both the linear and nonlinear components of the interaction from Resp to RR. The recovery of vagal tone and baroreceptor activity is responsible for strengthening the effect of respiration on cardiac rhythm, i.e., that intense cardiorespiratory interaction in this direction is a confirmation of the existence of the balanced activity of control and compensatory mechanisms. This result also implies that with the restoration of Resp on RR, we can detect the joined mechanism of the reduced linear component of cardiac causality from RR on restored Resp (Figure 1A,B).

4.3. Cross Entropy

The opposite trends exhibited by CE if compared to GC and TE reflect a prevalence of the coupling in the direction RR to Resp, amplified after CRT (Figure 3). The reason for this difference is very likely methodological: while GC and TE quantify directed interactions in terms of predictability improvement, the CE implements the concept of cross-predictability. From this point of view, the CE is more similar to measures like convergent cross-mapping, which attempt to infer the dominant causation in a bidirectional interaction by predicting the driver starting from the history of the target process [45]. Therefore, according to this methodological consideration, it is not surprising that a predominant Resp to RR mechanism produces a higher GC/TE from Resp to RR but also higher CE from RR to Resp.
The values of CE(Resp-RR) and CE(RR-Resp) were not significantly different between the groups at any of the measurements, and both parameters had the largest preoperative values in the HFVES1 group, and at control recording in the HFSin group. This suggests that in cardiorespiratory coupling, the prediction of the dynamics of one signal based solely on the history of the other is stable in time and that the presence of arrhythmias does not significantly affect it.
Our finding that in HF patients, cardio-respiratory interactions assessed in the presence of ventricular extrasystoles have a strong nonlinear component that can only be properly captured when using TE, was confirmed by the results of model-free CE, which did not exhibit any particular trends, and after the resynchronization therapy clearly differentiated the two directions of interaction even in presence of extrasystoles. Transfer entropy, in addition to confirming that the occurrence of ventricular extrasystoles significantly affects the interactions of the respiratory and cardiovascular system, also indicates that their frequency decisively determines the intensity of information flow between these systems. What compensatory mechanisms and at what levels of regulation of physiological processes trigger the occurrence of ventricular extrasystoles, and what are the causes of their pronounced dynamics during monitoring, as well as in relation to the extra beats frequency, remain to be determined by future research.

4.4. Cardiac Resynchronization Therapy

The results of the comparative analysis of CRT responders and non-responders provide useful insights about the reaction of patients to therapy. At the baseline measurement, no significant differences between these two groups were reported with regard to Granger causality analysis, with a stronger influence of respiration on heart rhythm in both groups of patients at the control examination in the case of the model-free approach (Figure 4C,D) and only for non-responders with the linear measure (Figure 4B).
Moreover, it is noteworthy that the nonlinear measure of causality is able to identify the prevalence of causality from respiration to cardiac activity in the baseline condition for responders to CRT (Figure 4C). This finding may suggest that if there is a statistically significant difference between TE parameters in a patient who is a candidate for CRT, he/she will benefit from device implantation. However, this would be too bold and probably a wrong conclusion, given that in CRT non-responders, the difference between these parameters preoperatively is close to statistical significance, and is achieved at the follow-up examination.
The values of both CE parameters were lower in CRT responders compared to non-responders for all the measurements. During follow-up, statistically significantly higher values of CE(RR-Resp) compared to CE(Resp-RR) were observed in CRT responders and non-responders.
It is also very interesting to observe changes in the intensity of the information flow in different directions in CRT non-responders. In fact, the TE(Resp-RR) increase in patients with significantly reduced vagal tone is an indicator that the values of RSA, which is a measure of cardiorespiratory interaction, and CE(Resp-RR), which is a measure of cardio-respiratory coupling, do not necessarily follow each other, and this is emphasized in some previous works [46].

5. Conclusions

Information-theoretic analysis of bidirectional cardio-respiratory interactions revealed the strong effect of nonlinear components in the RR and Resp time series, as well as in their causal interaction in evaluation of cardiac resynchronization therapy in HF patients.
Our results, for the HF patients in sinus rhythm, document the RSA effect only when using the TE but not GC. On the other hand, the prevalence of the causal interaction along the direction from Resp to RR becomes much more marked after CRT, and this was detected using both GC and TE, which suggests that the resynchronization therapy is successful in restoring RSA in HFSin patients, activating both the linear and nonlinear components of the interaction from Resp to RR. Regarding the CE, it exhibits opposite trends of GC and TE, showing prevalence of coupling in the direction from RR to Resp, enhanced after CRT.
In the HF patients, before and after CRT, the occurrence of a high number of extrasystoles significantly reduced GC in both directions. The GC progressively decreases from HF in sinus rhythm to HFVES1 and to HFVES2, while the TE does not show a similar evident trend. This finding suggests that in HF patients, the cardio-respiratory interactions evaluated in the presence of extrasystoles have a strong nonlinear component that can only be properly captured when the TE is used. This is confirmed also by the CE formulated in a model-free way, which does not show particular trends and after the resynchronization therapy clearly differentiates the two directions of interaction even in the presence of extrasystoles.
Contrary to results obtained in the group of non-responders, in the group of responders to CRT we found a statistically significant difference in the baseline condition between the Resp-RR and RR-Resp directions, quantified by applied measures from information theory. This finding could be useful in the selection of patients for CRT.

Author Contributions

Conceptualization, M.M.P., N.N.R., S.U.P. and L.F.; methodology, L.F., R.P., C.B. and M.M.P.; formal analysis, M.M.P.; data curation, N.N.R. and S.U.P.; writing—original draft preparation, M.M.P., N.N.R., R.P., C.B. and L.F. All authors have read and agreed to the published version of the manuscript.

Funding

This research received no external funding.

Institutional Review Board Statement

The study was conducted in accordance with the Declaration of Helsinki, and approved by the Ethics Committee of the Faculty of Medicine the University of Belgrade, and each subject signed an informed consent form (Approve Date: 17 March 2017, Ref. Numb. 29/III-4).

Data Availability Statement

Data will be made available on request.

Acknowledgments

M.P. was partially financed by Ministry for Science, Technological Development and Innovation of the Republic Serbia [200110]. This study was supported by SiciliAn MicronanOTecH Research and Innovation CEnter “SAMOTHRACE” (MUR, PNRR-M4C2, ECS_00000022), spoke 3—Università degli Studi di Palermo “S2-COMMs—Micro and Nanotechnologies for Smart & Sustainable Communities”. R.P. was partially supported by the European Social Fund (ESF)—Complementary Operational Programme (POC) 2014/2020 of the Sicily Region.

Conflicts of Interest

The authors declare no conflict of interest.

References

  1. Porta, A.; Guzzetti, S.; Montano, N.; Pagani, M.; Somers, V.; Malliani, A.; Baselli, G.; Cerutti, S. Information domain analysis of cardiovascular variability signals: Evaluation of regularity, synchronisation and co-ordination. Med. Biol. Eng. Comput. 2000, 38, 180–188. [Google Scholar] [CrossRef] [PubMed]
  2. de Abreu, R.M.; Cairo, B.; Porta, A. On the significance of estimating cardiorespiratory coupling strength in sports medicine. Front. Netw. Physiol. 2023, 2, 1114733. [Google Scholar] [CrossRef]
  3. Kapidžić, A.; Platiša, M.M.; Bojić, T.; Kalauzi, A. Nonlinear properties of cardiac rhythm and respiratory signal under paced breathing in young and middle-aged healthy subjects. Med. Eng. Phys. 2014, 36, 1577–1584. [Google Scholar] [CrossRef] [PubMed]
  4. Borovkova, E.I.; Prokhorov, M.D.; Kiselev, A.R.; Hramkov, A.N.; Mironov, S.A.; Agaltsov, M.V.; Ponomarenko, V.I.; Karavaev, A.S.; Drapkina, O.M.; Penzel, T. Directional couplings between the respiration and parasympathetic control of the heart rate during sleep and wakefulness in healthy subjects at different ages. Front. Netw. Physiol. 2022, 2, 942700. [Google Scholar] [CrossRef] [PubMed]
  5. Sorelli, M.; Hutson, T.N.; Iasemidis, L.; Bocchi, L. Linear and Nonlinear Directed Connectivity Analysis of the Cardio-Respiratory System in Type 1 Diabetes. Front. Netw. Physiol. 2022, 2, 840829. [Google Scholar] [CrossRef]
  6. Radovanović, N.N.; Pavlović, S.U.; Milasinovic, G.; Kircanski, B.; Platiša, M. Bidirectional Cardio-Respiratory Interactions in Heart Failure. Front. Physiol. 2018, 9, 165. [Google Scholar] [CrossRef] [Green Version]
  7. Elstad, M.; O’callaghan, E.L.; Smith, A.J.; Ben-Tal, A.; Ramchandra, R. Cardiorespiratory interactions in humans and animals: Rhythms for life. Am. J. Physiol. Circ. Physiol. 2018, 315, H6–H17. [Google Scholar] [CrossRef] [Green Version]
  8. Platiša, M.M.; Radovanović, N.N.; Kalauzi, A.; Milašinović, G.; Pavlović, S.U. Multiscale Entropy Analysis: Application to Cardio-Respiratory Coupling. Entropy 2020, 22, 1042. [Google Scholar] [CrossRef]
  9. Lazic, I.; Pernice, R.; Loncar-Turukalo, T.; Mijatovic, G.; Faes, L. Assessment of Cardiorespiratory Interactions during Apneic Events in Sleep via Fuzzy Kernel Measures of Information Dynamics. Entropy 2021, 23, 698. [Google Scholar] [CrossRef]
  10. Kalauzi, A.; Matić, Z.; Platiša, M.M.; Bojić, T. Two Operational Modes of Cardio-Respiratory Coupling Revealed by Pulse-Respiration Quotient. Bioengineering 2023, 10, 180. [Google Scholar] [CrossRef]
  11. Faes, L.; Porta, A.; Nollo, G. Information Decomposition in Bivariate Systems: Theory and Application to Cardiorespiratory Dynamics. Entropy 2015, 17, 277–303. [Google Scholar] [CrossRef]
  12. Xiong, W.; Faes, L.; Ivanov, P.C. Entropy measures, entropy estimators, and their performance in quantifying complex dynamics: Effects of artifacts, nonstationarity, and long-range correlations. Phys. Rev. E 2017, 95, 062114. [Google Scholar] [CrossRef] [Green Version]
  13. Faes, L.; Porta, A.; Nollo, G.; Javorka, M. Information Decomposition in Multivariate Systems: Definitions, Implementation and Application to Cardiovascular Networks. Entropy 2016, 19, 5. [Google Scholar] [CrossRef]
  14. Granger, C.W.J. Investigating causal relations by econometric models and cross-spectral methods. Econom. J. Econom. Soc. 1969, 37, 424–438. [Google Scholar] [CrossRef]
  15. Barrett, A.B.; Barnett, L.; Seth, A.K. Multivariate Granger causality and generalized variance. Phys. Rev. E Stat. Nonlin. Soft Matter Phys. 2010, 81 Pt 1, 041907. [Google Scholar] [CrossRef] [Green Version]
  16. Porta, A.; Faes, L. Wiener–Granger Causality in Network Physiology with Applications to Cardiovascular Control and Neuroscience. Proc. IEEE 2015, 104, 282–309. [Google Scholar] [CrossRef]
  17. Pernice, R.; Faes, L.; Feucht, M.; Benninger, F.; Mangione, S.; Schiecke, K. Pairwise and higher-order measures of brain-heart interactions in children with temporal lobe epilepsy. J. Neural Eng. 2022, 19, 045002. [Google Scholar] [CrossRef]
  18. Faes, L.; Nollo, G.; Porta, A. Information Decomposition: A Tool to Dissect Cardiovascular and Cardiorespiratory Complexity. In Complexity and Nonlinearity in Cardiovascular Signals; Springer: Cham, Switzerland, 2017; pp. 87–113. [Google Scholar] [CrossRef] [Green Version]
  19. Faes, L.; Porta, A. Conditional Entropy-Based Evaluation of Information Dynamics in Physiological Systems. In Directed Information Measures in Neuroscience; Springer: Berlin/Heidelberg, Germany, 2014; pp. 61–86. [Google Scholar] [CrossRef]
  20. Porta, A.; Faes, L.; Nollo, G.; Bari, V.; Marchi, A.; De Maria, B.; Takahashi, A.C.M.; Catai, A.M. Conditional Self-Entropy and Conditional Joint Transfer Entropy in Heart Period Variability during Graded Postural Challenge. PLoS ONE 2015, 10, e0132851. [Google Scholar] [CrossRef] [Green Version]
  21. Radovanović, N.N.; Pavlović, S.U.; Milašinović, G.; Platiša, M.M. Effects of Cardiac Resynchronization Therapy on Cardio-Respiratory Coupling. Entropy 2021, 23, 1126. [Google Scholar] [CrossRef]
  22. Leyva, F.; Nisam, S.; Auricchio, A. 20 Years of Cardiac Resynchronization Therapy. J. Am. Coll. Cardiol. 2014, 64, 1047–1058. [Google Scholar] [CrossRef] [Green Version]
  23. Glikson, M.; Nielsen, J.C.; Kronborg, M.B.; Michowitz, Y.; Auricchio, A.; Barbash, I.M.; Barrabés, J.A.; Boriani, G.; Braunschweig, F.; Brignole, M.; et al. 2021 ESC Guidelines on cardiac pacing and cardiac resynchronization therapy. Eur. Heart J. 2021, 42, 3427–3520. [Google Scholar] [CrossRef] [PubMed]
  24. Dhesi, S.; Lockwood, E.; Sandhu, R.K. Troubleshooting Cardiac Resynchronization Therapy in Nonresponders. Can. J. Cardiol. 2017, 33, 1060–1065. [Google Scholar] [CrossRef] [PubMed]
  25. Chakir, K.; Daya, S.K.; Aiba, T.; Tunin, R.S.; Dimaano, V.L.; Abraham, T.P.; Jaques-Robinson, K.M.; Lai, E.W.; Pacak, K.; Zhu, W.Z.; et al. Mechanisms of enhanced beta-adrenergic reserve from cardiac resynchronization therapy. Circulation 2009, 119, 1231–1240. [Google Scholar] [CrossRef] [PubMed] [Green Version]
  26. DeMazumder, D.; Kass, D.A.; O’rourke, B.; Tomaselli, G.F. Cardiac Resynchronization Therapy Restores Sympathovagal Balance in the Failing Heart by Differential Remodeling of Cholinergic Signaling. Circ. Res. 2015, 116, 1691–1699. [Google Scholar] [CrossRef] [PubMed]
  27. Daubert, C.; Behar, N.; Martins, R.P.; Mabo, P.; Leclercq, C. Avoiding non-responders to cardiac resynchronization therapy: A prac-tical guide. Eur. Heart J. 2017, 38, 1463–1472. [Google Scholar]
  28. Faes, L.; Nollo, G.; Porta, A. Compensated Transfer Entropy as a Tool for Reliably Estimating Information Transfer in Physiological Time Series. Entropy 2013, 15, 198–219. [Google Scholar] [CrossRef] [Green Version]
  29. Pernice, R.; Lazic, I.; Bara, C.; Sparacino, L.; Mijatovic, G.; Loncar-Turukalo, T.; Faes, L. Assessment of Cardiorespiratory Interactions During Spontaneous and Controlled Breathing: Non-linear Model-free Analysis. In Proceedings of the 2022 12th Conference of the European Study Group on Cardiovascular Oscillations (ESGCO), Štrbské Pleso, Slovakia, 9–12 October 2022; pp. 1–2. [Google Scholar] [CrossRef]
  30. Geweke, J. Measurement of linear dependence and feedback between multiple time series. J. Am. Stat. Asso-Ciation 1982, 77, 304–313. [Google Scholar] [CrossRef]
  31. Schiatti, L.; Nollo, G.; Rossato, G.; Faes, L. Extended Granger causality: A new tool to identify the structure of physiological networks. Physiol. Meas. 2015, 36, 827–843. [Google Scholar] [CrossRef]
  32. Kozachenko, L.F.; Leonenko, N.N. Sample Estimate of the Entropy of a Random Vector. Probl. Peredachi Inf. 1987, 23, 9–16. [Google Scholar]
  33. Kraskov, A.; Stögbauer, H.; Grassberger, P. Estimating mutual information. Phys. Rev. E Stat. Nonlin. Soft Matter Phys. 2004, 69, 066138, Erratum in 2011, 83, 019903. [Google Scholar] [CrossRef] [Green Version]
  34. Faes, L.; Erla, S.; Nollo, G. Measuring Connectivity in Linear Multivariate Processes: Definitions, Interpretation, and Practical Analysis. Comput. Math. Methods Med. 2012, 2012, 140513. [Google Scholar] [CrossRef] [Green Version]
  35. Faes, L.; Kugiumtzis, D.; Nollo, G.; Jurysta, F.; Marinazzo, D. Estimating the decomposition of predictive information in multivariate systems. Phys. Rev. E Stat. Nonlin. Soft Matter Phys. 2015, 91, 032904. [Google Scholar] [CrossRef] [Green Version]
  36. Alvarez-Alvarez, B.; García-Seara, J.; Martínez-Sande, J.L.; Rodríguez-Mañero, M.; López, X.A.F.; González-Melchor, L.; Bermejo, R.M.A.; Iglesias-Alvarez, D.; Sampedro, F.G.; Díaz-Louzao, C.; et al. Cardiac resynchronization therapy outcomes in patients under nonoptimal medical therapy. J. Arrhythmia 2018, 34, 548–555. [Google Scholar] [CrossRef]
  37. Hori, M.; Okamoto, H. Heart rate as a target of treatment of chronic heart failure. J. Cardiol. 2012, 60, 86–90. [Google Scholar] [CrossRef] [Green Version]
  38. Urso, C.; Brucculeri, S.; Caimi, G. Acid–base and electrolyte abnormalities in heart failure: Pathophysiology and implications. Heart Fail. Rev. 2015, 20, 493–503. [Google Scholar] [CrossRef] [Green Version]
  39. Forleo, G.B.; Santini, L.; Campoli, M.; Malavasi, M.; Scaccia, A.; Menichelli, M.; Riva, U.; Lamberti, F.; Carreras, G.; Orazi, S.; et al. Long-term monitoring of respiratory rate in patients with heart failure: The Multiparametric Heart Failure Evaluation in Implantable Cardioverter-Defibrillator Patients (MULTITUDE-HF) study. J. Interv. Card. Electrophysiol. 2015, 43, 135–144. [Google Scholar] [CrossRef]
  40. Seith, A.K. A MATLAB toolbox for Granger causal connectivity analysis. J. Neurosci. Methods 2010, 186, 262–273. [Google Scholar] [CrossRef]
  41. Nemati, S.; Edwards, B.A.; Lee, J.; Pittman-Polletta, B.; Butler, J.P.; Malhotra, A. Respiration and heart rate complexity: Effects of age and gender assessed by band-limited transfer entropy. Respir. Physiol. Neurobiol. 2013, 189, 27–33. [Google Scholar] [CrossRef] [Green Version]
  42. Iatsenko, D.; Bernjak, A.; Stankovski, T.; Shiogai, Y.; Owen-Lynch, P.J.; Clarkson, P.B.M.; McClintock, P.V.E.; Stefanovska, A. Evolution of cardiorespiratory interactions with age. Philos. Trans. R. Soc. A Math. Phys. Eng. Sci. 2013, 371, 20110622. [Google Scholar] [CrossRef] [Green Version]
  43. O’mahony, D.; Bennett, C.; Green, A.; Sinclair, A. Reduced baroreflex sensitivity in elderly humans is not due to efferent autonomic dysfunction. Clin. Sci. 2000, 98, 103. [Google Scholar] [CrossRef]
  44. Gerritsen, J.; TenVoorde, B.J.; Dekker, J.M.; Kostense, P.J.; Bouter, L.M.; Heethaar, R.M. Baroreflex sensitivity in the elderly: Influence of age, breathing and spectral methods. Clin. Sci. 2000, 99, 371–381. [Google Scholar] [CrossRef] [Green Version]
  45. Breston, L.; Leonardis, E.J.; Quinn, L.K.; Tolston, M.; Wiles, J.; Chiba, A.A. Convergent cross sorting for estimating dynamic coupling. Sci. Rep. 2021, 11, 20374. [Google Scholar] [CrossRef] [PubMed]
  46. Widjaja, D.; Montalto, A.; Vlemincx, E.; Marinazzo, D.; Van Huffel, S.; Faes, L. Cardiorespiratory Information Dynamics during Mental Arithmetic and Sustained Attention. PLoS ONE 2015, 10, e0129112. [Google Scholar] [CrossRef] [PubMed] [Green Version]
Figure 1. Granger causality (GC) at baseline measurements (A) and at follow-up measurements after CRT device implantation (B) in heart-failure patients: with sinus rhythm (HFSin), with sinus rhythm and small number of ventricular extrasystoles (HFVES1), and with sinus rhythm and higher number of ventricular extrasystoles (HFVES2). GC(Resp-RR) and GC(RR-Resp) denote causality of respiration in RR intervals time series and vice versa. Data are presented as mean + standard error. * p < 0.05.
Entropy 25 01072 g001
Figure 2. Transfer entropy (TE) at baseline measurements (A) and at follow-up measurements after CRT device implantation (B) in heart-failure patients: with sinus rhythm (HFSin), with sinus rhythm and small number of ventricular extrasystoles (HFVES1), and with sinus rhythm and higher number of ventricular extrasystoles (HFVES2). TE(Resp-RR) and GC(RR-Resp) denote causality of respiration in RR intervals time series and vice versa. Data are presented as mean + standard error. ** p < 0.01, * p < 0.05.
Entropy 25 01072 g002
Figure 3. Cross entropy (CE) at baseline measurements (A) and at follow-up measurements after CRT device implantation (B) in heart failure patients: with sinus rhythm (HFSin), with sinus rhythm and small number of ventricular extrasystoles (HFVES1), and with sinus rhythm and higher number of ventricular extrasystoles (HFVES2). TE(Resp-RR) and CE(RR-Resp) denote causality of respiration in RR intervals time series and vice versa. Data are presented as mean + standard error. ** p < 0.01, * p < 0.05.
Entropy 25 01072 g003
Figure 4. Granger causality (GC) at baseline measurements and at follow-up measurements in responders (A) and non-responders (B) to CRT. Transfer Entropy (TE) at the baseline measurements and at the follow-up measurements in responders (C) and non-responders (D) to CRT. Cross Entropy (CE) at the baseline measurements and at the follow-up measurements in responders (E) and non-responders (F) to CRT. Resp-RR and RR-Resp denote causality of respiration in RR interval time series and vice versa. Data are presented as mean + standard error. ** p < 0.01, * p < 0.05.
Entropy 25 01072 g004
Table 1. Comparison of the mean values of sample numbers in each group before (baseline) and after (follow-up) cardio resynchronization therapy (CRT) as well as of the mean values between the groups in each condition.
GroupBaseline (×103)Follow-Up (×103)p (Baseline vs. F-Up)
HFSin (N = 14; 71% R)1.31 ± 0.181.22 ± 0.190.124
HFVES1 (N = 11; 64% R)1.34 ± 0.291.25 ± 0.220.131
HFVES2 (N = 14; 57% R)1.49 ± 0.181.30 ± 0.170.008
p (Among groups)0.0610.469
Responders (N = 25)1.43 ± 0.221.28 ± 0.180.007
Non-Responders (N = 14)1.30 ± 0.221.22 ± 0.210.090
p (Resp. vs. Non-Resp.) 0.1180.149
Values are mean ± standard deviation. In the brackets percent of responders (R) in each HF group is given.
Table 2. Descriptive statistics.
HF Groups CRT Groups
ConditionHFSinHFVES1HFVES2RespondersNon-Responders
RR [s]Baseline0.930 ± 0.032 ττ0.932 ± 0.0540.813 ± 0.026 **0.857 ± 0.027 *0.943 ± 0.040
Follow-up1.010 ± 0.0530.99± 0.400.934 ± 0.0310.959 ± 0.0361.007 ± 0.051
BB [s]Baseline4.25 ± 0.383.82 ± 0.273.40 ± 0.134.01 ± 0.24 *3.49 ± 0.14
Follow-up4.30 ± 0.393.96 ± 0.373.65 ± 0.214.32 ± 0.26 #3.35 ± 0.14
** p < 0.01 * p < 0.05 Baseline vs. Follow-up, # p < 0.05 Responders vs. Non-Responders, ττ p < 0.01 HFSin vs. HFVES2.
Table 3. Statistical significance of comparisons between pairs of groups for bidirectional measures.
Baseline Follow-Up
HFSin vs. HFVES1HFSin vs. HFVES2HFVES1 vs. HFVES2HFSin vs. HFVES1HFSin vs. HFVES2HFVES1 vs. HFVES2
GC(Resp-RR)0.4320.0010.0020.0130.0040.751
GC(RR-Resp)0.2970.0010.0010.2120.0120.527
TE(Resp-RR)0.5720.6350.1650.0800.2460.681
TE(RR-Resp)0.1810.1370.0051.0000.9460.918
CE(Resp-RR)0.2580.1310.1230.4400.7810.758
CE(RR-Resp)0.6430.2740.2580.4110.9800.957
Statistically significant values are in bold.
Disclaimer/Publisher’s Note: The statements, opinions and data contained in all publications are solely those of the individual author(s) and contributor(s) and not of MDPI and/or the editor(s). MDPI and/or the editor(s) disclaim responsibility for any injury to people or property resulting from any ideas, methods, instructions or products referred to in the content.

