Abstract
Using a sample of S&P 500 stocks, this paper examines the investor sentiment spillover network between firms and assesses how the sentiment connectedness in the network impacts stock price crash risk. We demonstrate that firms with higher sentiment connectedness are more likely to crash as they spread more irrational sentiment signals and are more sensitive to investor behaviors. Notably, we find that the effect of investor sentiment on crash risk mainly stems from sentiment connectedness among firms rather than firms’ individual sentiment, especially when market sentiment is surging or declining. These findings remain robust after controlling for other determinants of crash risk, including stock price synchronicity, accounting conservatism, and internal corporate governance strength. Our results underscore the importance of sentiment connectedness among firms and provide valuable insights for risk management among investors and regulatory authorities involved in monitoring risk.
1. Introduction
Investor sentiment is widely recognized as a critical factor behind asset price fluctuations [,,,]. Recent financial uncertainties and economic vulnerabilities have led to increasing sensitivity and widespread investor sentiment and panic dissemination, resulting in severe economic consequences [,]. For example, the failure of Silicon Valley Bank on March 10, 2023, has raised significant concerns about broader banking stability. Consequently, investors initiated a sell-off of related stocks, causing sharp declines in over 20 banking equities by March 13, 2023. The collapse of Silicon Valley Bank and subsequent market concerns have continued to draw attention from investors and regulators regarding the transmission of investor sentiment. Another example demonstrating the interconnected nature of investor sentiment is the panic selling induced by recent geopolitical conflicts [,,]. These cases vividly illustrate that financial markets are susceptible to sentiment and its connectedness. Collective panic among investors, driven by market information, herd behavior, and sector-specific emotional transmission, causes instability in financial markets [,]. Therefore, studying the impact of investor sentiment connectedness on stock prices is crucial.
This paper considers the connectedness of investor sentiment between firms and evaluates the impact of sentiment connectedness on firm crash risk. Baker and Wurgler (2007) [] have confirmed that stock price crash risk may be driven by investor sentiment, which is often regarded as factors beyond the company fundamentals (e.g., liquidity [], book-to-market ratio []). West (1988) [] and Shiller (1990) [] argue that the irrational emotions of investors, such as “enthusiasm” or “panic”, have the potential to trigger fluctuations and bubbles in asset prices. In light of this, some studies have shown the relationship between investor sentiment and crash risk, such as [,,,]. While these viewpoints can confirm the relationship between investor sentiment and stock price collapses, they often overlook the connectedness of investor sentiments, which can sometimes hinder the accurate identification of the impact of investor sentiment. The connectedness phenomenon indicates that sentiment shock can spread from one firm to another through financial linkages []. Indeed, investor sentiment has been shown to be sensitive to external influences and exhibit spillover across firms in financial markets [,,]. This means that the sentiment of one firm is not solely influenced by its own sentiment, but it can also be significantly impacted by the sentiments of other firms.
This paper uses the nonlinear Granger causality method [] to study the sentiment spillover network among S&P 500 stocks. The sentiment spillover network differs from previous financial linkages based on business connections [,,] or price co-movements [,,]. First, the firm sentiment connectedness is driven by the exogenous investor sentiment factor, often regarded as irrational and weakly related to company fundamentals []. Second, the sentiment connectedness of a firm cannot be entirely attributed to its financial characteristics. For instance, in the constructed sentiment spillover network, Amazon is linked to many other firms, whereas JP Morgan Chase and Goldman Sachs have much less sentiment connectedness despite being ranked as global systemically important financial institutions. Taken together, our findings suggest that the investor sentiment of a firm can receive from or spread to other firms, even without directly affecting ownership or asset flows.
We measure the sentiment connectedness of a firm based on different network centrality measurements. According to El-Khatib et al. (2015) [], the connectedness of an individual in a network assumes nodes (1) are linked to many other firms; (2) are close to other individuals; (3) are located on the path connecting any other pairs of individuals; and (4) are linked to other highly linked individuals. Motivated by this, many studies have shown the structure and impact of financial networks using degree centrality [,,], closeness centrality [,], betweenness centrality [], eigenvector centrality [,], and so on. These indexes measure the centrality or extent of a firm’s connectedness with others and the possible information and resource exchange []. However, these centralities only consider one kind of network linkage and influence, causing bias and violating measures of network relationships []; sometimes, these centralities are intrinsically relevant [,]. To eliminate such biases and measure different influences of a node, we aggregate different network centrality indexes based on the entropy weight method [] and propose a novel firm sentiment connectedness index, which is referred to as FirmSentix, to measure the connection and spillover of each firm.
We examine the relationship between sentiment connectedness and stock price crash risk in S&P 500 stocks with several regressions. We find that a firm’s sentiment connectedness is significantly and positively related to crash risk, showing that a firm with higher connectedness in the sentiment network is more vulnerable to crashes. This result demonstrates that stock price is not only related to a firm’s individual sentiment, but also susceptible to sentiment interactions with its neighbors. The relationship between sentiment connectedness and crash risk can be explained in two dimensions. First, a highly interconnected firm may be more influential in spreading sentiment shocks as it can more efficiently reach other members of the network. Second, a highly connected member may be more easily influenced by others, as its network position provides more opportunities to contact peer firms, allowing imitation of behaviors and fostering irrational dynamics. This finding remains robust when considering other determinants of crash risk, i.e., stock price synchronicity, accounting conservatism, extreme market events, and internal corporate governance strength. To address potential endogeneity issues, two-stage least squares estimation and propensity score matching are employed. After considering the impact of peer effect, i.e., the peer companies’ crash, and high-frequency trading, the relationship between sentiment connectedness and crash risk remains robust.
To demonstrate the advantage of considering the sentiment connectedness between firms, we compare the sensitivity of firms’ individual sentiment and the sentiment connectedness to crash risk under different market conditions. Considering that spillover is more likely to occur when sentiment becomes extreme [,], we divide the whole sample into periods of heightened and diminished investor sentiment based on the median of the firm’s investor sentiment. Our result shows that both the firm’s sentiment and the sentiment connectedness are significantly and positively related to crash risk across the full sample, indicating that sentiment and the connectedness may increase the firm’s crash risk. However, a firm’s individual sentiment is not a significant driver of crash risk when market sentiment is at a high level or low level. In contrast, sentiment spillover remains a significant influence on crash risk. This can be explained by the fact that during periods of extreme sentiment, investor sentiment can be fully reflected by the market [], so the impact of sentiment fluctuations on stock price volatility is relatively small. Moreover, when market sentiment is heightening and diminishing, investors generally hold optimistic or pessimistic views, making them more likely to ignore negative information or risk factors, thereby lacking sensitivity to potential crash risks. However, when investor sentiment spreads and propagates through communication or media coverage, other investors may also be affected, thereby exacerbating fluctuations and changes in market sentiment. This indicates that investor sentiment connectedness has stronger explanatory power for crash risk than a firm’s individual sentiment.
We further show potential channels that affect the relationship between sentiment connectedness and firm crash risk. Moderating effect analysis suggests that stock price synchronicity amplifies the effect of network connections on crash risk, but accounting conservatism lessens it. This is because stock price synchronicity increases information asymmetry and raises investors’ sensitivity to bad news. However, accounting conservatism restricts executives’ opportunities to conceal bad news, increases information transparency, and reduces investor sensitivity [,,]. Furthermore, through heterogeneity analysis, we show that extreme risk events and poor company governance can improve the effect of sentiment connectedness on crash risk.
The contribution of this paper can be concluded from three aspects. First, the sentiment connectedness among firms is studied, and a corresponding sentiment spillover network is constructed. While many prior studies focus on the economic impacts of investor sentiments (see, e.g., Kumar and Lee (2006) [], De et al. (1990) [], and Han (2008) []), they overlook the interplay of individual sentiments. This paper investigates the sentiment interactions between firms using the network structure and measures the investor sentiment connectedness with a novel aggregated centrality index. Our sentiment network shows that the contagion of investor sentiment is not merely driven by the firm financial characteristics such as size, which means that the sentiment network can capture the interaction between investors. Importantly, the structure of the sentiment network also reflects the market dynamics, as the network is more heterogeneous in crisis years. These findings show that the sentiment network is useful and important in describing the financial market.
Second, this paper expands the investigation of firm crash risk by considering the effect of sentiment connectedness among firms. Prior research has predominantly concentrated on analyzing fundamental factors such as managerial characteristics and company fundamentals (see, [,,], etc.). However, the presence of financial market low-efficiency and stock price synchronicity indicates that the risk of stock market crashes is frequently influenced by factors beyond company fundamentals [,]. This point has been validated by numerous real-life crisis events, for example, the bank panic following the failures of Silicon Valley Bank and Signature Bank. Despite the impacts of investor sentiment being shown in some studies, the spillover and network structure of sentiment are neglected. In this paper, we show that the connectedness of firm sentiment, which is beyond fundamental factors, may cause a firm crash. Our study enriches the reason for firm crash risk.
Finally, this paper demonstrates that a firm’s sentiment connectedness holds greater explanatory power regarding crash risk than its individual sentiment. Our study integrates investor interaction networks into the research on investor sentiment, revealing that these networks significantly influence investor behavior. Social networks accelerate information dissemination, enhancing its impact. Anticipating this spread helps us better understand market dynamics. Moreover, differences in how investors interpret information within social networks trigger trading activities (Peng and Zhang, 2024 []). Using social network analysis, we can study investor behavior and its effects on trading volume and market liquidity.
2. Methodology
2.1. Sentiment Spillover Network
2.1.1. Sentiment Spillover Network Construction
This paper uses the turnover rate as the measure of investor sentiment. The turnover rate can represent the heterogeneity of investor’s beliefs in the market and capture the liquidity of individual stocks. A higher turnover rate also often means more hot market and high investor sentiment []. In particular, when irrationally optimistic investor sentiment rises due to short-selling constraints, rational investors will actively trade to profit from their divergence in views []. We calculate the turnover rate as the ratio of reported share volume to circulating shares of stock i on day t.
In this paper, we construct sentiment spillover between firms using the nonlinear Granger network method proposed in []. For a sample of the turnover of S&P 500 component stocks over the period from January 2006 to December 2021, the procedure includes the following steps:
First, we filter linear causality using the VAR model, and use VAR residuals to carry out the nonlinear Granger causality test concretely for stationary time series and . Similar to [], we establish the following linear bivariate VAR:
where and are stationary times series and the optimal lag order of the according to the Akaike information criterion. Then, we obtained the residual sequences and .
Second, a BDS test is performed on the VAR residuals from the VAR linear filter [], which is based on the correlation dimension of the nonlinear structure in the test time series. If the test negates the null hypothesis, the tested time series is nonlinear.
Finally, we test the nonlinear Granger relation between any two nodes as the edge of the network. The null hypothesis () is that is not Granger causing . In practice, conditional independence is tested using finite lags and
where and , . We suppose that and . Therefore, denotes a three-variate random variable, distributed as . Then, Equation (2) can be rewritten as .
Following [], the null hypothesis can be implied as
Then, the test statistic for nonlinear Granger causality is
where n is the size of sample, showing the number of nodes in the network, and is the local density estimator of U at []. The test statistic can be interpreted as an average over local BDS test statistics [], for the conditional distribution of X and Z, given . In this case, the test statistic is asymptotically normally distributed.
We obtain the asymmetric matrix through a nonlinear Granger causality test to reveal the direction of sentiment spillover between every pair of firms (), that is,
We follow [] and suppose that for each , , which excludes the connections between the node and itself.
This paper uses the network density to measure the connections of investor sentiment in the market. The density characterizes how closely stock nodes are in the network. The larger the density of the network, the more closeness between stock nodes []. The density of the network can be calculated as follows:
where L represents the actual number of edges connected to the network, and n denotes the number of nodes. The value range of network density is ; the network density is one when the network is fully connected.
2.1.2. Measuring the Firm’s Sentiment Connectedness: An Entropy Weight Method
This paper considers the sentiment connectedness of firms based on the sentiment spillover network. A sentiment spillover network refers to the concept that sentiment can spread from one individual to another within a social network. It suggests that the sentiment expressed by one individual can influence their neighbor’s sentiment state. According to Matthew et al. (2008) [], in a financial network where nodes represent firms and linkages are financial connections such as director relationships [] and obligation connections [], firms should have high connectedness if they are (1) linked to many other firms, meaning they have many directed connections with other firms; (2) close to other individuals, meaning they have less distance and can spread information to other firms; (3) on the path connecting any other pairs of firms, showing that these firms can transmit information easily; and (4) linked to other firms that have many connections, indicating that these firms are linked to other authority nodes and can spread information effectively. Therefore, this paper considers four primary types of sentiment network centralities, i.e., degree centrality, closeness centrality, betweenness centrality, and eigenvector centrality.
The degree centrality () is a relatively intuitive index, that is, the nodes with more connected edges can spread to more firms. Suppose that is the number of neighbors of node i and n is the total number of nodes in the network, then the degree centrality of node i can be measured as
The closeness centrality denotes the average shortest spillover distance between a node and all other nodes. The closeness centrality () of node i is calculated as
while n is the number of in the network and is the shortest distance from i to j.
The betweenness centrality () measures how many spillover paths a node lies on, indicating the importance of a node in spreading through different parts of the network, that is,
where denotes the number of shortest edges from i to j and is the number of edges from i to j.
Eigenvector centrality () indicates the importance of a node in a spillover network; specifically, the connectedness of a node is related to the number and power of the adjacent nodes []. If is the important measure of node i, the centrality is calculated in the following text:
while c is a proportional constant. if vertices i and j are connected by an edge, and if they are not.
To mitigate the bias and violation in measuring a firm’s connections, we further quantify a firm’s sentiment connectedness by aggregating these centrality indexes. Suppose that represents the centrality measurement j for company i, that is,
Then, the entropy of each factor can is calculated as
where , then the weight of centrality index j can be calculated as
The weight shows the importance of each centrality in a firm; therefore, we can measure the firm investor sentiment connectedness as
where denotes the network centrality and is the weight obtained from the entropy method []. Our sentiment connectedness index can show the full spillover and connection information of a firm in the sentiment network, and implies that a firm with a higher FirmSentix has more sentiment spillover in the network.
2.2. Model Identification and Variable Measurements
This paper chooses a fixed-effect model to identify the impact of sentiment connectedness on crash risk. The model can be expressed as
where represents the crash risk for firm i in year t. is the sentiment connectedness of firm i at year t. and are year and firm dummies.
Following Callen and Fang (2013) [], Equation (15) also includes various multidimensional economic variables as control variables, which are the logarithmic total assets (), book-to-market ratio (), asset–liability ratio (), and return on net assets (), as well as company-specific factors such as information opacity indicators () and investor divergence strength (). Additionally, to mitigate the potential lag effect caused by crash risk, we incorporate the lag phase of crash risk as an additional control variable. As the trading and sentiment may be influenced by high-frequency trading (HFT), we also consider the HFT market size () in this paper. The definitions of the variables used in this study are provided in Appendix A.
According to Kim et al. (2014) [], we consider two crash risk measures. We calculate firm-specific weekly returns () by taking the natural logarithm of one added to the residual earnings from the extended market model regression for each year and firm.
where is the return on stock j in week . , , , , and represent the market return in week , , , , and , respectively. The lead and lag terms for the market index return are included to allow for non-synchronous trading [].
The firm-specific weekly returns for firm j in week are computed by , where is the residual in Equation (16). Then, we select negative conditional return skewness () as a measure of each company’s stock price risk, figured by taking the negative of the third moment of firm-specific weekly returns for each year and dividing it by the cubic standard deviation of firm-specific weekly returns. In particular, we compute the for each firm j in year t as
where T is the number of weekly returns during year t. A higher indicates that a stock is more prone to crashes, and vice versa. Another measure of crash risk is the down-to-up volatility (). To calculate this measure, we follow [] and separate the weeks with firm-specific weekly returns above the annual average (up weeks) from those with firm-specific returns below the annual mean (down weeks). We then compute the standard deviation for each subset of weeks. It is calculated as
where represents the weekly returns to stock i during period . is the number of up weeks and is the number of down weeks.
3. Data
Our research sample includes the daily turnover of stocks comprising the S&P 500 index from 4 January 2006 to 31 December 2021. Following Huynh et al. (2021) [], we apply specific criteria to select stocks for our study: (i) exclusion of stocks suspended for more than 180 consecutive trading days; (ii) removal of unlisted stocks at the beginning of the study period; and (iii) elimination of delisted stocks at the end of the sample period. Consequently, our analysis focuses on a total of 372 constituent stocks of the S&P 500. All the data used in this study are from the WIND database.
Similar to Baker et al. (2012) [], we choose the turnover rate of a firm as our primary sentiment proxy. Baker and Stein (2004) [] assert that short-sale constraints cause noise traders to preferentially transact when feeling optimistic rather than pessimistic. Specifically, irrational investors’ optimism is reflected in an ascending turnover ratio, while their pessimism corresponds to a descending turnover ratio. This theoretical link between sentiment and trading activity has also been supported empirically []. The turnover ratio is also well suited for capturing volatility and the mean–variance relationship due to its daily availability. As a widely accessible metric computed directly from stock exchange data, the turnover ratio explicitly measures sentiment in equity markets rather than other financial markets [].
Table 1 reports the descriptive statistics for key variables in this study. Sample firms exhibit a mean turnover of 0.9509, median of 0.6812, and maximum value of 110.7406, suggesting significant volatility in market sentiment within the U.S. equity market. The average crash risk measure () stands at 0.5845, aligning with prior empirical findings. These results highlight the elevated crash risk among S&P 500 firms, underscoring their relevance for in-depth investigation.

Table 1.
Descriptive statistics of all variables.
4. Empirical Results
4.1. Sentiment Spillover Network Among S&P 500 Stocks
We construct a sentiment spillover network between S&P 500 stocks from 2006 to 2021. Figure 1 shows the network in the years 2007, 2008, 2019, and 2020. In each network, nodes represent firms and directed arrows show the spillover between firms.

Figure 1.
The structural characteristic analysis of sentiment spillover networks. (a) shows the sentiment spillover network in 2007; (b) shows the sentiment spillover network in 2008; (c) shows the sentiment spillover network in 2019; (d) shows the sentiment spillover network in 2020.
Figure 2a depicts the cumulative distribution of sentiment connectedness for the years 2008, 2009, 2019, and 2020. The results reveal a highly heterogeneous distribution pattern, where most network nodes exhibit limited sentiment linkages while a small subset demonstrates significant connectivity. Notably, crisis periods (2008 and 2020) display more pronounced heterogeneity and connectedness compared to non-crisis years. This finding is visually supported by the flatter distribution curves observed during crisis periods, as opposed to the steeper distributions seen in 2007 and 2019.
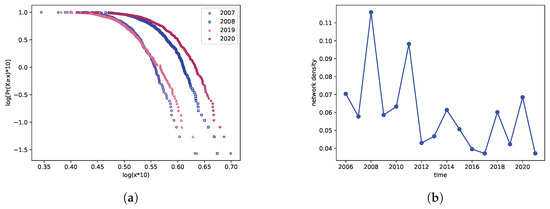
Figure 2.
The structural characteristic of sentiment spillover networks. (a) is the cumulative distribution of sentiment connectedness for the years 2008, 2009, 2019, and 2020; (b) is the yearly network density.
It is important to note that our sentiment networks are driven by exogenous investor behavioral factors rather than company fundamentals. This distinguishes our study from previous research on financial networks that focused on business connections [,] or price linkage [,]. From Figure 1, we find that the connectedness of investor sentiment cannot be solely attributed to company financial characteristics. For example, within the sentiment network, Amazon is influenced by numerous other firms, whereas JP Morgan Chase and Goldman Sachs, despite being globally recognized as important financial institutions, receive fewer sentiment connectedness from other firms. This phenomenon highlights the potential for a firm to establish connections through its influence on another firm’s sentiment, even without directly affecting ownership or asset flows. It suggests that sentiment connectedness is not solely determined by the prominence of a firm.
Figure 2b examines the temporal evolution of network density to characterize systemic interconnectedness. Notably, crisis periods exhibit pronounced spikes in sentiment network density. During the 2008 subprime crisis, density rose sharply from 0.0578 to 0.1159, reaching the highest value observed over the entire sample period. Following this peak, density subsequently declined steadily until 2011, when the U.S. sovereign debt crisis triggered another significant increase. Conversely, network density experienced rapid contraction during post-crisis market recovery phases, reflecting reduced information diffusion across market participants.
Furthermore, during subsequent crises such as the Sino-US trade war in 2018 and the COVID-19 crisis in 2020, the network density reached varying degrees of peaks. Hence, we can infer that network density possesses a certain level of identification for financial crises. This is because an increase in network density signifies heightened stock correlations, thereby increasing the likelihood of risk transmission.
4.2. Quantifying the Impact of Sentiment Spillover on Crash Risk
We examine the impact of the sentiment connectedness on stock price crash risk using several panel regression models. To test for possible collinearity problems between explanatory variables, a correlation analysis is carried out. The results show that the correlation coefficients between variables are less than 0.2, indicating that the regression model does not have collinearity problems. Furthermore, since the empirical literature on forecasting crash risk is relatively new, our analysis may omit some crash determinants correlated with other included variables from the regressions. To mitigate potential problems that can arise from correlatedly omitted variables, we attempt to use a fixed effect model. Before it, we perform the Hausman test, which shows that the model is reasonable [,]. The regression results are rendered in Table 2.
Table 2.
The regression of sentiment connectedness and crash risk.
As illustrated in Table 2, the regression coefficient reveals a positive association between sentiment connectedness and stock price crash risk, suggesting that sentiment connectedness contributes to the amplification of crash risk. This might be because that a firm with higher connectedness has a greater capacity and efficiency to receive and spread extreme sentiment. The general transmission of the signal promotes forming an irrational investment atmosphere, which increases information asymmetry and the possibility of covering “bad news”, raising the volatility of stock prices and crash proneness []. Our results also have economic meanings, that is, a change of one standard deviation in FirmSentix results in an approximately increase in .
4.3. Robust Test
4.3.1. Endogeneity: Instrumental Variables
To eliminate the potential effects of endogeneity on our results, this study selects the instrumental variables (IVs) of independent variables. Similar to Hao and Xiong (2021) [], we select the average value of investor sentiment connectedness to other firms in the identical state () and the average value of investor sentiment connectedness to other firms in the identical industry (), that is,
where is the sum of sentiment connectedness in the same state, and n is the number of firms in the same state. is the sum of sentiment connectedness in the same industry, and m is the number of the firms in the same industry.
Furthermore, since there may be a mutual causal relationship between the current stock price crash risk and sentiment connectedness, we add the current stock price crash risk as a control variable to the first-stage regression. To avoid the impact of the company’s stock price crash risk from the previous year on the current stage, we add one-year-lagged stock price crash risk to the second stage. The results of the two-stage regression process are shown in Table 3.
Table 3.
Sentiment connectedness and crash risk: instrument variable method.
The first regression stage is shown in the first column of Table 3. Sentiment connectedness is positively correlated with these two instrumental variables at the 1% significance level. The results of the second regression stage are shown in the second column of Table 3. The investor sentiment connectedness is positively correlated with stock price crash risk ( = 29.885), and the significance level is 1%. Therefore, the endogeneity analysis supports our main results.
4.3.2. Endogeneity: Propensity Score Matching
Given the inherent challenges in quantifying and controlling certain country-level and firm-level factors, we employ the propensity score-matched method to re-evaluate our model. This method allows us to account for the differences in firm characteristics between high and low sentiment connectedness. Specifically, we classify firms with sentiment connectedness above the median as having high sentiment connectedness, and vice versa. In the first stage, we include the firm-level control variables of high sentiment connectedness as outlined in Equation (15), and calculate the propensity score for each sample. The next step involves matching each firm year in the high-sentiment-connectedness group with the nearest propensity score in the low-sentiment-connectedness group. Panel A presents the results of the first-stage regression, and Panel B provides the estimation of the relationship between sentiment connectedness and crash risk in Table 4. Notably, these results remain unchanged when compared to our main regression in Table 2.
Table 4.
Propensity score matching results.
4.3.3. The Effect of Network Centrality Measures
To further detect robustness of the results, we also test the relationship between connectedness and crash risk using other network connection measures. Since the importance of the sentiment spillover network measures the spillover of a firm, we consider the impact of LeadeRank centrality (), K-coreness centrality (), and PageRank centrality () on firm crash risk.
The estimated results are illustrated in Table 5. We show that the relationship between sentiment spillover network centrality indexes (, and ) and crash risk remains positive, showing that a firm located in a more important position has a higher crash risk. This result confirms the robustness of our main regression in Table 2. Since the importance of a company in the sentiment spillover network gives it a high ability to acquire and propagate information in a certain group or different groups, this raises the herd effect and irrational behavior of investors, causing crash risk [].
Table 5.
Results with alternative network centrality measures.
4.3.4. The Peer Effect
We further examine the peer effect on stock crash risk. Extant literature (e.g., Bustamante and Frésard (2020) []; Chen et al. (2019) []) has documented that firms often mimic peers’ decisions based on observable characteristics, underscoring the role of peer influence in shaping stock price dynamics. Specifically, Mugerman et al. (2014) [] and Kaustia et al. (2015) [] highlight that firms may influence others through peer effect. To isolate the standalone effect of sentiment connectedness from peer-induced crash risk, we incorporate peer companies’ crash risk as a control variable, which is defined as the average crash risk of all firms in the same industry:
where m denotes the total number of firms in the industry. Column (1) of Table 6 reports the results after controlling for peer crash risk. Notably, remains significantly negative in predicting crash risk, reinforcing the robustness of our baseline findings.
Table 6.
The effect of sentiment network under HFT and peer effect.
4.3.5. The Effect of High-Frequency Trading
As competition intensifies, high-frequency trading (HFT) has rapidly evolved. HFT uses computer algorithms to exploit short-term price patterns, involving extremely fast order placement, execution, and cancellation. It is fully automated, characterized by very high-volume trading and short-term holding periods, typically within microseconds. HFT has caught the attention of academics, practitioners, and market regulators, who are increasingly concerned about its impact on market quality []. Moreover, many studies point out that HFT would spreading investor sentiment, altering the trading dynamic []. Zhang (2010) posits that HFT has pernicious effects on U.S. capital markets, making stock prices overreact to fundamental news []. Jarrow and Protter (2012) suggest that HFT trading may drive market prices from fundamental values and cause greater volatility [].
In this section, we consider the effect of HFT trading on firm crash risk. We consider the HFT market size from 2006 to 2021 as a control variable (the HFT market size data were obtained from https://www.ibisworld.com/united-states/market-size/high-frequency-trading/4740/, accessed on 10 February 2025). Column (2) of Table 6 shows the relationship between and firm crash risk. After controlling the HFT market, we still find a negative impact of sentiment connectedness on crash risk. This result suggests that while HFT may impact market trading and investor sentiment, the contagion of investor sentiment remains a key factor influencing crash risk.
4.4. Comparison of Firms’ Individual Sentiment and the Sentiment Connectedness
We compare the impact of sentiment and its connectedness on crash risk in this part. Different from firms’ individual sentiment, connectedness focuses on the interdependence and co-movement among individual sentiments, which are more likely to happen during extreme conditions [,]. Therefore, we consider the influence of sentiment and its connectedness when sentiment is surging or declining.
We divide the whole sample into first and last 50% quantile sub-samples. Contrary to the whole sample, the upsurge and downsurge sentiment sub-samples show extreme conditions of firm sentiment, in which the connectedness is more likely to be contagious. We test the sentiment and its connectedness in the whole sample, the upsurge sub-sample and the downsurge sub-sample. We find that both the firm’s individual sentiment and the sentiment spillover network are significantly related to crash risk in whole samples. However, under extreme market conditions, groups (1) and (2) in Table 7 demonstrate that sentiment connectedness has a significant impact on crash risk. More importantly, we find that the influence of sentiment on crash risk is different in three sub-samples, and it is significant only when using a whole sample, which shows that sentiment is related to crash risk under normal market conditions. It reflects that the influence of investor sentiment in the upsurge and downsurge stages on crash risk mainly stems from sentiment connectedness.
Table 7.
Comparison of sentiment connectedness and sentiment.
These results show that sentiment connectedness is a better predictor of crash risk, especially during market extremes, which highlights the need to include sentiment connections in research models. During severe market stress, investor emotions become highly divided, causing investors to act similarly. This process quickly spreads sentiment shocks across the market [,]. As a result, the effect of sentiment changes on stock prices becomes weaker. However, when investor sentiment spreads through communication channels or media reports, it can infect other investors, increasing market sentiment volatility and making stock price swings bigger [].
4.5. Potential Channel Analysis
So far, our findings show a substantial positive correlation between sentiment connectedness and the likelihood of a stock market meltdown. In pursuit of a deeper understanding of the underlying potential channel that links sentiment connectedness and stock price crash risk, a moderating effect model is established as follows:
where represent the two mediators of synchronicity () and accounting conservatism (). The variable indicates the co-movement of firms and markets, which is used as a proxy for the quantity of firm-specific information contained in stock price for firm i in year t, and the variable indicates the accounting conservatism for firm i in year t, which uses the index developed by Khan and Watts (2009) [].
4.5.1. Moderation Effects of Stock Price Synchronicity
Building on the theoretical framework, our analysis reveals that firms with higher sentiment connectedness can rapidly access more impactful sentiment information compared to their peers. Specifically, hub companies mitigate stock price crash risk by reducing stock price synchronicity, enhancing information transparency, and curbing investor irrationality during extreme sentiment periods []. These mechanisms motivate the inclusion of stock price synchronicity as a mediating variable in our analysis. The empirical results are presented in Table 8.
Table 8.
The effect of sentiment network on crash risk under different conditions.
To uncover the moderating impact of stock price synchronism, we provide an interacting variable of the sentiment connectedness and stock price synchronicity (). Column (2) reveals that stock return synchronicity amplifies the influence of the sentiment connectedness on stock price crash risk. This may be due to the fact that companies with high stock price synchronization move in lockstep with the market, which reduces the transparency of firm-specificity information and raises the blindness in investing, and raises the influence of investor sentiment.
4.5.2. Moderation Effects of Accounting Conservatism (Cscore)
As executives may overstate performance or conceal bad news for compensation or career incentives [], firms accessible to extreme sentiment sooner face governance disadvantages during periods of heightened emotion. According to [,,], the supervision of irrational behavior by accounting proxy can reduce the concealment of “bad news” by company managers, thereby reducing the stock price risk of a company caused by the externalities effect of investors for extreme sentiment.
We seek to determine whether sentiment connectedness with a high Cscore increases the effect of information asymmetry on the risk of price collapses []. Therefore, we provide a interacting variable of the sentiment connectedness variable and Cscore (). As illustrated in Table 8, Column (3) presents the results when sentiment connectedness interacts with accounting conservatism (), and the significant negative coefficient of indicates that accounting conservatism can mitigate the effect of the sentiment connectedness on stock price crash risk. This could be because firms with high accounting conservatism have better ability to control excessive managerial self-interest, improve information symmetry, and lower illogical investment risk. Therefore, the accounting conservatism reduces the impact of irrational sentiment.
To examine whether sentiment connectedness exacerbates the effect of information asymmetry on crash risk [], we introduce an interaction term between sentiment connectedness () and accounting conservatism (). As shown in Table 8, Column (3) reports the results for this interaction model. The significantly negative coefficient on indicates that accounting conservatism mitigates the impact of sentiment connectedness on stock price crash risk. This finding can be attributed to firms with strong accounting conservatism having better capacity to constrain managerial opportunism, enhance information transparency, and reduce irrational investment behavior. By improving information quality, accounting conservatism thereby weakens the transmission of irrational sentiment across market participants.
4.6. Further Analyses
To further explore the positive relationship between sentiment connectedness and stock price crash risk, we conduct sub-sample regressions to examine how ownership structure and financial condition moderate this association after controlling for corporate governance variables.
4.6.1. The Effect of Shareholding Structure
We first examine firms’ shareholding structures as they form the foundation of corporate governance. Prior research has indicated that ownership concentration may help to alleviate agency conflicts between major and minority shareholders by enhancing informational asymmetry within firms []. Therefore, we define a high ownership concentration if a firm’s initial shareholder ratio is greater than 25%, and other firms have a low shareholding concentration. The results are presented in Table 9.
Table 9.
Heterogeneity analysis.
Columns (1) and (2) in Table 9 show that sentiment connectedness and crash risk are positively related at the 1% significance level in companies with low shareholding concentrations, while no relationship is observed for firms with high shareholding dispersion. This indicates that a low-concentrated shareholding structure strengthens the influence of spillover networks on firm crash risk. This can be explained by the fact that a low-concentrated structure is not conducive to disseminating firm-specific information, which could increase investor blindness and the probability of irrational behavior []. Such irrational sentiment may then cause dramatic swings in stock prices, thereby increasing crash risk.
4.6.2. The Effect of Financial Condition
The firm’s financial condition is our second measure of corporate governance. When a firm is in financial trouble, i.e., cash flow is insufficient, its earnings might not meet its investors’ expectations, which would result in a decline in its stock price and firm value []. Based on Zang (2012) [], we choose −2.675 as the boundary of financial distress, that is, above −2.675 indicates financial distress and below −2.675 indicates financial steadiness.
We show the results in Table 9. As illustrated in Table 9, Columns (3) and (4) suggest that the association between sentiment connectedness and crash risk is more prominent in financial-distress firms but not in financially sound firms. This result means that a sound financial condition decreases the effect of spillover networks on firm crash risk. This may be because investors are likely to pay more attention to the behavior of the executives of distressed companies. The management of distressed firms is inclined to manipulate earnings management to cover up the real situation of the firm’s fundamentals when investor sentiment becomes extreme []. This increases the opaque in such (distressed) firms, which would increases the crash proneness.
5. Conclusions
This paper examines how sentiment connectedness between firms impacts stock price crash risk. We argue that companies with higher connectedness have a higher ability to receive and disseminate sentiment, exacerbating investor’s blindness and irrationality. This can severely propagate behaviors like “herding effects” and “enthusiasm”, ultimately lead to price crashes. Controlling for other determinants, sentiment connectedness incrementally forecasts crash risk above other predictors. Furthermore, sentiment influences on crash risk during upturns and downturns appear driven by connectedness between firms. These findings prove robust to models incorporating synchronicity, accounting conservatism, and governance quality. Two-stage least squares estimation and propensity score matching address endogeneity concerns. We find that stock synchronicity amplifies connectedness’s effects on crash risk, while conservatism mitigates the effect. Finally, we analyze how ownership structure and financial distress moderate the relationship between sentiment connectedness and crash risk. This research sheds light on conditions influencing how sentiment disperses between firms and materializes in stock prices.
We contribute to understanding the role of sentiment connectedness in corporate governance and financial risk. By examining the relationship between firm-level sentiment contagion, accounting practices, and stock returns, we extend prior literature by identifying how sentiment connectivity influences stock price crash risk. Our findings highlight that sentiment spillover networks play a critical role in propagating crash risk, suggesting that these systemic linkages should be incorporated into risk management frameworks. Overall, this research deepens our understanding of how shared investor psychology and information diffusion through financial networks impact market outcomes. To mitigate crash risk, firms and regulators should prioritize monitoring sentiment connectedness alongside traditional risk measures.
Our study combines social networks with investor sentiment, presenting an innovative behavioral finance perspective. Theoretically, it pioneers a new approach to financial market analysis by focusing on investor sentiment interaction. First, investor interaction networks help us understand the relationship between information dissemination and market reactions. While behavioral finance focuses on how investors process information and make decisions, prior studies show that market sentiment and investor behavior are often influenced by external events and collective emotions, as demonstrated by Edmans et al. (2007) [] and Abudy et al. (2022) []. Social networks among investors provide a fast channel for information spread. Investor interaction networks enable public information to be quickly disseminated among investors, significantly enhancing the impact of information release (Cookson et al., 2024 []). Therefore, integrating social networks into behavioral finance allows for a more in-depth study of market responses to information.
Second, combining investor micro-behavioral characteristics with network structures helps us understand belief divergence and trading dynamics. In social networks, different investors’ interpretations and belief differences regarding the same information trigger trading behavior (Peng and Zhang, 2024 []). Using social network data, we can study the extent of belief divergence and its impact on trading volume and market liquidity. Through interactions in social networks, investors engage in social learning and continuously update their beliefs. This learning process is influenced by factors such as social network structure, information quality, and individual cognitive biases.
Lastly, social networks may spread misinformation or trigger overreactions, causing market prices to deviate from their true value, which is crucial for behavioral finance research. In practice, combining behavioral finance with social network analysis offers regulatory bodies enhanced market monitoring tools. By examining information flow and investor sentiment on social networks, regulators can promptly detect illegal activities like market manipulation and misinformation, ensuring market order. Moreover, this research aids in crafting sound policies to promote the healthy use of social networks in finance and protect investor interests.
This study offers crucial advice for investors. First, firms with high sentiment connectedness are more prone to stock price crashes. Retail investors can use sentiment connectedness metrics (e.g., ) to spot centrally positioned companies in sentiment networks, which may experience sharp price swings during market mood shifts. Our research also highlights the need for investors to be mindful of inter-firm sentiment spillovers. This implies that selecting unconnected stocks for sector-based asset allocation can reduce sentiment-linked risks. In short, our study shows that market sentiment contagion can trigger crash risks. Therefore, investors might need to use technical tools to monitor market sentiment or add low-correlated assets to their portfolios.
Author Contributions
Conceptualization, J.C., G.H. and Y.J.; methodology, J.C.; software, J.C.; validation, Y.J.; formal analysis, J.C. and G.H.; investigation, J.C. and Y.J.; resources, J.C.; data curation, J.C. and Y.J.; writing—original draft preparation, G.H.; writing—review and editing, J.C.; visualization, Y.J.; supervision, J.C. and G.H.; project administration, J.C. All authors have read and agreed to the published version of the manuscript.
Funding
This research was funded by the the China Postdoctoral Science Foundation (No. 2024M762372), the Project Supported by Scientific Research Fund of Hunan Provincial Education Department (No. 24C0146), and the Laboratory of Computation and Analytics of Complex Management Systems Open Foundation (No. 2024SKHX046).
Institutional Review Board Statement
Not applicable.
Data Availability Statement
The raw data supporting the conclusions of this article will be made available by the authors on request.
Conflicts of Interest
The authors declare no conflicts of interest.
Appendix A. Variable Measurement
| Variable | Definition |
| The negative coefficient of skewness, calculated by taking the negative of the third moment of firm-specific weekly returns for each year and dividing it by the cubic standard deviation of firm-specific weekly returns. See Equation (7). | |
| The other measurement of crash risk; we separate all the weeks with firm-specific weekly returns above the annual average (up weeks) from those with firm-specific returns below the annual mean (down weeks) and compute the standard deviation for each sub-sample. See Equation (8). | |
| The financial condition estimated following Li et al. (2017) []. See Appendix B for a more detailed explanation and calculate it with Equation (A2). | |
| The conservatism score estimated following Khan and Watts (2009) []. See Appendix B for a more detailed explanation and calculate it with Equation (A1). | |
| Measure of stock return synchronicity developed by Morck et al. (2000) []. See Appendix B for a more detailed explanation and calculate it with Equations (A3) and (A4). | |
| The natural logarithm of the company’ s total assets for each sample year. | |
| It refers to the book value of all liabilities divided by total assets at the end of a fiscal year. | |
| A ratio representing the efficiency of the use of shareholders’ funds. | |
| The market-to-book ratio of firm i in year t, that is, (market price at the end of fiscal year × number of shares outstanding + net asset value per share × number of non-tradable outstanding shares)/book value of equity. | |
| A measure of financial reporting opaqueness whose calculation is the 3-year moving sum of the absolute value of annual performance-adjusted discretionary accruals. | |
| It is a proxy for the level of investor disagreement whose calculation is the average monthly share turnover over the current fiscal year minus the average monthly share turnover over the previous year, where monthly share turnover is calculated as the monthly share-trading volume divided by the number of shares outstanding over the month. | |
| The HFT market size in the U.S. from the ISIB World website; the is measured by one thousand billion dollars. |
Appendix B. Corporate Governance and Synchronicity
Appendix B.1. Measurement of Firm-Specific Accounting Conservatism (Cscore)
We measure the degree of accounting conservatism for each sample and each firm using the firm-year conditional conservatism measure Cscore developed by Khan and Watts (2009) []. Concretely, to acquire the Cscore measure, we obtain the coefficients that are collated with conservatism by estimating the following regression, that is, , , , and at time t:
where is measured as , with is the stock price at the beginning of time t, and is the earnings per share measured by operating profit measured by the number of stocks outstanding. is the buy-and-hold yield, adjusted for the corresponding market return, from the fifth month after the end of fiscal year t to the fourth month of year t + 1, , where is the firm monthly return, including dividends, and is the monthly market value-weighted return. is a dummy variable, set to one if and to zero otherwise. is the natural log of the book value of total asserts. is the market-to-book ratio, and leverage is the liability-to-asset ratio. Then, we obtain a measure of firm-year conditional conservatism (Cscore), applying the following linear functions:
If a firm has a high Cscore, it is considered more conservative.
Appendix B.2. Measurement of Firm-Specific Financial Distress (Distress)
Many studies use the Z-score defined by Altman (1968) [], which is usually treated as the most widely used financial distress measure []. Zang (2012) [] modified the Z-score to proxy for a firm’s financial health. Following Zang (2012) [], we use the modified Z-score to measure financial distress:
where denotes financial distress, and is net profit over total assets. is sales over total assets; is retained earnings over total assets; is working capital over total assets and is the market value of equity over total liabilities. If is larger, the financial condition of firms is better. The is little, and the firm is in financial distress.
Appendix B.3. Measurement of Firm-Specific Stock Price Synchronicity
Stock synchronicity reflects information asymmetry between companies and investors. To measure stock price synchronicity, we first calculate the of company i in fiscal year t by using the regression of the market single-factor model [].
where is the return ratio of firm i in week t, and is the market capitalization weighted return ration in a week. The data selected here are mainly S&P 500 index data weighted by the floating market value. for each firm every year is obtained by regression. Since the range of is [0,1], following Morck et al. (2000) [], this paper defines the stock price synchronization index of the firm i at time t.
A high indicates that the firm is highly correlated with the market.
References
- Chong, E.; Ho, C.C.; Ong, Z.F.; Ong, H.H. Using news sentiment for economic forecasting: A Malaysian case study. In Machine Learning in Central Banking; Bank for International Settlements, Ed.; Volume 57 of IFC Bulletins Chapters; Bank for International Settlements: Basel, Switzerland, 2022. [Google Scholar]
- Correa, R.; Garud, K.; Londono, J.M.; Mislang, N. Sentiment in central banks’ financial stability reports. Rev. Financ. 2021, 25, 85–120. [Google Scholar]
- Bennani, H. Central bank communication in the media and investor sentiment. J. Econ. Behav. Organ. 2020, 176, 431–444. [Google Scholar]
- Jang, J.; Kang, J. Probability of price crashes, rational speculative bubbles, and the cross-section of stock returns. J. Financ. Econ. 2019, 132, 222–247. [Google Scholar] [CrossRef]
- Abakah, E.J.A.; Abdullah, M.; Yousaf, I.; Tiwari, A.K.; Li, Y. Economic sanctions news sentiments and global stock markets during the Russia-Ukraine conflict. J. Int. Financ. Mark. Inst. Money 2023, 91, 101910. [Google Scholar]
- Baker, M.; Wurgler, J. Investor sentiment in the stock market. J. Econ. Perspect. 2007, 21, 129–151. [Google Scholar] [CrossRef]
- OECD. Impacts of the Russian Invasion of Ukraine on Financial Market Conditions and Resilience; Technical Report; OECD Publishing: Paris, France, 2022. [Google Scholar] [CrossRef]
- Brandt, M.W.; Gao, L. Macro fundamentals or geopolitical events? A textual analysis of news events for crude oil. J. Empir. Financ. 2019, 51, 64–94. [Google Scholar]
- Wang, X.; Wu, Y.; Xu, W. Geopolitical risk and investment. J. Money Credit Bank. 2024, 56, 2023–2059. [Google Scholar]
- Welch, I. The wisdom of the robinhood crowd. J. Financ. 2022, 77, 1489–1527. [Google Scholar]
- Barberis, N.; Shleifer, A.; Vishny, R. A model of investor sentiment. J. Financ. Econ. 1998, 49, 307–343. [Google Scholar]
- Chang, X.; Chen, Y.; Zolotoy, L. Stock liquidity and stock price crash risk. J. Financ. Quant. Anal. 2017, 52, 1605–1637. [Google Scholar]
- Reichmann, D.; Möller, R.; Hertel, T. Nothing but good intentions: The search for equity and stock price crash risk. J. Bus. Econ. 2022, 92, 1455–1489. [Google Scholar] [CrossRef]
- West, K.D. Dividend innovations and stock price volatility. Econ. J. Econ. Soc. 1988, 56, 37–61. [Google Scholar] [CrossRef]
- Shiller, R.J. Market volatility and investor behavior. Am. Econ. Rev. 1990, 80, 58–62. [Google Scholar]
- Maxted, P. A macro-finance model with sentiment. Rev. Econ. Stud. 2023, 91, 438–475. [Google Scholar] [CrossRef]
- Kalyvas, A.; Papakyriakou, P.; Sakkas, A.; Urquhart, A. What drives bitcoin’s price crash risk? Econ. Lett. 2019, 191, 108777. [Google Scholar] [CrossRef]
- Chiu, C.J.; Harris, R.D.F.; Stoja, E.; Chin, M. Financial market volatility, macroeconomic fundamentals and investor sentiment. J. Bank. Financ. 2018, 92, 130–145. [Google Scholar] [CrossRef]
- Liang, W. Sensitivity to investor sentiment and stock performance of open market share repurchases. J. Bank. Financ. 2016, 71, 75–94. [Google Scholar] [CrossRef]
- Baker, M.; Wurgler, J.; Yuan, Y. Global, local, and contagious investor sentiment. J. Financ. Econ. 2012, 104, 272–287. [Google Scholar] [CrossRef]
- Han, M.; Zhou, J. Multi-Scale Characteristics of Investor Sentiment Transmission Based on Wavelet, Transfer Entropy and Network Analysis. Entropy 2022, 24, 1786. [Google Scholar] [CrossRef]
- Billio, M.; Getmansky, M.; Lo, A.W.; Pelizzon, L. Econometric measures of connectedness and systemic risk in the finance and insurance sectors. J. Financ. Econ. 2012, 104, 535–559. [Google Scholar] [CrossRef]
- Cao, J.; Wen, F.; Eugene, S.H. Measuring the systemic risk in indirect financial networks. Eur. J. Financ. 2022, 28, 1053–1098. [Google Scholar]
- El-Khatib, R.; Fogel, K.; Jandik, T. CEO network centrality and merger performance. J. Financ. Econ. 2015, 116, 349–382. [Google Scholar] [CrossRef]
- Baltakys, K.; Le Viet, H.; Kanniainen, J. Structure of Investor Networks and Financial Crises. Entropy 2021, 23, 381. [Google Scholar] [CrossRef]
- Gao, X.; Huang, S.; Sun, X.; Hao, X.; An, F. Modelling cointegration and Granger causality network to detect long-term equilibrium and diffusion paths in the financial system. R. Soc. Open Sci. 2018, 5, 172092. [Google Scholar] [PubMed]
- Chen, M.; Wang, Y.; Wu, B.; Huang, D. Dynamic Analyses of Contagion Risk and Module Evolution on the SSE A-Shares Market Based on Minimum Information Entropy. Entropy 2021, 23, 434. [Google Scholar] [CrossRef]
- Gong, X.-L.; Liu, J.-M.; Xiong, X.; Zhang, W. Research on stock volatility risk and investor sentiment contagion from the perspective of multi-layer dynamic network. Int. Rev. Financ. Anal. 2022, 84, 102359. [Google Scholar]
- Jackson, M.O. Social and Economic Networks; Princeton University Press: Princeton, NJ, USA, 2008; Volume 3. [Google Scholar]
- Pittman, J.; Wang, L.; Wu, D. Network analysis of audit partner rotation. Contemp. Account. Res. 2022, 39, 1085–1119. [Google Scholar]
- Janczewski, A.; Anagnostou, I.; Kandhai, D. Inferring Dealer Networks in the Foreign Exchange Market Using Conditional Transfer Entropy: Analysis of a Central Bank Announcement. Entropy 2024, 26, 738. [Google Scholar] [CrossRef]
- Goergen, M.; Renneboog, L.; Zhao, Y. Insider trading and networked directors. J. Corp. Financ. 2019, 56, 152–175. [Google Scholar]
- Kamate, V.; Kumar, A. Dealer networks, client sophistication and pricing in OTC derivatives. J. Int. Money Financ. 2024, 140, 102986. [Google Scholar]
- Gao, Q.; Fan, H.; Yu, C. Systemic Importance and Risk Characteristics of Banks Based on a Multi-Layer Financial Network Analysis. Entropy 2024, 26, 378. [Google Scholar] [CrossRef] [PubMed]
- Godigbe, B.G.; Chui, C.M.; Liu, C.L. Directors network centrality and earnings quality. Appl. Econ. 2018, 50, 5381–5400. [Google Scholar]
- Costenbader, E.; Valente, T.W. The stability of centrality measures when networks are sampled. Soc. Netw. 2003, 25, 283–307. [Google Scholar]
- Audrito, G.; Pianini, D.; Damiani, F.; Viroli, M. Aggregate centrality measures for IoT-based coordination. Sci. Comput. Program. 2021, 203, 102584. [Google Scholar]
- Yan, X.L.; Cui, Y.P.; Ni, S.J. Identifying influential spreaders in complex networks based on entropy weight method and gravity law. Chin. Phys. B 2020, 29, 048902. [Google Scholar]
- Hwang, C.L.; Yoon, K. Multiple Attribute Decision Making: Methods and Applications; Springer: New York, NY, USA, 1981. [Google Scholar]
- Yousaf, I.; Youssef, M.; Goodell, J.W. Quantile connectedness between sentiment and financial markets: Evidence from the S&P 500 twitter sentiment index. Int. Rev. Financ. Anal. 2022, 83, 102322. [Google Scholar]
- Daring, J.R. Crisis management in international business: Keys to effective decision making. Leadersh. Organ. Dev. J. 1994, 15, 3–8. [Google Scholar]
- Xu, N.; Li, X.; Yuan, Q.; Chan, K.C. Excess perks and stock price crash risk: Evidence from China. J. Corp. Financ. 2014, 25, 419–434. [Google Scholar]
- An, H.; Zhang, T. Stock price synchronicity, crash risk, and institutional investors. J. Corp. Financ. 2013, 21, 1–15. [Google Scholar]
- Durnev, A.; Morck, R.; Yeung, B.; Zarowin, P. Does greater firm-specific return variation mean more or less informed stock pricing? J. Account. Res. 2003, 41, 797–836. [Google Scholar]
- Kumar, A.; Lee, C.M.C. Retail investor sentiment and return comovements. J. Financ. 2006, 61, 2451–2486. [Google Scholar] [CrossRef]
- De, L.J.B.; Shleifer, A.; Summers, L.H. Noise trader risk in financial markets. J. Political Econ. 1990, 98, 703–738. [Google Scholar]
- Han, B. Investor sentiment and option prices. Rev. Financ. Stud. 2008, 21, 387–414. [Google Scholar] [CrossRef]
- Pham, M.D.M.; Nguyen, T.H. When a gift resembles a trojan horse: CEO stock gift and stock price crash risk. Br. Account. Rev. 2023, 56, 101235. [Google Scholar] [CrossRef]
- Li, D.; Xing, L.; Zhao, Y. Does extended auditor disclosure deter managerial bad-news hoarding? Evidence from crash risk. J. Corp. Financ. 2022, 76, 102256. [Google Scholar] [CrossRef]
- Boubaker, S.; Mansali, H.; Rjiba, H. Large controlling shareholders and stock price synchronicity. J. Bank. Financ. 2014, 40, 80–96. [Google Scholar] [CrossRef]
- Baker, M.; Stein, J.C. Market liquidity as a sentiment indicator. J. Financ. Mark. 2004, 7, 271–299. [Google Scholar] [CrossRef]
- Peng, L.; Zhang, L. Unleashing the crowd: The effect of social networks in crowdfunding markets. Manag. Sci. 2024. [Google Scholar] [CrossRef]
- Duan, J.; Lin, J. The impact of COVID-19 on the crash risk of registered new shares in China. Pac. Basin Financ. J. 2023, 79, 102037. [Google Scholar] [CrossRef]
- Zhang, P.; Yin, S.; Sha, Y. Global systemic risk dynamic network connectedness during the COVID-19: Evidence from nonlinear Granger causality. J. Int. Financ. Mark. Inst. Money 2023, 85, 101783. [Google Scholar] [CrossRef]
- Broock, W.A.; Scheinkman, J.A.; Dechert, W.D.; LeBaron, B. A test for independence based on the correlation dimension. Econ. Rev. 1996, 15, 197–235. [Google Scholar] [CrossRef]
- Diks, C.; Panchenko, V. A new statistic and practical guidelines for nonparametric Granger causality testing. J. Econ. Dyn. Control 2006, 30, 1647–1669. [Google Scholar]
- Yu, J.W.; Xie, W.J.; Jiang, Z.Q. Early warning model based on correlated networks in global crude oil markets. Phys. A Stat. Mech. Its Appl. 2018, 490, 1335–1343. [Google Scholar]
- Bonacich, P. Some unique properties of eigenvector centrality. Soc. Netw. 2007, 29, 555–564. [Google Scholar]
- Callen, J.L.; Fang, X. Institutional investor stability and crash risk: Monitoring versus short-termism? J. Bank. Financ. 2013, 37, 3047–3063. [Google Scholar]
- Kim, Y.; Li, H.; Li, S. Corporate social responsibility and stock price crash risk. J. Bank. Financ. 2014, 43, 1–13. [Google Scholar]
- Huynh, T.L.D.; Foglia, M.; Nasir, M.A.; Angelini, E. Feverish sentiment and global equity markets during the COVID-19 pandemic. J. Econ. Behav. Organ. 2021, 188, 1088–1108. [Google Scholar] [CrossRef]
- Wang, W.; Su, C.; Duxbury, D. The conditional impact of investor sentiment in global stock markets: A two-channel examination. J. Bank. Financ. 2022, 138, 106458. [Google Scholar]
- Cardellichio, P.A. Estimation of production behavior using pooled microdata. Rev. Econ. Stat. 1990, 72, 11–18. [Google Scholar]
- Owusu-Gyapong, A. Alternative estimating techniques for panel data on strike activity. Rev. Econ. Stat. 1986, 228, 526–531. [Google Scholar]
- Bergman, N.K.; Roychowdhury, S. Investor sentiment and corporate disclosure. J. Account. Res. 2008, 46, 1057–1083. [Google Scholar] [CrossRef]
- Hao, J.; Xiong, X. Retail investor attention and firms’ idiosyncratic risk: Evidence from China. Int. Rev. Financ. Anal. 2021, 74, 101675. [Google Scholar]
- Bustamante, M.C.; Frésard, L. Does firm investment respond to peers’ investment? Manag. Sci. 2021, 67, 4703–4724. [Google Scholar]
- Chen, Y.-W.; Chan, K.; Chang, Y. Peer effects on corporate cash holdings. Int. Rev. Econ. Financ. 2019, 61, 213–227. [Google Scholar]
- Mugerman; Yevgeny; Orly, S.; Moses, S. Long term savings decisions: Financial reform, peer effects and ethnicity. J. Econ. Behav. Organ. 2014, 106, 235–253. [Google Scholar] [CrossRef]
- Kaustia, M.; Rantala, V. Social learning and corporate peer effects. J. Financ. Econ. 2015, 117, 653–669. [Google Scholar]
- Ben, A.I.; Slaheddine, H. High-frequency trading, stock volatility, and intraday crashes. Q. Rev. Econ. Financ. 2022, 84, 337–344. [Google Scholar]
- Cai, Y.; Tang, Z.; Chen, Y. Can real-time investor sentiment help predict the high-frequency stock returns? Evidence from a mixed-frequency-rolling decomposition forecasting method. N. Am. J. Econ. Financ. 2024, 72, 102147. [Google Scholar]
- Zhang, F. High-Frequency Trading, Stock Volatility, and Price Discovery. 2010. Available online: https://papers.ssrn.com/sol3/papers.cfm?abstract_id=1691679 (accessed on 10 February 2025).
- Jarrow, A.R.; Protter, P. A dysfunctional role of high frequency trading in electronic markets. Int. J. Theor. Appl. Financ. 2012, 15, 1250022. [Google Scholar] [CrossRef]
- Palomino, F.; Renneboog, L.; Zhang, C. Information salience, investor sentiment, and stock returns: The case of British soccer betting. J. Corp. Financ. 2009, 185, 368–387. [Google Scholar]
- Mathijs, C.; Rik, F. Salience theory and stock prices: Empirical evidence. J. Financ. Econ. 2021, 140, 460–483. [Google Scholar]
- Khan, M.; Watts, R.L. Estimation and empirical properties of a firm-year measure of accounting conservatism. J. Account. Econ. 2009, 48, 132–150. [Google Scholar] [CrossRef]
- Kim, J.B.; Wang, Z.; Zhang, L. CEO overconfidence and stock price crash risk. Contemp. Account. Res. 2016, 33, 1720–1749. [Google Scholar]
- Shleifer, A.; Vishny, R.W. Large shareholders and corporate control. J. Political Econ. 1986, 94 Pt 1, 461–488. [Google Scholar]
- Li, Y.; Li, X.; Xiang, E.; Djajadikerta, H.G. Financial distress, internal control, and earnings management: Evidence from China. J. Contemp. Account. Econ. 2020, 16, 100210. [Google Scholar] [CrossRef]
- Zang, A.Y. Evidence on the trade-off between real activities manipulation and accrual-based earnings management. Account. Rev. 2012, 87, 675–703. [Google Scholar] [CrossRef]
- Li, X.; Wang, S.S.; Wang, X. Trust and stock price crash risk: Evidence from China. J. Bank. Financ. 2017, 76, 74–91. [Google Scholar]
- Edmans, A.; Garcia, D.; Norli, Ø. Sports sentiment and stock returns. J. Financ. 2007, 62, 1967–1998. [Google Scholar]
- Abudy, M.M.; Mugerman, Y.; Shust, E. The winner Takes it all: Investor sentiment and the Eurovision Song Contest. J. Bank. Financ. 2022, 137, 106432. [Google Scholar]
- Cookson, J.A.; Lu, R.; Mullins, W.; Niessner, M. The social signal. J. Financ. Econ. 2024, 158, 103870. [Google Scholar] [CrossRef]
- Morck, R.; Yeung, B.; Yu, W. The information content of stock markets: Why do emerging markets have synchronous stock price movements? J. Financ. Econ. 2000, 58, 215–260. [Google Scholar]
- Altman, E.I. Financial ratios, discriminant analysis and the prediction of corporate bankruptcy. J. Financ. 1968, 23, 589–609. [Google Scholar]
- Bugeja, M.; Czernkowski, R.; Moran, D. The impact of the management approach on segment reporting. J. Bus. Financ. Account. 2015, 42, 310–366. [Google Scholar]
- Chan, K.; Hameed, A. Stock price synchronicity and analyst coverage in emerging markets. J. Financ. Econ. 2006, 80, 115–147. [Google Scholar]
Disclaimer/Publisher’s Note: The statements, opinions and data contained in all publications are solely those of the individual author(s) and contributor(s) and not of MDPI and/or the editor(s). MDPI and/or the editor(s) disclaim responsibility for any injury to people or property resulting from any ideas, methods, instructions or products referred to in the content. |
© 2025 by the authors. Licensee MDPI, Basel, Switzerland. This article is an open access article distributed under the terms and conditions of the Creative Commons Attribution (CC BY) license (https://creativecommons.org/licenses/by/4.0/).