
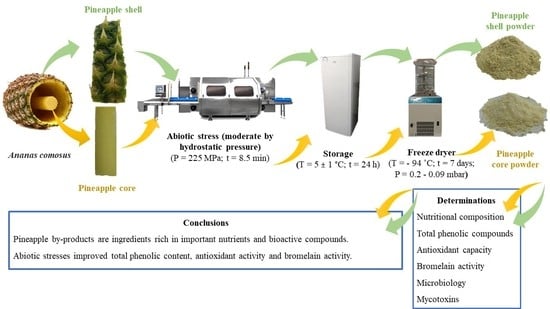
Pineapple (Ananas comosus L.) By-Products Valorization: Novel Bio Ingredients for Functional Foods

 , , , , , and
Abstract
:
1. Introduction
2. Results and Discussion
2.1. Color Measurement
2.2. Chemical and Physical Characterization
2.3. Total Phenolic Content and Antioxidant Activity (DPPH, FRAP, and ABTS)
2.4. Bromelain Activity
2.5. Microbiology (Aerobic Colony Counts, Yeasts, and Moulds)
2.6. Mycotoxins
3. Materials and Methods
3.1. Sample Preparation
3.2. Analytical Methods
3.2.1. Color
3.2.2. Moisture Content and Water Activity (aw)
3.2.3. Caloric Value
3.2.4. Protein
3.2.5. Carbohydrates
3.2.6. Dietary Fiber
3.2.7. Ash Content
3.2.8. Minerals
3.2.9. Pineapple Extract Preparation for Total Phenolic Content and Antioxidant Activity
Total Phenolic Content (TPC)
Antioxidant Activity (DPPH, FRAP, and ABTS)
3.2.10. Bromelain Activity
3.2.11. Microbiological Analysis (Aerobic Colony Count, Yeasts and Molds)
3.2.12. Mycotoxins
Aflatoxins and Ochratoxin A
Patulin
3.3. Data Interpretation and Analysis
4. Conclusions
Author Contributions
Funding
Institutional Review Board Statement
Informed Consent Statement
Data Availability Statement
Acknowledgments
Conflicts of Interest
Sample Availability
References
- Antoniolli, L.R.; Benedetti, B.C.; Souza Filho, M.S.M.; Borges, M.F. Avaliação da vanilina como agente antimicrobiano em abacaxi “Pérola” minimamente processado. Ciênc. Tecnol. Aliment. 2004, 24, 473–477. [Google Scholar] [CrossRef] [Green Version]
- Hossain, M.A.; Rahman, S.M.M. Total phenolics, flavonoids and antioxidant activity of tropical fruit pineapple. Food Res. Int. 2011, 44, 672–676. [Google Scholar] [CrossRef]
- Hossain, M.F. Nutritional Value and Medicinal Benefits of Pineapple. Int. J. Nutr. Food Sci. 2015, 4, 84. [Google Scholar] [CrossRef]
- Debnath, P.; Dey, P.; Chanda, A.; Bhakta, T. A Survey on Pineapple and its medicinal value. Sch. Acad. J. Pharm. 2012, 1, 24–29. [Google Scholar]
- Corzo, C.A.; Waliszewski, K.N.; Welti-Chanes, J. Pineapple fruit bromelain affinity to different protein substrates. Food Chem. 2012, 133, 631–635. [Google Scholar] [CrossRef]
- Chakraborty, S.; Rao, P.S.; Mishra, H.N. Empirical model based on Weibull distribution describing the destruction kinetics of natural microbiota in pineapple (Ananas comosus L.) puree during high-pressure processing. Int. J. Food Microbiol. 2015, 211, 117–127. [Google Scholar] [CrossRef]
- Chakraborty, A.J.; Mitra, S.; Tallei, T.E.; Tareq, A.M.; Nainu, F.; Cicia, D.; Dhama, K.; Emran, T.B.; Simal-Gandara, J.; Capasso, R. Bromelain a Potential Bioactive Compound: A Comprehensive Overview from a Pharmacological Perspective. Life 2021, 11, 317. [Google Scholar] [CrossRef]
- Santos, D.I.; Correia, M.J.N.; Mateus, M.M.; Saraiva, J.A.; Vicente, A.A.; Moldão, M. Fourier transform infrared (FT-IR) spectroscopy as a possible rapid tool to evaluate abiotic stress effects on pineapple by-products. Appl. Sci. 2019, 9, 4141. [Google Scholar] [CrossRef] [Green Version]
- Chobotova, K.; Vernallis, A.B.; Majid, F.A.A. Bromelain’s activity and potential as an anti-cancer agent: Current evidence and perspectives. Cancer Lett. 2010, 290, 148–156. [Google Scholar] [CrossRef] [PubMed]
- Ketnawa, S.; Chaiwut, P.; Rawdkuen, S. Extraction of bromelain from pineapple peels. Food Sci. Technol. Int. 2011, 17, 395–402. [Google Scholar] [CrossRef]
- Santos, D.I.; Pinto, C.A.; Corrêa-Filho, L.C.; Saraiva, J.A.; Vicente, A.A.; Moldão-Martins, M. Effect of moderate hydrostatic pressures on the enzymatic activity and bioactive composition of pineapple by-products. J. Food Process. Eng. 2020, e13537. [Google Scholar] [CrossRef]
- Santos, D.I.; Fraqueza, M.J.; Pissarra, H.; Saraiva, J.A.; Vicente, A.A.; Moldão-Martins, M. Optimization of the Effect of Pineapple By-Products Enhanced in Bromelain by Hydrostatic Pressure on the Texture and Overall Quality of Silverside Beef Cut. Foods 2020, 9, 1752. [Google Scholar] [CrossRef] [PubMed]
- Maurer, H.R. Bromelain: Biochemistry, pharmacology and medical use. Cell. Mol. Life Sci. 2001, 58, 1234–1245. [Google Scholar] [CrossRef] [PubMed]
- Ketnawa, S.; Chaiwut, P.; Rawdkuen, S. Pineapple wastes: A potential source for bromelain extraction. Food Bioprod. Process. 2012, 90, 385–391. [Google Scholar] [CrossRef]
- Banerjee, S.; Ranganathan, V.; Patti, A.; Arora, A. Valorisation of pineapple wastes for food and therapeutic applications. Trends Food Sci. Technol. 2018, 82, 60–70. [Google Scholar] [CrossRef]
- de Toledo, N.M.V.; Nunes, L.P.; da Silva, P.P.M.; Spoto, M.H.F.; Canniatti-Brazaca, S.G. Influence of pineapple, apple and melon by-products on cookies: Physicochemical and sensory aspects. Int. J. Food Sci. Technol. 2017, 52, 1185–1192. [Google Scholar] [CrossRef]
- De Freitas Borghi, D.; Guirardello, R.; Filho, L.C. Storage logistics of fruits and vegetables: Effect of temperature. Chem. Eng. Trans. 2009, 17, 951–956. [Google Scholar]
- Mirabella, N.; Castellani, V.; Sala, S. Current options for the valorization of food manufacturing waste: A review. J. Clean. Prod. 2014, 65, 28–41. [Google Scholar] [CrossRef] [Green Version]
- Campos, D.A.; Gómez-García, R.; Vilas-Boas, A.A.; Madureira, A.R.; Pintado, M.M. Management of fruit industrial by-products—a case study on circular economy approach. Molecules 2020, 25, 320. [Google Scholar] [CrossRef] [Green Version]
- Winkler, H. Closed-loop production systems—A sustainable supply chain approach. CIRP J. Manuf. Sci. Technol. 2011, 4, 243–246. [Google Scholar] [CrossRef]
- Megías-Pérez, R.; Gamboa-Santos, J.; Soria, A.C.; Villamiel, M.; Montilla, A. Survey of quality indicators in commercial dehydrated fruits. Food Chem. 2014, 150, 41–48. [Google Scholar] [CrossRef]
- Hernández-Alonso, P.; Camacho-Barcia, L.; Bulló, M.; Salas-Salvadó, J. Nuts and dried fruits: An update of their beneficial effects on type 2 diabetes. Nutrients 2017, 9, 673. [Google Scholar] [CrossRef] [Green Version]
- Abreu, J.M.; Bruno-Soares, A.M.; Calouro, F. Intake and Nutritive Value of Mediterranean Forages & Diets: 20 Years of Experimental Data; Instituto Superior de Agronomia: Lisboa, Portugal, 2000; ISBN 972-98085-5-4. [Google Scholar]
- Selani, M.M.; Brazaca, S.G.C.; Dos Santos Dias, C.T.; Ratnayake, W.S.; Flores, R.A.; Bianchini, A. Characterisation and potential application of pineapple pomace in an extruded product for fibre enhancement. Food Chem. 2014, 163, 23–30. [Google Scholar] [CrossRef] [PubMed] [Green Version]
- Martínez, R.; Torres, P.; Meneses, M.A.; Figueroa, J.G.; Pérez-Álvarez, J.A.; Viuda-Martos, M. Chemical, technological and in vitro antioxidant properties of mango, guava, pineapple and passion fruit dietary fibre concentrate. Food Chem. 2012, 135, 1520–1526. [Google Scholar] [CrossRef] [PubMed]
- Aruna, T.E. Production of value-added product from pineapple peels using solid state fermentation. Innov. Food Sci. Emerg. Technol. 2019, 57, 102193. [Google Scholar] [CrossRef]
- Roda, A.; Lambri, M. Food uses of pineapple waste and by-products: A review. Int. J. Food Sci. Technol. 2019, 54, 1009–1017. [Google Scholar] [CrossRef]
- Kadam, D.M.; Wilson, R.A.; Kaur, V.; Chadha, S.; Kaushik, P.; Kaur, S.; Patil, R.T.; Rai, D.R. Physicochemical and microbial quality evaluation of foam-mat-dried pineapple powder. Int. J. Food Sci. Technol. 2012, 47, 1654–1659. [Google Scholar] [CrossRef]
- Campos, D.A.; Ribeiro, T.B.; Teixeira, J.A.; Pastrana, L.; Pintado, M.M. Integral valorization of pineapple (Ananas comosus L.) By-products through a green chemistry approach towards Added Value Ingredients. Foods 2020, 9, 60. [Google Scholar] [CrossRef] [Green Version]
- Huang, Y.L.; Chow, C.J.; Fang, Y.J. Preparation and physicochemical properties of fiber-rich fraction from pineapple peels as a potential ingredient. J. Food Drug Anal. 2011, 19, 318–323. [Google Scholar]
- Wennberg, M.; Nyman, M. On the possibility of using high pressure treatment to modify physico-chemical properties of dietary fibre in white cabbage (Brassica oleracea var. capitata). Innov. Food Sci. Emerg. Technol. 2004, 5, 171–177. [Google Scholar] [CrossRef]
- Hemalatha, R.; Anbuselvi, S. Physicohemical constituents of pineapple pulp and waste. J. Chem. Pharm. Res. 2013, 5, 240–242. [Google Scholar]
- Khedkar, M.A.; Nimbalkar, P.R.; Gaikwad, S.G.; Chavan, P.V.; Bankar, S.B. Sustainable biobutanol production from pineapple waste by using Clostridium acetobutylicum B 527: Drying kinetics study. Bioresour. Technol. 2017, 225, 359–366. [Google Scholar] [CrossRef] [Green Version]
- Brito, T.B.N.; Pereira, A.P.A.; Pastore, G.M.; Moreira, R.F.A.; Ferreira, M.S.L.; Fai, A.E.C. Chemical composition and physicochemical characterization for cabbage and pineapple by-products flour valorization. LWT 2020, 124, 109028. [Google Scholar] [CrossRef]
- Pardo, M.E.S.; Cassellis, M.E.R.; Escobedo, R.M.; García, E.J. Chemical Characterisation of the Industrial Residues of the Pineapple (Ananas comosus). J. Agric. Chem. Environ. 2014, 3, 53–56. [Google Scholar] [CrossRef] [Green Version]
- Prasad, N.N.; Siddalingaswamy, M.; Parameswariah, P.M.; Radhakrishna, K.; Rao, R.V.; Viswanathan, K.R.; Santhanam, K. Proximate and mineral composition of some processed traditional and popular Indian dishes. Food Chem. 2000, 68, 87–94. [Google Scholar] [CrossRef]
- e Chiocchetti, G.D.M.; De Nadai Fernandes, E.A.; Bacchi, M.A.; Pazim, R.A.; Sarriés, S.R.V.; Tomé, T.M. Mineral composition of fruit by-products evaluated by neutron activation analysis. J. Radioanal. Nucl. Chem. 2013, 297, 399–404. [Google Scholar] [CrossRef]
- Chaurasiya, R.S.; Umesh Hebbar, H. Extraction of bromelain from pineapple core and purification by RME and precipitation methods. Sep. Purif. Technol. 2013, 111, 90–97. [Google Scholar] [CrossRef]
- Jacobo-Velázquez, D.A.; Cisneros-Zevallos, L. An Alternative Use of Horticultural Crops: Stressed Plants as Biofactories of Bioactive Phenolic Compounds. Agriculture 2012, 2, 259–271. [Google Scholar] [CrossRef] [Green Version]
- Gugliucci, A.; Bastos, D.H.M.; Schulze, J.; Souza, M.F.F. Caffeic and chlorogenic acids in Ilex paraguariensis extracts are the main inhibitors of AGE generation by methylglyoxal in model proteins. Fitoterapia 2009, 80, 339–344. [Google Scholar] [CrossRef] [PubMed]
- Alegria, C.; Pinheiro, J.; Duthoit, M.; Gonçalves, E.M.; Moldão-Martins, M.; Abreu, M. Fresh-cut carrot (cv. Nantes) quality as affected by abiotic stress (heat shock and UV-C irradiation) pre-treatments. LWT Food Sci. Technol. 2012, 48, 197–203. [Google Scholar] [CrossRef]
- Reyes, L.F.; Cisneros-Zevallos, L. Wounding stress increases the phenolic content and antioxidant capacity of purple-flesh potatoes (Solanum tuberosum L.). J. Agric. Food Chem. 2003, 51, 5296–5300. [Google Scholar] [CrossRef]
- Lu, X.H.; Sun, D.Q.; Wu, Q.S.; Liu, S.H.; Sun, G.M. Physico-chemical properties, antioxidant activity and mineral contents of pineapple genotypes grown in China. Molecules 2014, 19, 8518–8532. [Google Scholar] [CrossRef]
- Paz, M.; Gúllon, P.; Barroso, M.F.; Carvalho, A.P.; Domingues, V.F.; Gomes, A.M.; Becker, H.; Longhinotti, E.; Delerue-Matos, C. Brazilian fruit pulps as functional foods and additives: Evaluation of bioactive compounds. Food Chem. 2015, 172, 462–468. [Google Scholar] [CrossRef] [Green Version]
- Rodríguez, Ó.; Gomes, W.; Rodrigues, S.; Fernandes, F.A.N. Effect of acoustically assisted treatments on vitamins, antioxidant activity, organic acids and drying kinetics of pineapple. Ultrason. Sonochem. 2017, 35, 92–102. [Google Scholar] [CrossRef] [PubMed]
- INSA. Interpretação dos resultados de ensaios microbiológicos em alimentos prontos para consumo e em superfícies do ambiente de produção e distribuição alimentar: Valores-guia. Inst. Nac. Saude Doutor Ricardo Jorge 2019, 1–42. Available online: http://www.insa.min-saude.pt/wp-content/uploads/2019/12/INSA_Valores-guia.pdf (accessed on 15 April 2021).
- CE 1811/2006 REGULAMENTO (CE) DA COMISSÃO de 19 de Dezembro de 2006 que Fixa os Teores Máximos de Certos Contaminantes Presentes nos Géneros Alimentícios. 2006. No. 1881/2006. Available online: https://eur-lex.europa.eu/LexUriServ/LexUriServ.do?uri=OJ:L:2006:364:0005:0024:PT:PDF (accessed on 15 April 2021).
- Sandoval-Contreras, T.; Villarruel-López, A.; Sierra-Beltrán, A.P.; Torres-Vitela, R.; Ascencio, F. Effect of pH and temperature in production of mycotoxins and antibiotics by phytopathogenic moulds for Persian lime (Citrus latifolia T.) in a complex lime pericarp-base medium. Emir. J. Food Agric. 2017, 29, 751–759. [Google Scholar] [CrossRef] [Green Version]
- Sanzani, S.M.; Reverberi, M.; Geisen, R. Mycotoxins in harvested fruits and vegetables: Insights in producing fungi, biological role, conducive conditions, and tools to manage postharvest contamination. Postharvest Biol. Technol. 2016, 122, 95–105. [Google Scholar] [CrossRef]
- Martins, C.F.; Assunção, J.P.; Santos, D.M.R.; Madeira, M.S.M.S.; Alfaia, C.M.R.P.M.; Lopes, P.A.A.B.; Coelho, D.F.M.; Lemos, J.P.C.; de Almeida, A.M.; Prates, J.A.M.; et al. Effect of dietary inclusion of Spirulina on production performance, nutrient digestibility and meat quality traits in post-weaning piglets. J. Anim. Physiol. Anim. Nutr. 2020, 105, 247–259. [Google Scholar] [CrossRef]
- AOAC. Official Methods of Analysis of AOAC International, 18th ed.; AOAC International: Gaithersburg, MD, USA, 2000; ISBN 0935584544. [Google Scholar]
- Chow, P.S.; Landhäusser, S.M. A method for routine measurements of total sugar and starch content in woody plant tissues. Tree Physiol. 2004, 24, 1129–1136. [Google Scholar] [CrossRef]
- AOAC. AOAC Official Method 991.43 Total, Soluble and Insoluble Dietary Fiber in Foods, 16th ed.; AOAC International: Gaithersburg, MD, USA, 1998. [Google Scholar]
- Swain, T.; Hillis, W.E. The phenolic constituents of Prunus domestica. I.—The quantitative analysis of phenolic constituents. J. Sci. Food Agric. 1959, 10, 63–68. [Google Scholar] [CrossRef]
- Heredia, J.B.; Cisneros-Zevallos, L. The effect of exogenous ethylene and methyl jasmonate on pal activity, phenolic profiles and antioxidant capacity of carrots (Daucus carota) under different wounding intensities. Postharvest Biol. Technol. 2009, 51, 242–249. [Google Scholar] [CrossRef]
- Brand-Williams, W.; Cuvelier, M.E.; Berset, C. Use of a free radical method to evaluate antioxidant activity. LWT Food Sci. Technol. 1995, 28, 25–30. [Google Scholar] [CrossRef]
- Benzie, I.F.F.; Strain, J.J. The ferric reducing ability of plasma (FRAP) as a measure of “antioxidant power”: The FRAP assay. Anal. Biochem. 1996, 239, 70–76. [Google Scholar] [CrossRef] [PubMed] [Green Version]
- Re, R.; Pellegrini, N.; Proteggente, A.; Pannala, A.; Yang, M.; Rice-Evans, C. Antioxidant activity applying an improved ABTS radical cation decolorization assay. Free Radic. Biol. Med. 1999, 26, 1231–1237. [Google Scholar] [CrossRef]
- Rufino, M.S.M.; Alves, R.E.; De Brito, E.S.; De Morais, S.M.; Sampaio, C.G.; Pérez-Jiménez, J.; Saura-Calixto, F.D. Metodologia Científica: Determinação da Atividade Antioxidante Total em Frutas pela Captura do Radical Livre ABTS+; Embrapa Agroindústria Tropical: Fortaleza, Brazil, 2007. [Google Scholar]
- Chakraborty, S.; Rao, P.S.; Mishra, H.N. Effect of pH on Enzyme inactivation kinetics in high-pressure processed pineapple (Ananas comosus L.) puree using response surface methodology. Food Bioprocess. Technol. 2014, 7, 3629–3645. [Google Scholar] [CrossRef]
- ISO. ISO 6887-1 Microbiology of the Food Chain—Preparation of Test Samples, Initial Suspension and Decimal Dilutions for Microbiological Examination—Part 1: General Rules for the Preparation of the Initial Suspension and Decimal Dilutions (ISO 6887-1:2017); International Organization for Standardization: Geneva, Switzerland, 2017. [Google Scholar]
- ISO. ISO 4833 Microbiology of Food and Animal Feeding Stuffs—Horizontal Method for the Enumeration of Microorganisms—Colony-count Technique at 30 °C; International Organization for Standardization: Geneva, Switzerland, 2003; Volume 3. [Google Scholar]
- ISO. ISO 21527-2 Microbiology of Food and Animal Feeding Stuffs—Horizontal Method for the Enumeration of Yeasts and Moulds—Part 2: Colony Count Technique in Products with Water Activity Less than or Equal to 0.95; International Organization for Standardization: Geneva, Switzerland, 2008; ISBN 9782832205181. [Google Scholar]
- Martins, C.; Assunção, R.; Cunha, S.C.; Fernandes, J.O.; Jager, A.; Petta, T.; Oliveira, C.A.; Alvito, P. Assessment of multiple mycotoxins in breakfast cereals available in the Portuguese market. Food Chem. 2018, 239, 132–140. [Google Scholar] [CrossRef]
- Sizoo, E.A.; Van Egmond, H.P. Analysis of duplicate 24-hour diet samples for aflatoxin B1, aflatoxin M1 and ochratoxin A. Food Addit. Contam. 2005, 22, 163–172. [Google Scholar] [CrossRef] [PubMed]
- Barreira, M.J.; Alvito, P.C.; Almeida, C.M.M. Occurrence of patulin in apple-based-foods in Portugal. Food Chem. 2010, 121, 653–658. [Google Scholar] [CrossRef]
- Arranz, I.; Derbyshire, M.; Kroeger, K.; Mischke, C.; Stroka, J.; Anklam, E.; Biselli, S.; Boonzaaijer, G.; Burdaspal, P.; Castillo, M.; et al. Liquid chromatographic method for quantitation of patulin at 10 ng/mL in apple-based products intended for infants: Interlaboratory study. J. AOAC Int. 2005, 88, 518–525. [Google Scholar] [CrossRef] [PubMed] [Green Version]
- StatSoft Statistica. Data Analysis Software System; StatSoft Inc.: Tulsa, OK, USA, 2007. [Google Scholar]


| Color | PS | PPS | PC | PPC |
|---|---|---|---|---|
| L* | 79.91 ± 1.02 a | 79.49 ± 0.83 a | 90.44 ± 0.34 A | 89.44 ± 1.61 A |
| a* | −2.61 ± 0.36 a | −2.07 ± 0.16 b | −1.94 ± 0.13 A | −2.09 ± 0.23 A |
| b* | 25.46 ± 0.36 a | 25.99 ± 0.97 a | 23.22 ± 0.56 A | 24.80 ± 0.77 B |
| Photography | 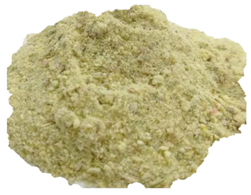 | 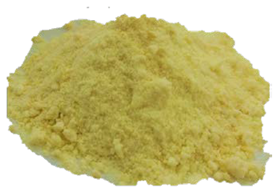 | ||
| PS | PC | |||
|---|---|---|---|---|
| Moisture (g.100 g−1) | 5.50 ± 0.28 a | 7.96 ± 0.17 b | ||
| Water activity | 0.264 ± 0.004 a | 0.299 ± 0.011 b | ||
| Caloric value (kcal.100 g−1 dry matter) | 374.52 ± 1.83 b | 363.89 ± 3.90 a | ||
| Protein | (g.100 g−1 dry matter) | 3.86 ± 0.10 b | 2.71 ± 0.20 a | |
| Carbohydrates | 66.44 ± 6.29 a | 87.58 ± 3.37 b | ||
| Ash | 4.23 ± 0.13 a | 4.83 ± 0.28 b | ||
| Dietary fiber | Insoluble | 28.82 ± 1.58 b | 16.17 ± 1.20 a | |
| Soluble | 3.63 ± 0.13 b | 1.53 ± 0.46 a | ||
| Total | 32.42 ± 1.55 b | 17.70 ± 1.45 a | ||
| Minerals | (mg·kg−1 dry matter) | Sodium | 277.87 ± 22.07 a | 266.24 ± 8.55 a |
| Potassium | 9997.69 ± 108.13 a | 12089.92 ± 93.91 b | ||
| Calcium | 1592.45 ± 80.18 b | 375.65 ± 43.22 a | ||
| Magnesium | 784.71 ± 13.87 a | 964.45 ± 11.71 b | ||
| Phosphorus | 1552.87 ± 8.37 b | 545.17 ± 8.84 a | ||
| Sulphur | 1183.92 ± 19.18 b | 601.98 ± 3.48 a | ||
| Iron | 32.79 ± 2.84 b | 19.44 ± 0.68 a | ||
| Copper | 5.16 ± 0.78 a | 5.80 ± 0.34 a | ||
| Zinc | 8.91 ± 0.04 b | 1.81 ± 0.05 a | ||
| Manganese | 34.97 ± 1.06 b | 21.90 ± 0.59 a | ||
| Boron | 6.66 ± 0.66 b | 2.75 ± 0.37 a | ||
| Samples | Aerobic Colony Count (CFU·g−1) | Mould Count (CFU·g−1) | Yeast Count (CFU·g−1) |
|---|---|---|---|
| PS | 4.10 (±2.0) × 104 | 2.30 (±0.1) × 104 | 3.85 (±1.6) × 104 |
| PPS | 3.25 (±0.2) × 104 | 5.25 (±0.1) × 104 | 1.50 (±0.1) × 103 |
| PC | 1.90 (±0.6) × 102 | 2.00 (±0.1) × 102 | 1 (±0.0) × 102 |
| PPC | 1.20 (±0.1) × 102 | 2.00 (±0.0) × 102 | <102 |
| Microbiological quality guidelines [46] | Satisfactory < 106 | Satisfactory < 5 × 10² Borderline 5 × 10² < 103 Unsatisfactory > 103 | Satisfactory < 105 |
| Samples | Mycotoxin results | Aflatoxin B1 | Aflatoxin B2 | Aflatoxin G1 | Aflatoxin G2 | Ochratoxin A | Patulin |
|---|---|---|---|---|---|---|---|
| PS | Result (µg/kg) | <DL | 0.008 * | 0.033 * | <DL | <DL | <DL |
| Recovery Rate (%) | 81 | 83 | 77 | 67 | 89 | 89 | |
| PPS | Result (µg/kg) | <DL | <DL | 0.013 * | <DL | 0.051 * | <DL |
| Recovery Rate (%) | 81 | 104 | 79 | 66 | 79 | 74 | |
| PC | Result (µg/kg) | <DL | <DL | <DL | <DL | <DL | <DL |
| Recovery Rate (%) | 105 | 106 | 104 | 81 | 68 | 62 | |
| PPC | Result (µg/kg) | <DL | <DL | <DL | <DL | <DL | <DL |
| Recovery Rate (%) | 94 | 95 | 92 | 73 | 65 | 51 | |
| Reference values | Detection limit, DL (µg/kg) | 0.011 | 0.004 | 0.007 | 0.004 | 0.027 | 2.9 |
| Quantification limit, QL (µg/kg) | 0.038 | 0.013 | 0.023 | 0.014 | 0.089 | 7.4 |
Publisher’s Note: MDPI stays neutral with regard to jurisdictional claims in published maps and institutional affiliations. |
© 2021 by the authors. Licensee MDPI, Basel, Switzerland. This article is an open access article distributed under the terms and conditions of the Creative Commons Attribution (CC BY) license (https://creativecommons.org/licenses/by/4.0/).
Share and Cite
Santos, D.I.; Martins, C.F.; Amaral, R.A.; Brito, L.; Saraiva, J.A.; Vicente, A.A.; Moldão-Martins, M. Pineapple (Ananas comosus L.) By-Products Valorization: Novel Bio Ingredients for Functional Foods. Molecules 2021, 26, 3216. https://doi.org/10.3390/molecules26113216
Santos DI, Martins CF, Amaral RA, Brito L, Saraiva JA, Vicente AA, Moldão-Martins M. Pineapple (Ananas comosus L.) By-Products Valorization: Novel Bio Ingredients for Functional Foods. Molecules. 2021; 26(11):3216. https://doi.org/10.3390/molecules26113216
Chicago/Turabian StyleSantos, Diana I., Cátia F. Martins, Renata A. Amaral, Luísa Brito, Jorge A. Saraiva, António A. Vicente, and Margarida Moldão-Martins. 2021. "Pineapple (Ananas comosus L.) By-Products Valorization: Novel Bio Ingredients for Functional Foods" Molecules 26, no. 11: 3216. https://doi.org/10.3390/molecules26113216