Article

Accuracy Analysis of a Next-Generation Tissue Microarray on Various Soft Tissue Samples of Wistar Rats

1
Department of Oral and Maxillofacial Surgery, Friedrich-Alexander University Erlangen-Nürnberg (FAU), 91054 Erlangen, Germany
2
Private Office for Maxillofacial Surgery, 91781 Weißenburg, Germany
3
Department of Pathology, Friedrich-Alexander University Erlangen-Nürnberg (FAU), 91054 Erlangen, Germany
4
Department of Oral and Maxillofacial Surgery, University of Mainz, 55131 Mainz, Germany
*
Author to whom correspondence should be addressed.
Appl. Sci. 2021, 11(12), 5589; https://doi.org/10.3390/app11125589
Submission received: 30 March 2021 / Revised: 4 June 2021 / Accepted: 10 June 2021 / Published: 17 June 2021
(This article belongs to the Special Issue Digital Pathology: Current Issues and Trends)

Abstract

:
This study aimed to investigate accuracy in different sectional planes of the TMA Grand Master (3DHISTECH) Workstation in various soft tissue samples collected from Wistar rats. A total of 108 animals were sacrificed and 963 tissue specimens collected from 12 soft-tissue types. A total of 3307 tissue cores were punched and transferred into 40 recipient TMA blocks. Digital image analysis was performed. Core loss showed a significant correlation with tissue type and was highest in skin tissue (p < 0.001), renal medulla and femoral artery, nerve, and vein bundle (p < 0.01). Overall, 231 of 3307 tissue cores (7.0%) were lost. Hit rate analysis was performed in 1852 punches. The target was hit completely, partially and missed totally by 89.4%, 7.2% and 2.2%. A total of 54.5% of punches had good accuracy with less than 200 µm deviation from the centre of the targeted region and 92.6% less than 500 µm. Accuracy decreases with greater sectional depth. In the deepest sectional plane of roughly 0.5 mm median depth, almost 90% of cores had a deviation below 500 µm. Recommendations for automated TMA creation are given in this article. The ngTMA®-method has proven accurate and reliable in different soft tissues, even in deeper sectional layers.

1. Introduction

Since Battifora introduced the method of the ‘multitumor (sausage) tissue block’ in 1986 [1] and Kononen developed the Tissue MicroArray (TMA) in 1998 [2], the advancement of this technique has shown continuous progress. With the TMA method, it is possible to process several hundred tissue samples simultaneously and under identical conditions (incubation time, temperature, concentration of reagents) [3]. Further advantages include cost and time efficiency [2,3,4,5,6], evaluation under identical conditions [3,5,6,7,8] and preservation of donor specimen [2,7,9,10,11,12]. The combination of digital microscopy to select regions to punch using Digital Image Analysis (DIA) with fully automated tissue microarrays have led to the development of a new era in TMA technique and coined the term next-generation Tissue MicroArray (ngTMA®) [11,13]. This technique is based on TMA planning, design including digital pathology and performing an automated tissue microarray. Therefore, a much higher accuracy is expected when compared to conventional TMA, where selection and punching are done manually [13,14]. Objective accuracy analyses become possible through the usage of digital microscopy and comparison of digitally set annotations with the finished digital TMA slide (Figure 1). The establishment of ngTMA® has also facilitated inter-institutional research [14,15]. Standard TMA methods require high expertise [14,16], can be accompanied by loss of antigenicity [16,17] and the loss of tissue cores [18,19]. In addition, the informative value of a minuscule tissue punch when compared with whole slide analysis remains disputed [6,15,19,20,21,22,23]. Therefore, assessment of qualitative accuracy of ngTMA® has focused on determining how representative a punch core on a TMA is compared with a whole slide in immunohistochemical evaluation. Hence, there is advice on the number or diameter of cores for different tissue types such as breast cancer [20,23], pulmonary cancer [15], colorectal cancer [24] and endometrial cancer [19]. By following these recommendations, a greater accuracy of the ngTMA® approach is assumed [11,13,14,24].
Due to the embryological derivation from branchial arches, different tissue types and anatomical structures of the midface, jaw and neck are in close vicinity to each other. Particular knowledge about the manageability of these different tissue types during the TMA construction is of importance when analysing samples of the head and neck region. Each TMA analysis suffers core loss [18] that depends on the tissue type, fixation method, core diameter and primary donor block thickness [18]. In the literature, core loss ranges between 5 and 35% [4,7,20,21,25,26] for conventional TMAs and between 1 and 14% [5,13,19,27,28,29,30] for ngTMA®s. Though, in many analyses, core loss is not reported at all.
Accuracy analysis of the ngTMA® method was done by Nolte et al. [13] by collecting data about the overall hit rates of the targeted structure. However, there is no study comparing different soft tissue types and accuracy in deeper sectional planes in a reproducible animal model.
The primary aim of this study was to provide an in-depth accuracy analysis of the qualitative and quantitative accuracy of the ngTMA®-method in different soft tissue types and sectional planes, additionally providing metric measurements of the deviation from targeted structures. For this purpose, 40 ngTMA®s were constructed using twelve different tissue types, ranging from small and fragile histo-anatomical structures to more homogenous tissues, such as parenchymal organs. Additionally, the total amount of core loss was recorded, as well as the amount of core loss in different tissue types.

2. Materials and Methods

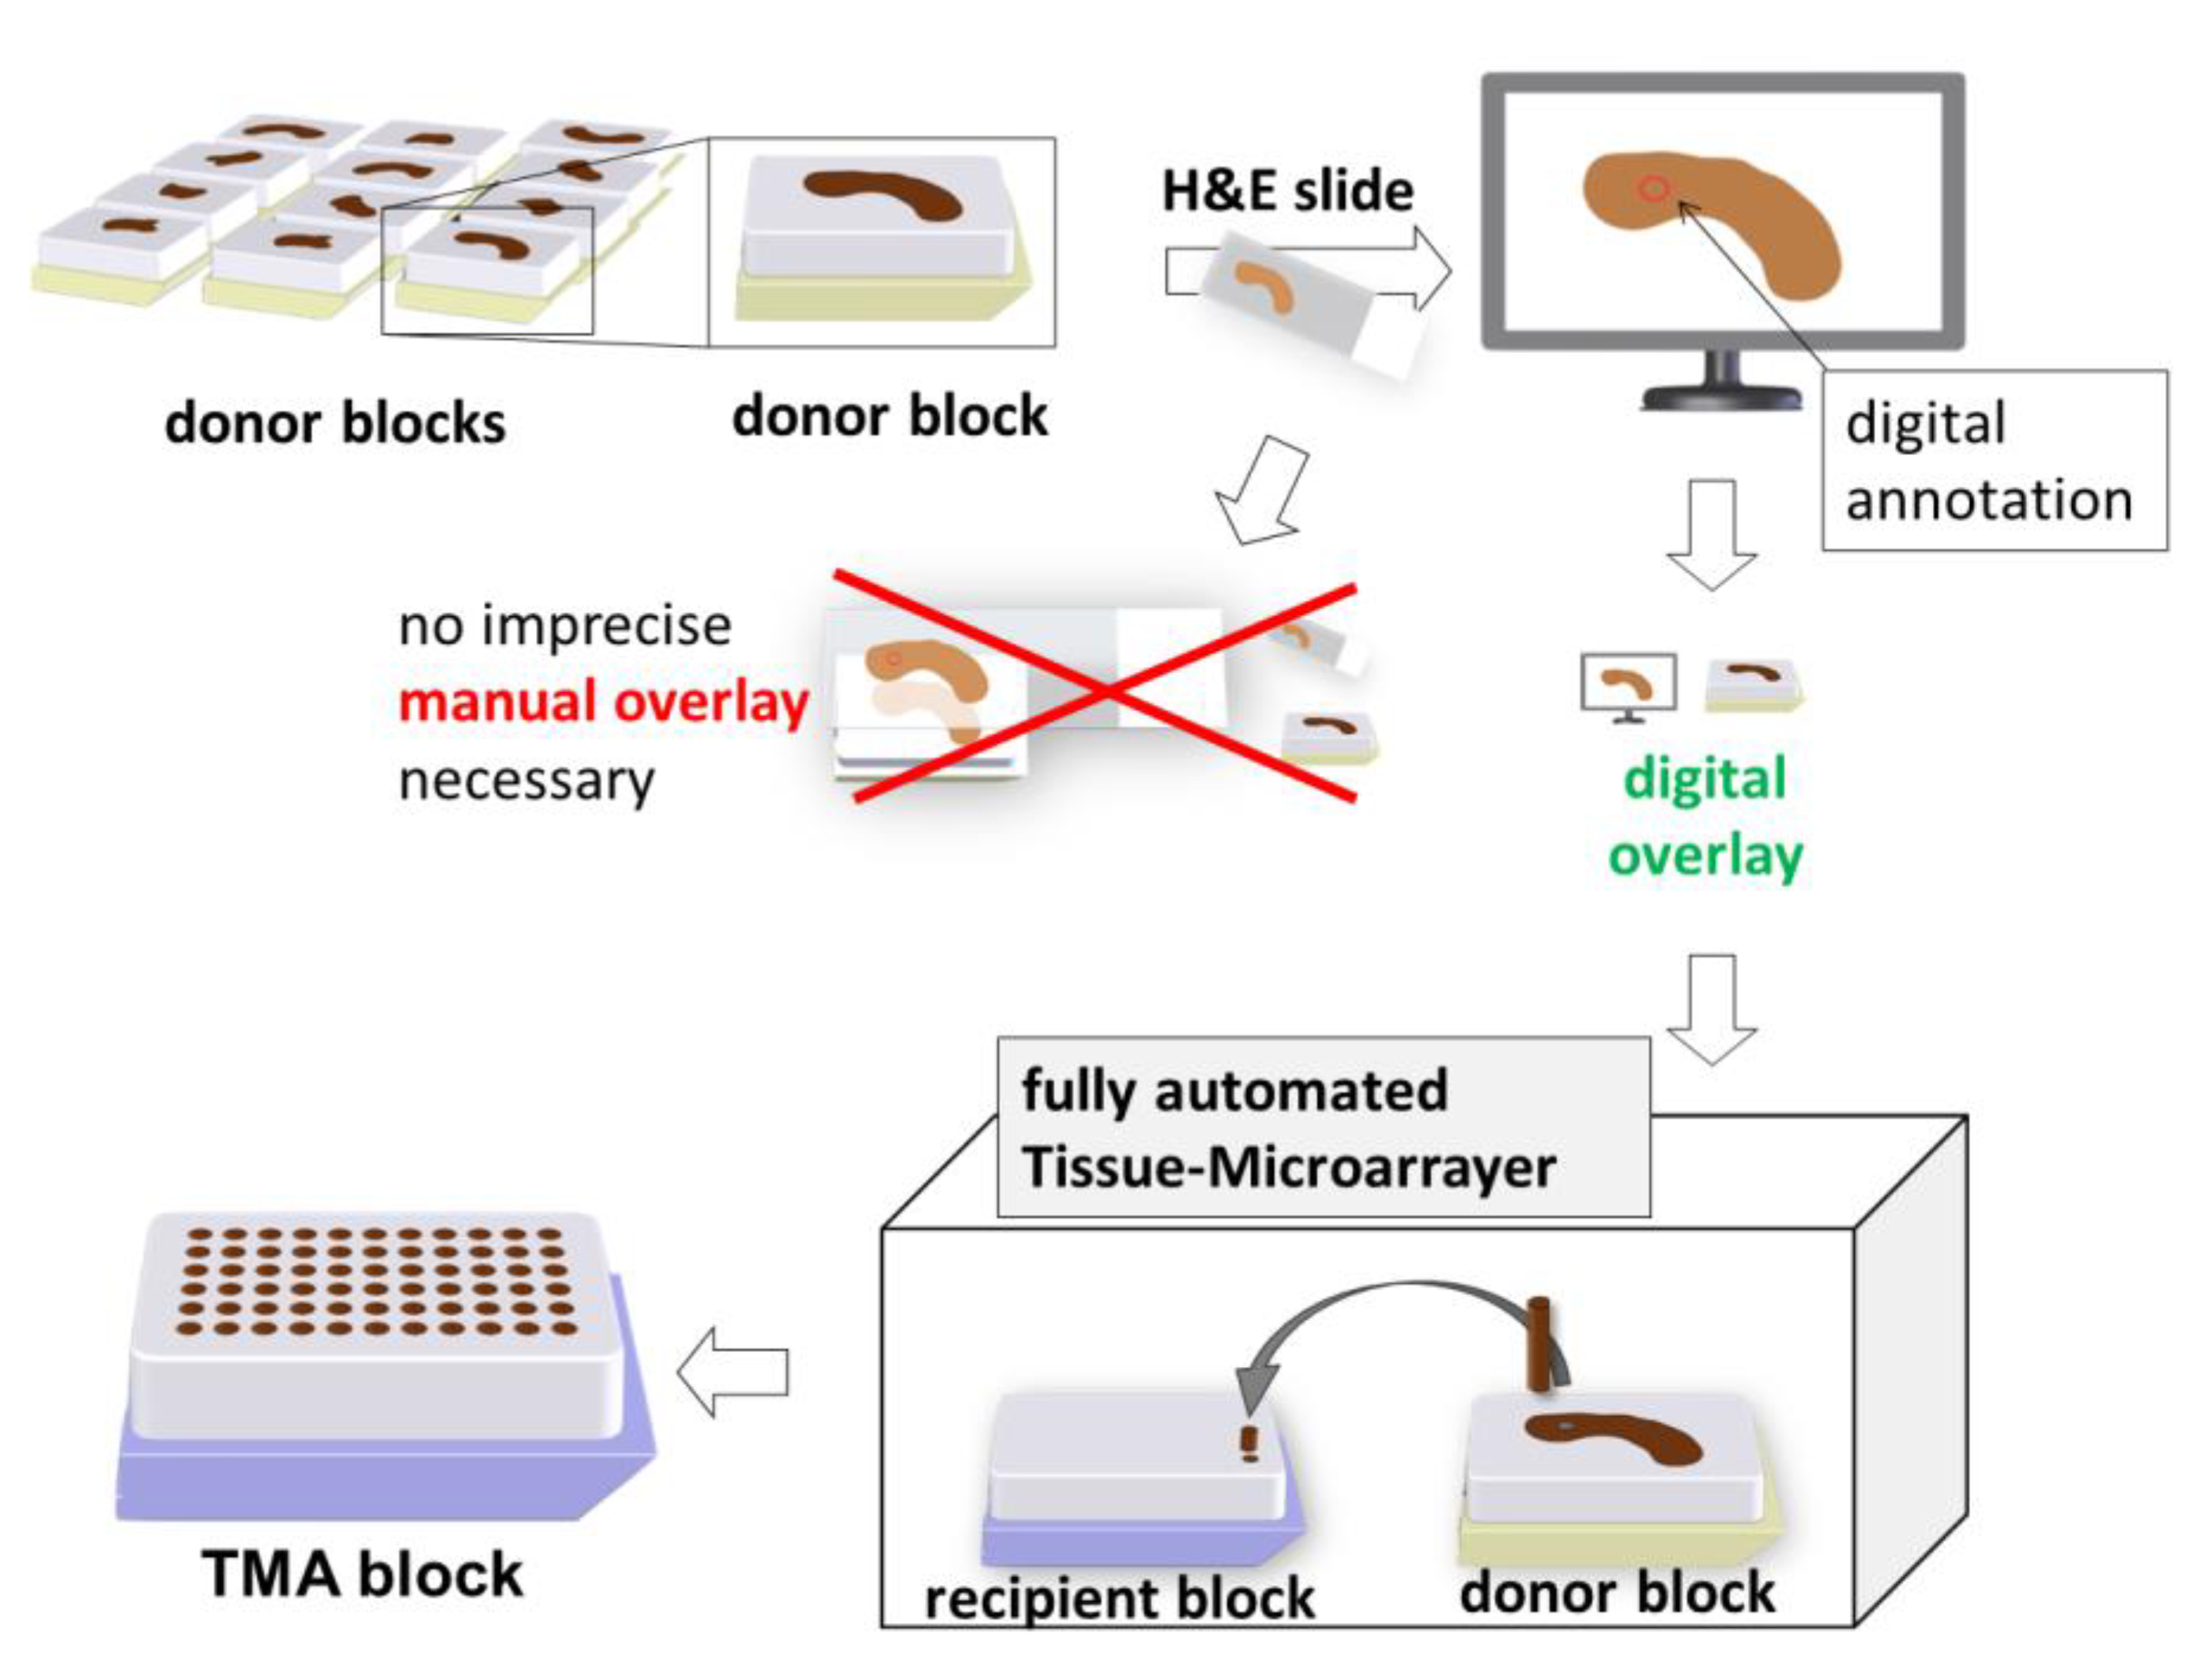
2.1. Construction of ngTMA®

2.1.1. Inspection and Selection of the Tissue Samples

For this project, soft tissue from 108 Wistar Rats was analysed. The local government authorities ‘Regierung von Mittelfranken’ No 54-25321-3/09 approved the animal experiments. A standardised animal model was created by using laboratory Wistar rat tissue instead of human pathological specimens. Hence, environmental conditions, sampling methods, as well as fixation and tissue processing, were performed uniformly.
52 of the investigated animals were exposed to intraperitoneal application of the bisphosphonate zoledronate as part of another project.
Dissection of the sacrificed rat carcasses followed by immediate collection of adequately small tissue samples was performed. All rats were between 6 and 10 months of age. Formalin fixation was done immediately to ensure quick penetration of formalin into the samples right after harvesting.
The formalin fixed tissue blocks were subsequently paraffin-embedded (FFPE). Table 1 shows the different tissue types analysed in the current study, the number of acquired punches and the selected punching diameter. A detailled description of the dissected tissue type and its precise alignment in the donor block can be found under “Supplementary Materials” at the end of this article (Table S1).

2.1.2. Punching Diameter

In total, three different punching diameters were used. Abdominal aorta, femoral artery, nerve, and vein bundle (A&V) and epithelium of the tongue were punched with 2 mm, renal medulla and cortex, pancreas, spleen parenchyma, lung parenchyma, myocardial muscle tissue and the carotid artery were punched with 1.5 mm diameter. Skin tissue was punched with 2, 1.5 and 1 mm (Table 1).

2.1.3. Sectioning and Staining of the H&E Slides

The sectioning of the TMA donor blocks was performed with a Leica RM2165 Microtome (Leica Biosystems, Nussloch, Germany). Slides of 2 µm thickness were produced. The last or second to last slide was used for staining. Staining was always done according to the same established standardised laboratory protocol.

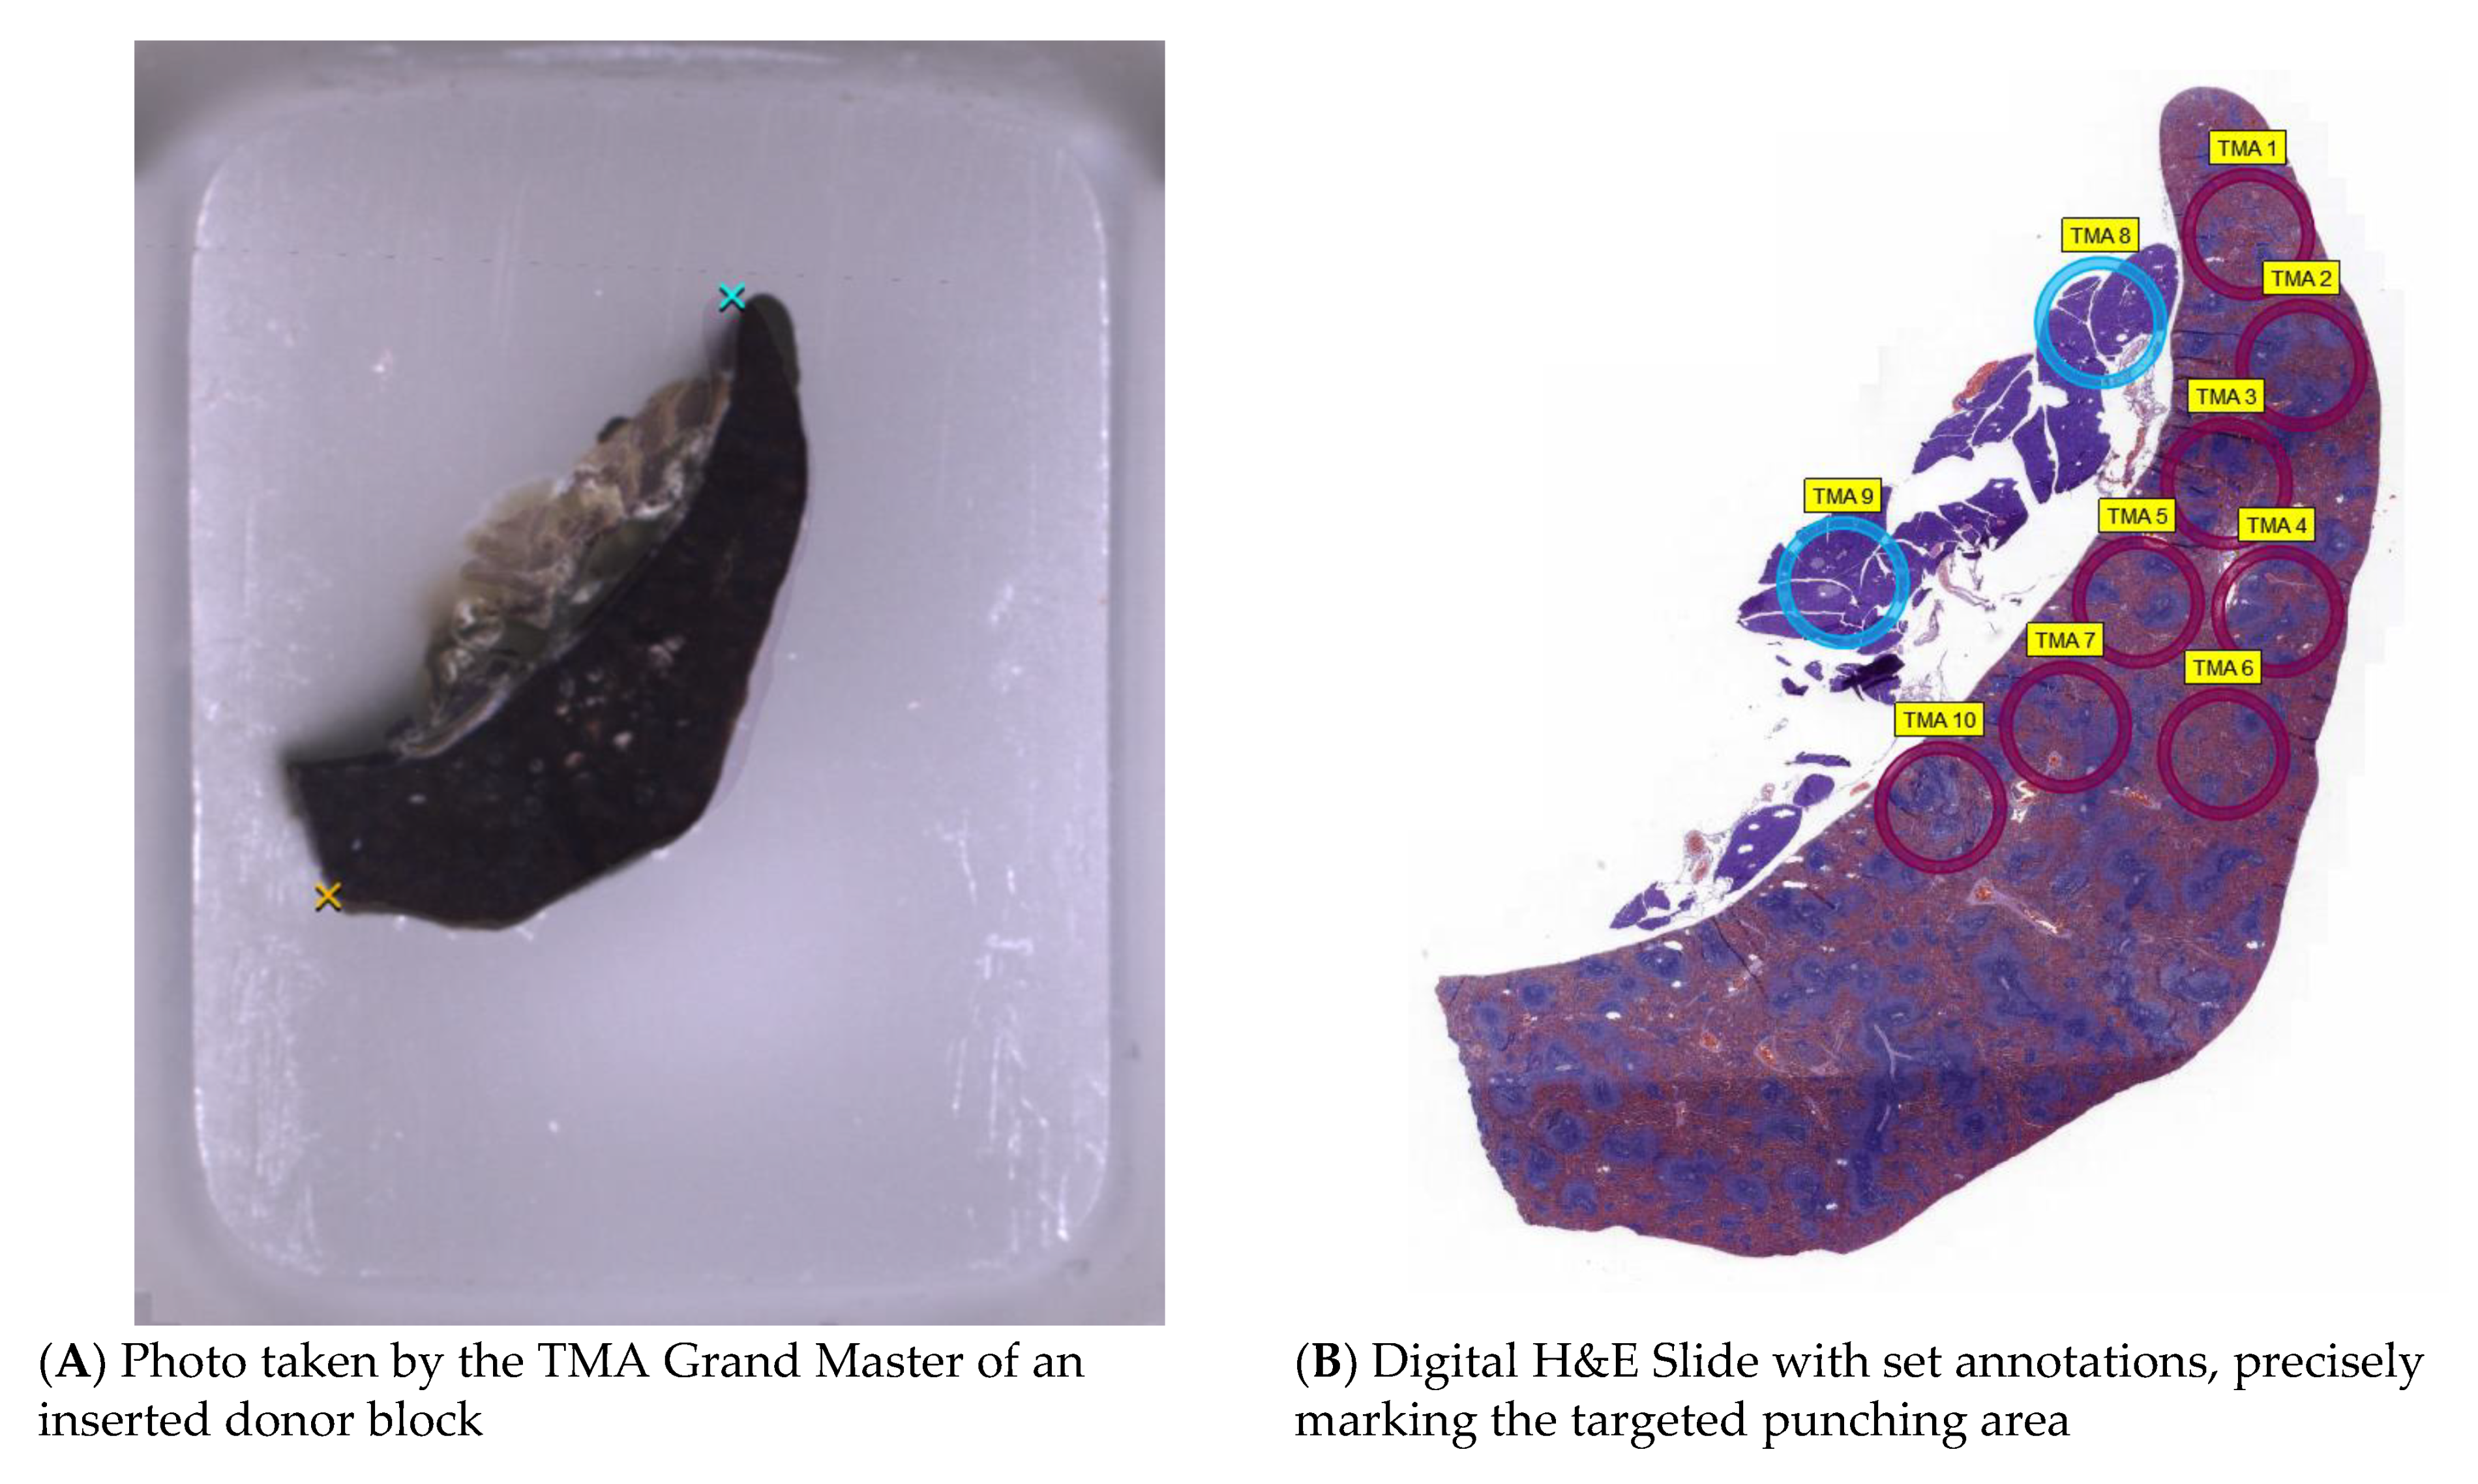
2.1.4. Digitalisation and Determination of Annotations

The H&E slides of the respective donor tissue blocks were digitalised using a slide scanner (Panoramic 250 Flash III, 3DHISTECH Ltd., Budapest, Hungary). All digital slides with data files of approximately 0.3 gigabytes/slide were stored. For high-resolution of the ngTMA slides, up to 4 GB of file size had to be handled. H&E slides were examined by a pathologist and punching targets were defined (Table 1). Precisely defined target areas were selected for tissues with heterogenous macrostructures, including aorta, A&V, carotid artery, tongue. Annotations were set according to targeted punching areas determined in Table 1 using TMA annotation software (CaseViewer®, 3DHISTECH Ltd., Budapest, Hungary).

2.1.5. Execution Using the Tissue Microarrayer

For TMA construction, the TMA Grand-Master® (3DHISTECH Ltd., Budapest, Hungary) was loaded with up to 12 recipients and up to 60 donor blocks according to the manufacturer’s instructions. Photos of all inserted donor blocks were taken, and a digital overlay was conducted by aligning the previously annotated digital slide to the picture of each corresponding donor block (Figure 2).
The TMA Grand Master® was used to perform the fully automated process and transfer the individual cores from the donor to the recipient blocks. The tissue microarrayer first drills holes into the recipient blocks and then inserts the punched tissue cores into the vacant holes.
For all recipient blocks the exact same paraffin was used. To ensure the merging of punched cores and the surrounding paraffin into a new stable polymer, a special melting technique was necessary. This method includes heating the complete TMA block in an incubator (IN30, Memmert, Germany) for 10 min at 60 °C. Levelling then followed quickly with a 63 °C pre-heated microscopic slide using a heating plate (Histocentre 2, Shandon). The melting temperature of the paraffin was 54–56 °C. After the melting process, proper sectioning of the TMA blocks was possible without flipping or loss of cores and standard H&E staining was performed. The acquired H&E slides of the TMA samples were digitalised for further analysis using a slide scanner (Panoramic 250 Flash II, 3DHISTECH Ltd., Budapest, Hungary).

2.2. Methods for Analysing Accuracy

Core loss and the qualitative and quantitative accuracy was analysed in different tissues and different sectional planes.
For this purpose, qualitative accuracy was defined as the concordance between the digitally set annotation and the corresponding core on the TMA slide. According to the hit of the punching target, the classification used was ‘completely hit’, ‘partially hit’ or ‘missed’. This definition is comparable to established classification in the literature [5,13]. To analyse the quantitative accuracy, deviations of target structures were metrically measured.

2.2.1. Core Loss

Core loss results in a total deficit of the punched tissue cylinder, either while the TMA block is created in the tissue microarrayer or during the further processing of the tissue blocks and slides, during merging, cutting, and staining. This study differentiates between core loss during the punching and transfer process by the tissue microarrayer (CL_pre) and the core loss remaining after manual re-punching (CL_post). To distinguish between insufficient transfer of FFPE material between blocks in the TMA Grand Master® versus loss of tissue on slide and during sectioning or staining process, pictures of the performed recipient and donor blocks were compared before and after processing (Figure 3A).

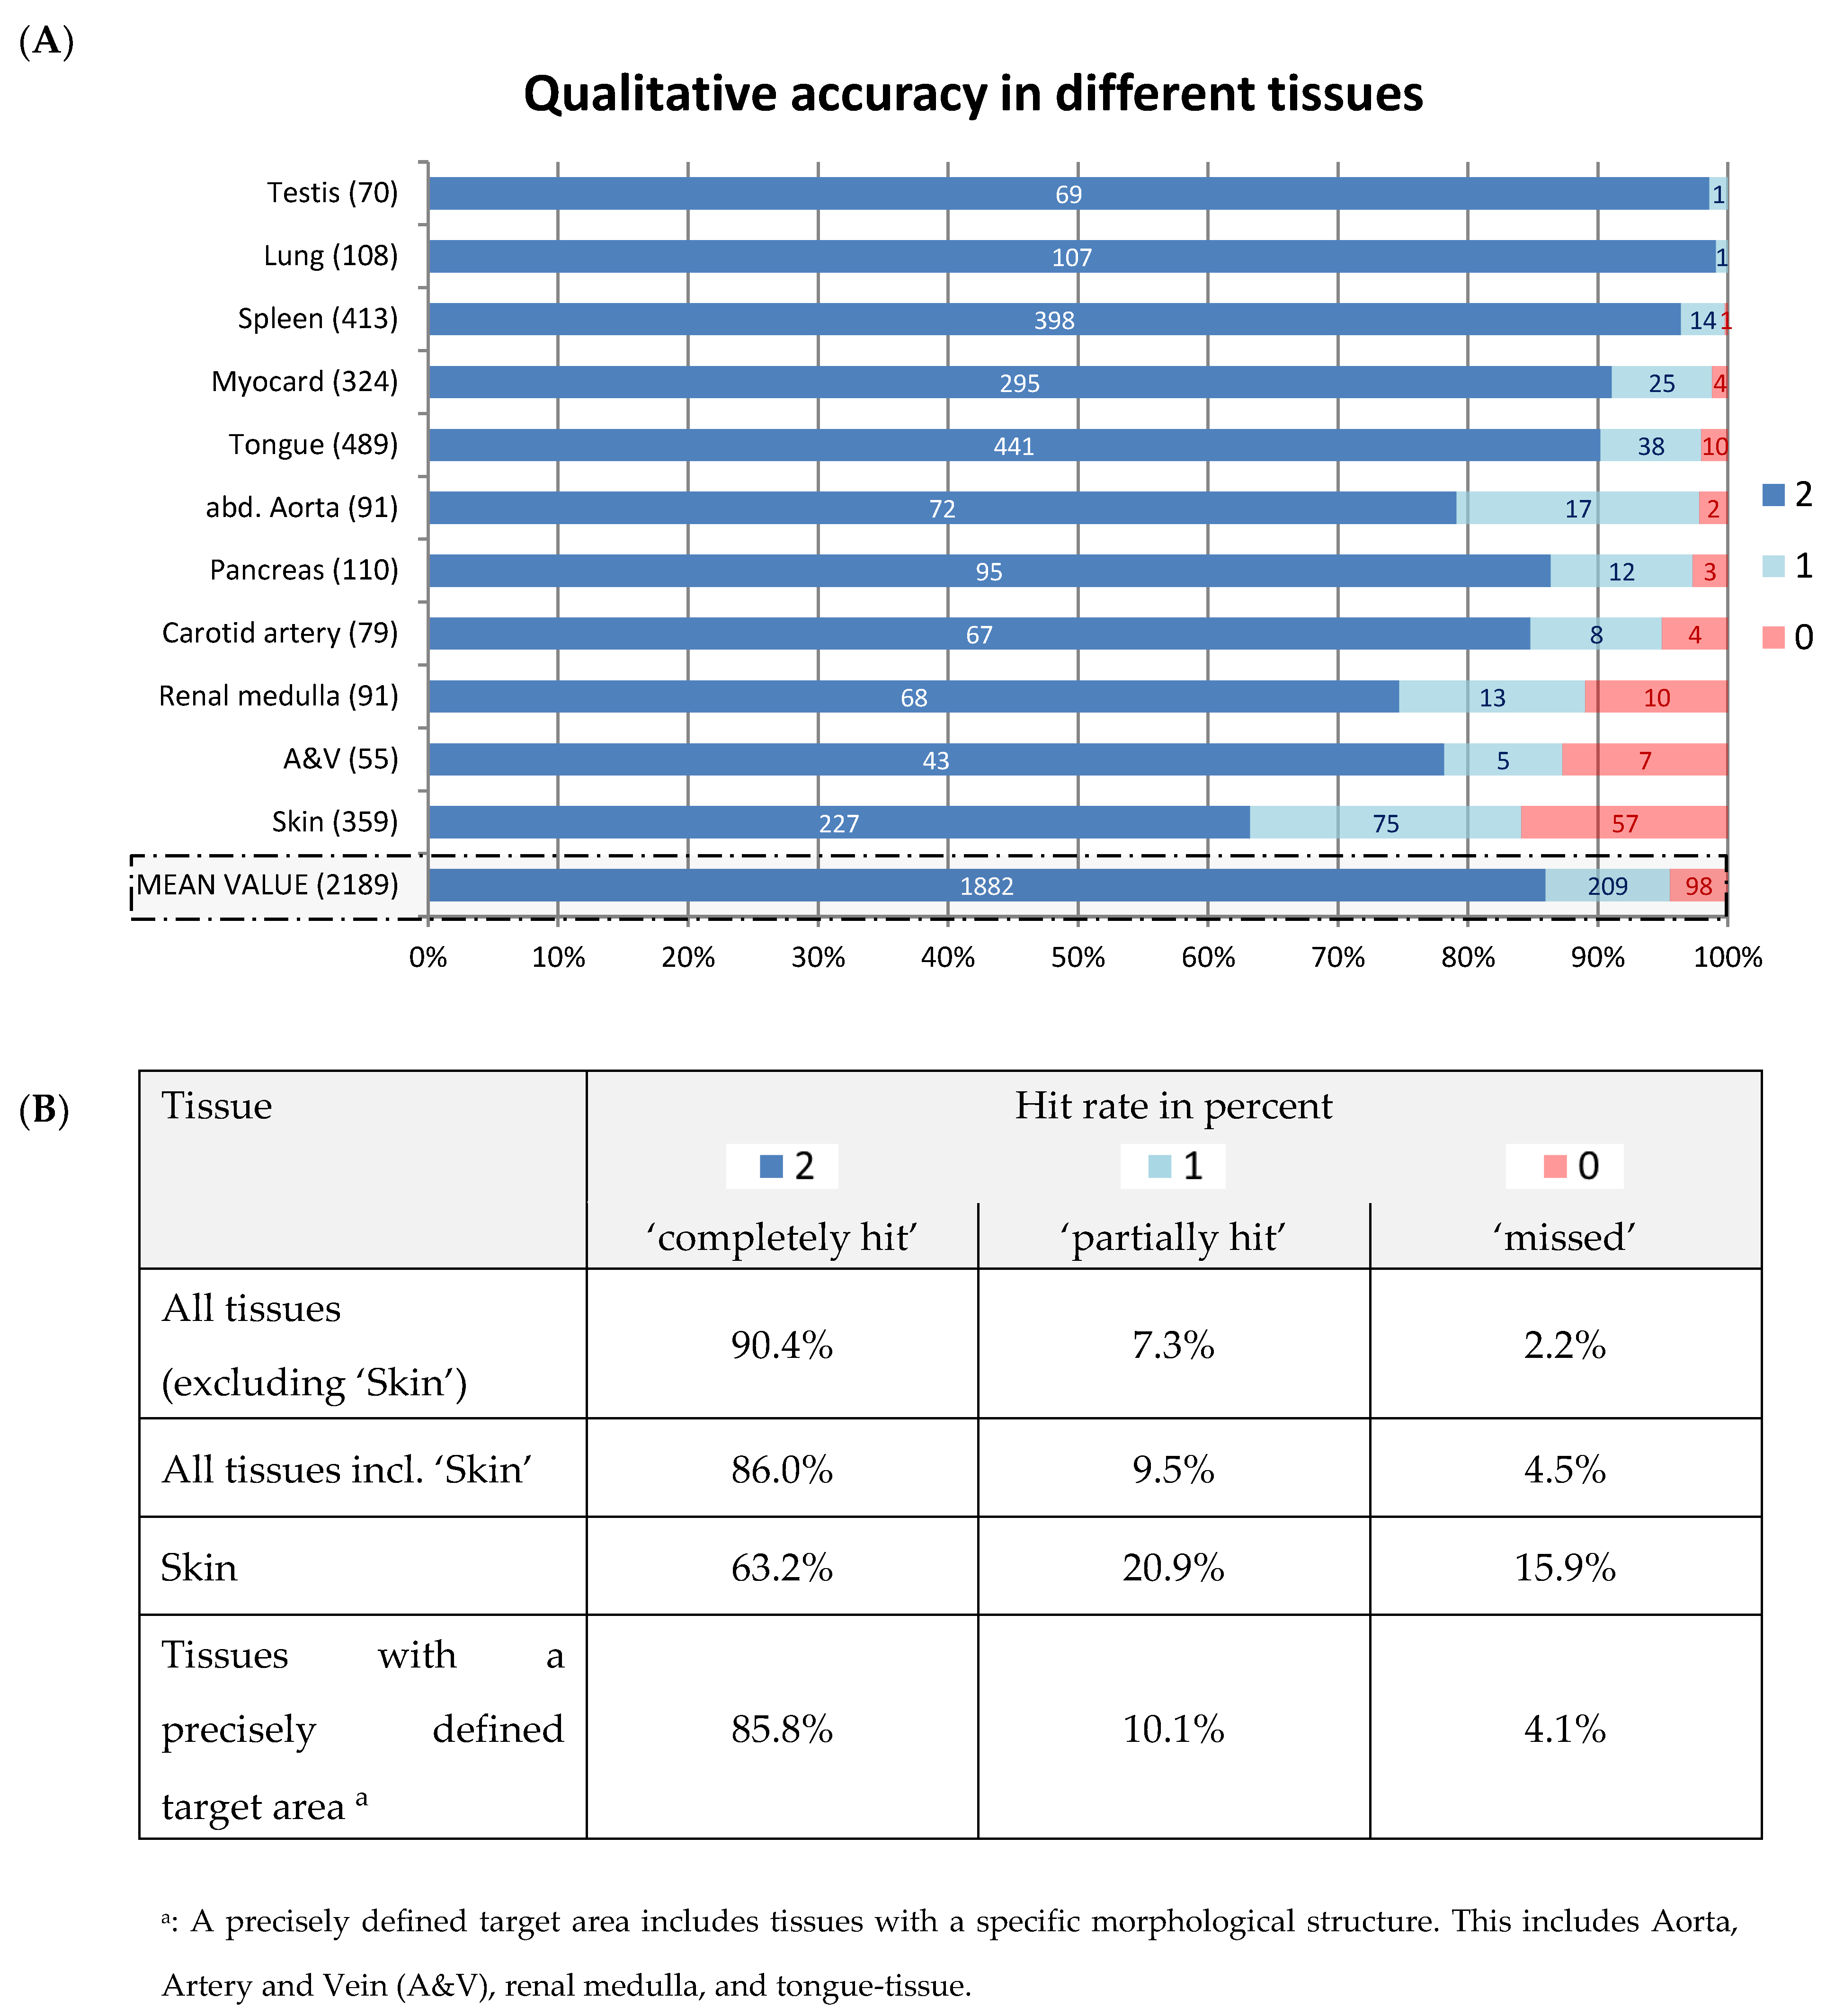
2.2.2. Qualitative Accuracy

The qualitative accuracy was defined as the concordance between the digitally set annotation and the corresponding core on the H&E slide of the respective TMA block. For this purpose, the actual punched TMA core was compared with the original annotation (Figure 4). Qualitative accuracy in relation to different cutting depths of the TMA-block was analysed by selecting three slides to represent the three different depths of sections of the TMA block using a maximum cutting depth of roughly 800 µm (Figure 5).
Furthermore, three groups were defined to characterise the results as target was completely hit (2), partially hit (1) or missed (0), and groups were coded accordingly.
When studying the accuracy of the digitalised ngTMA® method, it is crucial to consider that the TMA block is a three-dimensional structure. The depth of the retrieved section determines the location and shape of the targeted structure (Figure 6A). To analyse the accuracy of cutting depth, the block was cut to a mean depth of 441 µm from S1 so that approximately two-thirds of the block remained for further research. Three slides were selected to represent three different sectional planes.
The following definitions were made: S1 was the ‘first acceptable’ section. The first cut which contained specimen and most core punches were present.
S2 was the ‘best’ section. All or mostly all core punches were present but also the smallest number of defects was observed, such as overlaying, rolling up and deformation due to squashing and stretching in the water bath.
S3 was the ‘last acceptable’ section.

2.2.3. Quantitative Accuracy

To analyse the quantitative accuracy of the next-generation Tissue Microarray (ngTMA)® method, two different approaches were used:
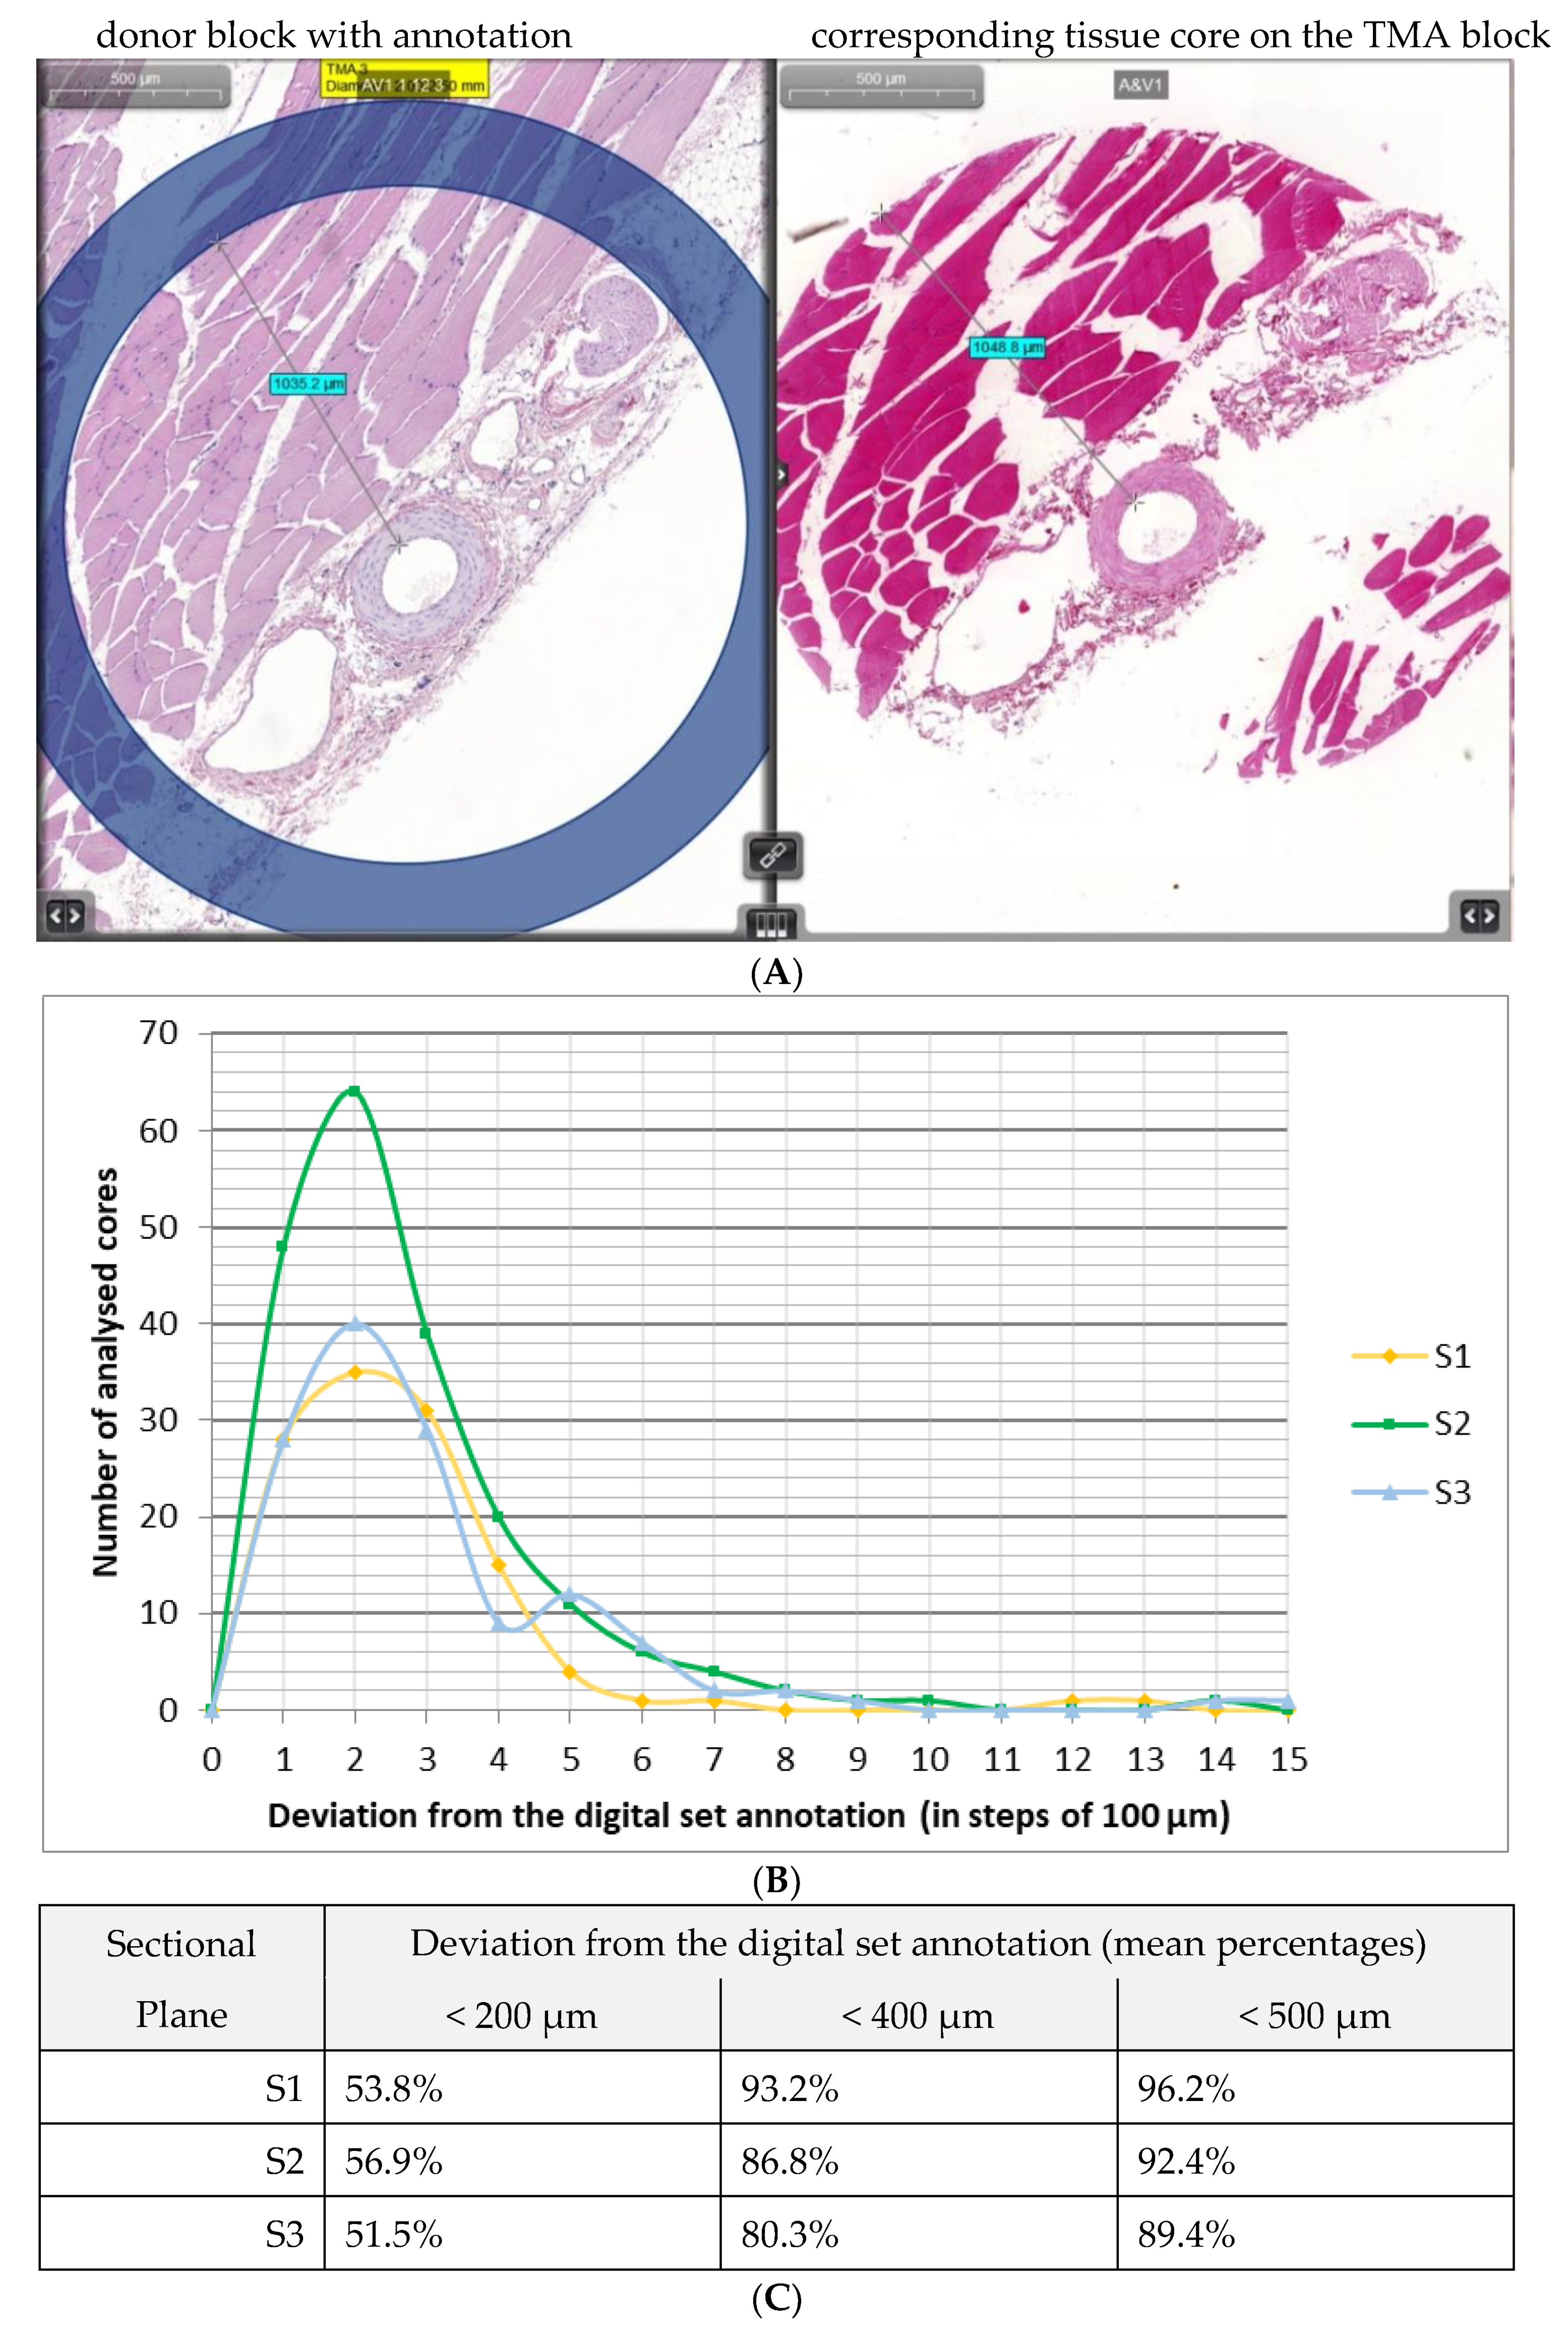
  • The distance between a distinct structure and the annotation;
  • The length of the endothelium inside the aorta.
The results were also compared with the sectioning depth.
1. Distance between structure and annotation:
The distance was measured between an easily recognisable structure and the inner circumference of the annotation in 446 cases (S1: n = 117, S2 n = 197, S3 n = 132). This distance was then compared on the corresponding TMA H&E slide (Figure 7). The tissues aorta, A&V and tongue with their precisely defined punching targets were used for this purpose.
2. Length of the endothelium in the aorta:
For a different approach, in 90 cases, a comparison was made of the endothelial length of the aorta in the original H&E and the TMA H&E slides in different sectional depths (S1, S2, S3) was carried out (Figure 6).

3. Results

3.1. Overall Number of Core Losses

Due to the failure of transition between the donor and receptor-block, 231 (7.0%) of 3307 cores were lost. Notably, there was a significantly higher percentage of core loss in the skin tissue group. In accordance with this, total core loss decreases to 53 (1.9%) of 2766 cores after exclusion of skin tissue. Some of these punched cores remained in the donor block (Figure 3A). However, it was possible to transfer them manually afterwards in some cases. Manual transfer further decreased the number of core losses to 209 (6.3%) of 3307 cores when skin tissue was included and to 31 (1.1%) of 2766 cores when excluded (Figure 3C).

3.2. Correlation of Core Loss with the Punched Tissue Type

Figure 3B illustrates the correlation between the overall core loss and tissue type. In skin tissue, core loss was significantly higher when compared with all other tissue types (p < 0.001, Chi-Square). The renal medulla tissue and the artery and vein (A&V) tissue group showed significantly higher losses when compared to the renal cortex, myocardial, and spleen tissue (p < 0.01, Chi-Square). However, in the A&V-group, it was possible to manually save and transfer six of seven initially lost punches, leaving only one core lost entirely (CL_post). The core loss in the skin tissue group exceeded the standard deviation value more than two-fold, and therefore skin tissue was considered separately in further analysis.

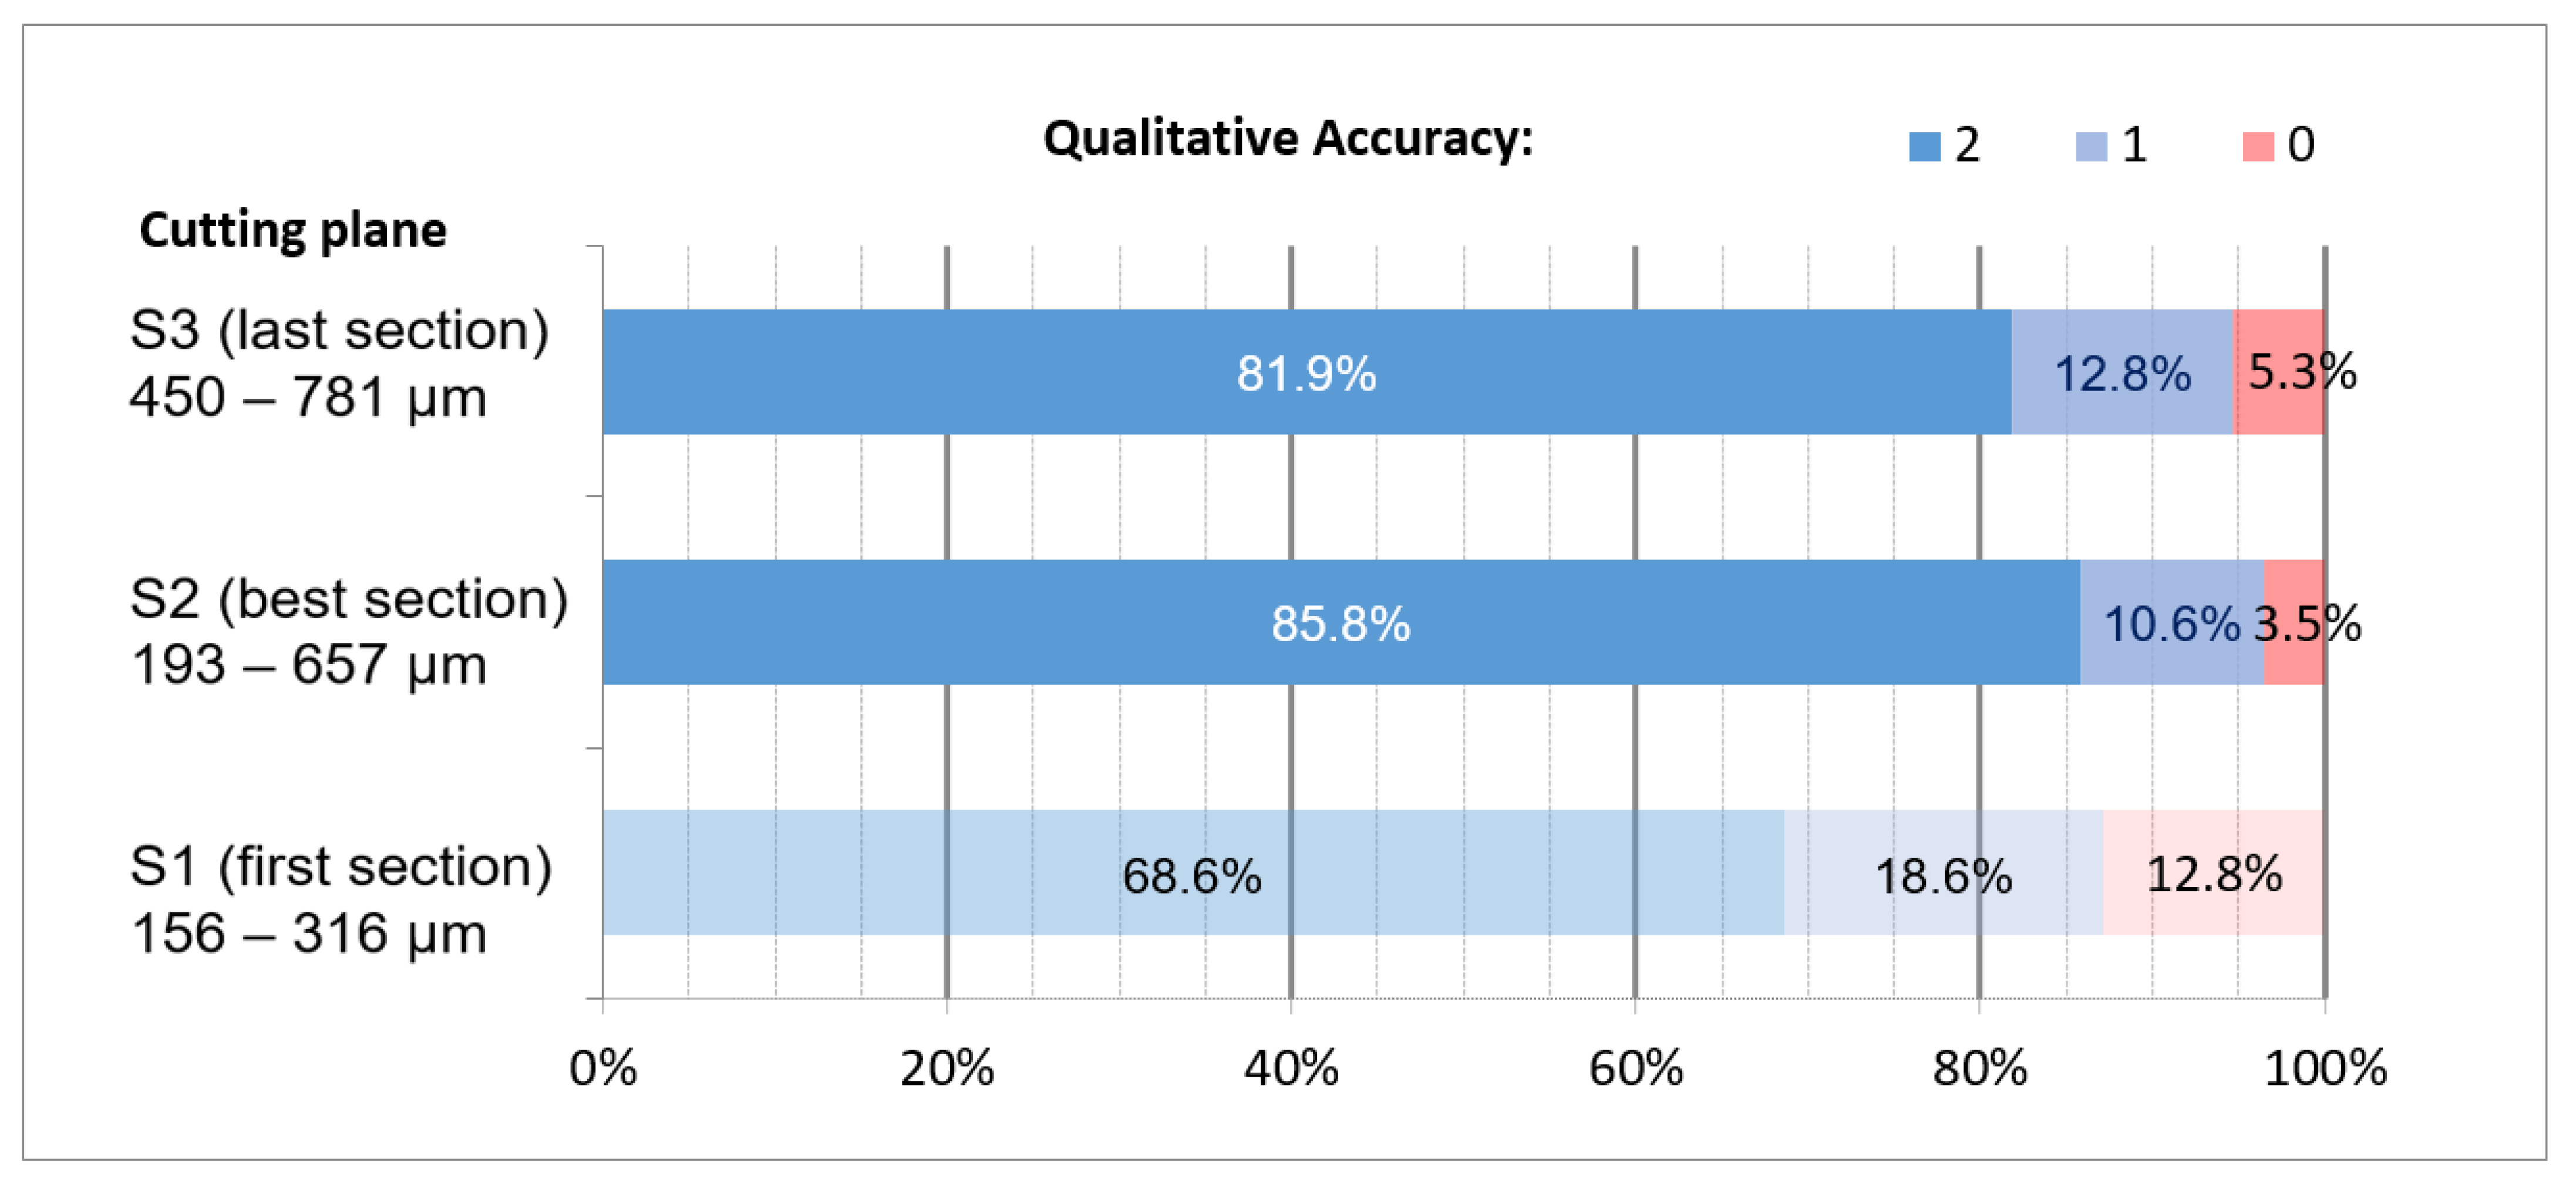
3.3. Qualitative Accuracy

The ‘qualitative’ accuracy is the accordance between the digitally set annotation and the punched core in the TMA block (Figure 1). The dependence of the qualitative accuracy with the targeted type of tissue is shown in Figure 8. The probability of hitting the target entirely was 90.4%, but a probability of 97.7% was achieved when partial hits were added. Therefore, only 2.2% of punches missed the targeted area completely. The highest accuracy was measured at a cutting depth between 193 and 657 µm. However, it is important to note that S1 did not always contain cuts of all punched cores. On average, the best slide (S2) was obtained at a depth of 513 µm.

3.4. Quantitative Accuracy

3.4.1. Distance between Target Structure and Inner Circumference

The results are depicted in Figure 7. In all three planes, the graph peaks at around 200 µm. Close to 90% of slides had a deviation below 500 µm (Figure 7B). Figure 7C shows the distribution of the accuracy in the different sectional planes. In the plane S1: 53.8%, 93.2% and 96.2% of all measured deviations were below 200 µm, 400 µm, and 500 µm, respectively.
Differences between S1 and S3 (p = 0.047) were statistically significant, with respect to the deviation from set annotation. Between S2 and S3 (p = 0.080) no statistically significant difference was present.

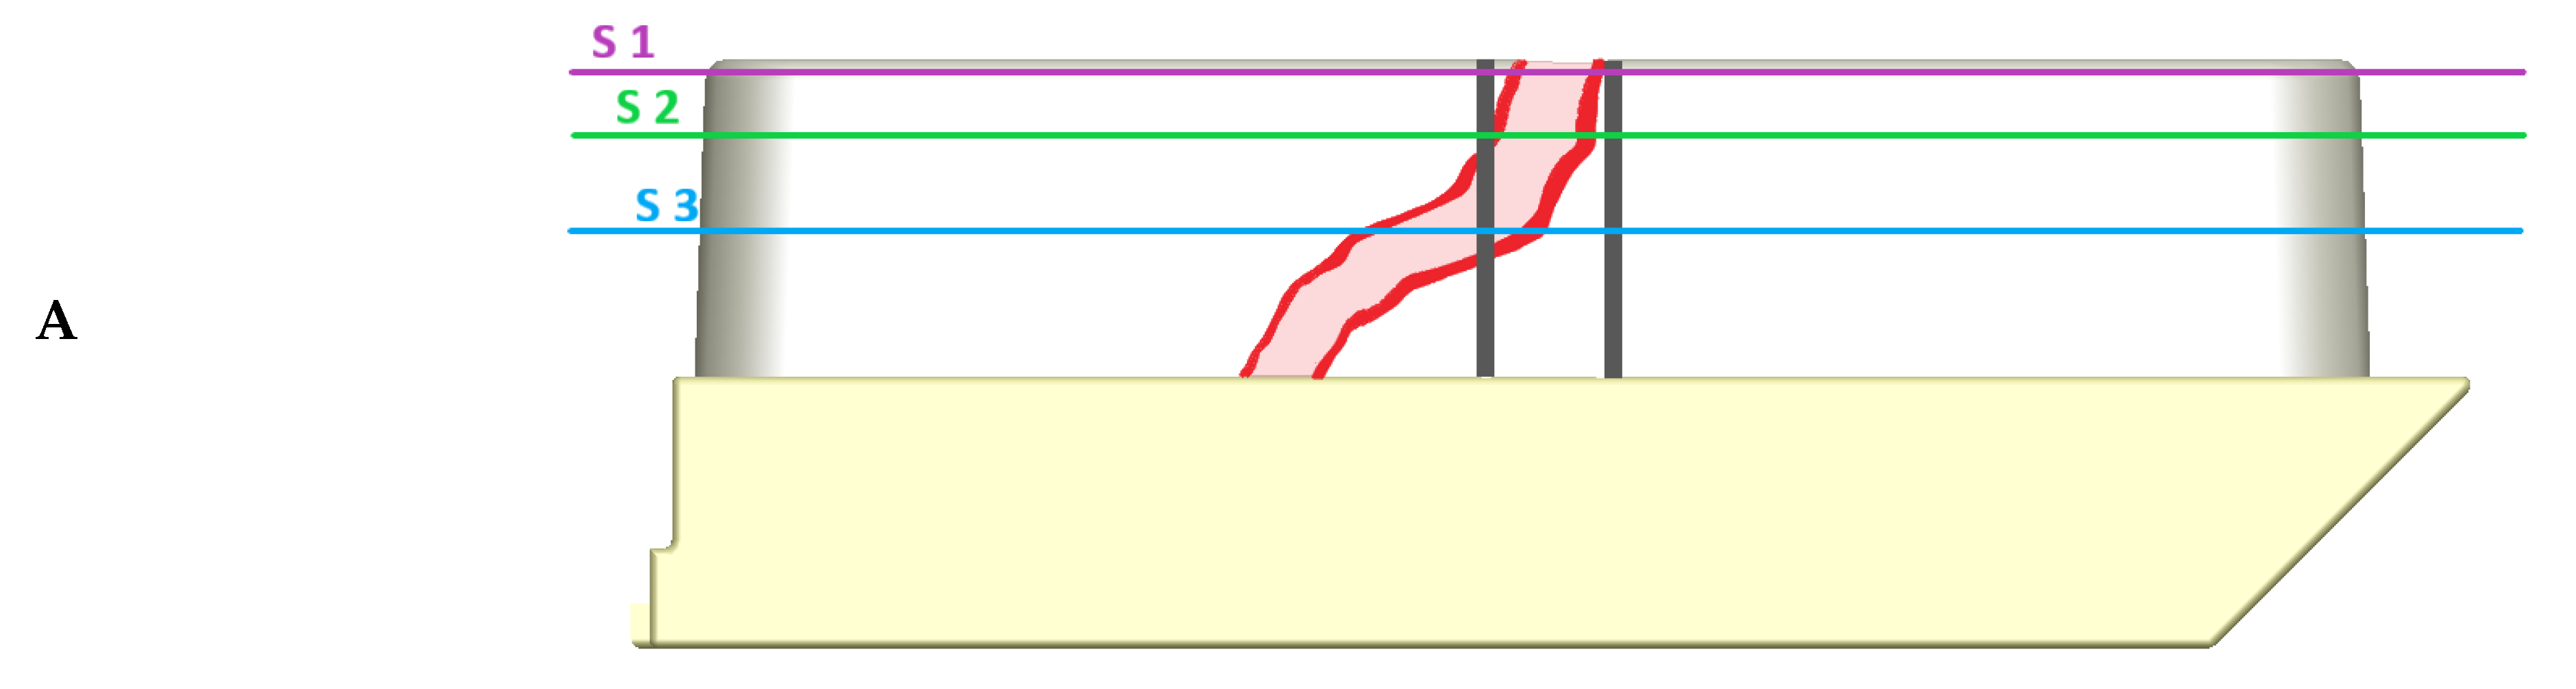
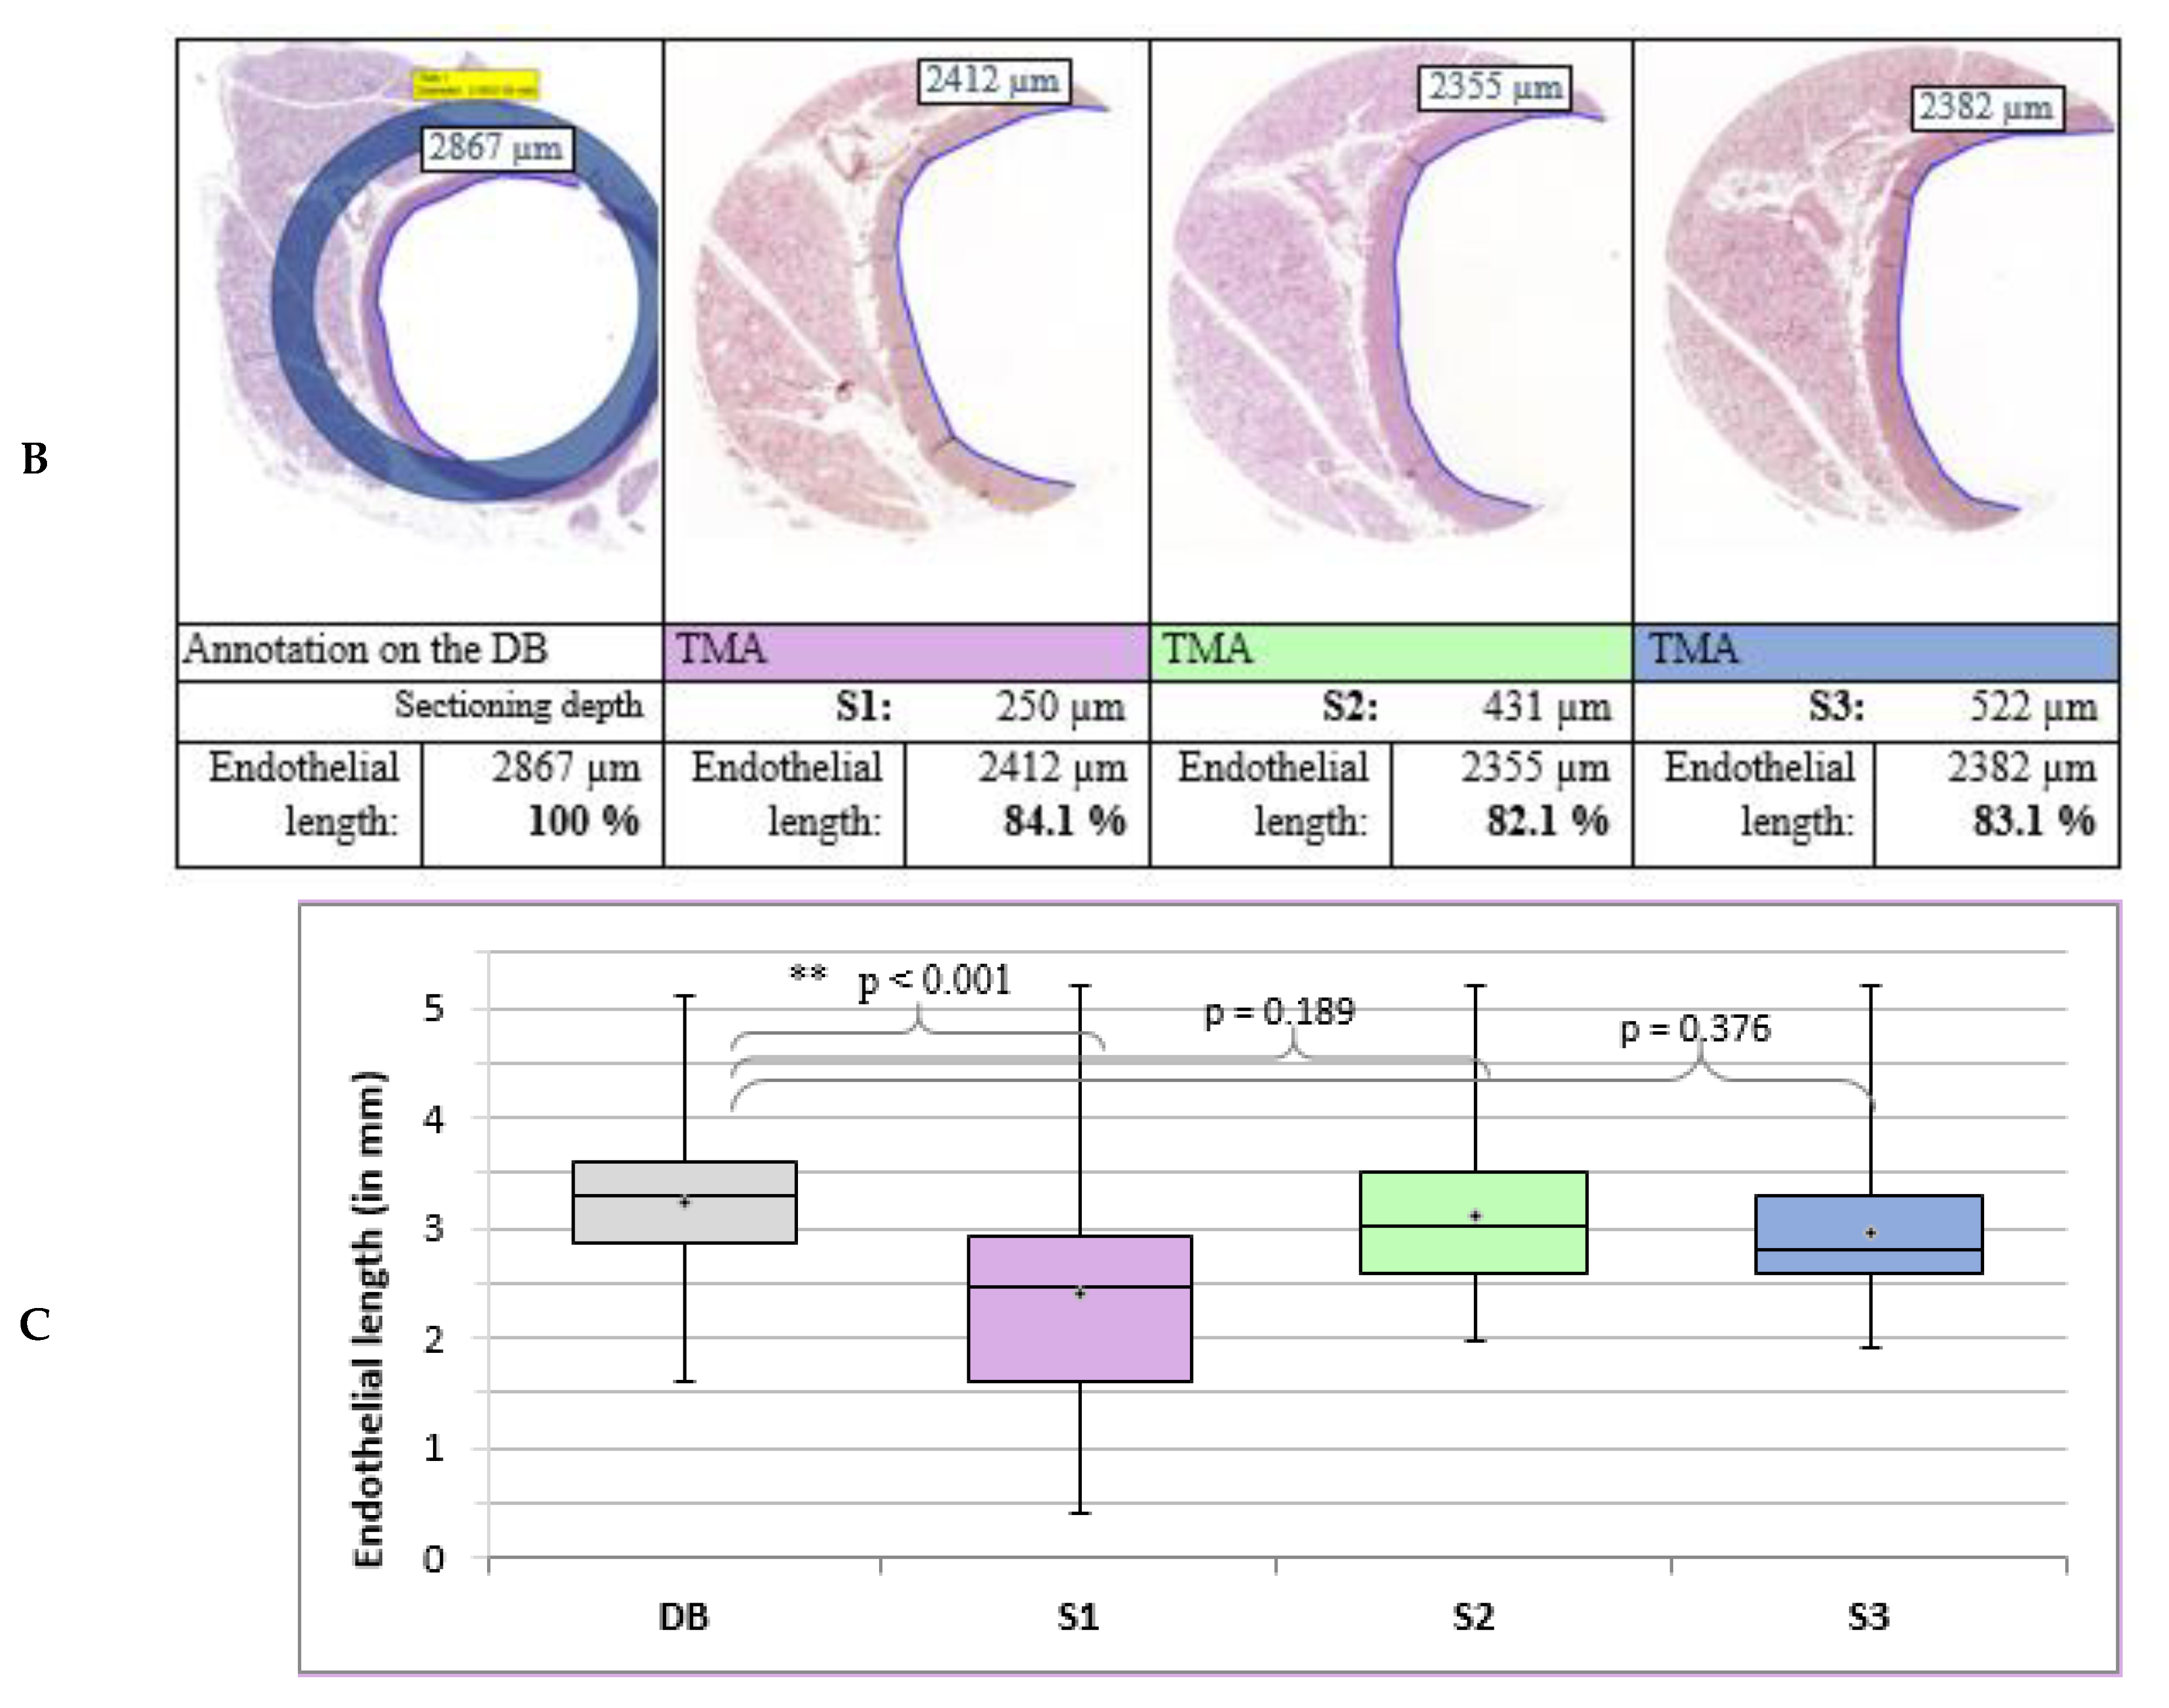
3.4.2. Length of the Endothelium in the Aorta

Another metric parameter used to quantify accuracy was the measurement of the endothelial length of the aorta. The length of the aortal lumen on the annotated donor block was compared to the TMA slides in the different sectional planes (Figure 6). In total, 270 slides were examined. Figure 6C shows the results when comparing the range of the endothelial length measured in the annotation, with the variety of measurements of the endothelial length in the different sectional planes in the TMA slides. The best results were detected in planes S2 and S3. The mean endothelial length in the annotations was 3.22 mm. In the sectional planes S1, S2 and S3, the mean endothelial lengths were 2.40 mm, 3.10 mm, and 2.96 mm, respectively.
The results above are in agreement with the results of Figure 5, showing that the accuracy is best in the planes S2 and S3. In S1, the measured endothelial length is mostly too short. The deviation varies between 130 µm in S2 and 270 µm in S3.

4. Discussion

4.1. Determination of Punching Diameter

The TMA Grand-Master (3DHISTECH Ltd., Budapest, Hungary) offers a choice of four different punching-diameters (0.6, 1.0, 1.5, 2.0 mm), which can be selected according to the aim of the study and the targeted tissue. Since it was unclear how accurate the ngTMA® method operates, the biggest diameter was used for abdominal aorta, femoral artery, nerve and vein bundle (A&V) and epithelium of the tongue. Homogeneous tissues such as the renal medulla, were punched with a 1.5 mm diameter, except for the carotid artery. Skin tissue was punched with different punching diameters of 2, 1.5 and 1 mm. (Table 1). For reasons of tissue preservation to enable further studies, for each tissue type individual blocks were performed.
Independently of how the TMA design is ordered, it is essential that no symmetry exists [7]. If, by accident, a paraffin section lands upside down in the water bath and is, therefore, subsequently placed upside down on the microscope slide, identification and evaluation of each sample is not possible. A lack of symmetry was achieved in this study by omitting the first two punching positions on the TMA grid and subsequently inserting two positions with testicular control tissues. When using a distance of 0.7 mm between the punching cores, it is possible to insert up to 112 cores with a diameter of 1.5 mm and 66 cores with a diameter of 2 mm also according to the manufacturer’s specifications. This grid design was chosen to achieve a high number of punches that can be inserted into a single recipient block without compromising the sectioning process by tight margins [10,18,31,32,33].

4.2. Selection of the H&E Slides

To achieve the best digital overlay (Figure 1 and Figure 2), the last or second last slide was used for staining. This should ensure high accordance with the tissue donor block of the associated H&E slide [14]. An examination of the H&E slides was made by a pathologist, to confirm target areas.

4.3. Core Loss

In different studies, the amount of core loss varied between roughly 2% [11], 10–15% [4,7], and sometimes even up to 55% [18]. In the current analysis, tissue type played an essential role in the number of expected core losses, as depicted in Figure 3. The higher numbers in the case of skin tissue might be due to the fact that skin tissue in Wistar rats is rather rigid and quite tough. Another study from 2017 had similar problems with the skin of swiss mice [10]. Insufficient quality of TMA slides of spleen parenchyma in about one third of all samples has been described in a previous study [10]. By contrast, in our analysis, only 0.9% (5/550) core loss was recorded for spleen parenchyma and no significant issues regarding the quality of punches were detected. The high number of core losses in the case of the renal parenchymal tissue is also notable. This could be due to small hollow spaces and fatty tissue in the renal calyces, which may account for a rather inhomogeneous composition of the tissue blocks, possibly resulting in a lower frictional attachment of the core to the punching needle. Earlier studies have shown that there was a higher loss of cores if tumour tissue contained high amounts of fatty tissue [7]. In general, one may conclude that core loss varies between different soft tissue types. Skin tissue is more difficult to punch and cut, and a higher number of core losses should be expected. It is therefore advisable to obtain a higher number of cores from the donor block. In the current literature, there is no clear evidence for a significant correlation between core loss and the diameter of punches [22,34,35]. Three studies showed a lower amount of core loss with a diameter of 2.0 mm as compared to 1.0 [5,21], and 0.6 mm diameters [19]. The opposite was found in a study with better results for a 1.0 mm diameter when compared to 1.5 or 0.6 mm [10]. In the present study, good results with 2 and 1.5 mm diameters were obtained. However, we did not aim to further investigate the correlation of core loss in association with the punching diameter and it would be necessary to compare the same type of tissue using different punching diameters which might be a subject for further investigation. The choice of the suitable punching diameter should be made by careful consideration of the targeted tissue and the expected distribution of each target histochemical marker in projects.

4.4. Qualitative Accuracy

The accuracy depends on the tissue type; for example, there is significantly lower accuracy for skin and renal tissue (Figure 8). Notably these tissues also showed the highest core loss. One possible explanation of this is the low contrast between the H&E-stained skin tissue and the picture taken of the paraffin block by the TMA-Grandmaster. This leads to a more difficult alignment between digitalised H&E specimens containing the TMA annotations and the image. Related studies have reported that 90–95% of all TMA cores, using the ngTMA®-method, were usable for further analysis [13,27,30,31]. This matches with our results, where 87.5% of all tissues, and 96.6% when excluding skin, were suitable for further evaluation.
In conclusion, any research group should estimate an amount of roughly 10% loss using the ngTMA® method. Regarding the analysed qualitative accuracy in relation to the different cutting depth, it should be noted that not all TMA cores can be inserted into the paraffin on an equal level. It is therefore necessary to reach a certain cutting depth until all cores of a TMA block are represented. Therefore, researchers must keep in mind a minimum vertical thickness of punched tissue because on average 513 µm are required to reach the best level for further analysis.

4.5. Quantitative Accuracy

The quantitative analysis showed that the analysed next-generation TMA® technique yields a high accuracy rate in rat soft tissue. A total of 90% of all analysed cores were found to be displaced less than 500 µm from the targeted area. The accuracy decreases slightly with greater sectional depth, although, even in the deepest sectional plane S3, roughly 0.5 mm median depth, almost 90% of cores still had a deviation below 500 µm.
When analysing the accuracy using the measurement of the epithelial length in the aorta, the length in the S1 sectional plane was shorter than in the S2 and S3 planes (Figure 6). This can be explained by the fact that not all the TMA cores can be inserted on a precisely equal level in the TMA recipient block so the diameter of some of the tissue cores was not yet entirely represented in the S1 sectional plane. Overall, there was little distortion the endothelium in blood vessels during ngTMA creation.

4.6. Technical Recommendations and Limitations

Even though the ngTMA®-method appears to be very efficient and accurate, some technical difficulties and limitations remain. In the following several sources of errors are addressed, and recommendations on avoiding them during the process of creating a TMA block using the ngTMA®-method are given.
Recommendations/considerations to avoid core loss:
  • In this study, animal organs were resected and prepared especially for the execution of a TMA procedure. Hence, idealised conditions were created to embed organs and tissues into the paraffin in a good angulation and with a proper block thickness. If donor blocks are acquired from patient tissue samples and previous histopathological examinations were performed, it is important to ensure that the remaining tissue thickness is sufficient. The result of a decreased block thickness may be a higher amount of core loss due to reduced friction between tissue block and the used punching tool. Furthermore, proper block thickness ensures a good yield of TMA slides for further immunohistochemistry staining.
  • The organs used in this study were from healthy animals. No tumour tissue or inflammatory tissue was included. Therefore, a higher core loss when using samples from squamous cell carcinoma of the mouth or other oral malignant or inflammatory lesions is likely.
  • When a sample is collected, immediate and thorough fixation is paramount to reduce any degradation process and optimise tissue preservation and conservation.
  • In the case of skin tissue, we recommend using samples which are not too thick to shift the ratio of tissue to the surrounding paraffin. This may decrease the tissue-specific effect of skin, leading to a lower amount of core loss.
  • Different specific melting temperatures of the punched tissue and the surrounding paraffin may lead to deformation of tissue cores due to expansion and contraction. Paraffin blocks enriched with polymers are recommended [10].
Recommendations concerning slide processing:
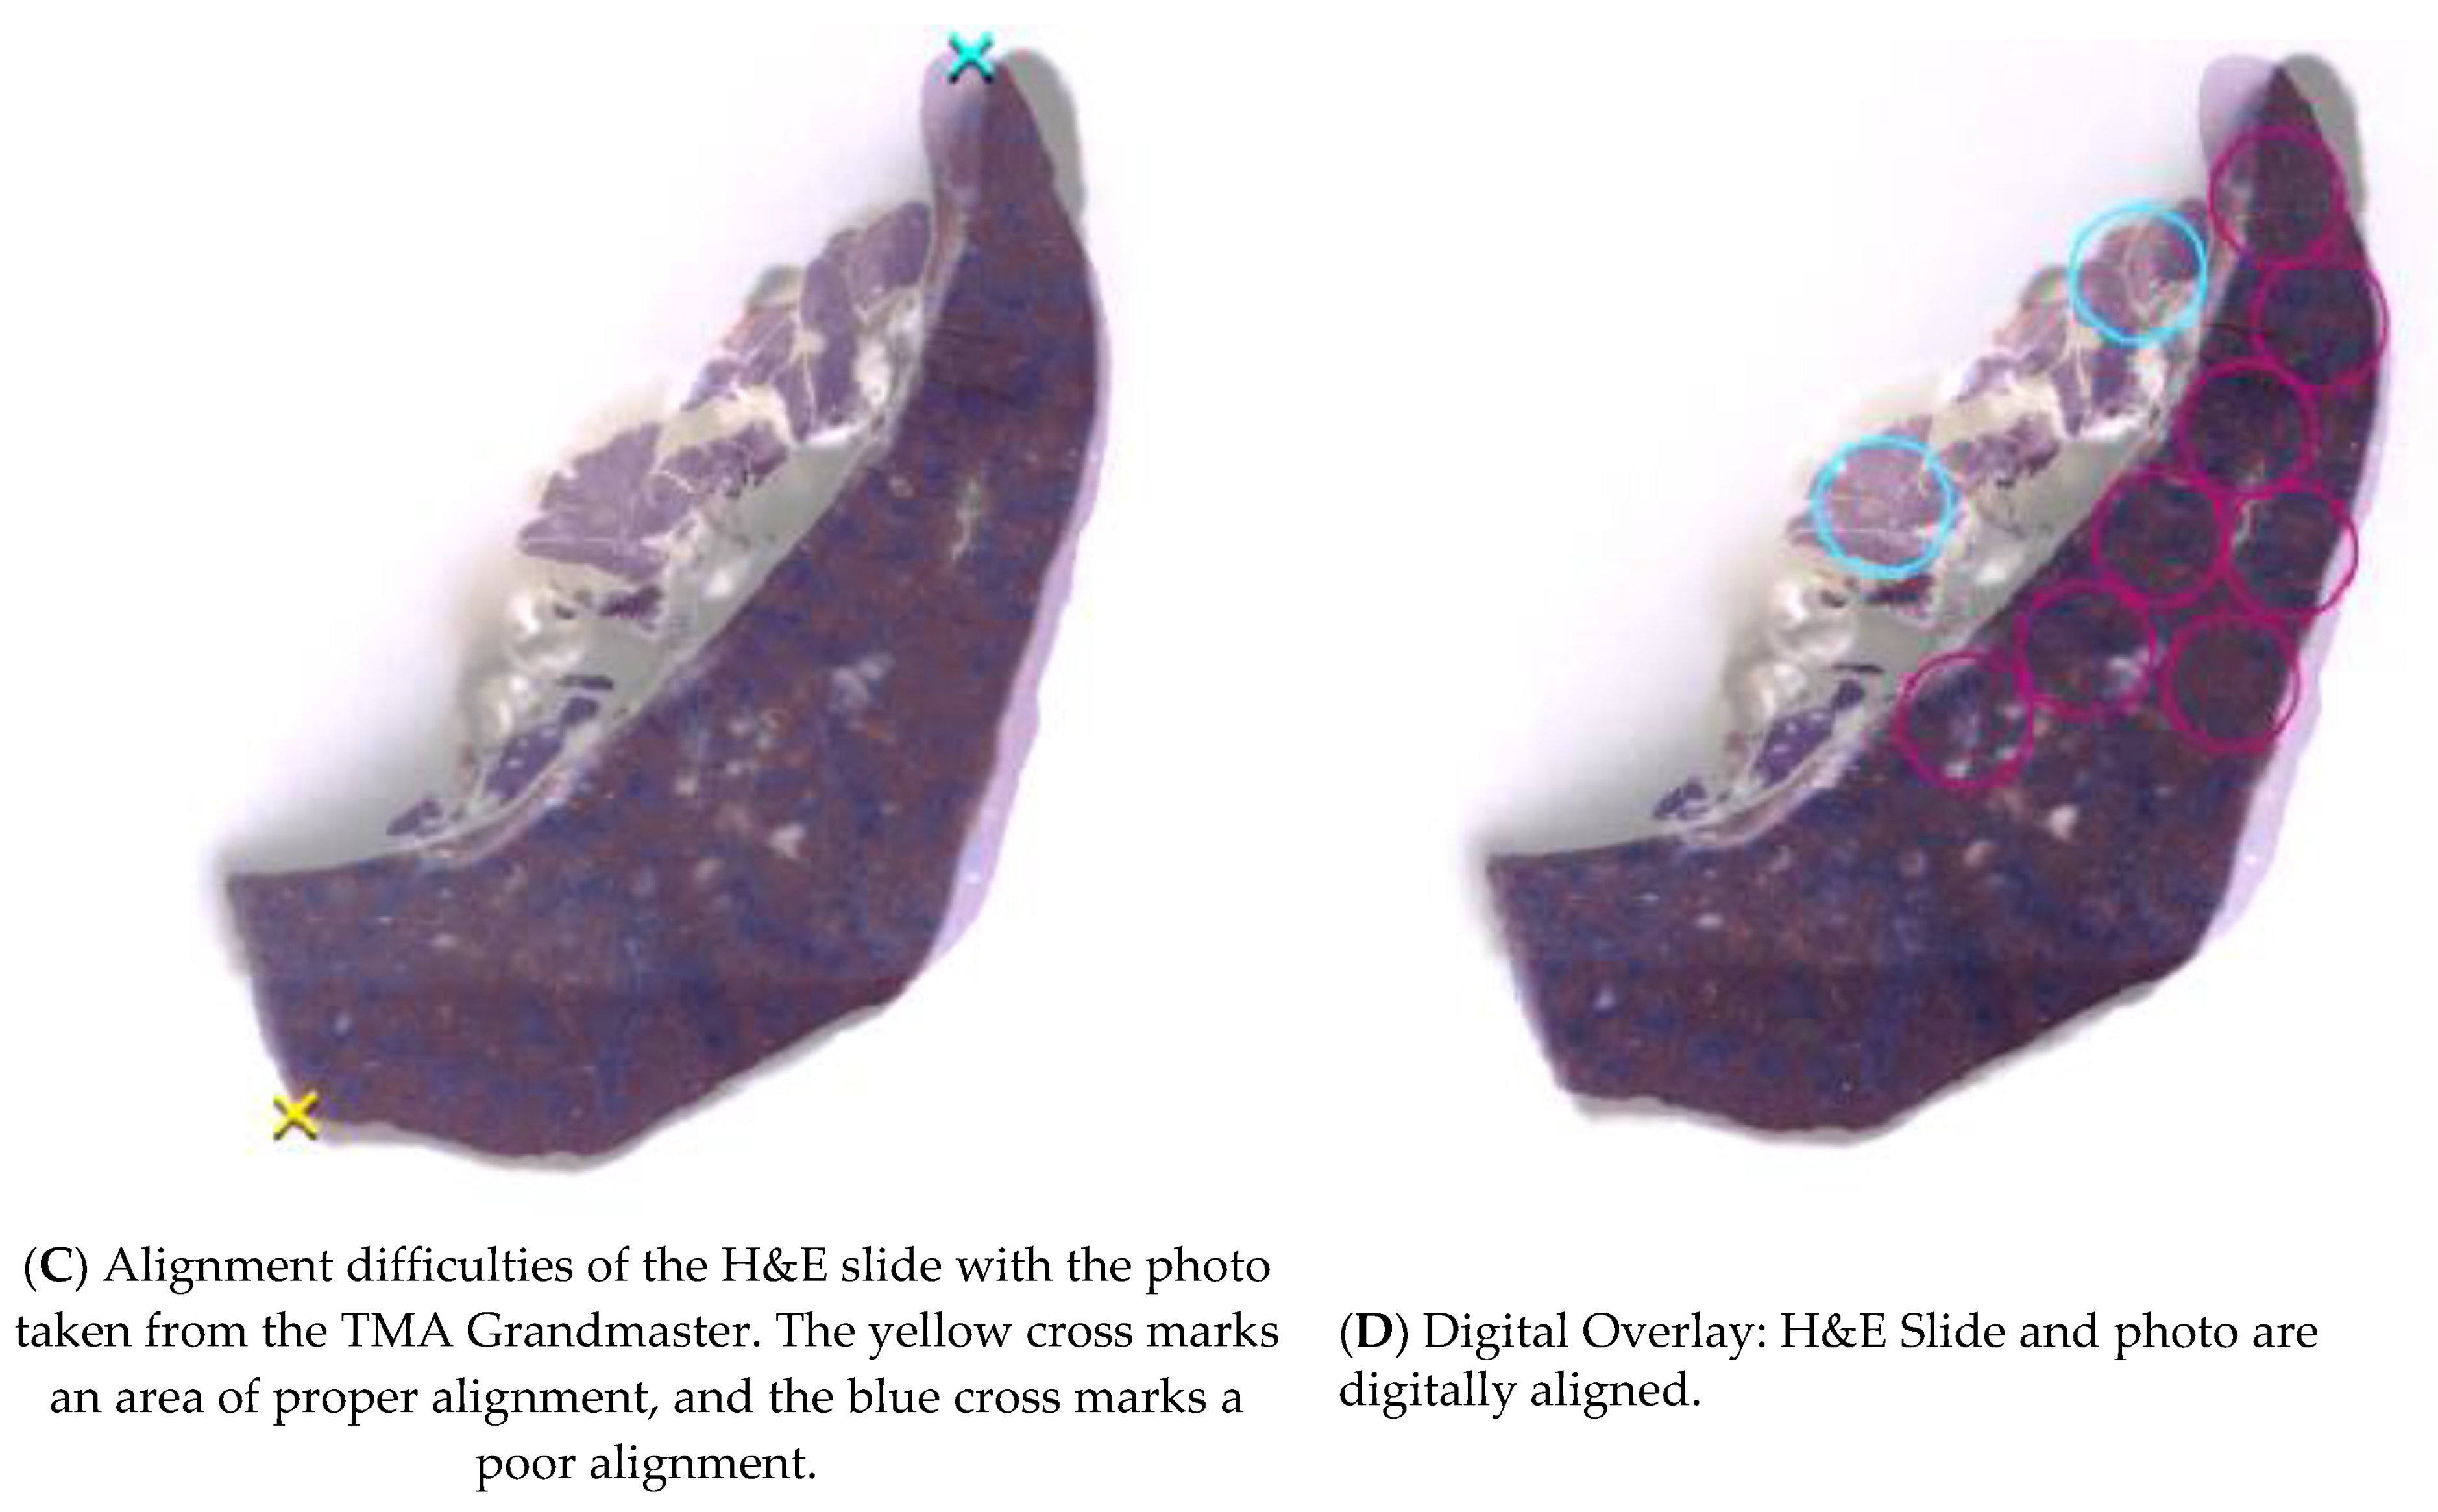
  • Mismatching of the H&E slide and the picture taken from the donor block can lead to inaccurate digital aligning (Figure 2). This may happen due to shrinkage in the water bath and distortion during the slicing and processing of the H&E slide. If possible, the last acquired slide from the donor block should be used, due to it having highest concordance to the remaining tissue.
  • Difficulties may arise during the slicing of the multi-tissue TMA blocks. Due to differing adjacent types of tissues, they may behave in an inhomogeneous way, if cut with the microtome. Therefore, it is advisable to use only one tissue type on each TMA if possible.
  • Unilateral contraction due to temperature differences in the sectioning process may result in a shifted ratio of the different areas of the punched core.
  • There should be empty paraffin on the sides of the TMA block to ensure enough space for the microtome to gain momentum to provide a clean cut when reaching embedded tissue cores. We recommend at least 2 mm.
  • Coated slides should be used to increase friction and minimise distortion effects.

5. Conclusions

The next-generation TMA®-method is reliable and accurate in different soft tissue types. It is suitable for the examination of delicate anatomical structures using a punching diameter of 1–2 mm. Core loss and quantitative accuracy are significantly associated with the punched tissue types. A higher core loss in skin and renal tissue, as well as tumour or inflammatory tissue samples, is to be expected. Even in deeper sectional layers, the punching target was reliably represented and a decrease in the hit rate was not observed. Small, fragile and hollow structures such as blood vessels show only little distortion upon ngTMA creation. Depending on the TMA quality and the used melting technique the first 100 to 250 μm of a ngTMA® block cannot be thoroughly evaluated because not all punched cores are placed precisely on the same level.

Supplementary Materials

The following are available online at https://www.mdpi.com/article/10.3390/app11125589/s1, Table S1: Description of used tissue and alignment in the donor block.

Author Contributions

F.W. applied for grant support. M.W. initiated the study, supervised it and contributed relevantly to the manuscript. S.M. collected the tissue specimen, established protocols and methods, conducted the study, interpreted the data and contributed relevantly to the manuscript. A.H. and S.M. performed the T.M. creation. C.G. and P.W.K. reviewed the study design. J.-E.W. contributed to data collection and wrote the manuscript. J.R., T.M. and R.L. contributed to the statistical assessment. C.G., J.R., F.W., P.W.K., T.M., R.L., G.F. and M.K. contributed to the discussion and critically reviewed the manuscript. All authors have read and agreed to the published version of the manuscript.

Funding

This study was funded by the Deutsche Forschungsgemeinschaft (DFG) grant no. WE52731/1-1.

Institutional Review Board Statement

The experiment was part of the DFG project WE52731/1-1. The local government authorities ‘Regierung von Mittelfranken’ approved the animal experiments (No 54-25321-3/09).

Informed Consent Statement

Not applicable.

Data Availability Statement

The datasets generated for this study are available on request to the corresponding author.

Acknowledgments

The authors thank Susanne Schoenherr, Elke Diebel and Patrick Möbius for technical assistance. Further thanks to W. Müller for providing the sketches used for Figure 1 and Figure 6. Furthermore, we would like to thank the team of the pathological institute of the University of Bern for the kind introduction in ngTMA® technique.

Conflicts of Interest

The authors declare that they have no competing interests.

References

  1. Battifora, H. The multitumor (sausage) tissue block: Novel method for immunohistochemical antibody testing. Lab. Investig. 1986, 55, 244–248. [Google Scholar]
  2. Kononen, J.; Bubendorf, L.; Kallioniemi, O.; Bärlund, M.; Schraml, P.; Leighton, S.; Torhorst, J.; Mihatsch, M.J.; Sauter, G.; Kallionimeni, O.-P. Tissue microarrays for high-throughput molecular profiling of tumor specimens. Nat. Med. 1998, 4, 844–847. [Google Scholar] [CrossRef]
  3. Behling, F.; Schittenhelm, J. Tissue microarrays—Translational biomarker research in the fast lane. Expert Rev. Mol. Diagn. 2018, 18, 833–835. [Google Scholar] [CrossRef]
  4. Voduc, D.; Kenney, C.; Nielsen, T.O. Tissue Microarrays in Clinical Oncology. Semin. Radiat. Oncol. 2008, 18, 89–97. [Google Scholar] [CrossRef] [PubMed] [Green Version]
  5. Eskaros, A.R.; Egloff, S.A.A.; Boyd, K.L.; E Richardson, J.; Hyndman, M.E.; Zijlstra, A. Larger core size has superior technical and analytical accuracy in bladder tissue microarray. Lab. Investig. 2017, 97, 335–342. [Google Scholar] [CrossRef]
  6. Barrette, K.; Oord, J.J.V.D.; Garmyn, M. Tissue Microarray. J. Investig. Dermatol. 2014, 134, 1–4. [Google Scholar] [CrossRef] [Green Version]
  7. Ilyas, M.; Grabsch, H.; O Ellis, I.; Womack, C.; Brown, R.; Berney, D.; Fennell, D.; Salto-Tellez, M.; Jenkins, M.; Landberg, G.; et al. Guidelines and considerations for conducting experiments using tissue microarrays. Histopathology 2013, 62, 827–839. [Google Scholar] [CrossRef] [PubMed]
  8. Merseburger, A.S. Die Tissue Microarray-Technik als neues “high throughput-tool” für den Nachweis differentieller Proteinexpression. J. Urol. Urogynaekol. 2013, 10, 7–11. [Google Scholar]
  9. Bubendorf, L. Tissue microarray (TMA) technology: Miniaturised pathology archives for high-throughput in situ studies. J. Pathol. 2001, 195, 72–79. [Google Scholar] [CrossRef] [PubMed]
  10. Santos, M.; Robeldo, T.; Castañeda, E.; Pagliarone, A.; Pinto, K.; Borra, R. Tissue microarray: Physical and chemical parameters involved in the construction of recipient blocks. J. Bras. Patol. Med. Lab. 2017, 53, 261–269. [Google Scholar] [CrossRef]
  11. Zlobec, I.; Koelzer, V.H.; Dawson, H.; Perren, A.; Lugli, A. Next-generation tissue microarray (ngTMA) increases the quality of biomarker studies: An example using CD3, CD8, and CD45RO in the tumor microenvironment of six different solid tumor types. J. Transl. Med. 2013, 11, 104. [Google Scholar] [CrossRef] [Green Version]
  12. Fowler, C.B.; Man, Y.-G.; Zhang, S.; O’Leary, T.; Mason, J.T.; Cunningham, R.E. Tissue Microarrays: Construction and Uses. Methods Mol. Biol. 2011, 724, 23–35. [Google Scholar] [CrossRef]
  13. Nolte, S.; Zlobec, I.; Lugli, A.; Hohenberger, W.; Croner, R.; Merkel, S.; Hartmann, A.; I Geppert, C.; Rau, T.T. Construction and analysis of tissue microarrays in the era of digital pathology: A pilot study targeting CDX1 and CDX2 in a colon cancer cohort of 612 patients. J. Pathol. Clin. Res. 2017, 3, 58–70. [Google Scholar] [CrossRef] [PubMed] [Green Version]
  14. Zlobec, I.; Suter, G.; Perren, A.; Lugli, A. A Next-generation Tissue Microarray (ngTMA) Protocol for Biomarker Studies. J. Vis. Exp. 2014, 2014, e51893. [Google Scholar] [CrossRef] [PubMed] [Green Version]
  15. Thunnissen, E.; for the European Thoracic Oncology Platform Lungscape Consortium; Kerr, K.M.; Dafni, U.; Bubendorf, L.; Finn, S.P.; Soltermann, A.; Biernat, W.; Cheney, R.; Verbeken, E.; et al. Programmed death-ligand 1 expression influenced by tissue sample size. Scoring based on tissue microarrays’ and cross-validation with resections, in patients with, stage I–III, non-small cell lung carcinoma of the European Thoracic Oncology Platform Lungscape cohort. Mod. Pathol. 2019, 33, 792–801. [Google Scholar] [CrossRef] [PubMed]
  16. Camp, R.L.; Neumeister, V.; Rimm, D.L. A Decade of Tissue Microarrays: Progress in the Discovery and Validation of Cancer Biomarkers. J. Clin. Oncol. 2008, 26, 5630–5637. [Google Scholar] [CrossRef] [PubMed]
  17. Andeen, N.K.; Bowman, R.; Baullinger, T.; Brooks, J.M.; Tretiakova, M.S. Epitope Preservation Methods for Tissue Microarrays: Longitudinal Prospective Study. Am. J. Clin. Pathol. 2017, 148, 380–389. [Google Scholar] [CrossRef] [PubMed] [Green Version]
  18. E Pinder, S.; Brown, J.P.; Gillett, C.; A Purdie, C.; Speirs, V.; Thompson, A.M.; Shaaban, A.M. The manufacture and assessment of tissue microarrays: Suggestions and criteria for analysis, with breast cancer as an example. J. Clin. Pathol. 2012, 66, 169–177. [Google Scholar] [CrossRef] [PubMed]
  19. Visser, N.C.M.; Van Der Wurff, A.A.M.; Pijnenborg, J.M.A.; Massuger, L.F.A.G.; Bulten, J.; Nagtegaal, I. Tissue microarray is suitable for scientific biomarkers studies in endometrial cancer. Virchows Archiv. 2018, 472, 407–413. [Google Scholar] [CrossRef] [PubMed] [Green Version]
  20. Chavan, S.S.; Ravindra, S.; Prasad, M. Breast Biomarkers-Comparison on Whole Section and Tissue Microarray Section. J. Clin. Diagn. Res. 2017, 11, EC40–EC44. [Google Scholar] [CrossRef] [PubMed]
  21. Neves-Silva, R.; Fonseca, F.P.; de Jesus, A.S.; Pontes, H.A.R.; Rocha, A.C.; Brandão, T.B.; Vargas, P.A.; Lopes, M.A.; Almeida, O.P.; Santos-Silva, A.R. Tissue microarray use for immunohistochemical study of ameloblastoma. J. Oral Pathol. Med. 2016, 45, 704–711. [Google Scholar] [CrossRef]
  22. Jones, S.; Prasad, M.L. Comparative Evaluation of High-Throughput Small-Core (0.6-mm) and Large-Core (2-mm) Thyroid Tissue Microarray: Is Larger Better? Arch. Pathol. Lab. Med. 2012, 136, 199–203. [Google Scholar] [CrossRef] [PubMed]
  23. Tramm, T.; Kyndi, M.; Sørensen, F.B.; Overgaard, J.; Alsner, J. Influence of intra-tumoral heterogeneity on the evaluation of BCL2, E-cadherin, EGFR, EMMPRIN, and Ki-67 expression in tissue microarrays from breast cancer. Acta Oncol. 2017, 57, 102–106. [Google Scholar] [CrossRef] [Green Version]
  24. Böhm, J.; Muenzner, J.K.; Caliskan, A.; Ndreshkjana, B.; Erlenbach-Wünsch, K.; Merkel, S.; Croner, R.; Rau, T.T.; Geppert, C.I.; Hartmann, A.; et al. Loss of enhancer of zeste homologue 2 (EZH2) at tumor invasion front is correlated with higher aggressiveness in colorectal cancer cells. J. Cancer Res. Clin. Oncol. 2019, 145, 2227–2240. [Google Scholar] [CrossRef] [PubMed] [Green Version]
  25. Hoos, A.; Cordon-Cardo, C. Tissue Microarray Profiling of Cancer Specimens and Cell Lines: Opportunities and Limitations. Lab. Investig. 2001, 81, 1331–1338. [Google Scholar] [CrossRef] [PubMed] [Green Version]
  26. Shergill, I.S.; Rao, A.R.; Anjum, F.H.; Arya, M.; Patel, H.R.; Mundy, A.R. Tissue Microarrays and Their Relevance to the Urologist. J. Urol. 2006, 175, 19–26. [Google Scholar] [CrossRef]
  27. Vesterinen, T.; Mononen, S.; Salmenkivi, K.; Mustonen, H.; Räsänen, J.; Salo, J.A.; Ilonen, I.; Knuuttila, A.; Haglund, C.; Arola, J. Clinicopathological indicators of survival among patients with pulmonary carcinoid tumor. Acta Oncol. 2018, 57, 1109–1116. [Google Scholar] [CrossRef] [PubMed] [Green Version]
  28. Edin, S.; Kaprio, T.; Hagström, J.; Larsson, P.; Mustonen, H.; Böckelman, C.; Strigård, K.; Gunnarsson, U.; Haglund, C.; Palmqvist, R. The Prognostic Importance of CD20+ B lymphocytes in Colorectal Cancer and the Relation to Other Immune Cell subsets. Sci. Rep. 2019, 9, 19997–19999. [Google Scholar] [CrossRef]
  29. Laedrach, C.; Salhia, B.; Cihoric, N.; Zlobec, I.; Tapia, C. Immunophenotypic profile of tumor buds in breast cancer. Pathol. Res. Pract. 2018, 214, 25–29. [Google Scholar] [CrossRef]
  30. Hadgu, E.; Seifu, D.; Tigneh, W.; Bokretsion, Y.; Bekele, A.; Abebe, M.; Sollie, T.; Merajver, S.D.; Karlsson, C.; Karlsson, M.G. Breast cancer in Ethiopia: Evidence for geographic difference in the distribution of molecular subtypes in Africa. BMC Women’s Health 2018, 18, 40. [Google Scholar] [CrossRef] [Green Version]
  31. Montaser-Kouhsari, L.; Knoblauch, N.W.; Oh, E.-Y.; Baker, G.; Christensen, S.; Hazra, A.; Tamimi, R.M.; Beck, A.H. Image-guided Coring for Large-scale Studies in Molecular Pathology. Appl. Immunohistochem. Mol. Morphol. 2016, 24, 431–435. [Google Scholar] [CrossRef] [Green Version]
  32. Fedor, H.L.; De Marzo, A.M. Practical methods for tissue microarray construction. Methods Mol. Med. 2005, 103, 89–101. [Google Scholar] [PubMed] [Green Version]
  33. Kampf, C.; Olsson, I.; Ryberg, U.; Sjöstedt, E.; Pontén, F. Production of tissue microarrays, immunohistochemistry staining and digitalisation within the human protein atlas. J. Vis. Exp. 2012, 63, 3620. [Google Scholar]
  34. Kwon, M.J.; Nam, E.S.; Cho, S.J.; Park, H.R.; Shin, H.S.; Park, J.H.; Park, C.H.; Lee, W.J. Comparison of tissue microarray and full section in immunohistochemistry of gastrointestinal stromal tumors. Pathol. Int. 2009, 59, 851–856. [Google Scholar] [CrossRef]
  35. Fonseca, F.P.; De Andrade, B.A.B.; Rangel, A.L.C.A.; Della Coletta, R.; Lopes, M.A.; D Almeida, O.P.; Vargas, P.A. Tissue microarray is a reliable method for immunohistochemical analysis of pleomorphic adenoma. Oral Surg. Oral Med. Oral Pathol. Oral Radiol. 2014, 117, 81–88. [Google Scholar] [CrossRef] [PubMed] [Green Version]
Figure 1. Workflow of automated TMA Production. One donor block is selected, and an H&E slide is made and digitalised. In this digital image, an annotation is marked. The Tissue-Microarrayer now takes a picture of the donor block, and a digital overlay with the annotated H&E slide is made by the operator. Now the annotated region is punched and transferred into the recipient TMA block. 3D sketches with kind permission of W. Müller.
Applsci 11 05589 g001
Figure 2. Digital Overlay and Alignment. Shown is the digital overlay and alignment using a photo taken by the tissue microarrayer and the digitalised H&E slide with the previously set annotations marking the targeted punching area. (A) picture taken by the TMA Grandmaster of an inserted donor block. The two crosses mark the uppermost und lowermost border of the tissue. (B) Digital H&E Slide with set annotations. It is possible to choose different colours for each target area. (C) Overlay of the H&E slide with the photo taken from the TMA Grandmaster and demonstrates the sometimes-occurring alignment difficulties. The yellow cross marks an area of proper alignment, and the blue cross marks a poor alignment. (D) Digital Overlay after alignment of the H&E Slide and photo with previously set annotations.
Applsci 11 05589 g002aApplsci 11 05589 g002b
Figure 3. Correlation of core Loss and tissue type. (A) H&E slide of a donor block on the left side before and on the right side after the punching procedure. Punched areas (*) and one core loss (arrow) on a renal specimen. (B) Core loss is shown in correlation to the different tissue types in percent. CL_pre shows the core loss before and CL_post the core loss after manual replacement of dispatched tissue cores. There is a strong significance (p < 0.001, Chi-Square), indicated with **, when comparing skin tissue to the other tissues and a significant difference (p < 0.01), indicated with *, when comparing the Renal medulla and A&V-tissue with the renal cortex, myocard and spleen tissues. (C) The table contains the total number and the percentage of core loss.
Applsci 11 05589 g003
Figure 4. Example of the qualitative analysis. The left picture shows the digitalised H&E slide of the donor block with its annotation marking the carotid artery and the vagus nerve. The right image shows the corresponding core on the TMA H&E slide. (A) is an example of a structure ‘completely hit’, which leads to code 2. Note the different shapes of the artery and the nerve between the left and the right image, resulting from the 3-dimensional passage of the structures through the surrounding tissues. (B) is an example of a structure ‘partially hit’. The nerve was hit, but the aorta is only partially captured. This leads to code 1.
Applsci 11 05589 g004
Figure 5. Qualitative Accuracy regarding the Cutting plane. Colours for the S1 plane are deliberately more faint because it did not always contain all punched cores already, since the top of each core is not necessarily precisely in the same sectional plane. This circumstance limits the comparability of the S1 data. The number 2 indicates that the target was completely hit, number 1 indicates a partially hit, 0 indicates that the target was missed.
Applsci 11 05589 g005
Figure 6. Comparison of the endothelial length. (A) Correlation between the sectioning depth (S1, S2, S3) and the accuracy of the ngTMA® method. An exemplary target structure in a paraffin block may deviate due to sectioning depth. (B) The figure shows the H&E section of the donor block (DB) on the left-hand side, followed to the right side by three slides of descending sectional depth (S1, S2, S3) of the respective TMA block. The endothelial surface is marked in blue. Listed underneath each picture is: 1. the sectional plane (S1, S2, S3) and the corresponding depth in µm, 2. the measured length in µm and 3. the deviation percentage comparing the length of the TMA slide with the annotated H&E slide. (C) Distribution of the endothelial length depending on the sectional plane DB: Donor-Block (n = 90), sectional plane: S1: n = 43; S2: n = 89; S3: n = 48. The Rhombus-Symbol (•) marks the arithmetic mean. There is a strong significance (p < 0.001), indicated with **, when comparing the DB with the sectional plane S1, but no statistically significance when comparing DB to sectional planes S2 and S3. 3D sketches with kind permission of W. Müller.
Applsci 11 05589 g006aApplsci 11 05589 g006b
Figure 7. Quantitative Accuracy. (A) Example for the determination of the quantitative accuracy. The distance between a target structure on the H&E slide of a donor block and the inner margin of the set annotation was measured and compared to the length with the respective measures in the TMA-Slide. Shown here is an example of outstanding accuracy, with a difference of less than 100 µm. (B) The graph shows the deviation between the digitally set annotation and the TMA Slide. The number of punch cores analysed was plotted against the deviation of these cores in the different sectional planes (S1, S2, S3). The coding of the deviation on the horizontal axis is as follows: 1 0–99 µm deviation; 2 100–199 µm deviation; etc. (C) The table shows the distribution of the accuracy in the different sectional planes (S1, S2, S3).
Applsci 11 05589 g007
Figure 8. Qualitative Accuracy in different tissues. (A) The diagram shows different soft tissues depending on the qualitative punching accuracy in correlation to the punch specification. The numbers 2, 1 and 0 in the legend stand for ‘completely hit’, ‘partially hit’ or ‘missed’ punch specifications. The bar labelling denotes the respective number of punch cores. The bar width shows the percentage of cores. (B) Overview of the main results presented in (A) to investigate qualitative accuracy.
Applsci 11 05589 g008
Table 1. Examined tissue types collected from 108 sacrificed Wistar rats.
Targeted Punching AreasNumber Tissue Samples/Donor BlocksNumber of PunchesPunching Diameter in mm
Abdominal Aorta92922
Femoral artery, nerve and vein97972
Carotid artery82821.5
Myocardial muscle tissue1083241.5
Lung parenchyma1053151.5
Spleen parenchyma (red and white pulp)925501.5
Pancreas921121.5
Renal medulla or cortex1146361.5
Basal lamina of the tongue1074922
Skin tissue1045412/1.5/1
Testis (control-tissue-sample)8802/1.5
Publisher’s Note: MDPI stays neutral with regard to jurisdictional claims in published maps and institutional affiliations.

