Article

Indoor Environmental Quality and Consumption Patterns before and during the COVID-19 Lockdown in Twelve Social Dwellings in Madrid, Spain

by
Fernando de Frutos
1,
Teresa Cuerdo-Vilches
1,*,
Carmen Alonso
1,
Fernando Martín-Consuegra
1,
Borja Frutos
1,
Ignacio Oteiza
1 and
Miguel Ángel Navas-Martín
2
1
Instituto de Ciencias de la Construcción Eduardo Torroja, Consejo Superior de Investigaciones Científicas (IETcc-CSIC), 28033 Madrid, Spain
2
Escuela Nacional de Sanidad, Instituto de Salud Carlos III (ENS, ISCIII), 28029 Madrid, Spain
*
Author to whom correspondence should be addressed.
Sustainability 2021, 13(14), 7700; https://doi.org/10.3390/su13147700
Submission received: 3 June 2021 / Revised: 25 June 2021 / Accepted: 1 July 2021 / Published: 9 July 2021

Abstract

:
This article analyses the situation that prevailed in 12 dwellings located on the outskirts of Madrid during Spain’s state of emergency. How did 24/7 occupation affect the quality of indoor air and power consumption patterns? The mixed method used (surveys and instrumental monitoring) pragmatically detected the variation in consumption, comfort and indoor air quality patterns before and during the COVID-19 pandemic. The characteristics initially in place and household predisposition had a conclusive effect on such variations. The starting conditions, including household composition, habits and the way daily activities were performed, differed widely, logically affecting power consumption: 8/12 case studies increase occupancy density by more than 25 percent; 11/12 improve thermal comfort; 10/12 improve air quality but not necessarily translate in a sufficient ventilation practices; air quality was lower in the bedrooms on the whole; only 4/12 case studies use the potential of passive measures; only one household adopted energy savings strategies; 10/12 case studies increase electric power consumption but none of the dwellings was fitted with a renewable power generation system. The conclusion drawn is that, despite starting conditions differing widely, household composition, habits (including performance of daily activities performance) and power consumption also played an active role in the end result. This approach allowed to integrate qualitative and quantitative findings on indoor environmental quality (IEQ), energy use and households’ behavior. The objective data on the energy situation of the case studies not only is useful for the study, but also for potential enrollment in energy rehabilitation programs, such as the European Regional Development Fund (ERDF).

1. Introduction

The SARS-CoV-2 pandemic has created a worldwide health emergency of historic impact [1]. Between the time cases of pneumonia of unknown origin were detected in Asia in December 2019 [2] and the confirmation of the first 10 cases in Europe, i.e., through 30 January 2020, 7818 cases had been diagnosed worldwide [3]. On 11 March 2020, the World Health Organisation (WHO) raised the SARS-CoV-2 epidemic to pandemic status [4]. Three days later, a state of emergency was decreed in Spain [5]. Three weeks later, the cumulative number of deaths in all European countries peaked at 88,581, nearly 35,000 in excess of the 50,000 normally expected [6]. Prior to that date, the WHO had issued a communiqué on the extreme public health measures to be adopted to prevent even worse consequences due to the propagation of the disease [7].
In Spain, as well as in other countries, lockdown was decreed as a protective, preventive or propagation containment strategy. In Spain, that entailed remaining indoors at home with very specific exceptions, as well as the closure of all educational institutions and furtherance of remote working wherever possible. As the state of emergency and preventive interruption of many activities had enormous economic and social impact, however, especially among the most vulnerable communities [8], the national Government sought and obtained Ministry of Health endorsement to ease restrictions for a gradual return to normality subject to the infection rates [9]. Lockdown gave rise to an unusual situation in which, beginning on 14 March and through 21 June, everyone was generally home-bound 24 h daily [10]. With households constantly occupying shared space, all activities, including those normally conducted in schools [11,12], offices [13] or out of doors [14] were concentrated in the home. For weeks, cities were relieved of mobility- and human activity-induced pressures [15,16,17], which were shifted indoors [18].
Years earlier, the WHO had alerted to the importance of housing on human health [19]. Dwelling conditions normally affect occupants’ quality of life and life expectancy, as well as the onset or worsening of disease, whilst improved building design has consistently been associated with epidemiological event-based learning and the evolution to healthier habitation models [20]. Poor indoor air quality, the tenth avoidable health risk listed by WHO, and similar specific factors affect human health directly [21]. Some of those factors have been studied as well in connection with their possible impact on COVID-19 infection [22]. Housing has not in vain been included by the Spanish Government as a determinant in health-related social inequality [23].
Human beings normally spend over 90% of their lives indoors, where pollutant concentration is two- to five-fold higher than outdoors [24]. People may be more or less healthy depending on the quality of their indoor environment. Habitability may be defined essentially in terms of minimum occupation density and health- and safety-related standards such as hygiene along with infrastructure operation and maintenance to guarantee safe and pleasant surroundings. The objective in connection with thermal comfort is to maintain temperature and relative humidity within a range acknowledged as comfortable or sufficient for personal well-being [25,26]. Other items also addressed in indoor environmental quality studies include visual comfort and natural lighting [27,28], air quality (in turn related to the ventilation needed to eliminate or dilute suspended or deleterious pollutants and provide a source of clean air) [29,30] and acoustic comfort [31].
In addition, lockdown has directly or indirectly induced significant change in behaviours and home usage [32]. Any number of studies on the psychological impact of lockdown have been conducted to understand how compulsory confinement within the home has been experienced, along with the situations arising, associated primarily with stress, anxiety and other adverse effects on the population’s emotional health. Housing layout and other home attributes have been observed to play a part in such issues [33].
The questions identified as being in need of in-depth analysis included: what is happening at home? What changes in habits and everyday life have been brought on by lockdown? How have those changes affected dwellings? Did dwellings adapt well to household needs? What shortcomings were detected? What indirect impact did lockdown have on health, over and above COVID-19 infection? Finally, what desirable home improvements were identified by households? All the foregoing issues have been addressed from the standpoints of power consumption, indoor environmental quality and personal well-being in domestic surroundings. Very few studies have focused on indoor environmental quality, housing comfort or power consumption patterns and their possible impact on life, for the priority in lockdown as an emergency public health measure was to protect the population against infection and provide a safe environment via social distancing.
The HABITA-RES project was underway during lockdown [34]. The project consisted in assessing power use by recording consumption and indoor air quality data in inefficient housing on the outlying districts of Madrid to detect opportunities for building rehabilitation. The availability of that database afforded an occasion to analyse the situation prevailing before and during lockdown to identify the implications of the intense housing usage resulting from such exceptional circumstances.
The interest and relevance of this study in the current literature on COVID-19, housing and households and their interaction in extreme conditions of confinement is developed in the following section in more detail. In particular, aspects based on indoor environmental quality (including thermal comfort) as well as energy consumption in the home are exposed.

2. Literature Analysis

The literature in the field of energy use in the home, and especially during the COVID-19 confinement period, has been approached in different ways, depending on the object of study and the aspect or scale to be addressed. At more general levels, a significant decrease in energy demand has been observed, although confinements due to social isolation have increased consumption associated with housing [35,36,37]. This alteration would entail important changes in the household economy [38], especially for the most vulnerable population segments [39].
Some of these studies have unevenly addressed how it has affected these sectors of the population socioeconomically and in relation to health, according to the access to minimum comfort and energy, for the performance of daily life in this unusual context [40,41,42], including the risks associated with physical and psychological well-being [43,44]. Others have listed solutions adopted by governments and public institutions to support these vulnerable households in these times of uncertainty and need [45,46,47]. Furthermore, some of these studies vindicate the role of housing inefficiency in aggravating the energy vulnerability, even poverty, of these households [48]. However, this aspect seems to be not specifically included in recovery strategies and measures related to COVID-19 in general terms [49].
More specifically, the literature on the housing indoor environment and households’ well-being in the confinement context, is approached from different scopes and territorial scales.
Some of the studies analyzed the domestic energy globally [16]. Others focused either on specific collectives, or comparing certain domestic facilities and supplies before and during pandemic, for instance, cooking [50] or the availability of cooling/heating devices [51].
In Spain, this panorama has not been different from that experienced globally in other developed countries [52,53], also considering the alleviation measures available for vulnerable people [54]. Other research approached other scales, such as regional or urban ones, even separating by consumers, but with no consideration of lifestyles, habit changes and the housing performance from a dual perspective of household-dwelling and bearing in mind the incidence of the confinement itself [55].
Analogously, derived from the relocation of work [56,57] and telestudy by school closure [12], many daily commutes were avoided [58]. In addition, for those people working in essential jobs, safer and individual displacement modalities were boosted, such as walking [59], cycling [60] and even running [61]. This mobility change led to better environmental indices due to a decreasing pollution of outdoor air, a reduction of fossil-fuel intakes, and therefore, of generated emissions [62,63,64]. The outdoor air pollution could aggravate cases of people affected by coronavirus [65]. In turn, the permanence of people in the home together and for a long time, could lead to an overexposure to certain environmental pollutants or potentially harmful agents, such as volatile organic compounds (VOC), radon, formaldehyde, CO and CO2 and moisture, among others [30,66]. This overexposure could lead in turn not only to the generation or worsening of health problems, but to affect the well-being of people already subjected to certain stress and other discomforts due to the very unusual circumstance itself [67,68].
In this sense, more people staying inside their homes for a longer time clearly affects the production of CO2, which can only be alleviated to the extent that good ventilation habits are practiced in proportion to such permanence [69]. Furthermore, these habits have been especially promoted due to the aerosol transmission of SARS-CoV-2 [70], being that CO2 is a great tracer to indirectly measure the level of space ventilation, and thus, to evaluate the potential exposition to inhale the coronavirus.
In the same way, the humidity generated by human activity depending on the type of activity, by latent heat, as well as by the use of certain equipment, must also be counteracted with evacuation systems, by dilution with outside air [71]. Finally, the role of indoor temperature is vital to guarantee a comfortable environment that allows the well-being of people, thus avoiding problems that affect daily life, as well as the performance of activities and the health of its inhabitants. At the same time, if energy consumption, which is presumed increased by the greater permanence in the home of all the cohabitants [72], can also give an idea of the satisfaction of comfort in the home.
Especially during the COVID-19 pandemic, the energy and indoor environmental aspects in housing need to be considered in ways that realistically reflect households’ experiences, including their daily life, possible alterations in behavior and routines, affecting energy consumption, occupancy, and ventilation and lighting habits, among others [73].
Therefore, a shortage of studies is perceived that comprehensively disclose the households’ behaviors and their relationship with the changes in habits and routines in terms of energy consumptions for each facility or supply, thermal comfort and indoor environmental quality in general in order to solve new and former needs in the domestic milieu. This analysis contributes to a better understanding, from a mixed perspective of detailed and quality home data, on how public health measures such as confinement affect the population and, therefore, their lives, with impacts in their social, economic, safety and health scopes, derived from the consequences on energy consumption and the quality of the indoor environment.
The aim of this study consisted of analysing the factors in which COVID-19-induced lockdown affected everyday life in vulnerable homes in the city of Madrid, and specifically in terms of comfort, indoor environmental quality and energy use. In addition, the specific objectives were: (1) define to what extent there was an alteration in the daily life and performance of the case-study homes, determining the causes and concrete consequences in the interior environmental quality and energy consumption; (2) quantify and qualify the alterations produced in previous domestic settings, comparatively in the periods before/during confinement; and (3) assess the comparison between the perception of such factors reported by surveyed respondents and the objective values of the respective parameters delivered by sensors installed in the living room and master bedroom.
Occupant behaviour has significant impact on power consumption and indoor environmental quality [74,75]. Therefore, two research questions were posed: Q1: Did power consumption, environmental behaviour or indoor comfort vary in vulnerable homes under the exceptional circumstances imposed by COVID-19? If so, how?; and Q2: Were significant differences identified between what home dwellers perceived and objective instrumental data?
A mixed method is applied based on questionnaires and monitoring. In addition to the surveys that help to detail the realities of each home before and during the pandemic, three parameters of the indoor environment usually chosen to be monitored in the dwellings are also used in this analysis: temperature, humidity and CO2, along with energy consumption. This also allows the related analysis of people’s behavior in the domestic environment, including those guidelines that directly affect indoor environmental quality, energy consumption and indoor comfort in homes in a comparative way that considers both normal circumstances and confinement.
This mixed method, as will be developed in Section 3, offers a more complete and enriched understanding of the reality lived in confinement. In addition, unlike many other studies, this one offers information on twelve social dwellings in a European capital, such as Madrid (Spain), covering all the main deprived areas of the city, geographically well distributed throughout the urban area, which gives a special interest to the study. This study also took advantage of the opportunity through a broader project, HABITA_RES. This could facilitate a longitudinal analysis, comparing not only the monitoring of the two periods, before and during the COVID-19 confinement, but also the declared data by respective surveys. In fact, the contact already maintained with the households also allowed for the access to any behavioral or routine change, as well as the collection of newly declared data. In this way, a common discourse merging from the two perspectives and techniques under the mixed method approach differs from what is commonly exposed in other studies where a mere separate analysis is given from each approach, either quantitative, or qualitative one.
The further purpose of the researchers is to contribute to the current literature addressing the real needs of the most vulnerable users that should be borne in mind in design and rehabilitation geared toward decarbonisation and energy transition [33]. More specifically, it analysed such needs under the extreme circumstances spawned by confinement to living quarters decreed to contain the COVID-19 pandemic.

3. Materials and Methods

The HABITA_RES project [34] monitored a sample of 22 dwellings in six multi-family buildings, each in a different neighbourhood on the outskirts of Madrid (Figure 1).
Of the 22 dwellings covered in the project, 12 were analysed as case studies, labelled as follows: CS1, CS2 in San Blas (brown), CS3, CS4 in Manoteras (cyan), CS5, CS6 in Carabanchel (red), CS7, CS8, CS9 in Orcasitas (magenta), CS10, CS11 in Fuencarral (blue) and CS12 in Villaverde (green). All households, with the exception of the flat in Orcasitas which was included in the sample for its deficient construction and refurbishment planned for the near future, were built as social housing prior to 1980 when the insulation requirements stipulated in code NBE CT-79 entered into effect.
Table 1 summarises the general characteristics of each dwelling: year of construction, general upkeep, usable area, building type, orientation-exposure to the sun, type of most immediate surrounds and power source and facilities. The information was drawn from the two surveys described in Section 3.2; the public information on record with the cadastre (year of construction and dwelling floor area [76]) or the Ministry for Development’s Secretariat of State for Infrastructure, Transport and Housing (thermal characteristics as defined in keeping with the year of construction [77]). All the aforementioned general characteristics are described in detail, for they affect energy behaviour and, consequently, consumption associated with maintaining thermal comfort and indoor air quality.
This study deployed a mixed method [78,79,80,81] as a pragmatic approach to data collection on variations in consumption, comfort and indoor air quality before and during the COVID-19 pandemic, and the detection of any significant differences between user perception and the sensor-logged values for the parameters were analysed. The mixed method consisted in integrating the qualitative, survey-collected data using questionnaires with alternating open- and close-ended questions [82,83,84,85] and the quantitative information obtained instrumentally to explain and validate the findings. Data interconnection was based on explanatory sequential design and data merging [80]. The former used the qualitative data to explain and interpret the key quantitative findings. Data merging deploys a common language to perform simultaneous triangulation in which data compiled from different sources are used [85] to confirm, corroborate or cross-validate findings. The mixed method approach followed is illustrated in Figure 2.

3.1. Study Timeframe
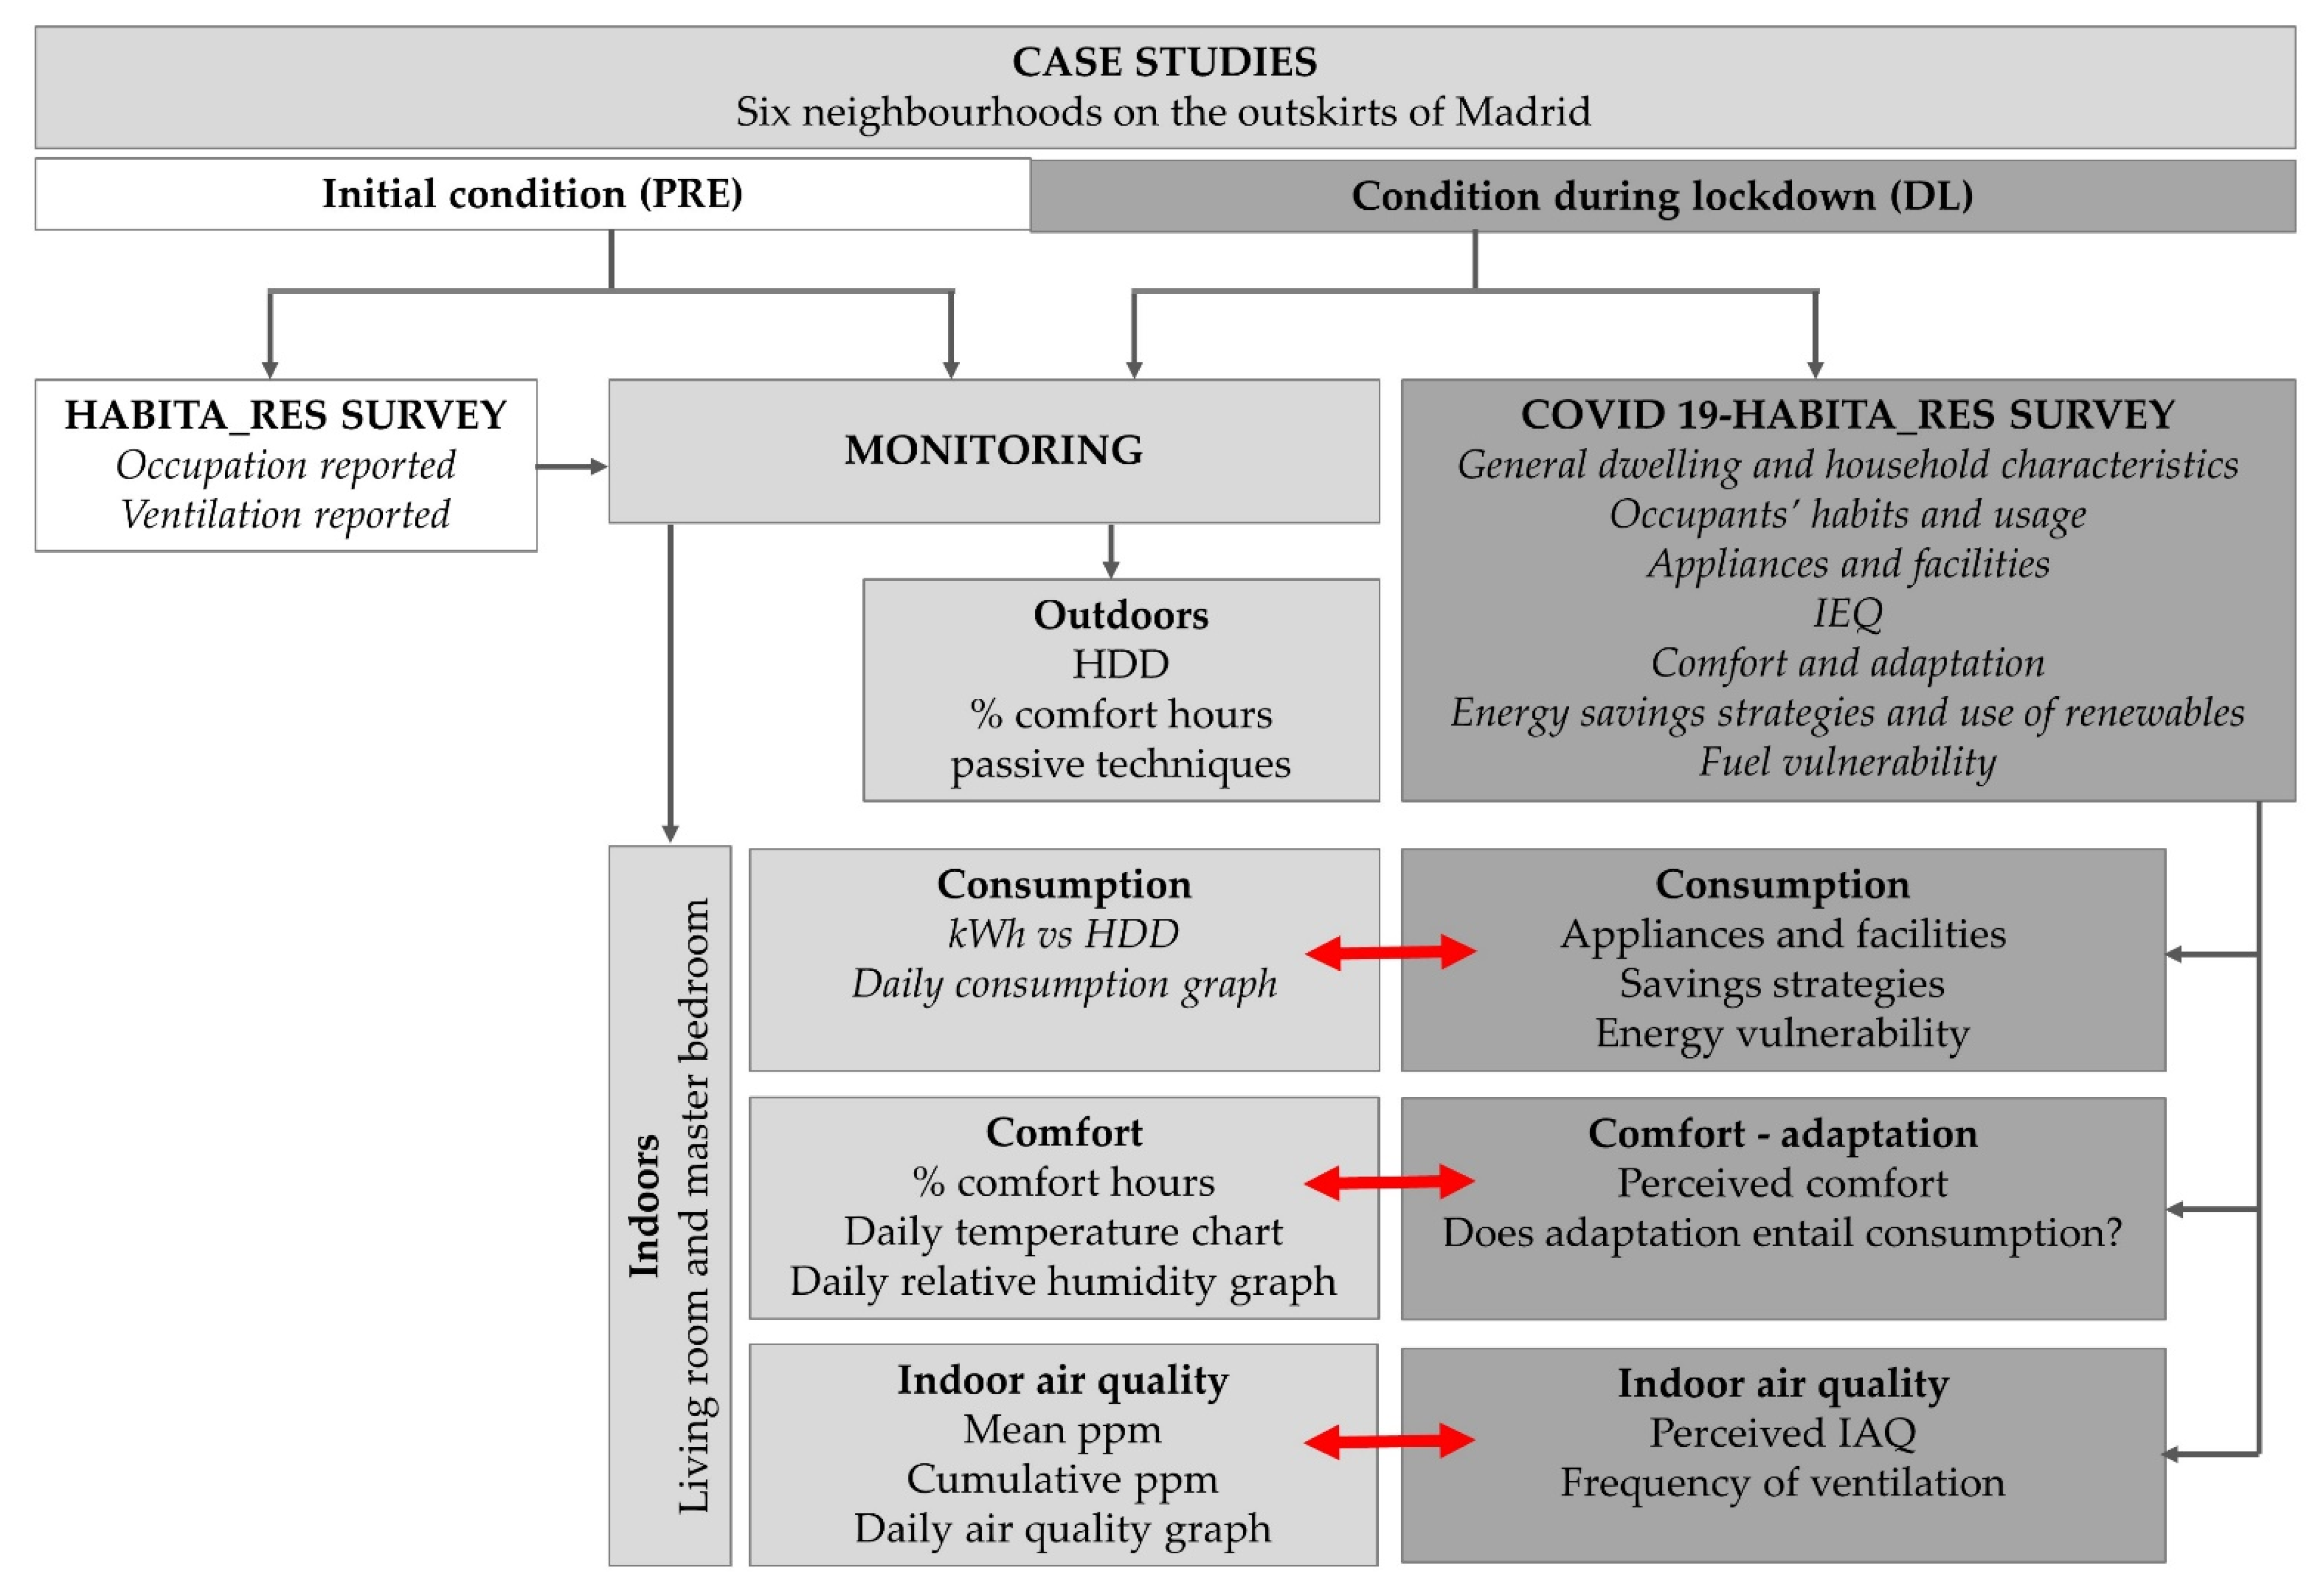
A state of emergency was officially called in Spain on 14 March 2020 in an attempt to contain the COVID-19 infection [5]. This study analysed the indoor environmental quality and power consumption data recorded between 7 March 2020 00:00 and 20 March 2020, i.e., 7 days before and 7 days during the state of emergency. The aim was to ascertain the effects of 24/7 dwelling use on comfort, indoor air quality and power consumption patterns under similar weather conditions.

3.2. Surveys

The study drew information from two surveys. The first, conducted from March 2018 to September 2019, primarily to design the monitoring model to be used in the dwellings [86], included questions on building and dwelling characteristics, energy and ventilation habits, HVAC systems and power consumption history. The second was conducted from 4 to 14 May 2020 to collect information on the perception of reality in dwellings during the COVID-19 lockdown. It contained questions on changes in habits and type of activities performed in the period; the relationship to spaces in the home, the use of electrically powered heating/DHW utilities and facilities and household energy behaviour in connection with indoor activities, flat use and occupation during the sole state of emergency called to date in Spain. Inasmuch as the timeframe for this analysis ran from 7 to 21 March 2020, the primary source of qualitative data was the second, COVID-HABITA_RES survey, although the earlier HABITA_RES survey findings were also used to validate and supplement those data.
Table 2 lists the variables on the COVID-HABITA_RES questionnaire. It is an original resource that came from the Spanish project [COVID-HAB], on confinement by COVID-19, housing and habitability [18]. Their researchers were involved in both inquiries. This questionnaire was partially adapted to aim the objectives of this study. The information collected in that survey was grouped under six categories to describe power consumption, environment and comfort in homes during lockdown.
The first item addressed the main compositional characteristics of the household, including the number of residents under 18 and over 65 and the occupation density defined as the ratio between the number of dwelling users and usable area. The occupation density (no. people/m2) and its variations were estimated for all the dwellings studied to determine where intensity of use was altered.
User habits were defined on the grounds of their responses to a question on the relative time devoted to a series of tasks scored on a five-point Likert scale [87], where 1 was least and 5 was the most time. In addition, in connection with habits, they were asked whether they were able to work from a home office and the number of persons engaging in remote working in the home; the establishment of routines similar to pre-lockdown practice or otherwise; outings and most frequent justification; and alteration or otherwise of habits during lockdown.
The category on dwelling facilities entailing power consumption covered the main household appliances and a comparison of their use before and during lockdown, including: computer hardware; domestic hot water systems and comparative frequency of use; and heating systems, type of power used and frequency of use during lockdown.
The three indoor environmental quality variables were natural lighting, indoor air quality and acoustic insulation. Although that was the information collected with the survey, as the comparative study focused on indoor air quality, the frequency of window opening and use of shading devices was also compared. An item was likewise included on whether or not the dwelling had spaces open to outdoors.
Under the category on comfort and adaptation respondents were asked about their perception of thermal comfort, apparel-based adaptation, preferred type of heating in the absence of thermal comfort and household thermal preferences as defined in standards ASHRAE 55 [25] and ISO 7730 [26].
The energy saving strategies and renewable use category was built around variables on the strategies deployed by households to save energy during lockdown and the availability in the dwelling of renewable energy-powered systems.
The category on energy vulnerability, in turn, alluded to all variables describing household risk of fuel poverty or of the aggravation of that situation. The category variables were perceived vulnerability, the need for emergency financial aid to relieve the situation, the percentage of income normally devoted to power expenses compared to expenses during lockdown and, where no power bills referring to the lockdown period had yet been received when the survey was completed, any expected change in expenditure.

3.3. Monitoring

The sensors installed in each dwelling [86] recorded data on electricity (kWh), where appropriate and possible, natural gas (m3) consumption at 10 min intervals and on temperature (°C), relative humidity (%) and CO2 (ppm) concentration in the living room and master bedroom. All the buildings involved were fitted with a weather station to record local weather conditions.
Simple data gathering models were designed with internet of things (IoT) technology to lower costs and minimise inconvenience for the dwellings monitored, although user availability proved to be essential. Table 3 lists the technical specifications of the sensors used. The data on the dwellings were stored on the monitoring platform [88] designed for the HABITA_RES project and the weather station data on the opensource data platform Weather Underground (Available online: www.wunderground.com, accessed on 20 March 2020). As the stations on the buildings in Carabanchel and Orcasitas recorded barely any data in the period studied, information was downloaded from a nearby station.
The data recorded were processed and managed in the Jupyter Notebook for the Anaconda Python language [89]. The Python modules used were: Pandas v1.2.4 (Available online: http://pandas.pydata.org, accessed on 12 April 2021) for data analysis; Geopandas v0.6.3 (Available online http://geopandas.org, accessed on 24 September 2019) for geometric and spatial data analysis; and Bokeh v2.3.2 (Available online: https://bokeh.org, accessed on 12 April 2021) for visualisation.
The data records for each dwelling are summarised in the worksheets reproduced in the Appendix A and described briefly below.
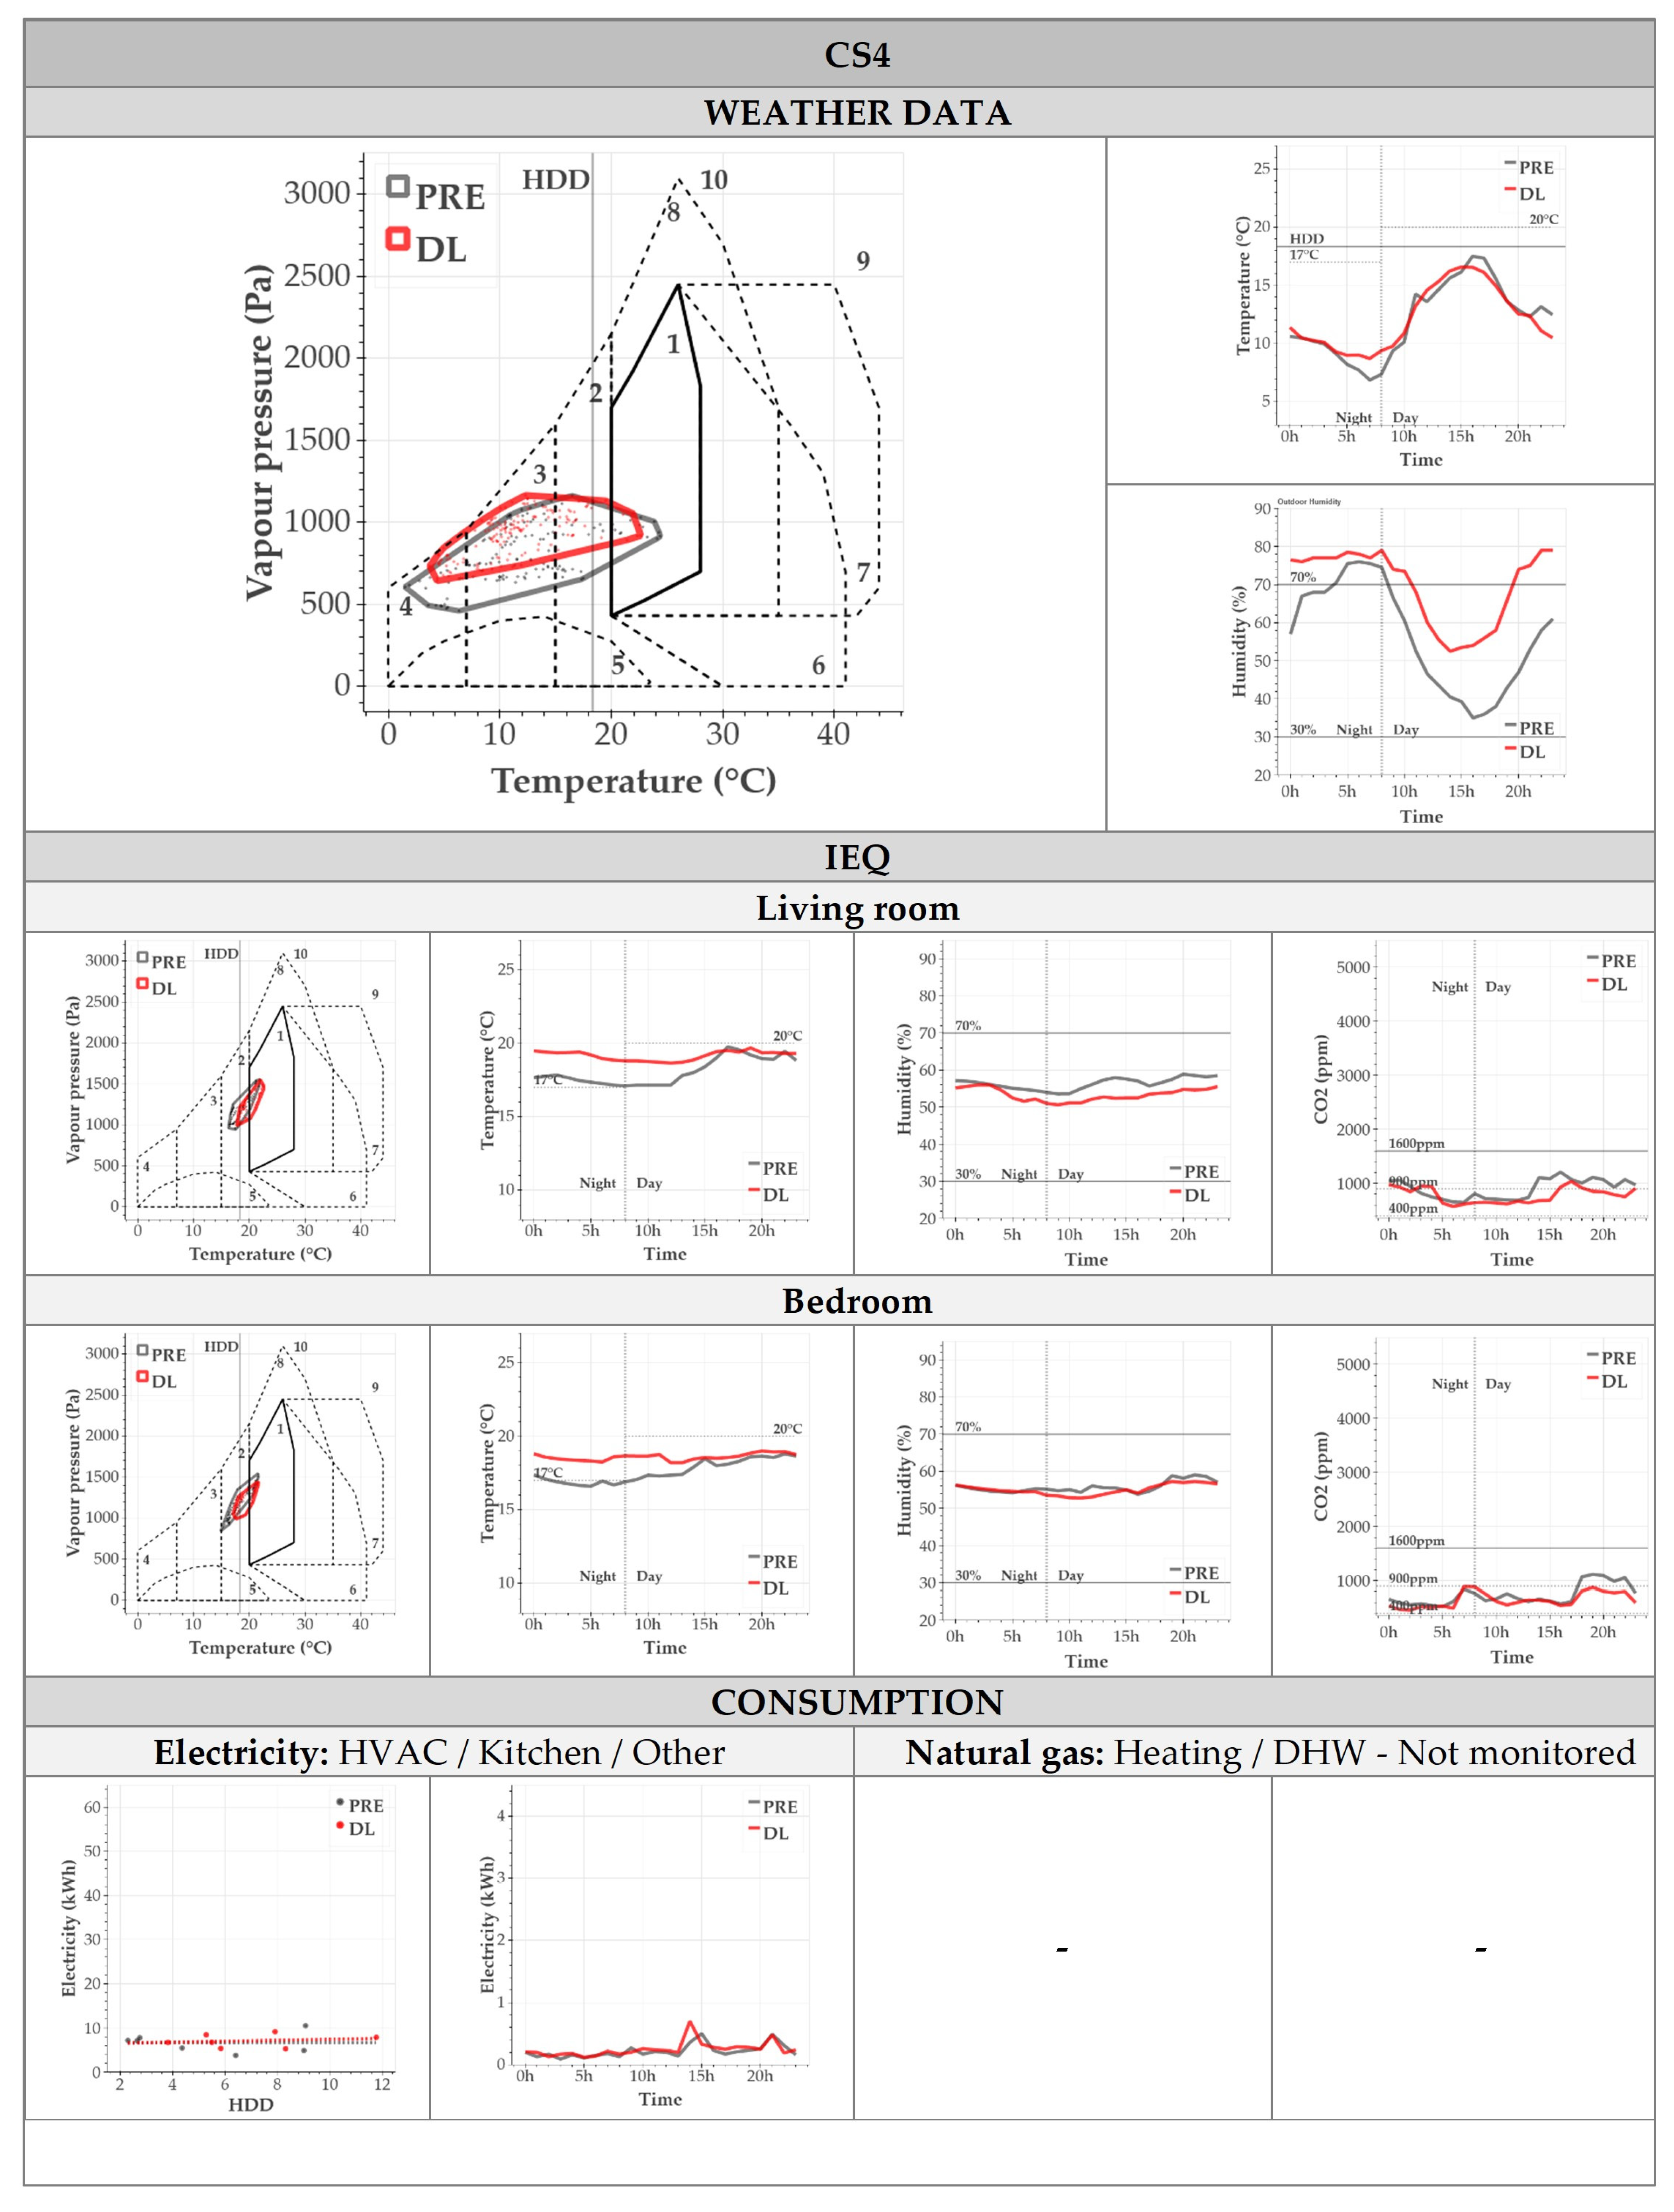
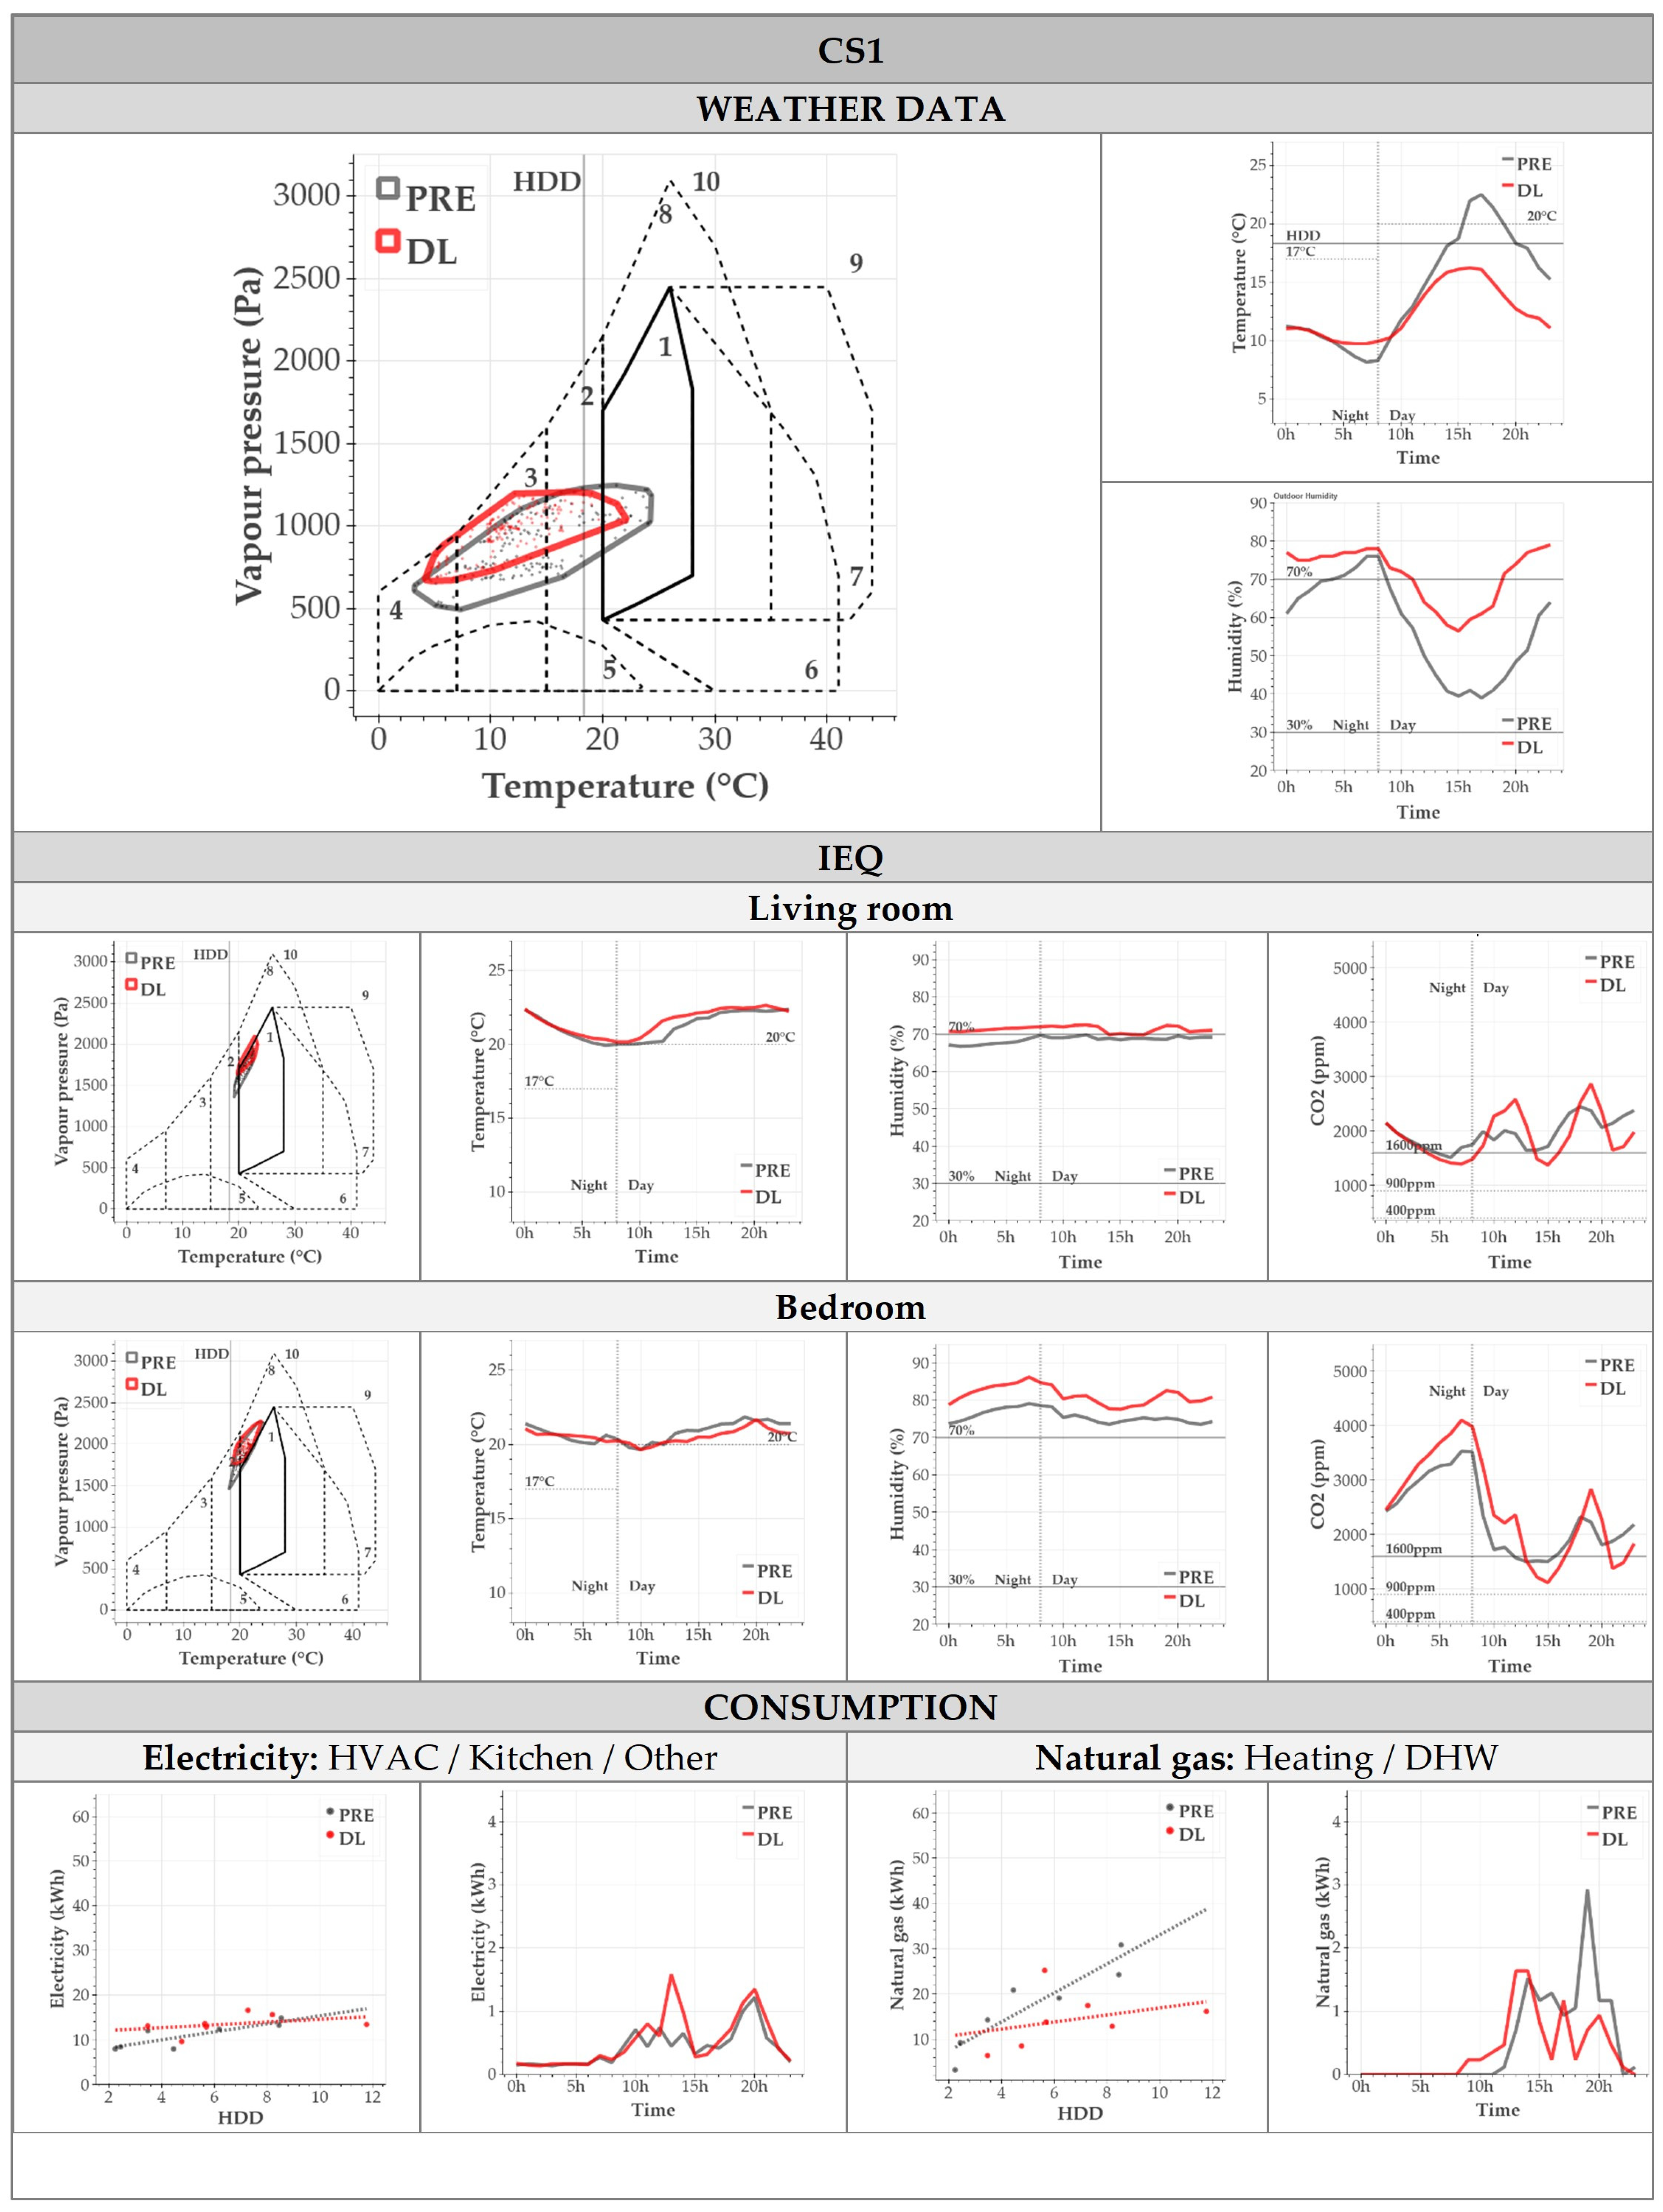
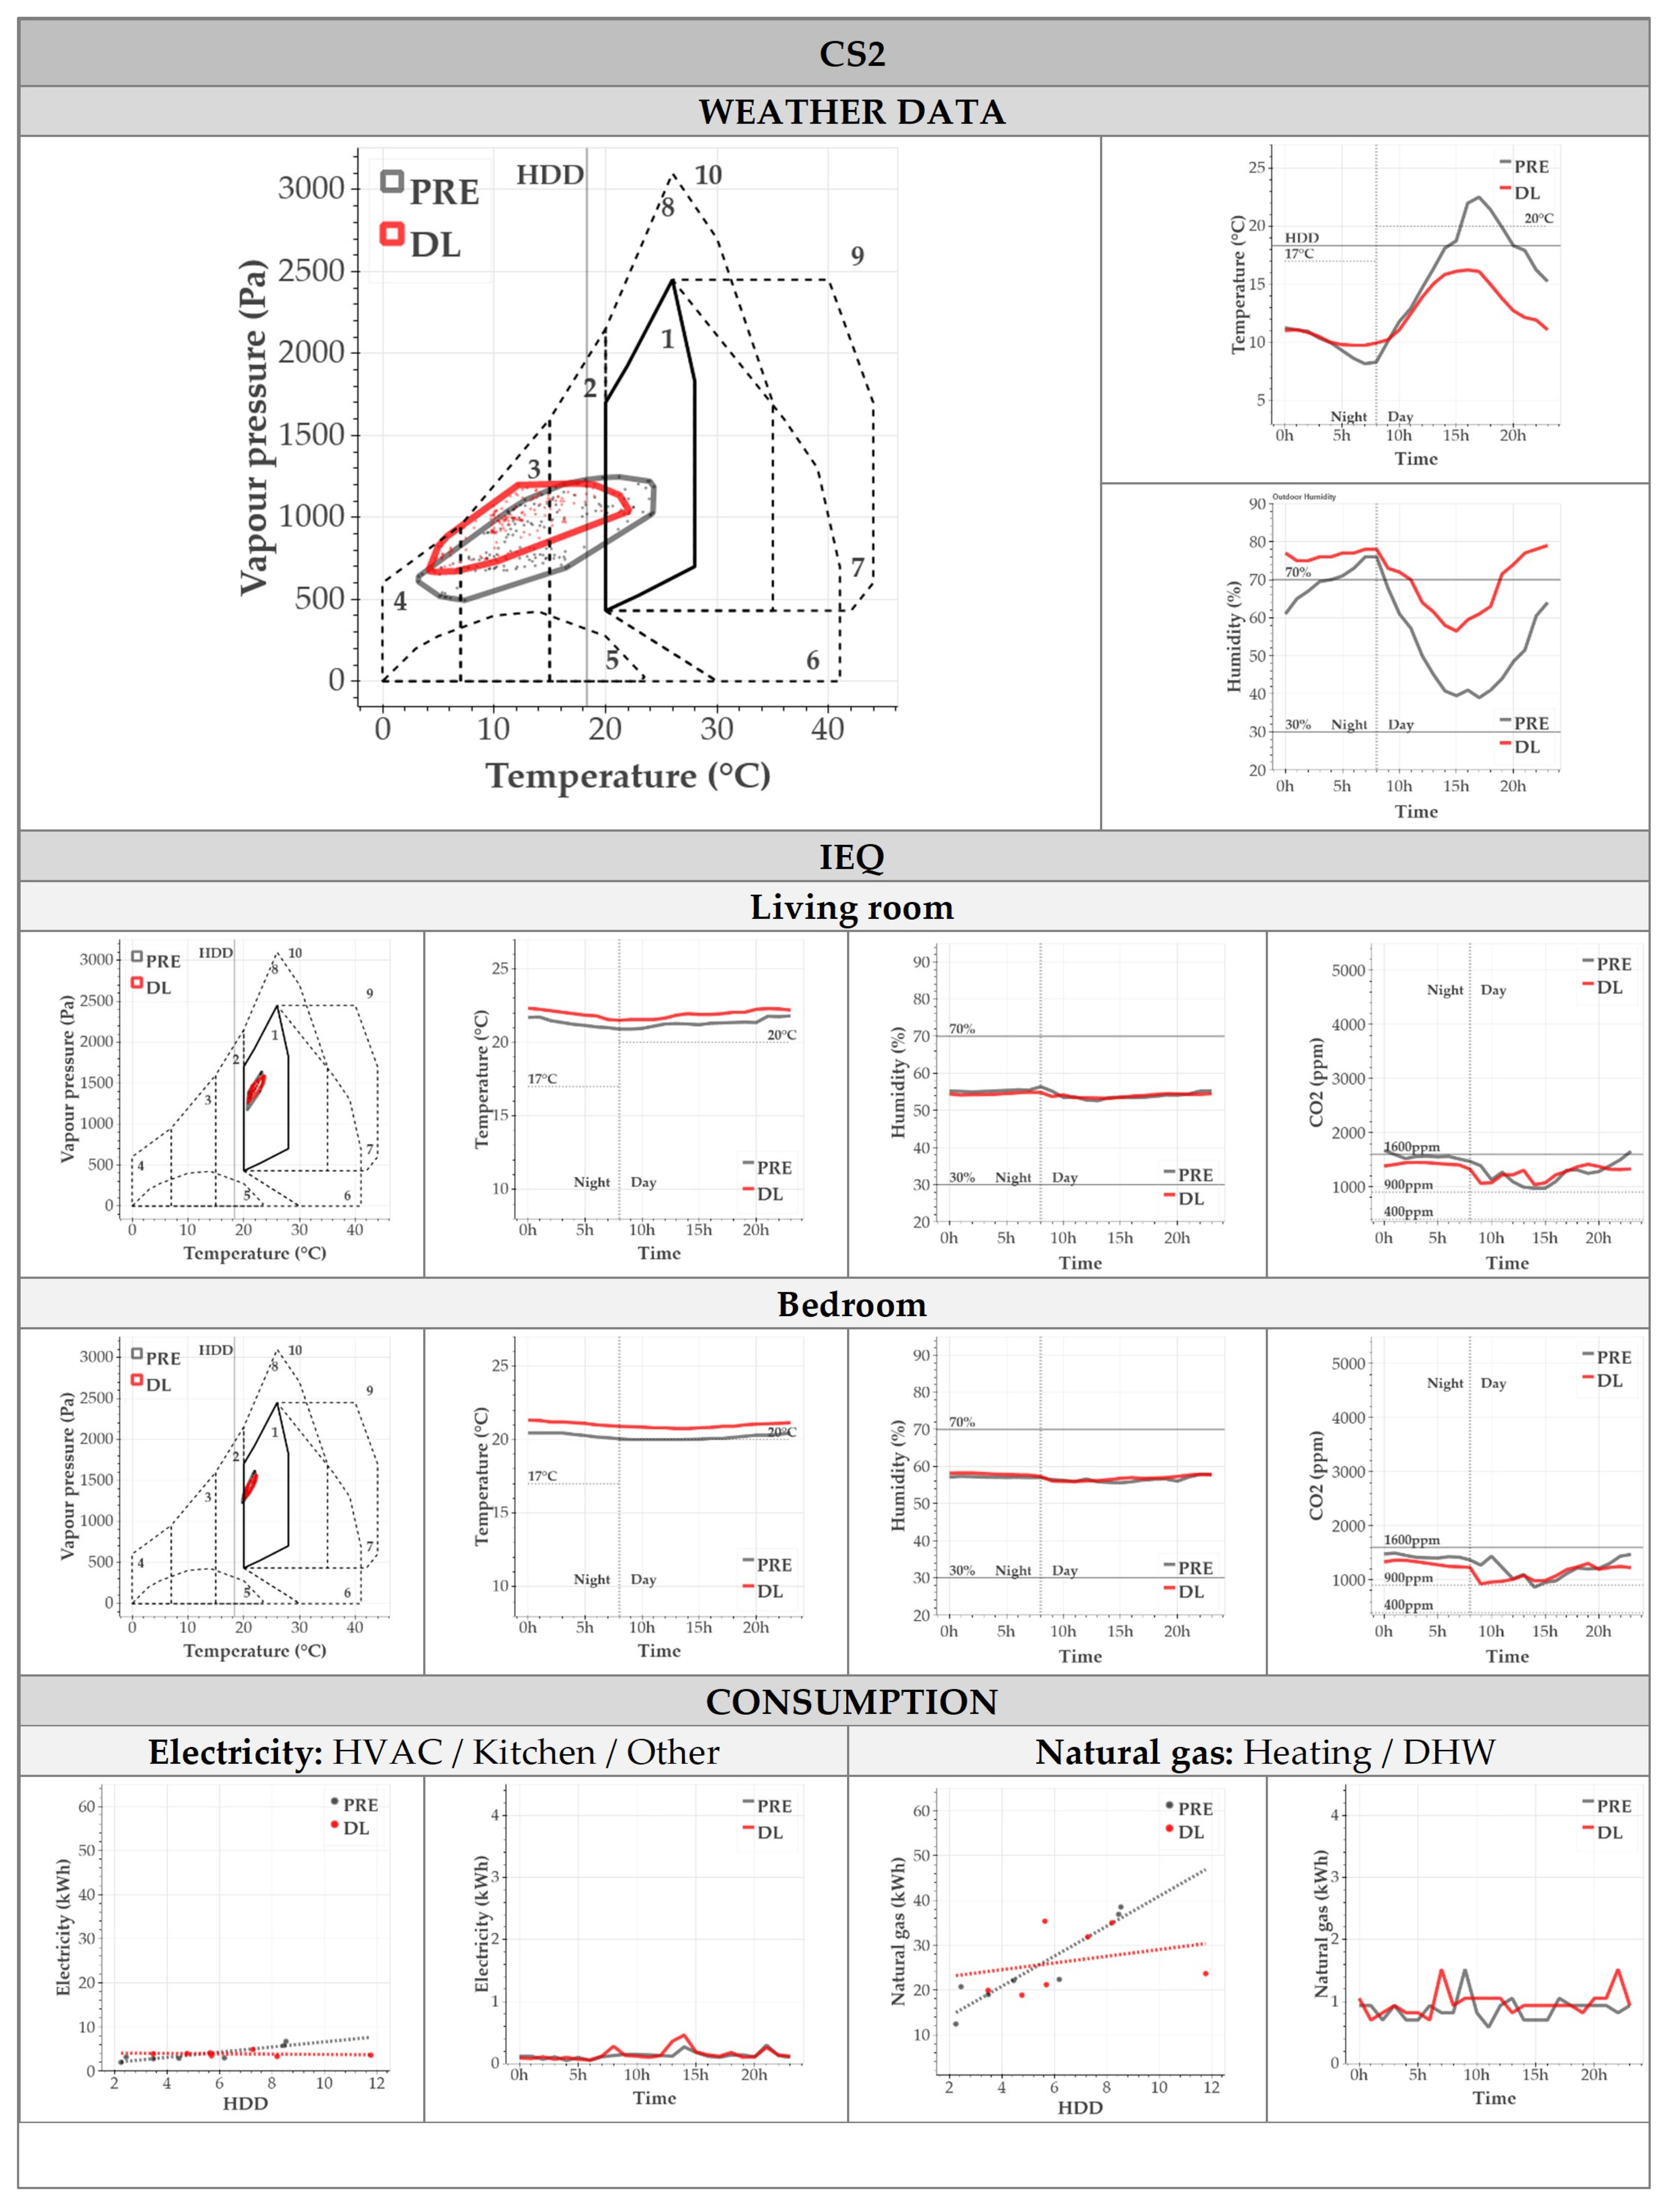
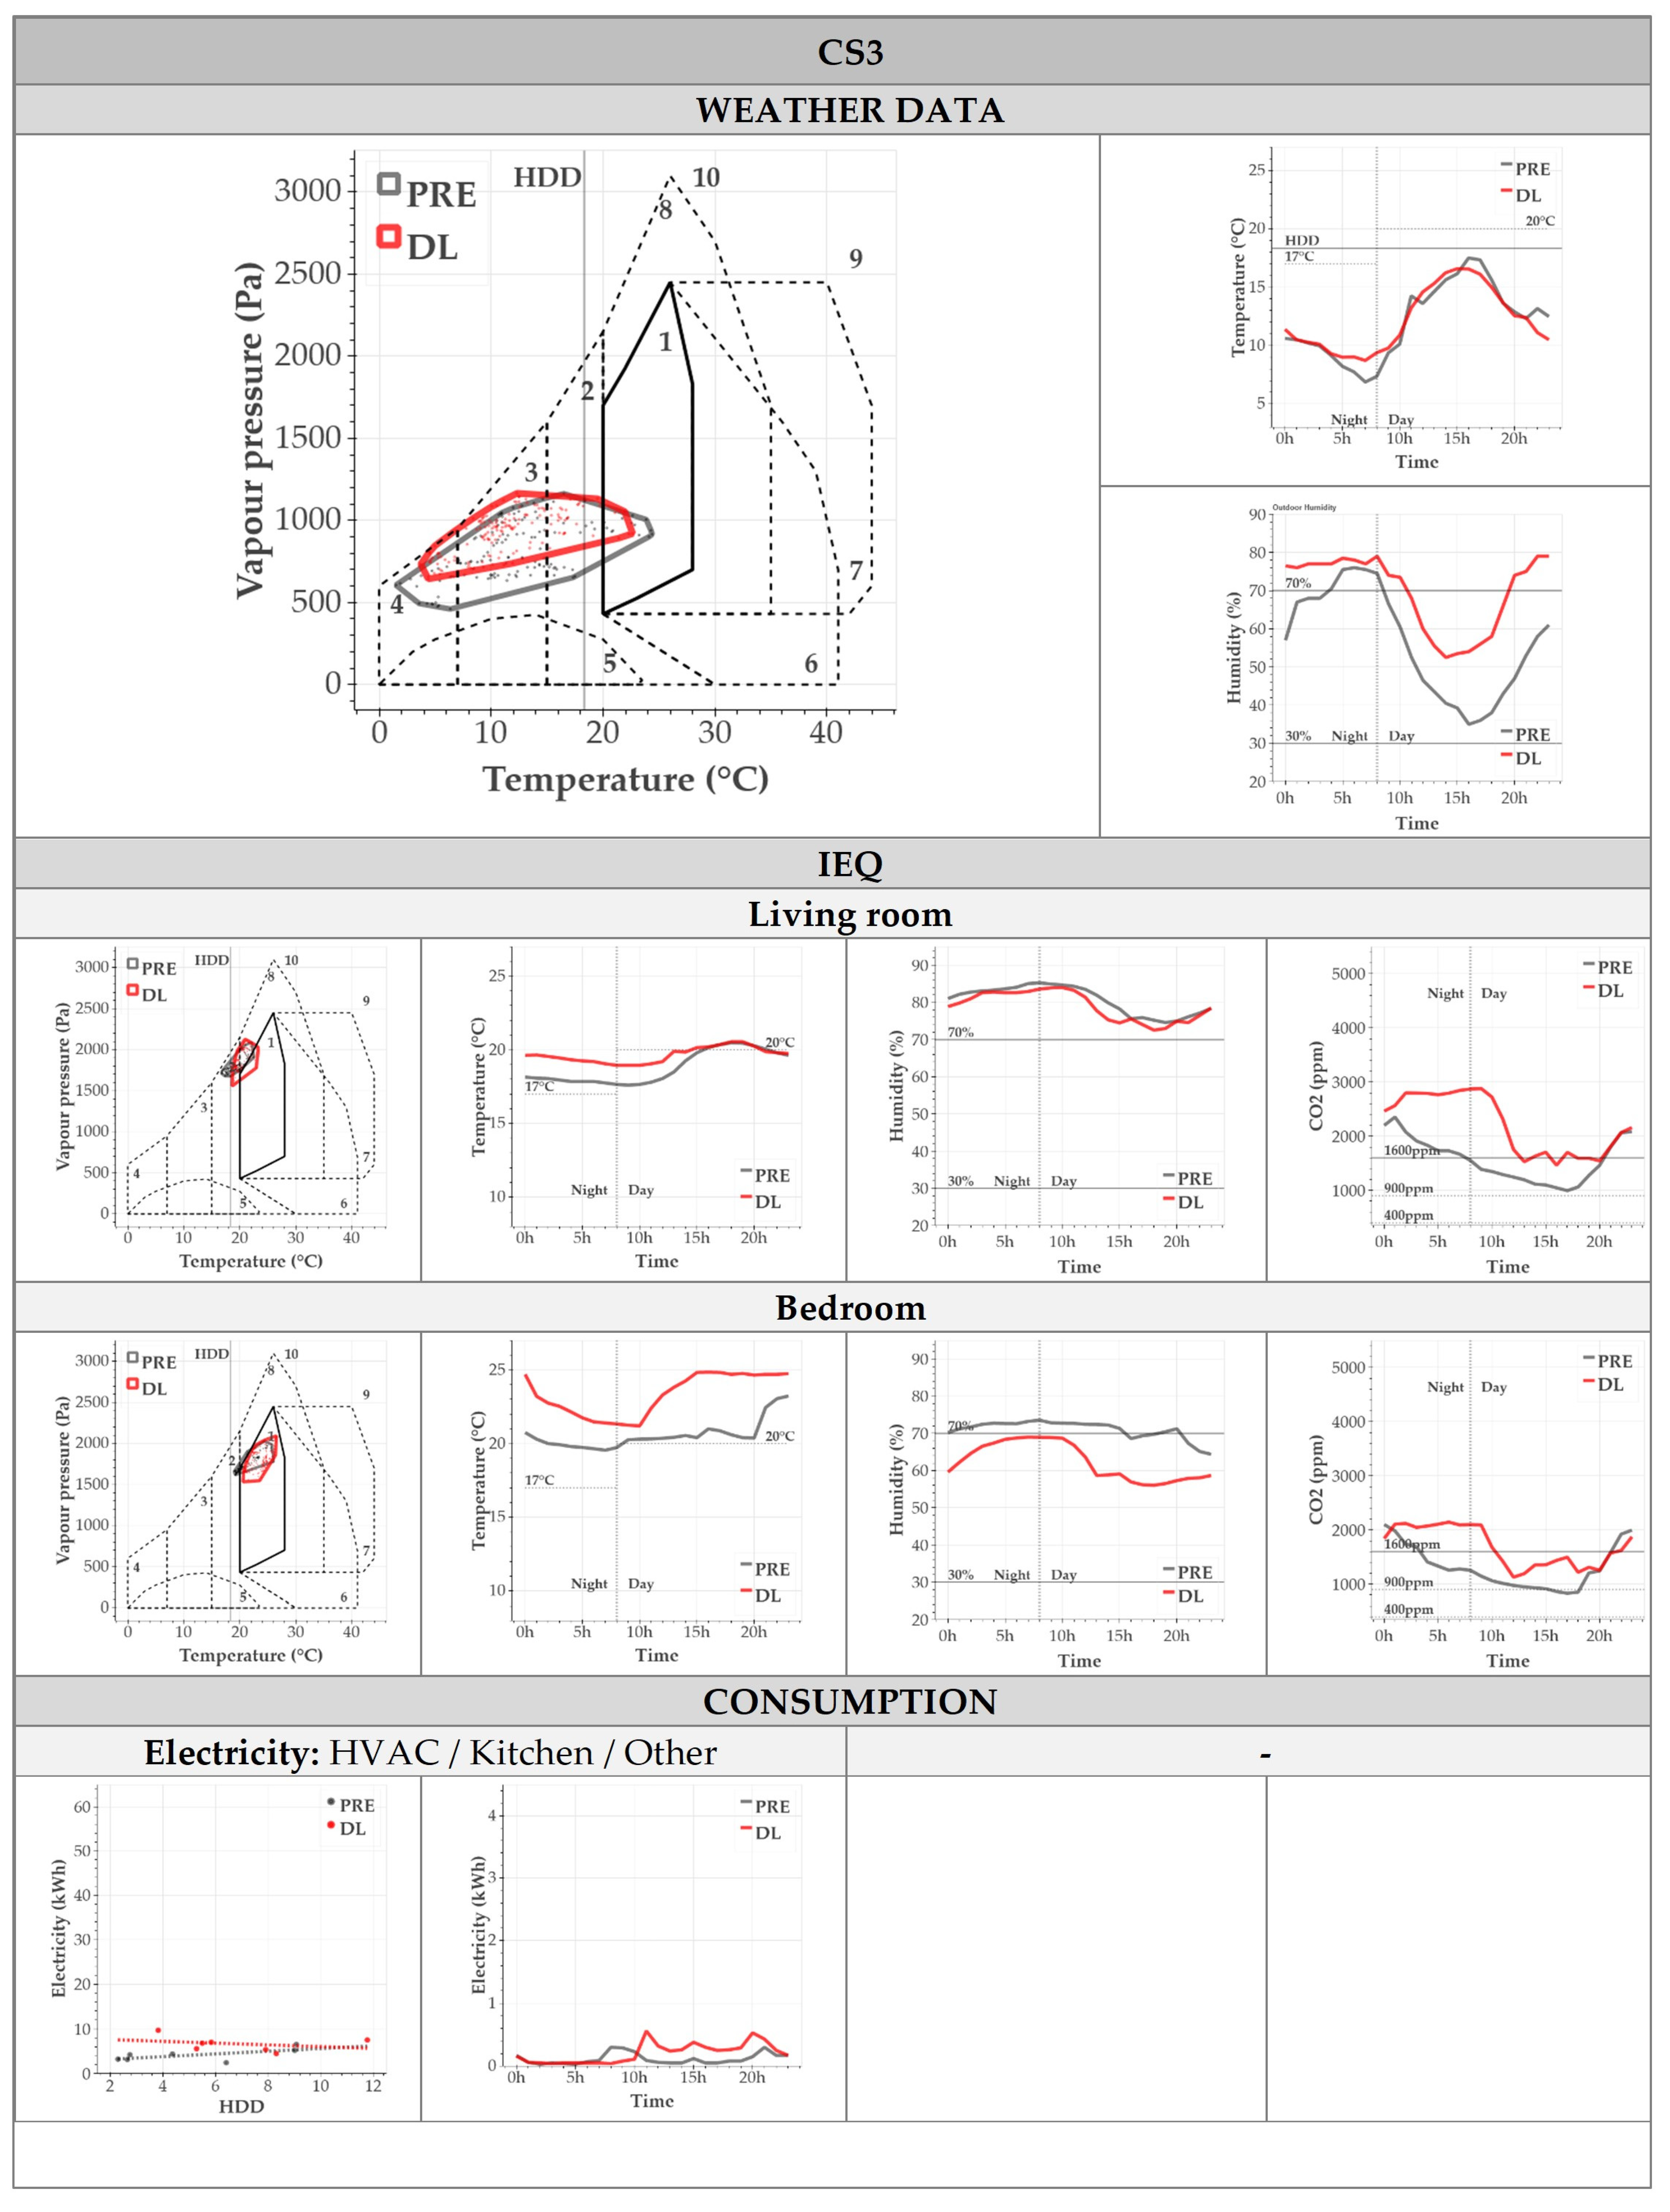
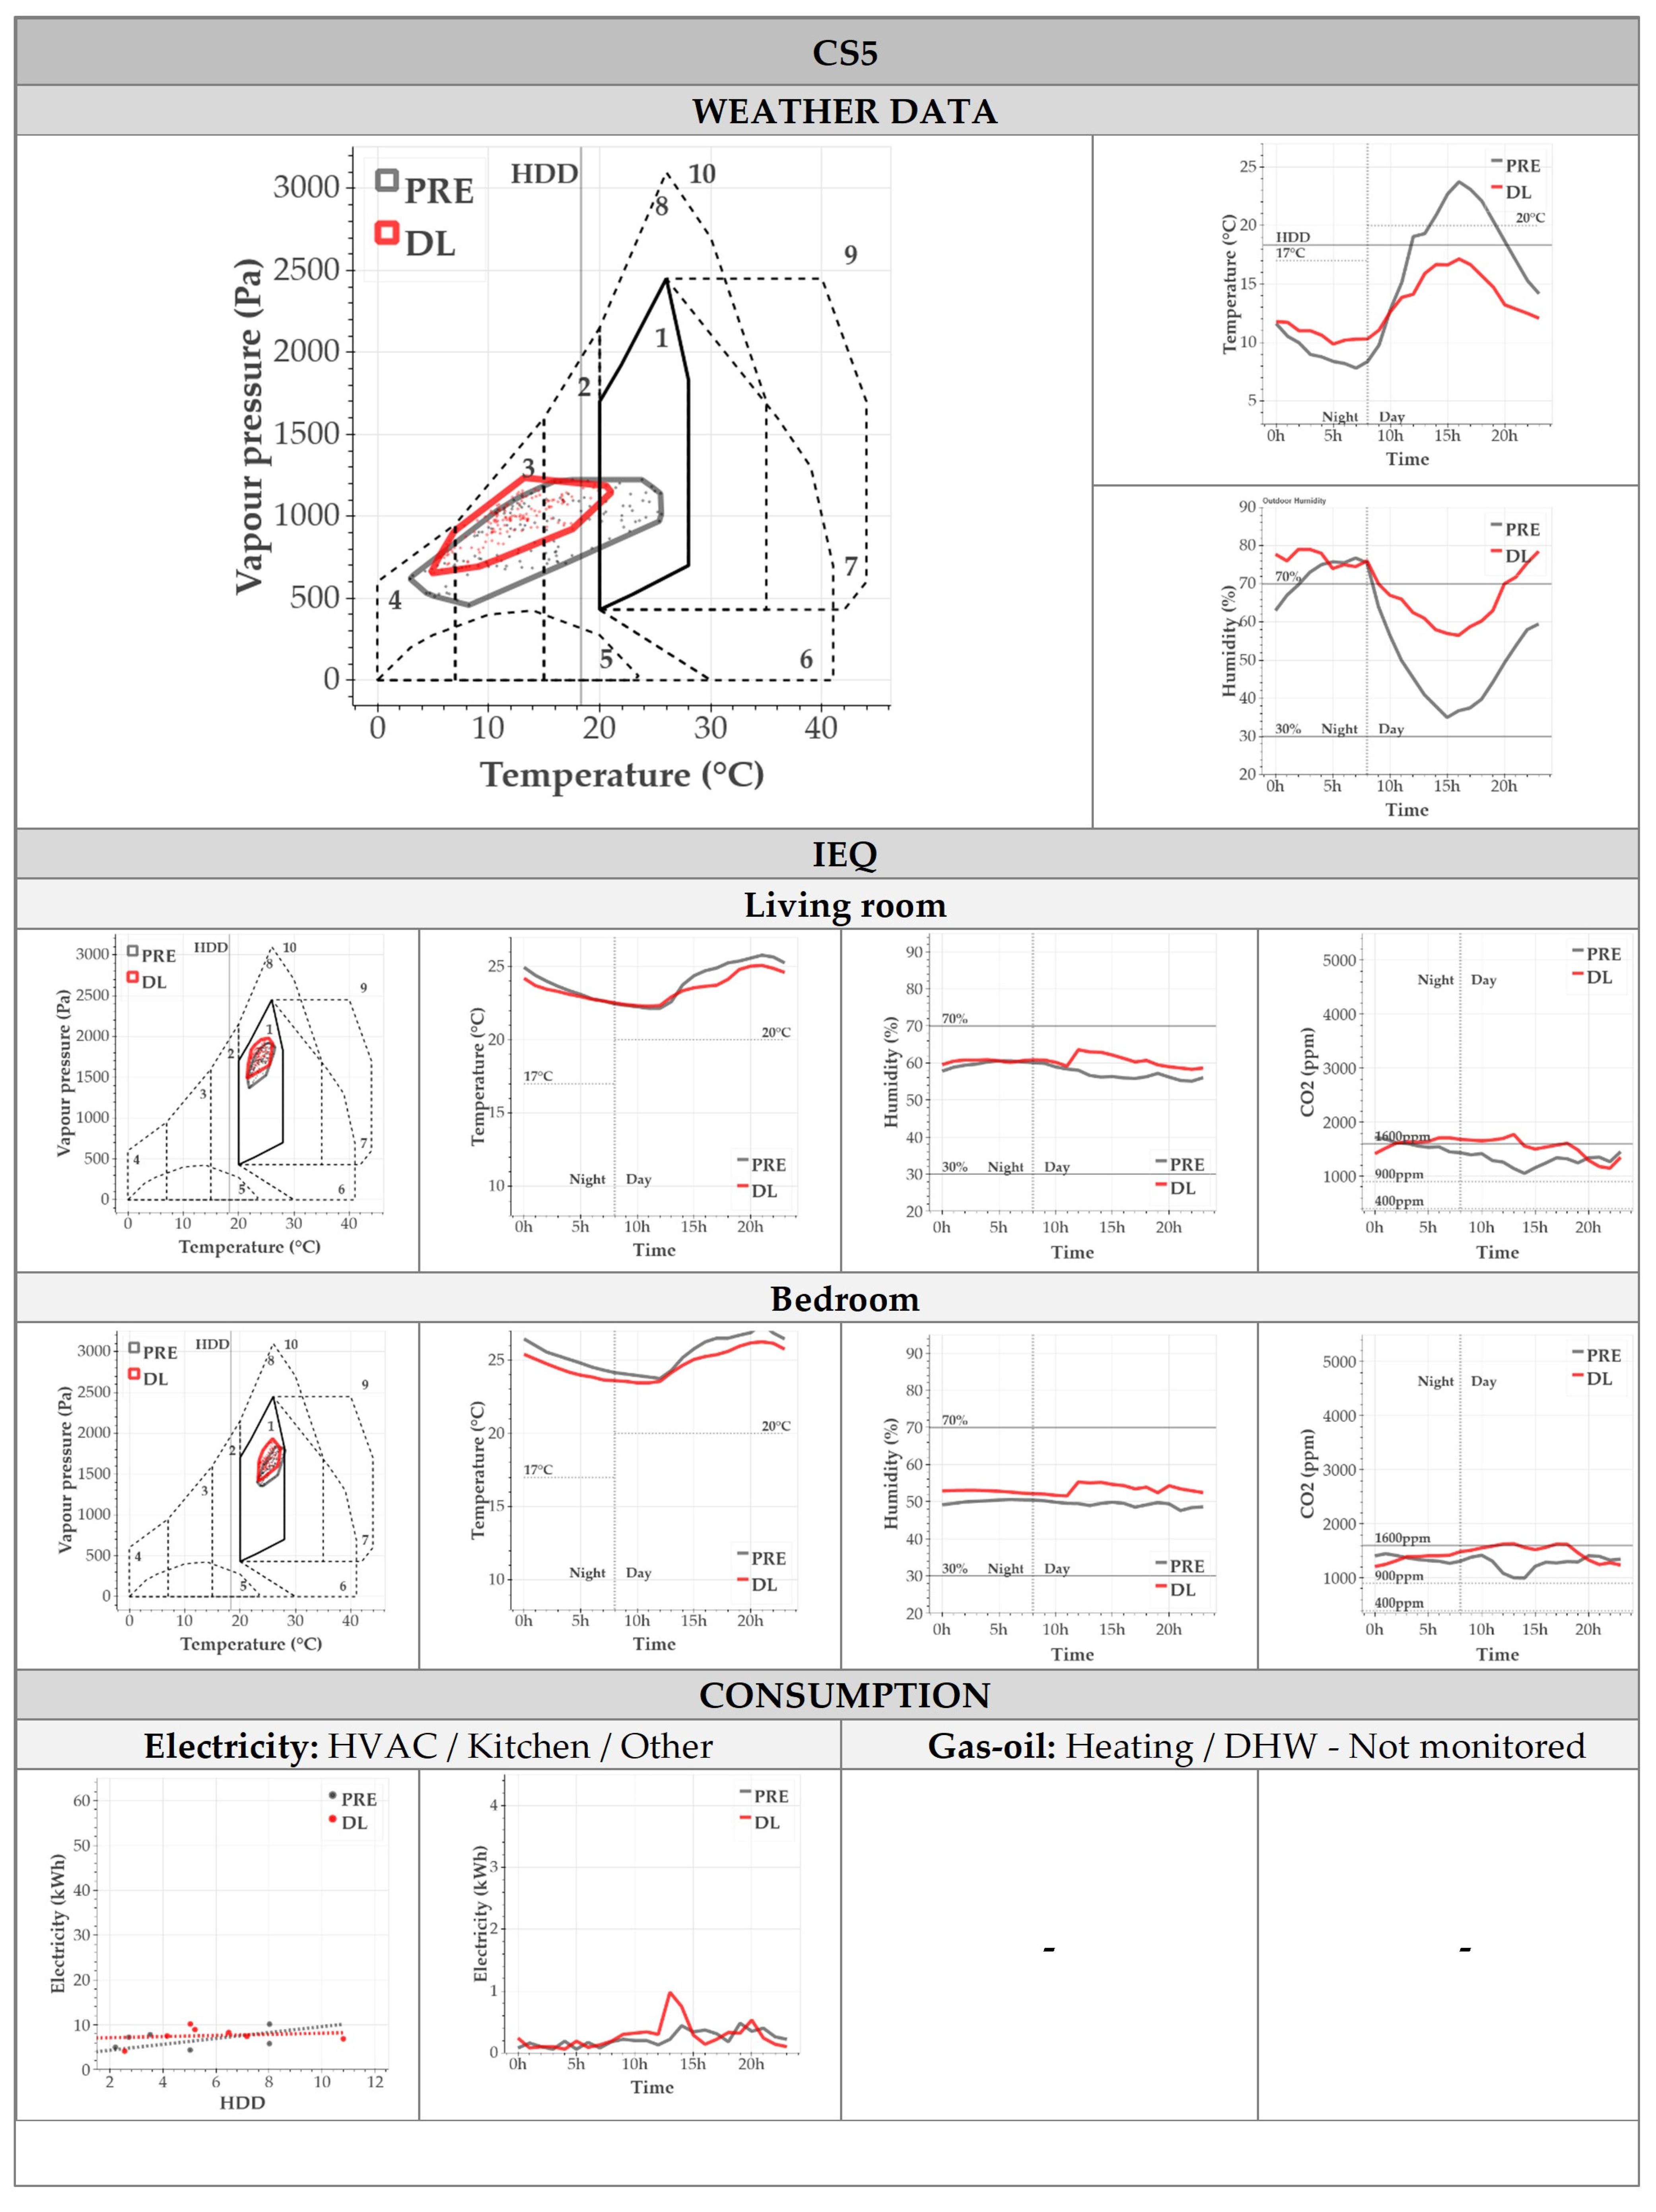
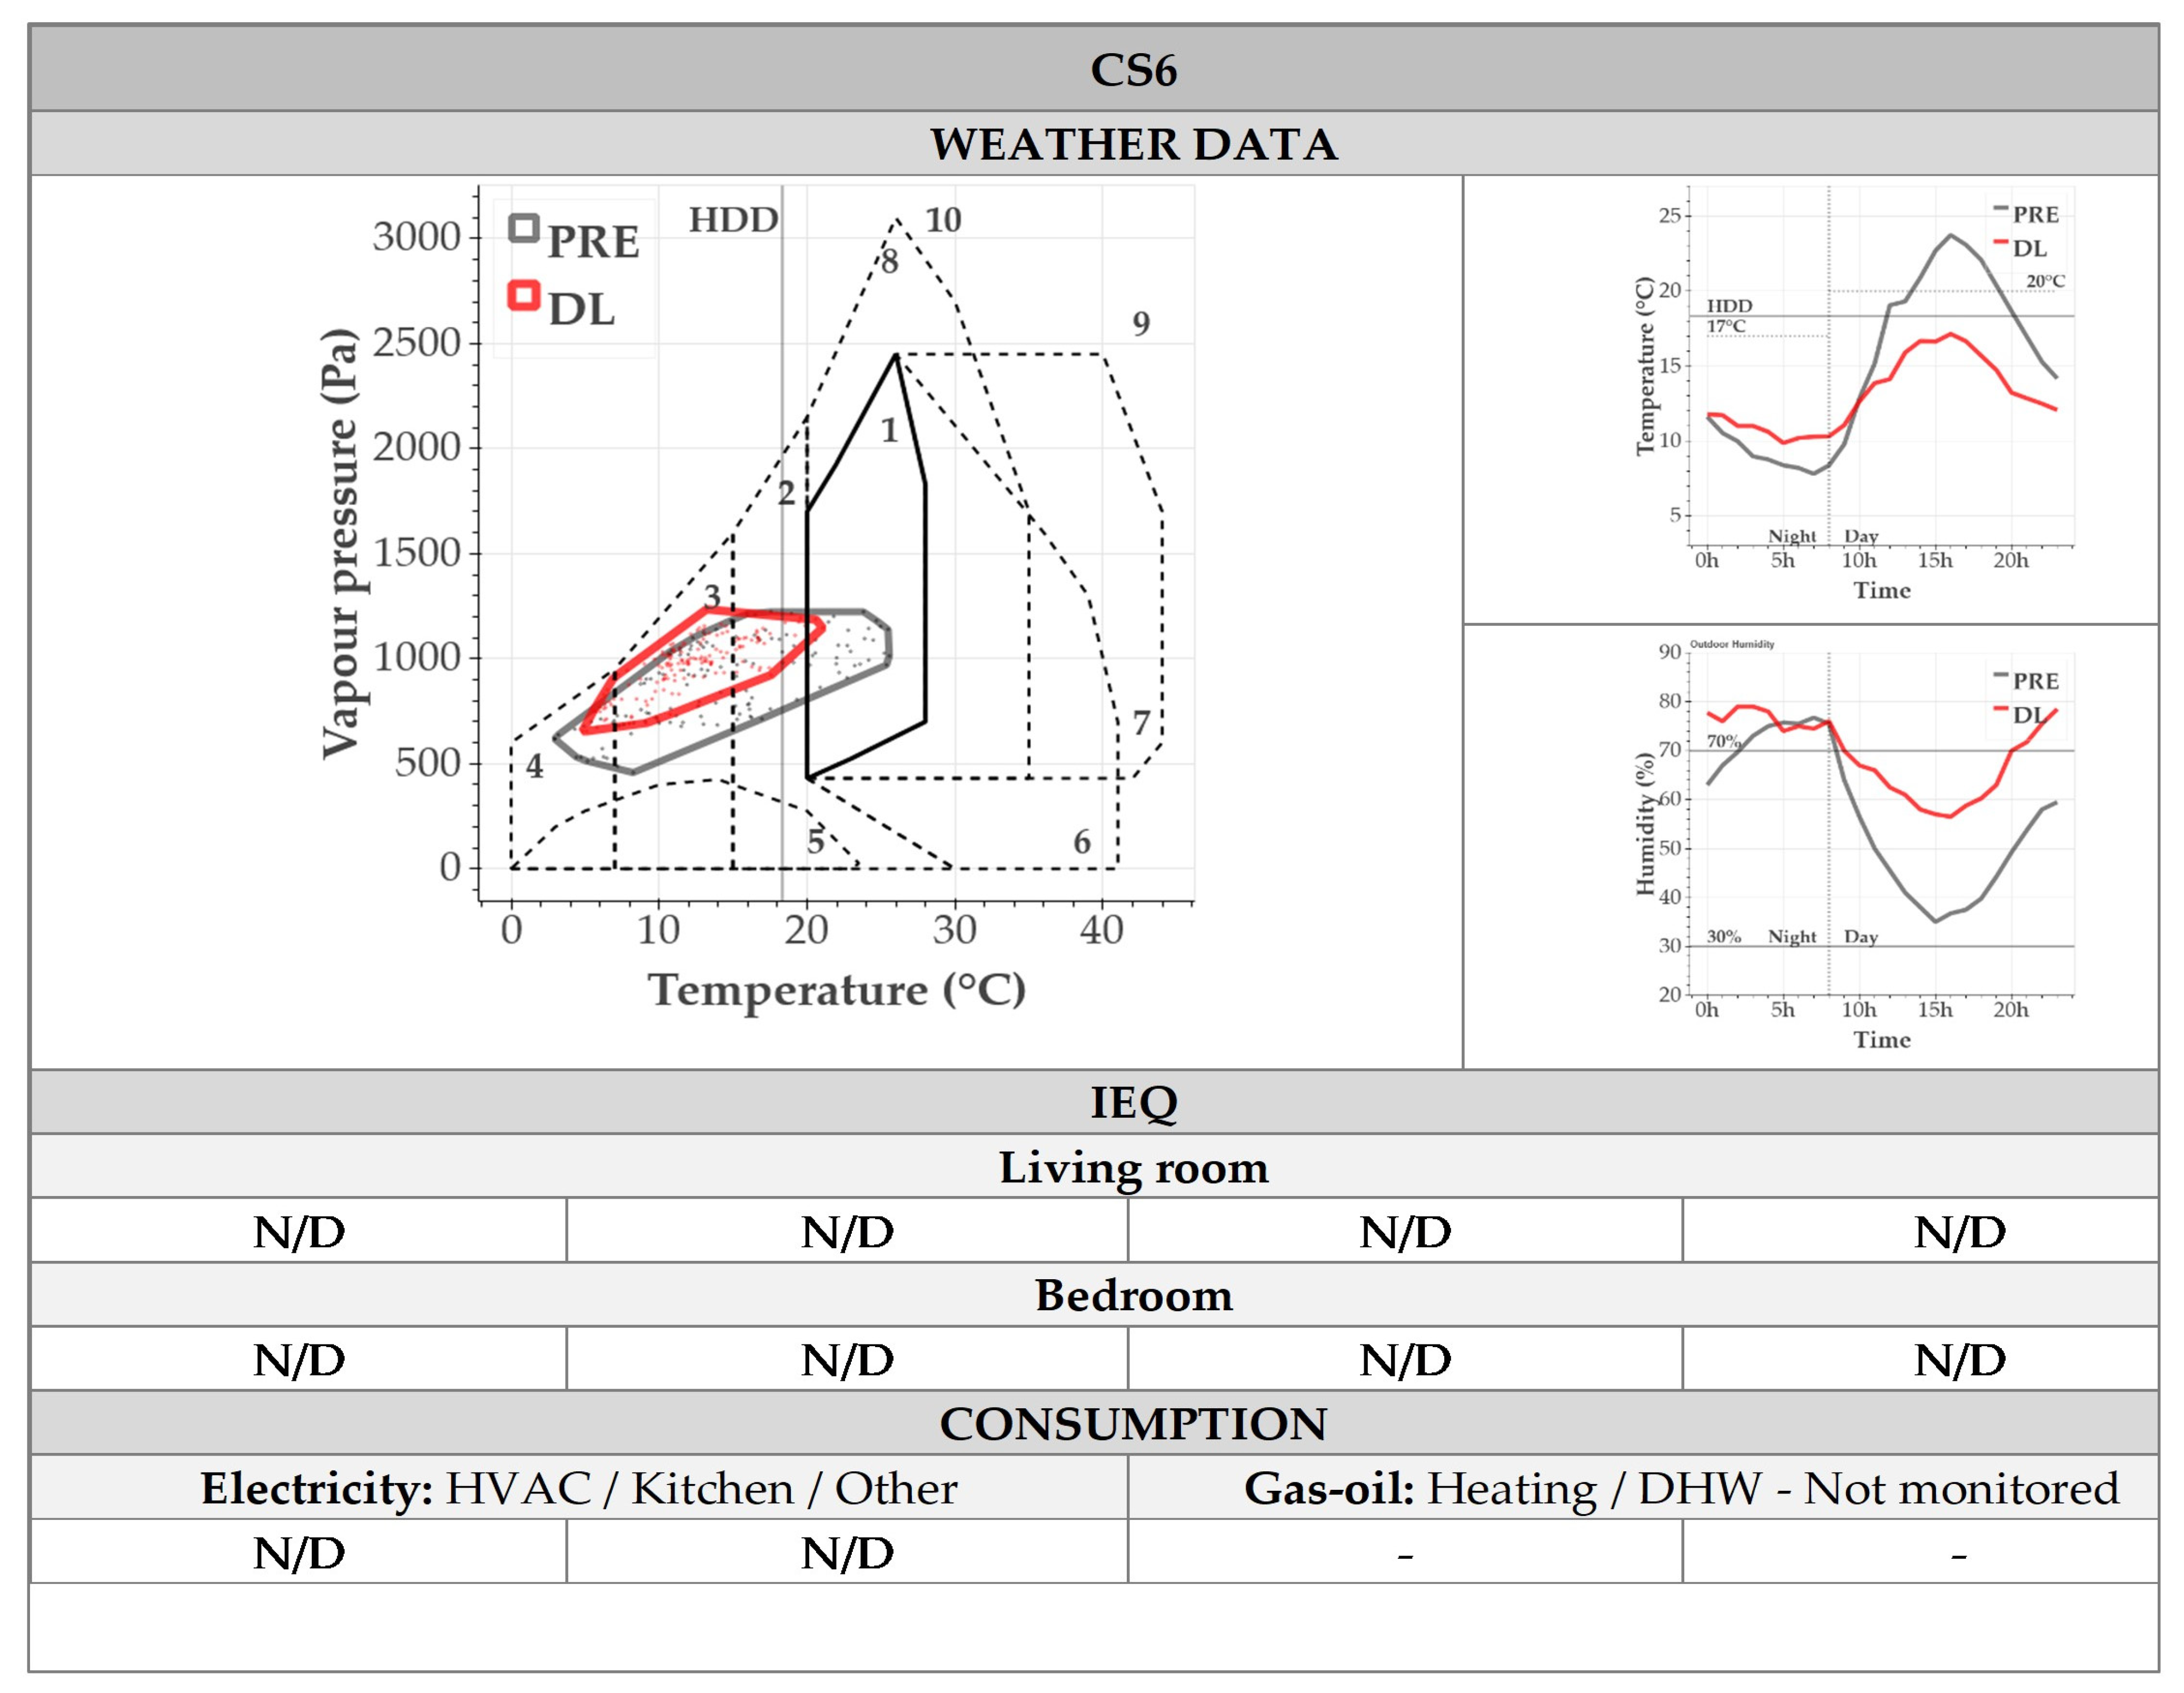
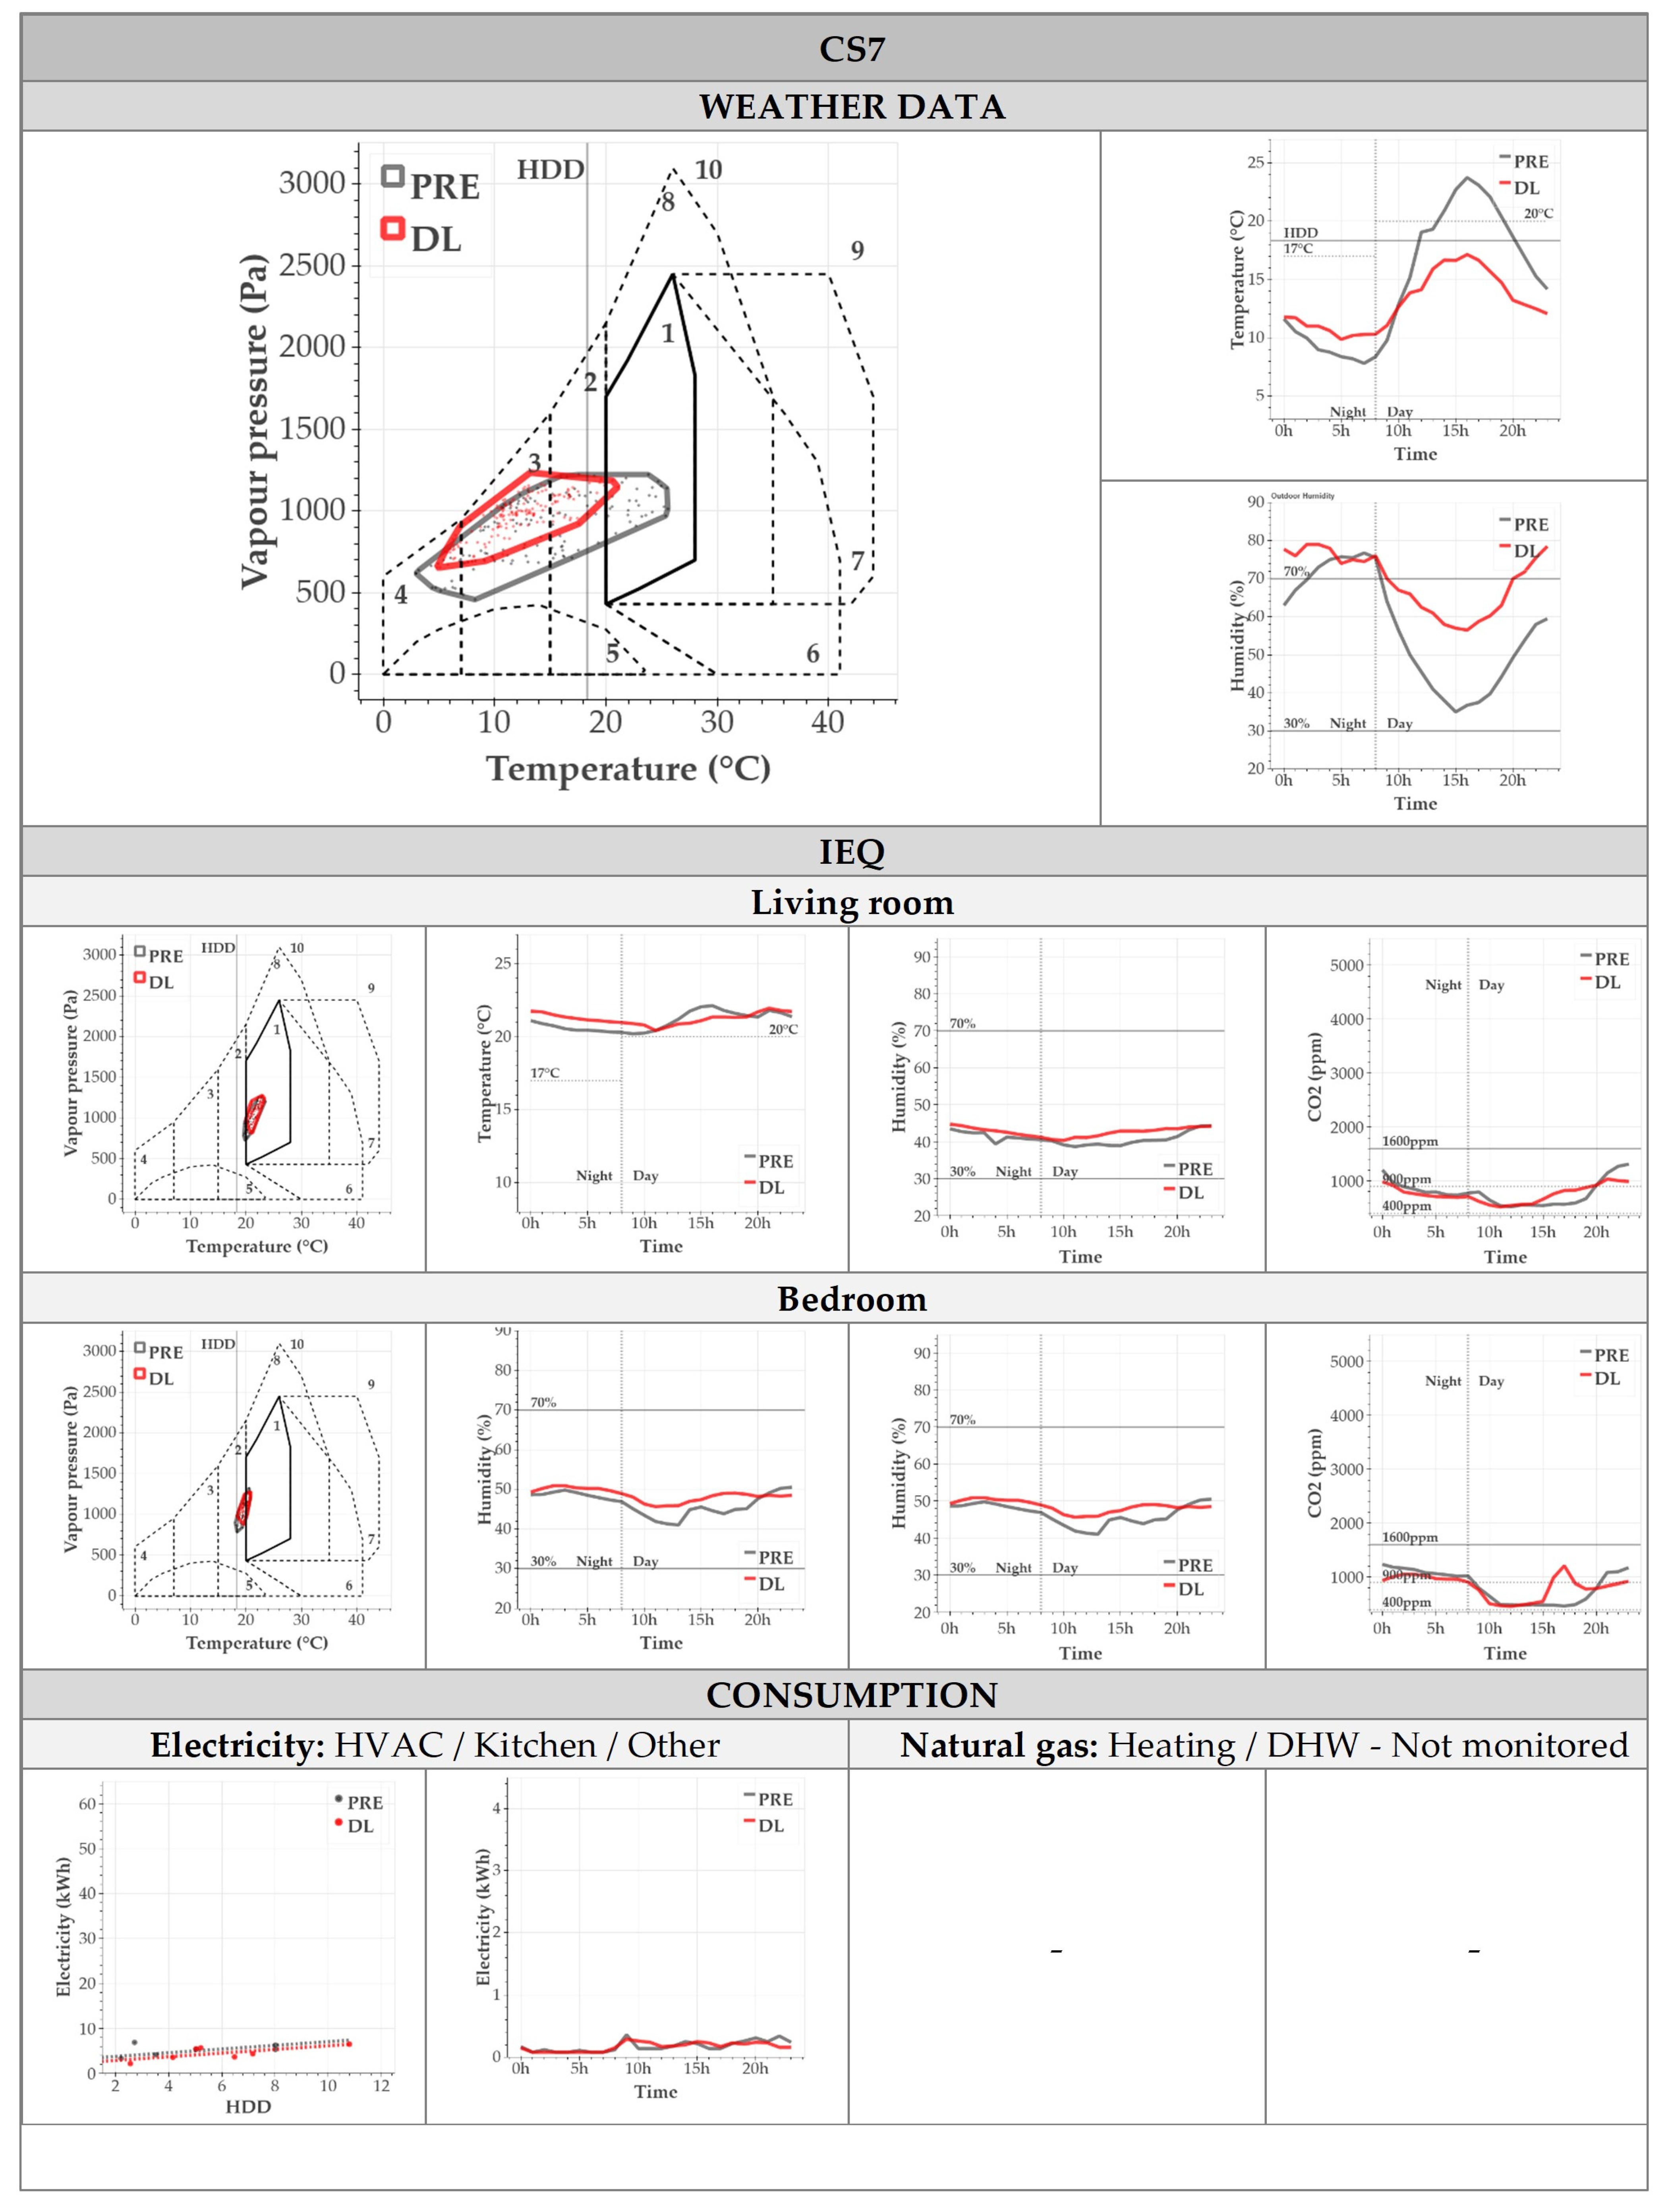
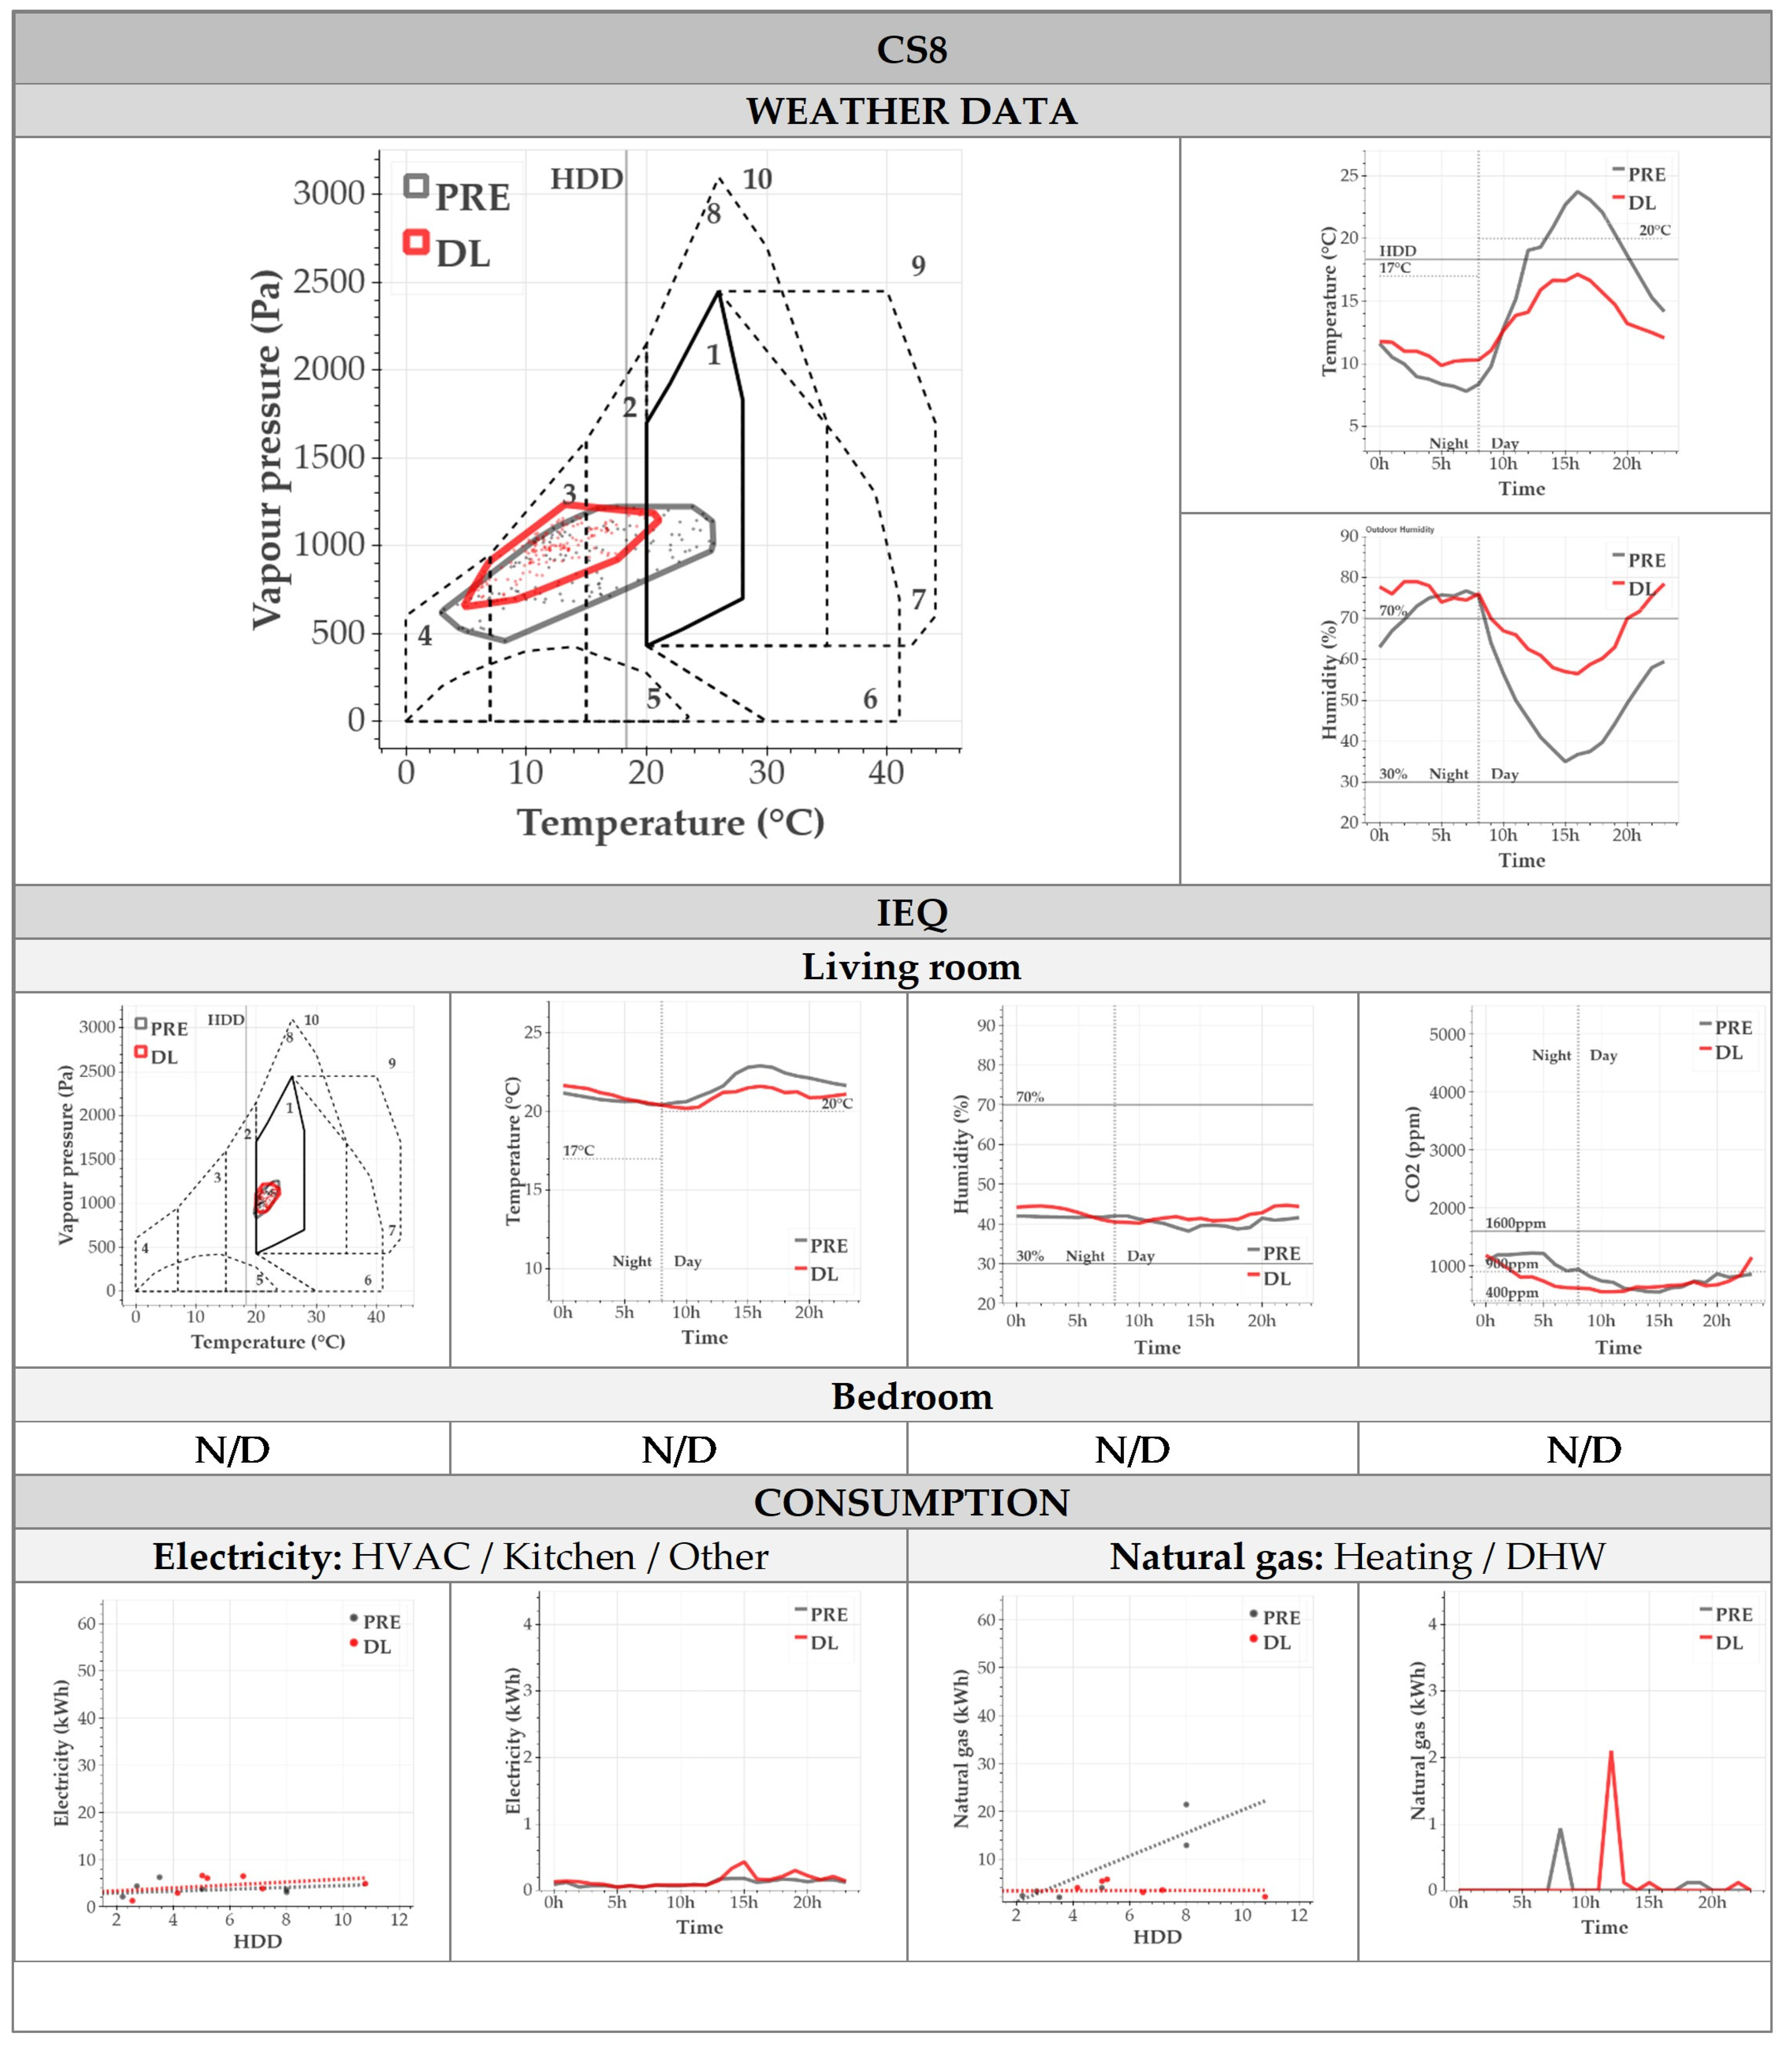
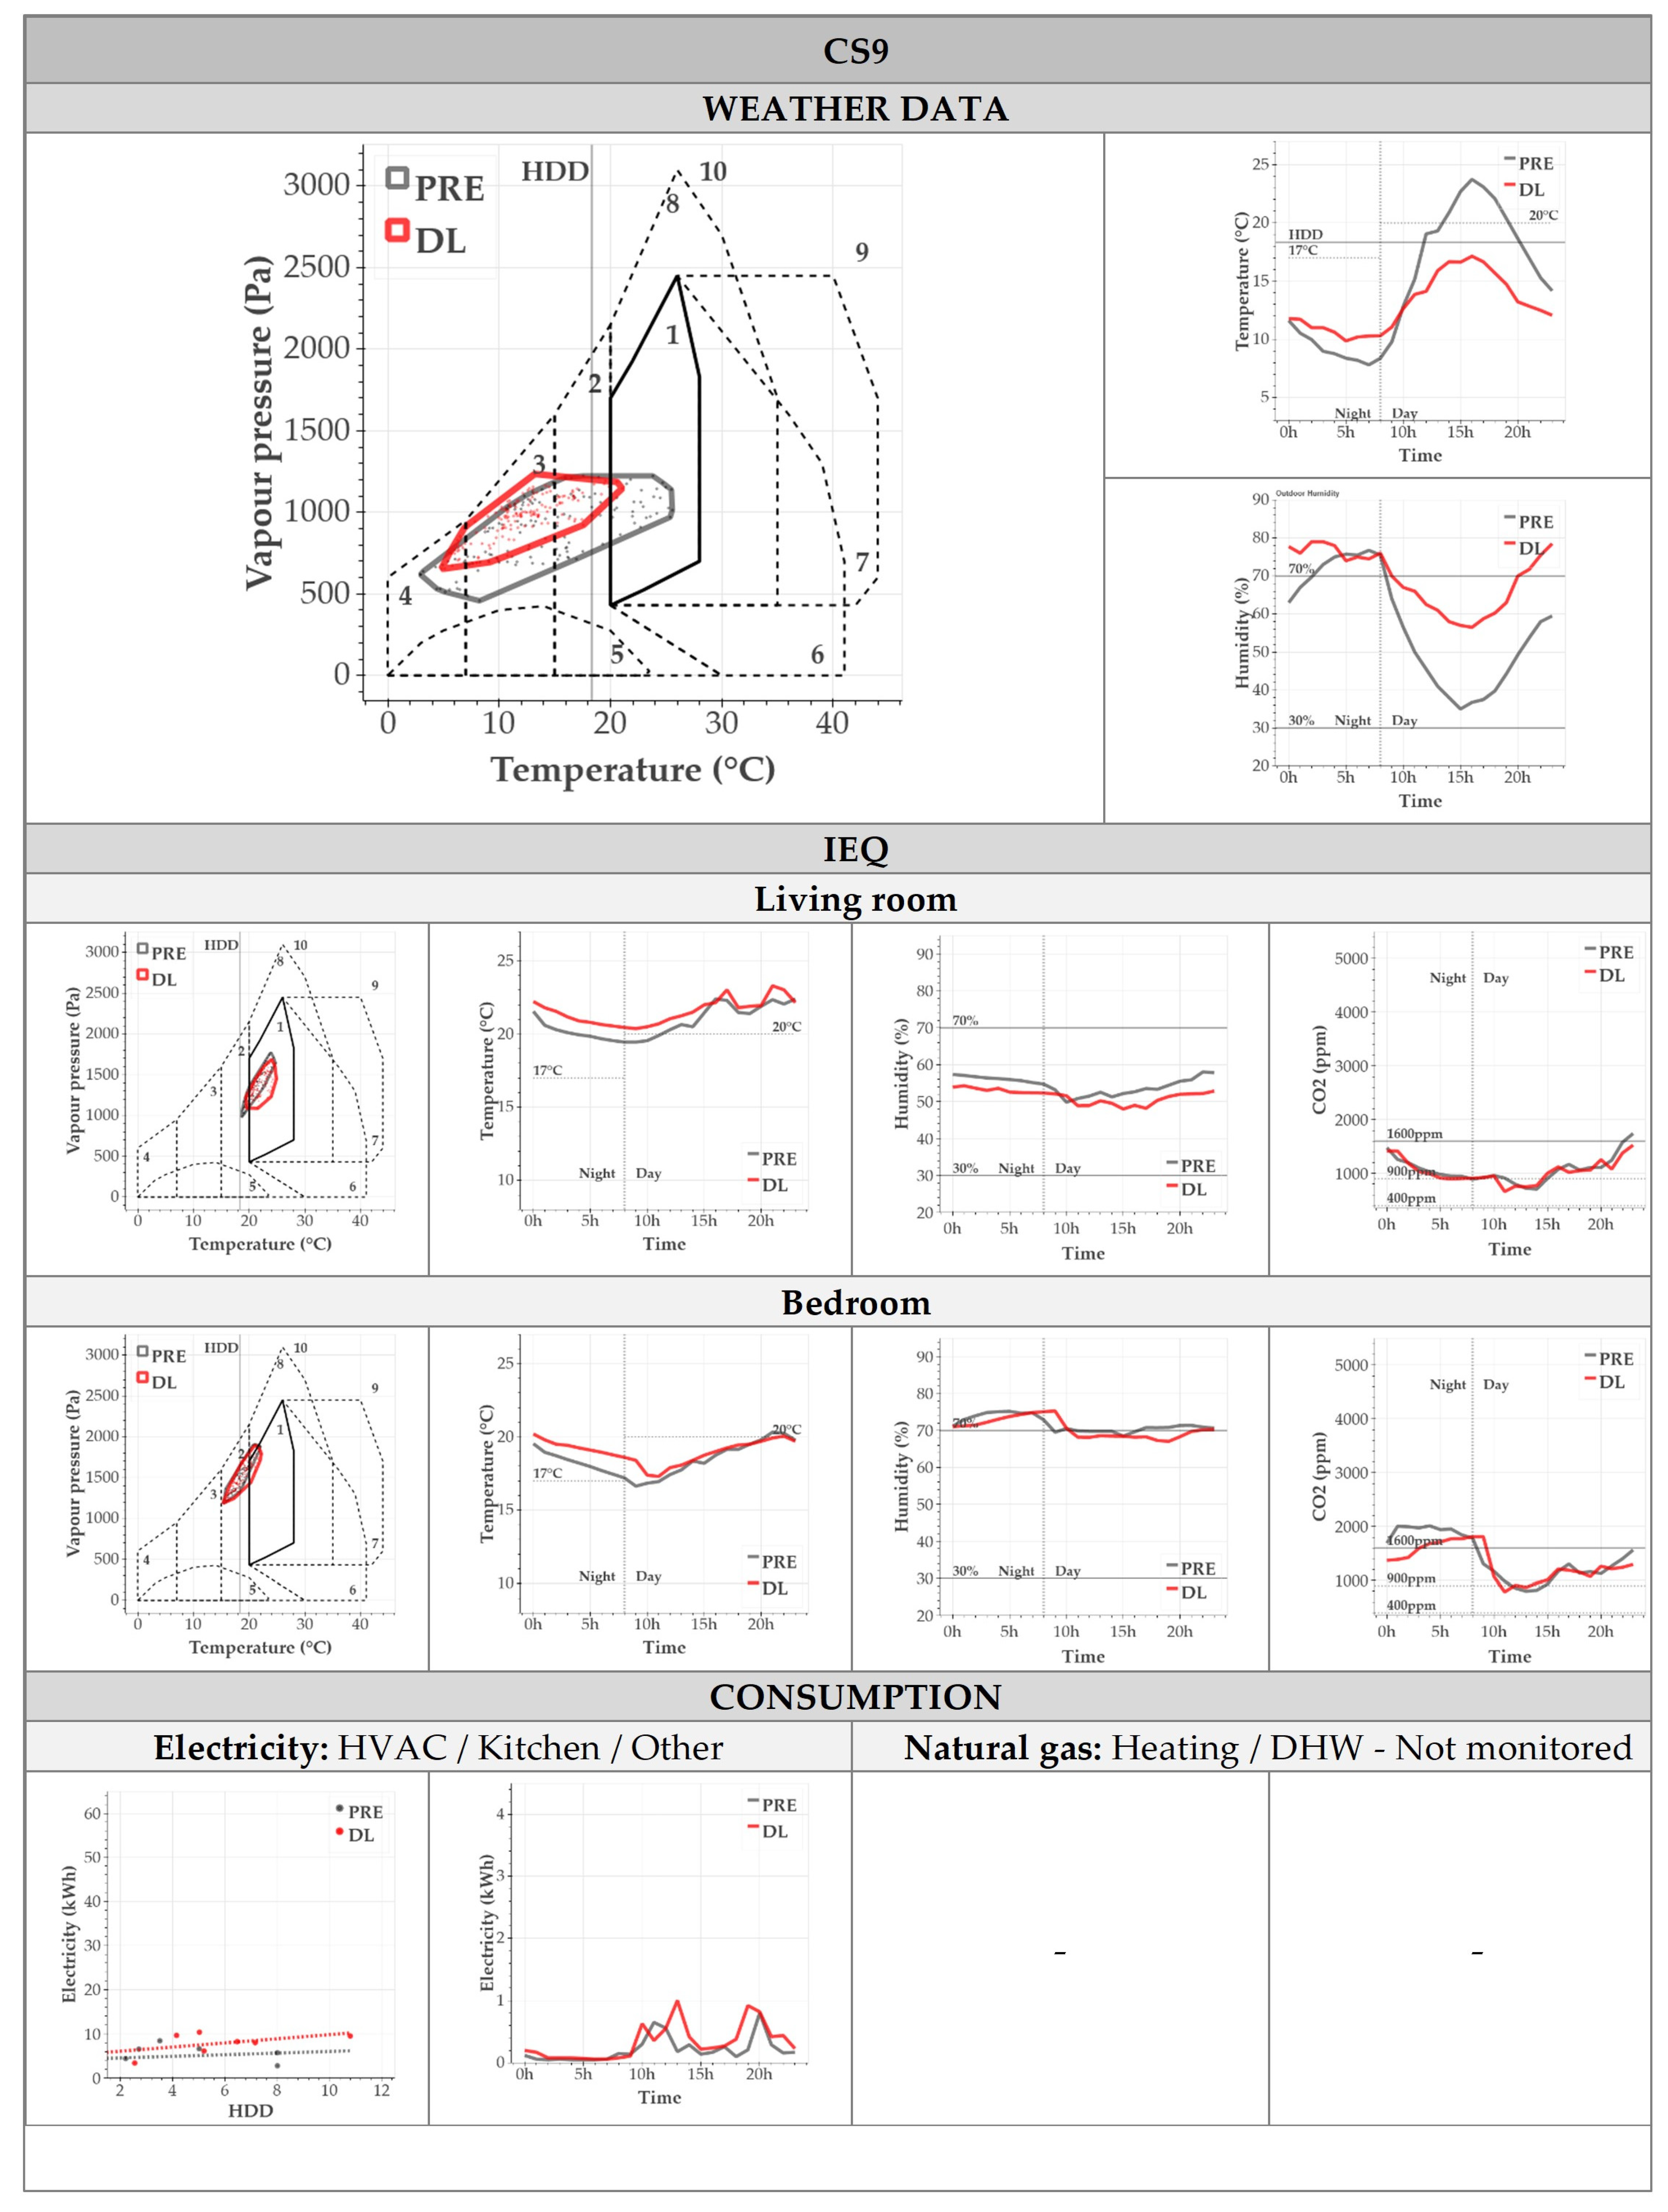
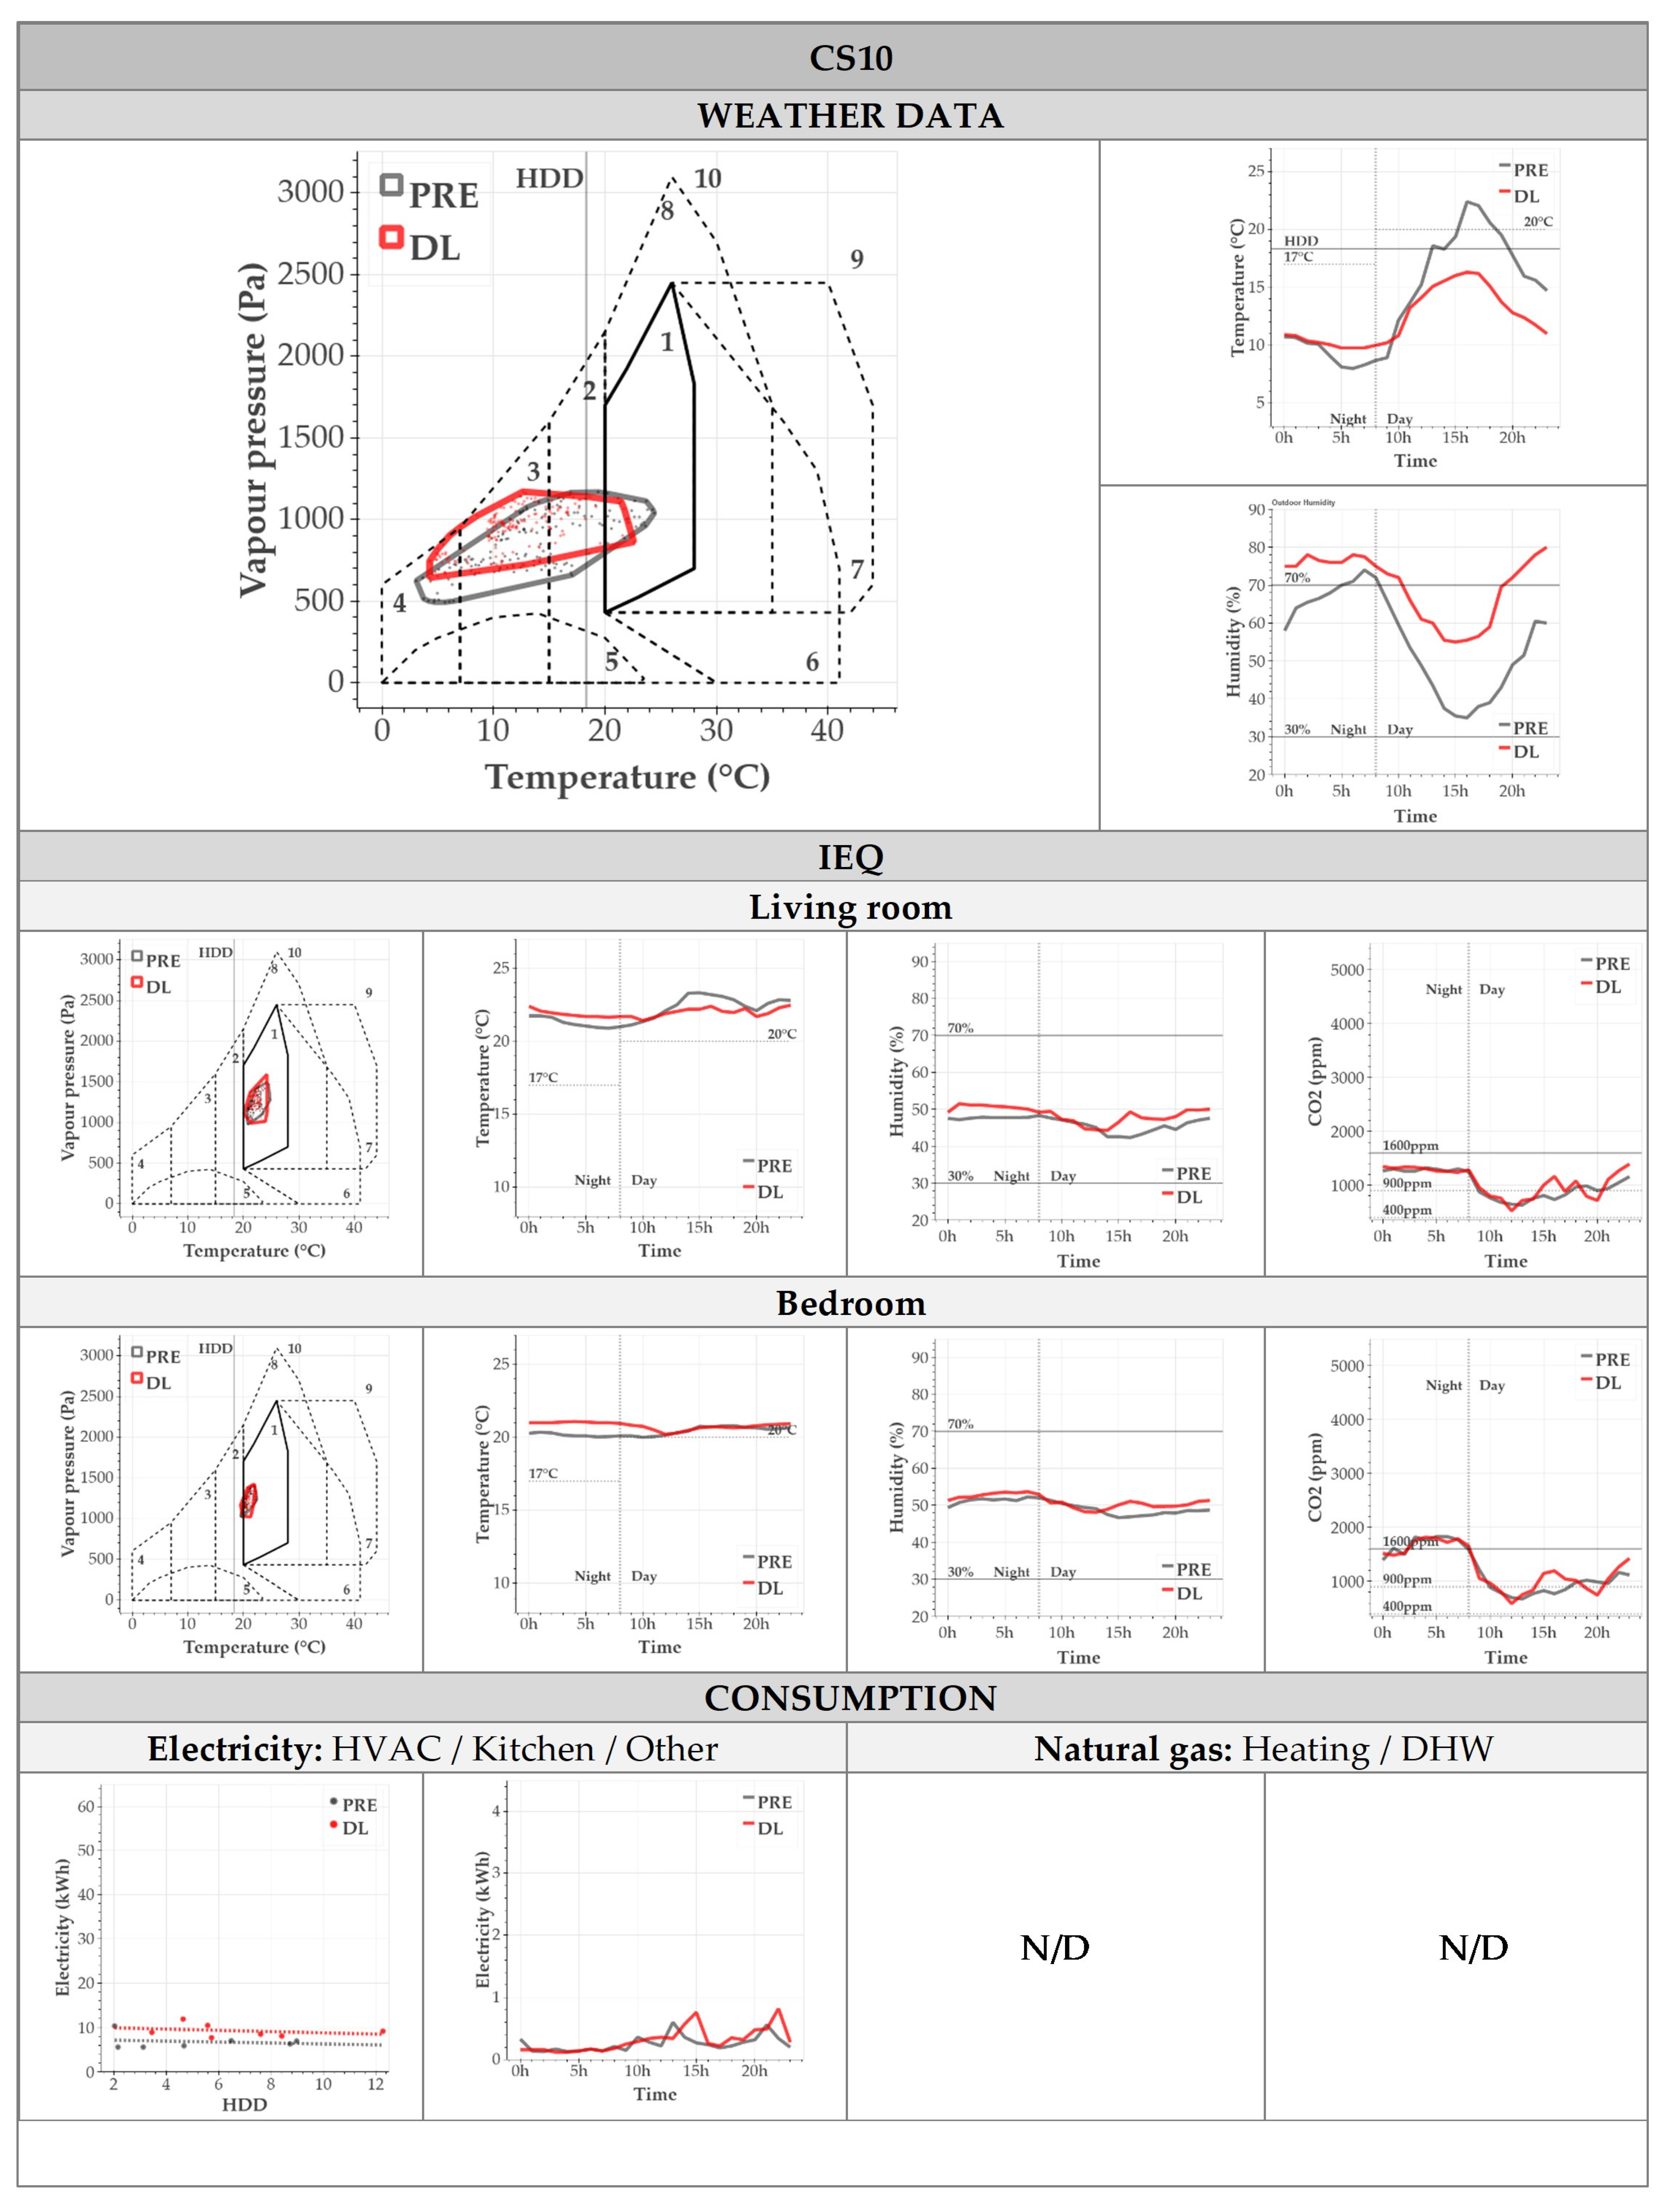
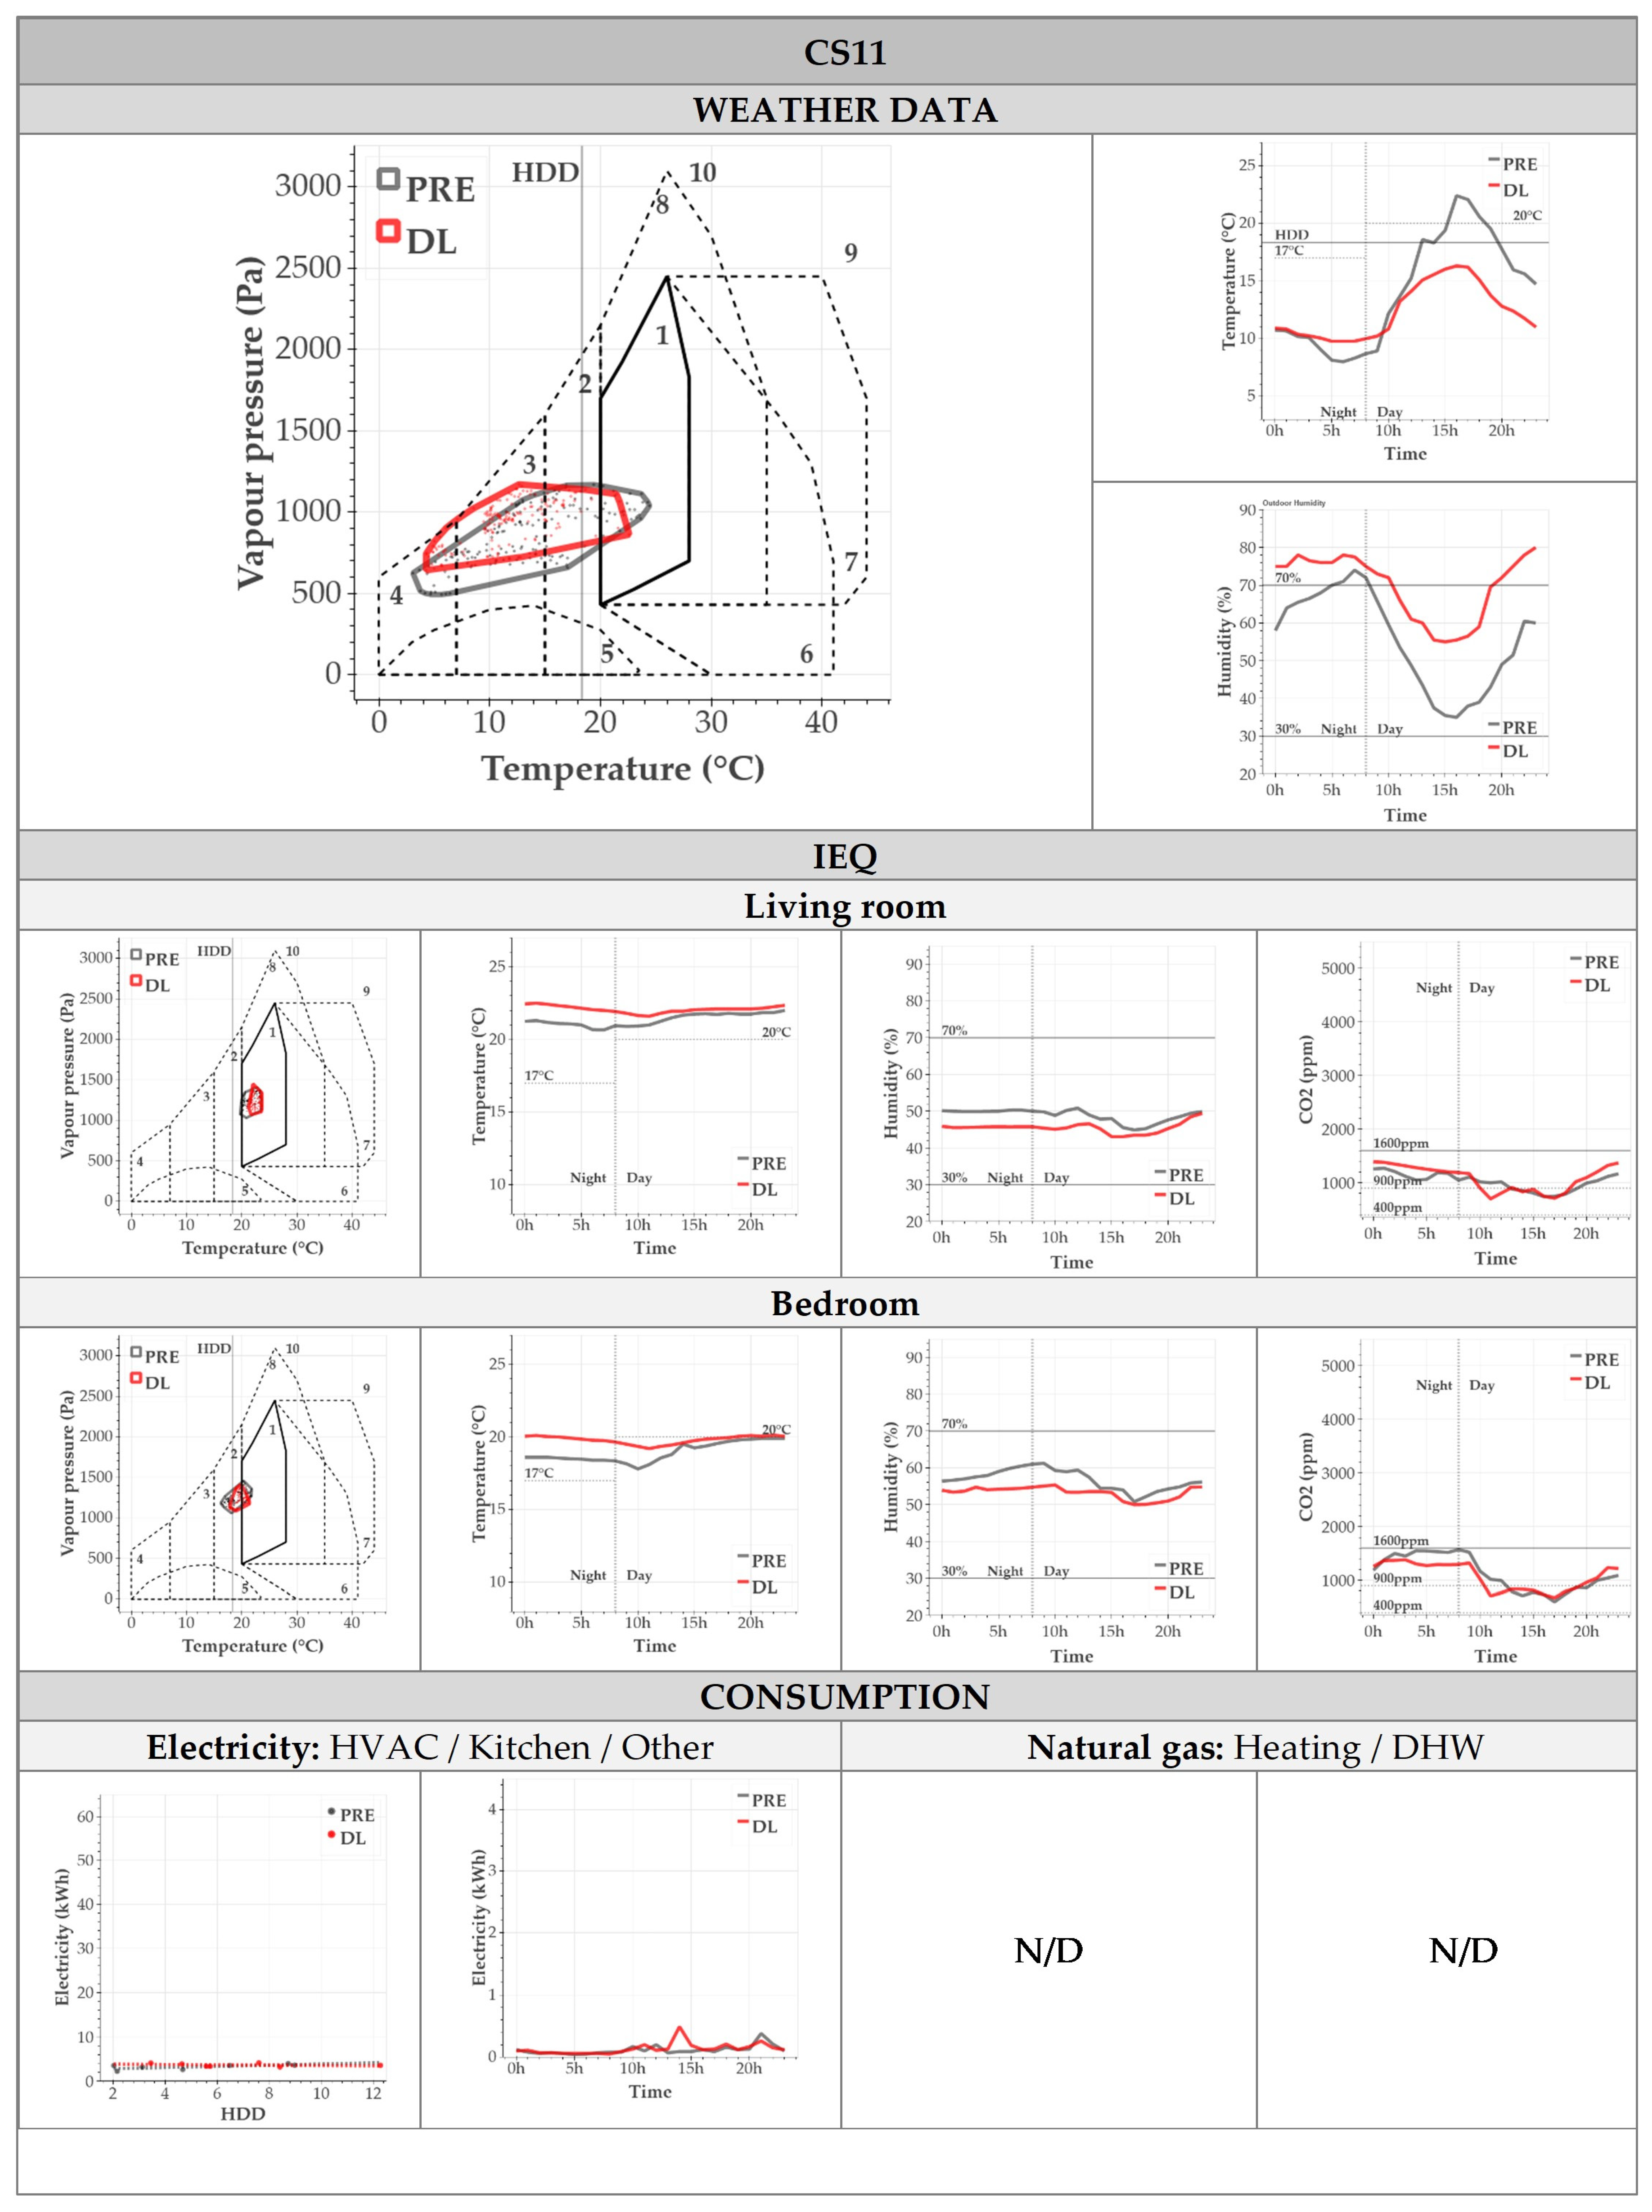
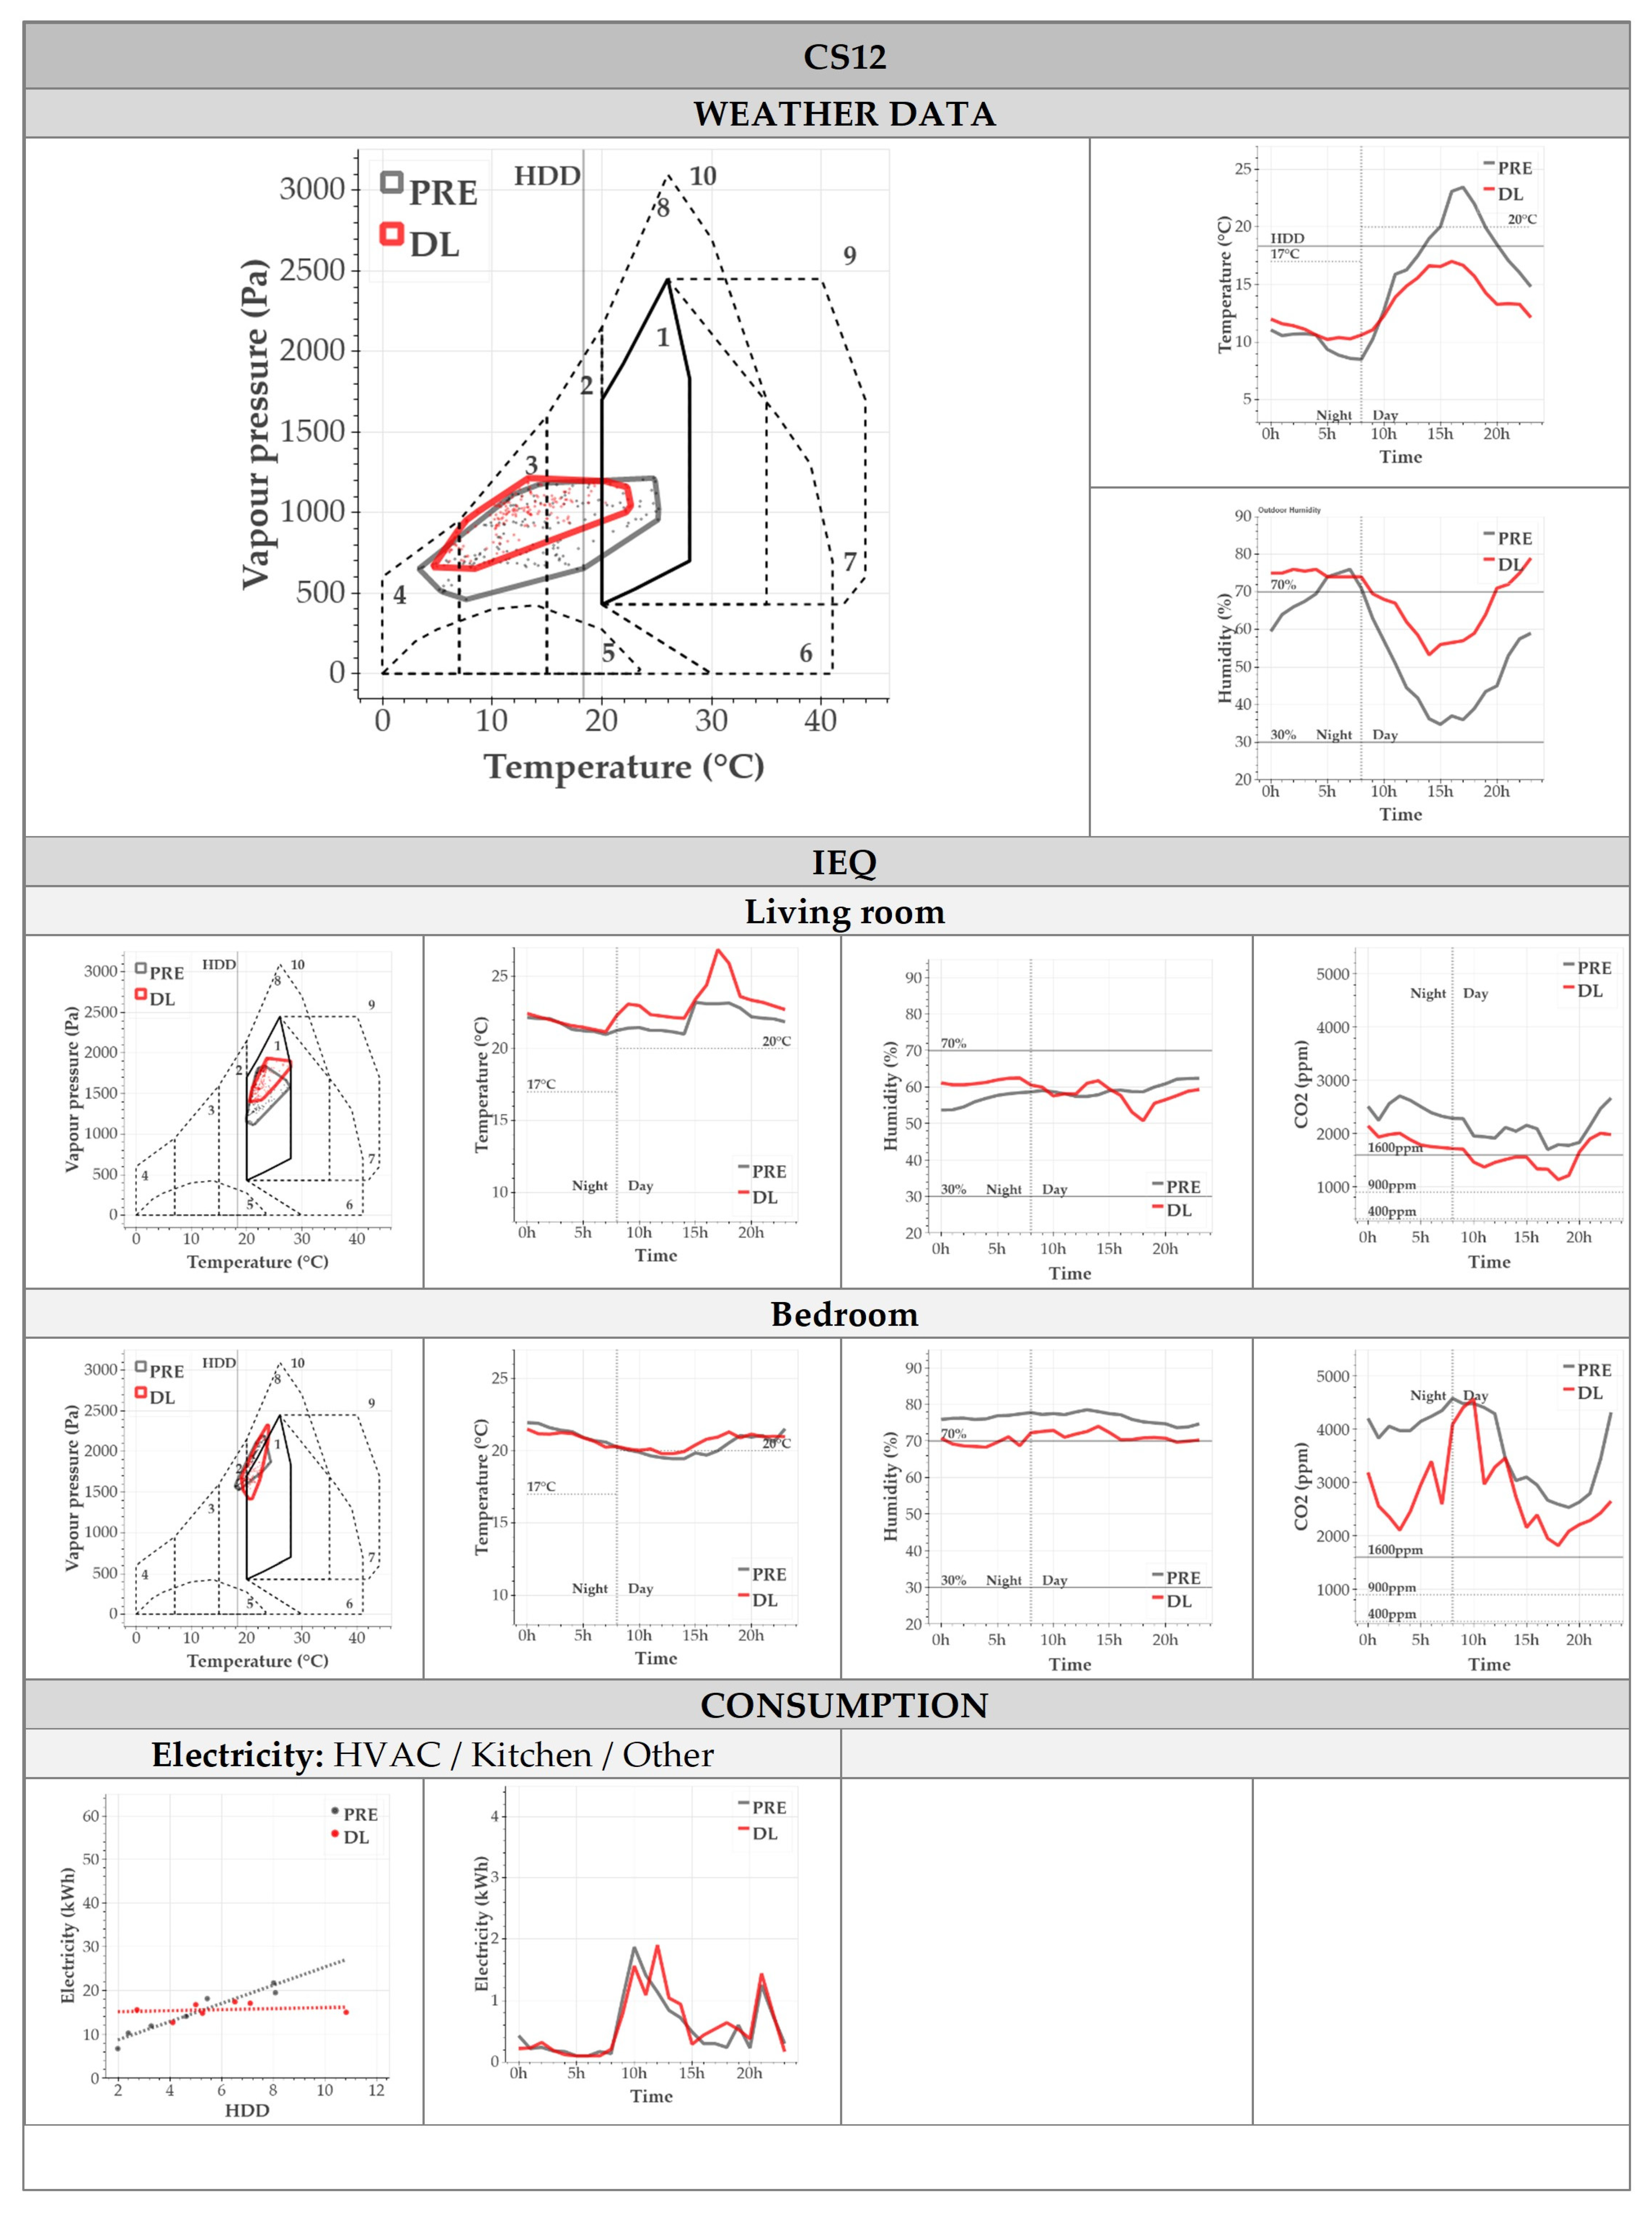
  • Meteorological data: Givoni chart and daily temperature and relative humidity graphs (hourly medians). The reference lines on the latter represent the values recommended in Spanish legislation (CTE DB HS, 2019) and the base temperature (normally 65 °F = 18.33 °C) used to calculate heating degree days, a parameter that is explained below.
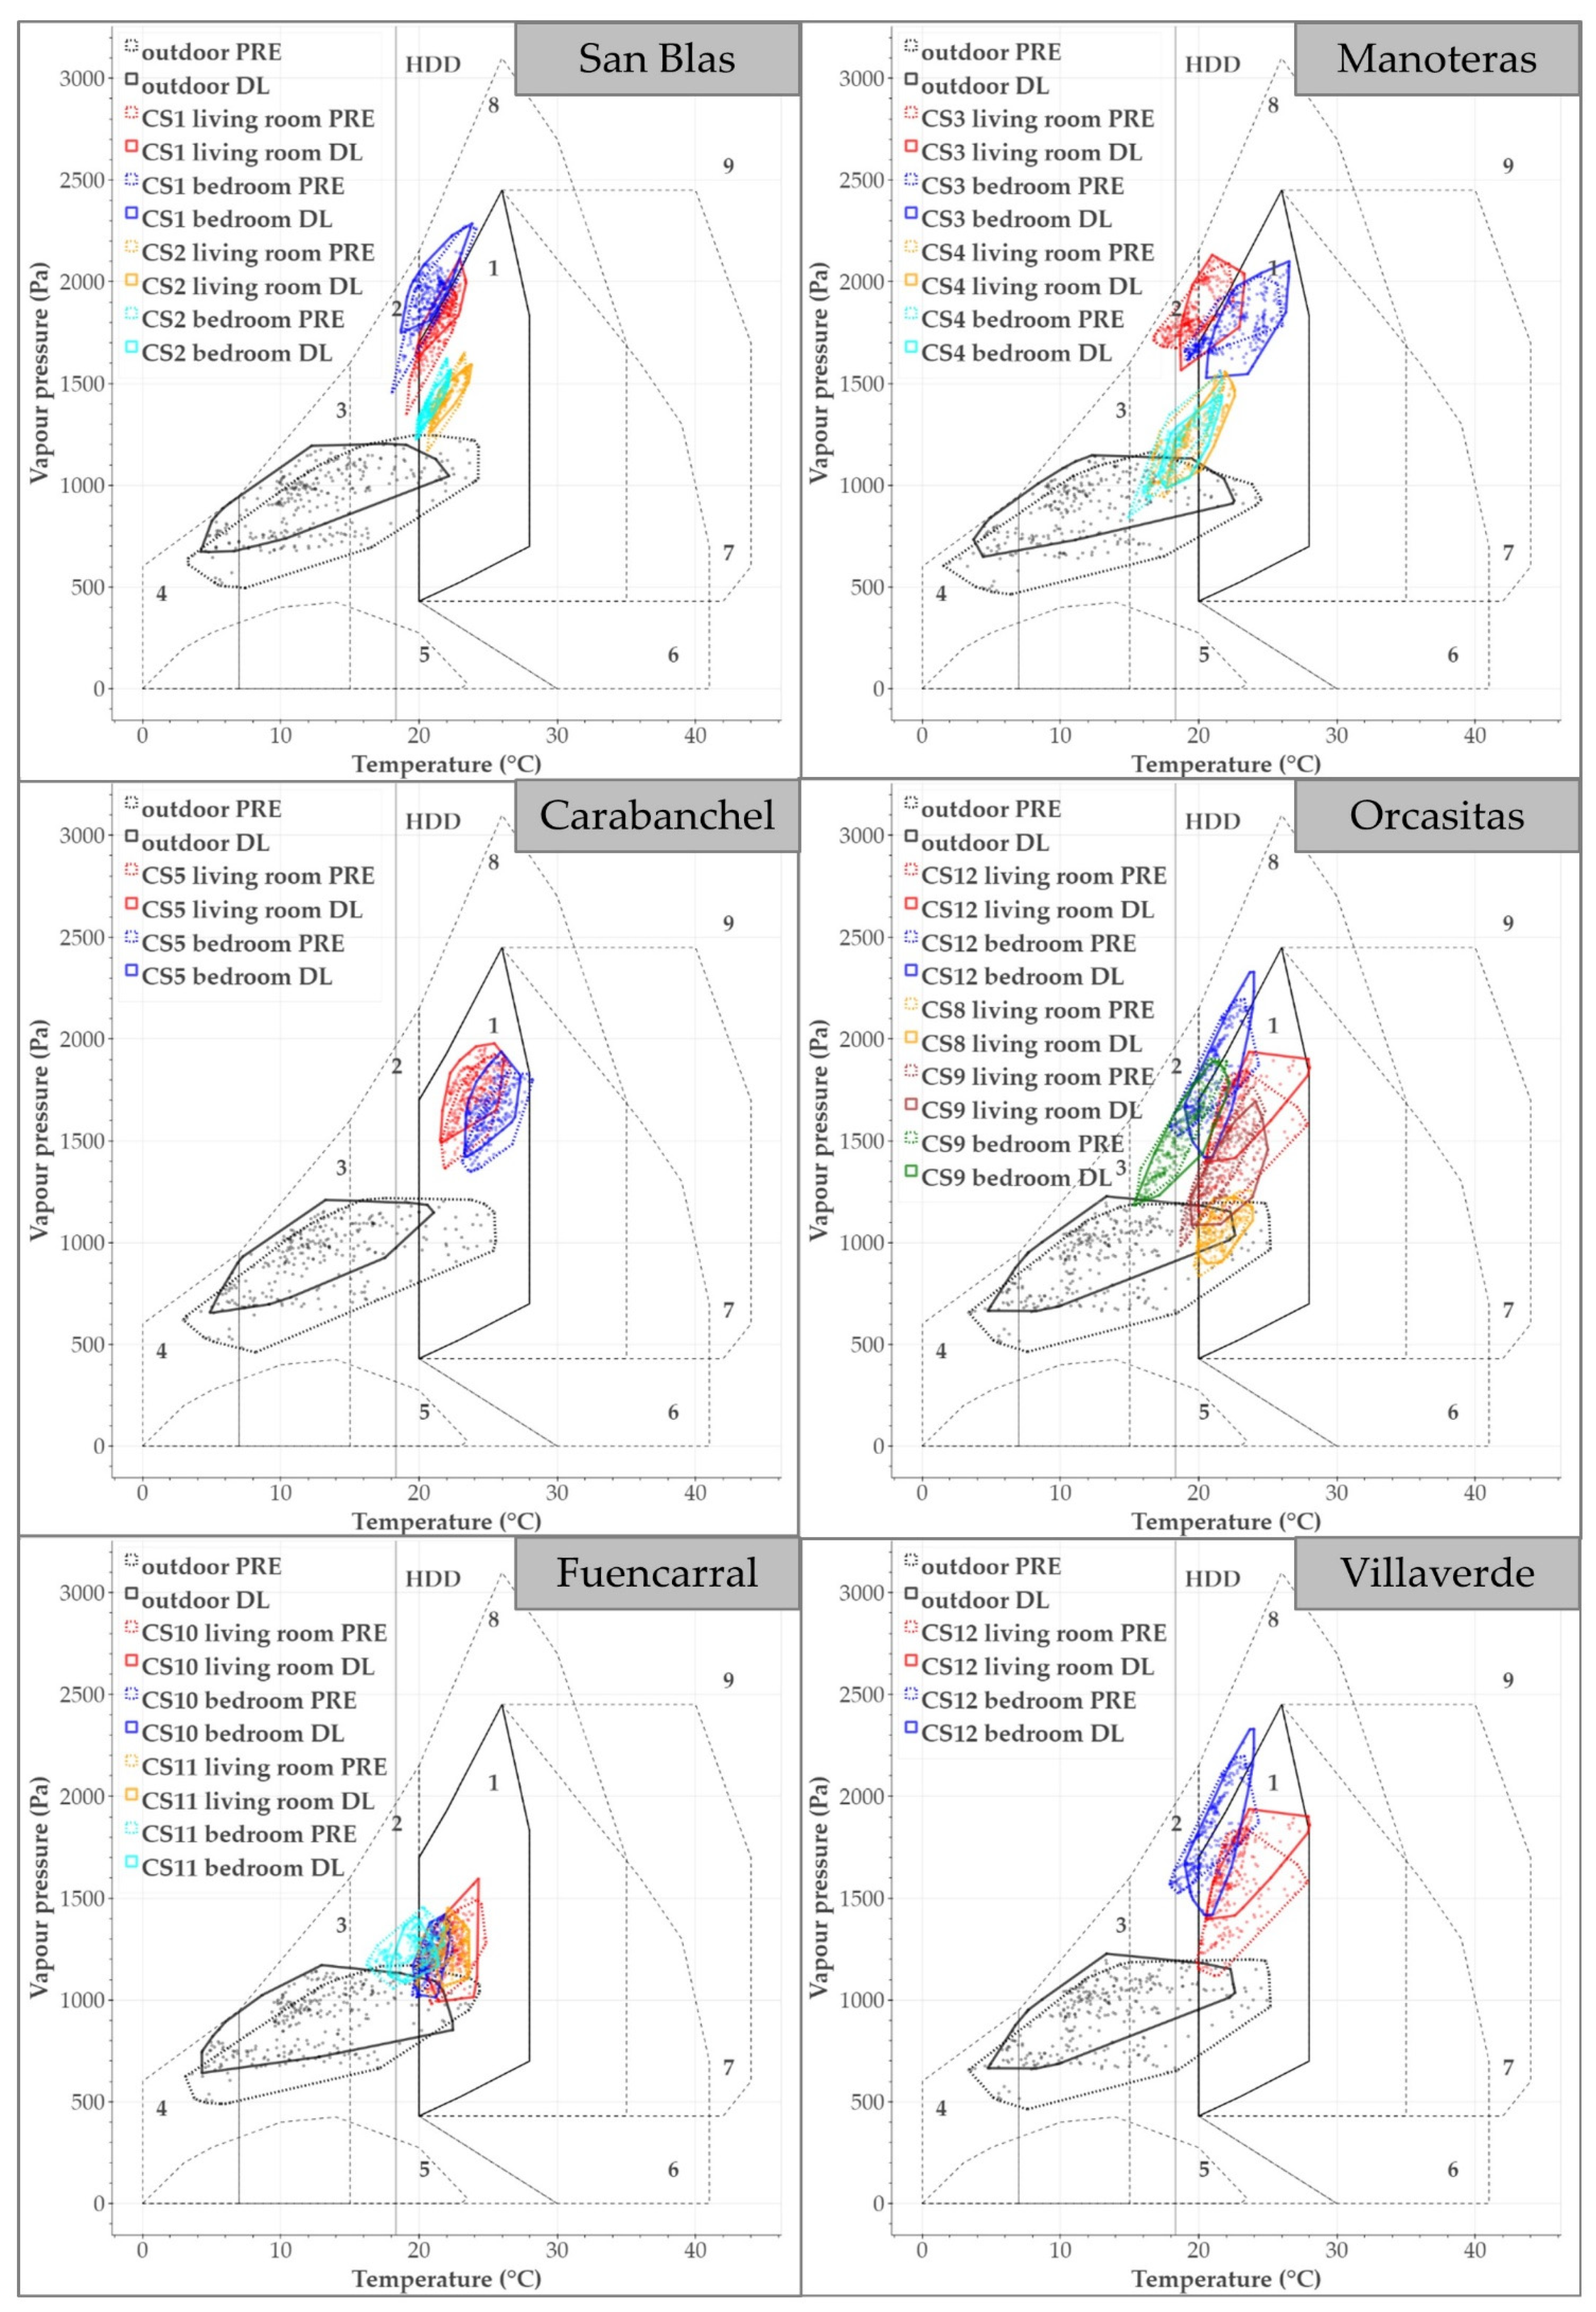
  • Indoor environmental quality (IEQ) in the living room and master bedroom: Givoni chart and daily temperature, relative humidity and air quality curves (hourly medians). The reference lines on the graphs represent the values recommended in Spanish legislation (CTE DB HS, 2019).
  • Electricity and natural gas consumption data: consumption-heating degree day graph relating outdoor conditions to consumption and daily consumption patterns (hourly medians).
The Givoni chart [90] is a psychrometric graph, i.e., it takes air temperature and relative humidity into account to assess the sensation of thermal comfort. The contour lines forming closed spaces on the chart denote the dimensions of the improvements needed to ensure comfort. Givoni charts were used to determine whether indoor and outdoor temperature (°C) and humidity (%) lay within the comfort zone. On these charts, temperature was plotted in terms of water vapour pressure (Pa) as per the Equation:
P V = H R × ( 611 × e 0.0725 × T 0.0002881 × T 2 + 0.00000079 × T 3 )   100
where:
  • PV is water vapour pressure in Pa
  • HR is relative humidity (%)
  • T is temperature (°C).
The information is synthesised as percentage of hours in the comfort zone prior to (PRE) or during (DL) lockdown. The comparison was supplemented with daily (based on hourly median) temperature and relative humidity graphs. The Givoni charts plotted with the data recorded by the weather stations were used to determine the presence or otherwise of differences in the weather in the two periods. The relative humidity graphs for the living room and bedroom before and during lockdown were analysed to determine whether or not conditions prevailing in the dwellings, hour-by-hour met comfort requirements, as well as any differences between the two periods.
Indoor air quality. Indoor CO2 concentration is widely used to assess perceived indoor air quality and as an indicator of actual ventilation rates [91,92,93,94]. Standards ISO 17772, EN 16798, EN 15251, ASHRAE 62.1 and ISHRAE 10-0-01 recommend different CO2 ceilings relative to the environmental level [95]. Here, the criterion used to assess air quality in the dwellings monitored was as set out in the Spanish legislation on residential buildings [96]. CO2 concentration-based air quality was classified in terms of as Good (<900 ppm), Acceptable (900 ppm to 1600 ppm) or Poor (>1600 ppm). Mean and cumulative values of over 1600 ppm were the grounds for defining interperiod differences. The comparison was supplemented with daily (hourly median) indoor air quality graphs for the two periods.
Potential of passive measures: this indicator was analysed to show the percentage of hours with optimal indoor environmental quality (IEQ) and outdoor comfort. Where comfort was reached outdoors at a specific time of day and indoor comfort levels with good IEQ were reached at that same time, the dwelling was assumed to be capitalising on the potential of favourable outdoor conditions.
Heating degree days (HDD) and power consumption. Heating degree days was the parameter used to synthesise weather data. HDD is found by finding the difference between a base temperature (normally 65 °F = 18.33 °C) and the mean hourly air temperature throughout the heating period (here, the definition distinguished between before and during lockdown), disregarding the hours when the outdoor temperature is higher than the base value. Assuming a standard building requires no heating when the outdoor air is higher than the base temperature, this parameter provides an approximate measure of the amount of heat energy required (in this case, also affording insight into changing consumption patterns) [97]. Heating degree days calculated as shown below were plotted against the total consumption in the two periods and the indoor and outdoor temperatures in the two periods were likewise graphed to complete the comparison:
H D D = i = 0 168 M A X ( T b a s e   h e a t i n g T i ,   0 ) 24
where:
  • Tbase heating is base heating temperature
  • Ti is hourly mean temperature
  • I is hours, to a total of 168

3.4. Joint Analysis of Reported and Monitored Data

Further to the answers given by users in the 12 dwellings to the 63 questions posed in the first questionnaire and the subsequent variable clustering as specified in Section 3.2, these parameters were reviewed to determine how they might be compared to the instrumental data or how they impacted the assessment of the power situation prevailing in the dwelling prior to or during lockdown. Variables were consequently defined on dwelling and household information (starting data) as well as on indoor environmental quality, comfort and consumption, which were deemed appropriate for comparison to the data recorded by the sensors. The other variables drawn from the questionnaire were used as controls to verify the absence of inconsistencies or as explanatory variables to support hypotheses on the situations actually in place. Depending on the information obtained for each variable, distinctions could be drawn between PRE and DL data.
The parameters were reorganised for comparison from two perspectives: (a) before and during lockdown; and (b) survey and instrumental data. The survey answers were subsequently simplified and univocally recoded to be able to assess how each parameter was affected (higher, lower, unchanged) relative to the initial conditions. Such simplification and subsequent recoding resulted in the generation of a common language to compare the survey results (with categorical responses in different formats such as Likert scales) to the sensor-logged data on indoor and outdoor environment and power consumption parameters. A comparison of the survey data to the quantitative data logged by the sensors provided an initial indication of possible alterations in the comfort, indoor environmental quality and power consumption patterns during lockdown.
The two types of data (subjective from the survey and objective from monitoring) were compared via recoding using a common six-point Likert scale (very poor, poor, mediocre, acceptable, good, very good) for the initial (pre-lockdown) conditions. A seven-point Likert scale (very much lower, much lower, lower, the same, greater, much greater, very much greater) was then defined to globally assess the variation in the parameters during lockdown relative to the pre-pandemic situation. That exercise involved a certain degree of synthesis to establish a common language for the two data sources, as well as constant advances and backtracking in analysis, recoding and decision-making to ensure that no significant information was left out in the process. Defining a common language also entailed validating the information collected, for in this mixed estimate, the control and explanatory variables served to confirm the data and justify the respective values.
The monitored and survey data are depicted in Figure 3, which shows the clusters as well as the control and explanatory parameters drawn from the survey and the data used to determine the pre-lockdown conditions for dwellings and households. Those initial parameters were used to restructure the information for the comparison and determine how lockdown was experienced in each household and the degree of variation or alteration in the three variables considered (comfort, indoor environmental quality, power consumption) in each dwelling.

4. Results

The survey data parameters, clustered by category, are given in Table 4 and Table 5. Table 4 lists the values reported by each household for indoor environmental quality, power consumption and heating facilities under the categories defined. Table 5 summarises the information on dwelling use and occupation, perception of comfort, energy expenditure relative to total income, fuel vulnerability as appropriate and user habits during this period.
Table 6 and Table 7 summarise the indicators for the data logged by the sensors. Table 6 gives the values for the weather station parameters: degree days; the mean, maximum and minimum temperature (°C); the percentage of comfort hours (%); the electricity and gas consumption (kWh); variations in such consumption (kWh); and the relationship between outdoor conditions and consumption (slope on linear regression curve). Table 7 gives the pre-lockdown and during-lockdown living room and master bedroom IEQ parameters: the mean, maximum and minimum temperature (°C); the mean relative humidity (%); the percentage of indoor comfort hours and percentage of indoor–outdoor comfort hours; and the mean and cumulative air quality (CO2 in ppm).
Table 8 contains a unified summary on a common scale of the survey- and sensor-collected information for each dwelling, comparing lockdown to the pre-pandemic values. The respective data are shown for dwellings grouped under the headings PRE, DL and neighbourhood.

5. Analysis and Discussion of Results

5.1. Mixed Method

With the mixed method, data from two distinct sources (the surveys conducted prior to and during COVID-19 lockdown and the temperature, relative humidity and indoor air quality data logged by sensors in those same periods) could be analysed jointly. The analysis aimed essentially to obtain a deeper understanding of the impact of lockdown and concomitant 24/7 occupation on indoor environmental quality and power consumption in dwellings. More specifically, in addition to looking into the periods before and during of the state of emergency [5], the study aimed to compare users’ subjective perception in those variables to the instrumental data recorded.
Therefore, the joint analysis of the factors addressed, including initial weather, housing quality and occupation variables, as well as the comparison of power consumption, thermal comfort, humidity and air quality in the two periods studied, had a dual purpose, as premised in the methodological triangulation. That approach [84,85] pursues two essential objectives: (1) enrichment of the research itself by addressing data from two distinct sources; and (2) enhancement of research quality control and therefore of the reliability if the results [98]. In this case the reliability of the results may also provide insight into households’ subjective perception of the parameters measured by the sensors, namely the comfort, air quality and power consumption.
Merging the quantitative (sensor-logged) and qualitative (surveys with open questions and visits to dwellings early in the process) data affords a fuller view of any given circumstance, in this case COVID-19 lockdown in social housing in Madrid, from different perspectives, generating deeper overall understanding of the situation [99], along with methodological validation [85].

5.2. Outdoor Conditions

According to weather station records, weather conditions immediately prior to lockdown were characteristic of late winter and early spring (Table 6 and Appendix A). Data before lockdown: 36-degree days, mean temperature 14 °C, with a high T of 24 °C and a low of 3 °C; 14% of comfort hours. Data during lockdown: 46-degree days, mean temperature 12 °C, with a high of T 22 °C and a low of 4 °C; 3% of comfort hours. Consequently, the comparison of the before and during lockdown situations was essentially unconditioned by the weather.

5.3. Occupation Density

The effect of the sudden change from presence at home from 11 h to 21 h per day [86,100,101], to practically 24 h/7 d a week [94] on the case study dwellings varied depending on the starting data (Table 8). Dwellings CS2, CS3 and CS6 scored the highest at the outset, whilst the values for CS1 were acceptable. Those four flats were generally well kept up and exhibited fairly comfortable occupation densities of around 0.02 p/m2 both before and during lockdown. Density rose most steeply in CS3 especially, by 54.17%, followed by CS1, CS4, CS7, CS8 and CS10, with values ranging from 30% to 45%. Occupation density rose in the lockdown period studied by less than 30% in the other six dwellings. The last starting data variable was the potential of passive measures. The values observed showed that CS4, CS7, CS10 and CS11 started with the most suitable behaviour and that lockdown had an adverse effect on CS5 in that regard. The data for the remaining cases were either incomplete or denoted no significant variation relative to the week prior to lockdown.

5.4. Power Consumption

The values for the during-lockdown consumption parameters studied [86,102] differed from one dwelling to another (Table 6 and Appendix A). Electric power consumption relative to a standard value rose to a greater or lesser percentage during lockdown in 10 of the 12 dwellings, with CS7 and CS1 as the exceptions. In the three dwellings where it was monitored, natural gas consumption rose in CS2 and declined in CS8 and CS1. The ratio between consumption and heating degree days was clearly greater before than during lockdown in all three. User-reported power consumption (Table 4) was generally consistent with the patterns identified from the findings logged by the sensors, attesting to users’ conscious association of their behaviour to power consumption, either out of necessity, ingrained habit or environmental conviction. A number of variables informed the power consumption category (Table 8). Firstly, habits prior to or changed under lockdown circumstances affected consumption attributable to appliances and devices used in the dwelling and DHW and heating facilities. Depending on each household’s attitude, energy saving strategies may have been implemented during lockdown with a view to countering consumption. Vulnerability data, in turn, afforded insight into consumption prior to and during lockdown, serving as a control to better understand user-reported values for the aforementioned variables. Consumption tended to rise most intensely in CS8, followed by CS2, CS6, CS7, CS9 and CS10. That finding was consistent with user-reported data, where CS8 claimed a much greater increase in power consumption during lockdown than in the pre-lockdown period than the other dwellings. Consumption also rose in CS1, CS5 and CS10, although less steeply relative to earlier values, as well as in CS3 and CS11, although to a lesser extent, and barely at all in CS7 and CS9. According to the sensor-logged data, power consumption rose in CS1, CS3, CS5, CS8, CS9, CS10, CS11 and CS12, matching the survey results almost perfectly. Although CS2 reported a rise in natural gas consumption, on the whole the dwellings were more cautious in this regard, whilst CS1 and CS8 claimed to have lowered their consumption.
In terms of vulnerability, the least favourable conditions were reported by dwellings CS1, CS2 and CS8.

5.5. Thermal Comfort

Thermal comfort (determined by air humidity and temperature [29,86,101]) generally improved in the living room and bedroom, although to a greater or lesser extent depending on the dwelling studied (Figure 4). The sole exception was dwelling CS1, where fewer comfort hours were logged in the bedroom during lockdown. Although fewer outdoor comfort hours were observed during lockdown, no data were collected on the potential of passive measures in the CS1, CS3 or CS12 living rooms, whilst the value declined in CS2 and CS5 and rose in CS4 and CS7. CS9, CS10 and CS11 all drew advantage from outdoor comfort hours during lockdown, whilst CS8 capitalised on outdoor comfort to ensure a good IEQ before and during lockdown (Table 6 and Appendix A). The data for bedroom comfort hours during lockdown indicated no records for CS1 or CS12; declines in CS2, CS3 and CS5; rises in CS4 and CS7; and use of outdoor comfort hours by CS7, CS10 and CS11. The subjective data on perceived comfort (Table 5), however, were not fully consistent with those findings, for a number of possible reasons. Firstly, some respondents answered the questions on thermal comfort as an average for the two rooms instrumented. For instance, if the living room, used during the day and was highly comfortable but the bedroom the contrary, the overall perception conditioned the thermal comfort reported. In a way, however, such responses may be explained both by the habits acquired during lockdown as well as by the disparity in the data structure: comfort parameters were measured room-by-room whereas the survey questions referred to overall perception.
The comfort and adaptation category (Table 8), in turn, was analysed with two survey variables, namely perceived temperature and the measures adopted to counter possible discomfort, and whether or not they entailed power consumption. Those variables were compared to the sensor-logged indoor temperature and relative humidity readings in living rooms and bedrooms. On the whole, perceived comfort was consistent with in situ measurements in the dwellings with the most favourable conditions, CS2, CS5, CS7 and CS10. Some discrepancies were nonetheless observed between perceived and objectively measured comfort. CS3 had the most optimistic dwellers, while among the optimists in general users reporting indoor comfort as an average of the two rooms prevailed. For instance, whilst CS1 reported the living room to be very comfortable and the bedroom not at all, perception was averaged for the two rooms in CS4, where the value assigned was ‘acceptable’ for both, and in CS9 and CS12. The pessimistic users, in turn, living in CS2, CS4, CS5, CS8, CS10 and CS11, reported lower comfort levels than indicated by the observed ranges of temperature and RH. Lastly, passive comfort revealed the initial situation to be more favourable for CS4, CS7, CS10 and CS11 and lockdown to have had an adverse effect on CS5. The data for the remaining cases were either incomplete or showed no significant change relative to the week prior to lockdown.

5.6. Air Quality

Indoor air quality [29,86,101,103], expressed here as mean and cumulative values, improved in the living room during lockdown except in CS3 and CS10 (mean value). Indoor air quality in the bedroom improved in CS2, CS7, CS9, CS11 and CS12, but not in CS1, CS3, CS5 and CS10. Improvements in air quality did not necessarily translate into good or acceptable quality, which is an indication that ventilation practice was insufficient on the whole (Table 6 and Appendix A). The greatest discrepancies between user perception (Table 4) and sensor-logged data were observed in connection with indoor air quality. Here, also, average perception for the two rooms was sometimes reported, despite wide differences (also related to daytime/night-time behaviour patterns). Nonetheless, some users proved to be optimistic in their perception of ‘acceptable’ air quality whilst other households were pessimistic, scoring quality as lower than the standard-compliant values actually measured. The two variables on which perceived indoor environmental quality (Table 8) and more specifically air quality were based were perceived air quality and comparative ventilation frequency. When the two variables were assessed jointly, the dwellings with the highest scores for ingrained household practice were CS4, CS7, CS8, CS9 and CS10. A comparison with the sensor-logged data revealed the same pattern in all but CS10. Nonetheless, whereas those patterns generally referred to living room ventilation, air quality was lower in the bedrooms on the whole. During lockdown, the dwellers in CS1 and to a lesser extent CS5, where starting values were not very good, reported improving their habits during lockdown. Further to the sensor-logged data for air quality, however, CS1 and CS2 practice did not improve enough for IEQ to be classified as anything other than poor or mediocre, respectively. In contrast, the survey scores were the lowest in CS11 and CS12, where no substantial improvements were forthcoming judging from the scant variation in their ventilation routines. Those findings were consistent with the sensor-logged data. The dwellers in CS3 and CS10, in turn, were much more optimistic about indoor air quality and ventilation practice than denoted by the CO2 concentration values. The perception of both air quality and ventilation practice, then, varied widely from dwelling to dwelling.

5.7. Goals and Limitations

An important goal addressed in this study has been to unveil and validate differences in IEQ and energy consumptions patterns before and during COVID-19 through the mixed approach. To determine the goal at the time, the questionnaires focused on determining the following: households’ characteristics and habits; power-consuming facilities; indoor environmental quality; comfort and adaptation; energy savings strategies and use of renewables. This approach allowed for the integration of qualitative information (from the open-ended questionnaires and eventual brief interviews when installing the equipment) into the quantitative results (from the monitoring campaign) on IEQ and energy use. This study also provided objective data on the energy situation of the studied cases, useful for potential studies and the enrollment in energy rehabilitation programs (such as the European Regional Development Fund (ERDF) [104]).
Three main limitations related to this type of study were addressed in relation to generalization, technology and indoor air quality. First of all, due to a mixed nature, and the number of case-studies, the representativeness of the results is not possible. In addition, as far as the results of the analysis are related to contextual variables (climate, occupant profile, lifestyle, cultural background), it contributes to bear in mind all of them before comparing with other studies. Other limitations came from some technological concerns: on the one hand, the very nature of online surveys, for instance, which require the availability of digital resources, internet connection and a minimum of knowledge to understand and self-complete them successfully and on the other hand, the cost, maturity and adaptability of the technical platform, and the tools delivered for data collection. Some limitations came from problems related to the monitoring campaign: beyond the lack of Internet connection, network stability and capacity, lack of power, interferences, etc., were the main difficulties that may be encountered. For a successful monitoring campaign, these constraints require the effectiveness of data collection methods and user selection and commitment. However, this work demonstrated the use of different types of data in the analysis can help to overcome these problems. Finally, in this study, indoor air quality has been defined only with the CO2 parameter since with only this variable we inferred ventilation patterns (determinant aspect in COVID-19 lockdown). VOCs [94,105], radon [106,107] and fungi [108], which would be desirable parameters to collect, were not measured in favour of respecting the social and physical distancing and restricted mobility required by the Spanish Royal Decree on the State of Alarm. In addition, the opportunity to analyze such an abrupt and unusual event (confinement) elicited the haste in making decisions about measurements and user-centered techniques, the difficulty of access to housing, as well as the availability of resources and households and their willingness to collaborate in what was seen as a unique and unprecedented extreme situation.

6. Conclusions

Merging the quantitative and qualitative data affords a fuller view of any given circumstance, along with methodological validation. The findings for the 12 case studies revealed different starting conditions for variables such as household composition (from singles to large families) and very diverse dwelling characteristics (general upkeep, envelope and window quality), as well as differences in initial predisposition depending on orientation (determining sunlight) and height relative to the building as a whole.
Such wide inter-dwelling differences, even in flats in one and the same building, partially conditioned household risk of discomfort. This category of variables referred to initial issues and the degree to which each household could solve them with different passive strategies such as adaptation or acclimation [109] or using heating with the concomitant power consumption [51].
In turn, situations more closely related to indoor environmental quality [94,110] and to power consumption patterns before and during lockdown changed in keeping with starting conditions, occupation density (8/12 case studies increase occupancy density by more than 25 percent) and household behaviours during lockdown (11/12 case studies improve thermal comfort; 10/12 improved air quality but did not necessarily translate into sufficient ventilation practices; air quality was lower in the bedrooms on the whole; only 4/12 case studies use the potential of passive measures). Behavioural patterns that depended on circumstances and specific household needs (such as the presence of minors or dependent persons or higher temperature comfort demands) [39] as well as on user commitment to efficient energy use [111] were observed. Only one household adopted energy savings strategies that differed from the other eleven, for instance.
The households with clearly less favourable starting conditions were the ones, generally speaking, who adopted more measures to mitigate discomfort or take better advantage of passive strategies [112] such as natural ventilation and lighting and the ones, much to their regret, and only where strictly necessary, resorted to heating to attain the desired comfort levels [51].
Most households were also observed to distinguish between daytime and nighttime in an attempt to minimise consumption, ventilating only in empty rooms to conserve thermal comfort as far as possible.
Power consumed for electrical appliances [16] in keeping with household needs was governed by the everyday tasks performed by users and the number of people present in each dwelling. The literature on this subject [36,37] confirms that power consumption rose as a rule during lockdown, (10/12 case studies increased electric power consumption), irrespective of household vulnerability, with the least advantaged applying more savings measures and resorting more intensely to passive strategies, in particular in pursuit of comfort, behaviours in fact directly associated with vulnerability and fuel poverty during lockdown [72].
The conclusion that can consequently be drawn is that although starting conditions differed widely, household composition, habits and the way daily activities were performed [113], and therefore power consumption, also played an active role in the end result. Nonetheless, none of these dwellings were fitted with renewable energy-fuelled generation systems that might have limited their dependence on fossil fuel power and rendered dwellings more self-sufficient in terms of power production, at least for a certain percentage of their daily demand. Such arrangements would be desirable not only in response to calls for decarbonation and energy transition, but especially in the present lockdown-induced context of uncertainty and contingency around worldwide resources in general and buildings and their facilities in particular [114,115].
This contribution may also suggest technological and human-centered implications and housing interventions in several ways. Firstly, in the generation of rapid guides or good practices compatible or even included in contingency plans that require interventions in the home or follow-ups considering various data collection techniques. Secondly, technological advances in monitoring could be improved considering this extreme situation that involves people to remain inside due to lockdowns. Third, programs of households’ enrollment, awareness, housing digitalization and energy/IEQ training could be interesting or relevant, even more when people stay at home for a long and uncertain period. Finally, fully immersed in the renovation wave and promotion of the rehabilitation of the European Green Deal and other initiatives also at the national level, it is important to consider digitization and the user engagement proactively in these actions, as well as the resilience of homes in deep rehabilitation, and not only covering energy issues. The COVID-19 pandemic has retaken the relevance of IEQ. All of these aspects approach housing to greater self-sufficiency and energy independence, an adequate energy and digital transition, and better well-being and health for their residents, which results in a greater return on investment of these actions at a social and economic level.

Author Contributions

Conceptualization, F.d.F. and T.C.-V.; data curation, F.d.F. and T.C.-V.; formal analysis, F.d.F. and T.C.-V.; funding acquisition, I.O.; investigation, F.d.F. and T.C.-V.; methodology, F.d.F., T.C.-V. and M.Á.N.-M.; project administration, I.O.; resources, F.d.F., T.C.-V., C.A., F.M.-C., I.O. and M.Á.N.-M.; software, F.d.F., T.C.-V. and M.Á.N.-M.; supervision, F.d.F., T.C.-V., C.A., F.M.-C., B.F., I.O. and M.Á.N.-M.; validation, F.d.F. and T.C.-V.; visualization, F.d.F. and T.C.-V.; writing—original draft, F.d.F. and T.C.-V.; writing—review and editing, F.d.F., T.C.-V., C.A., F.M.-C., B.F., I.O. and M.Á.N.-M. All authors have read and agreed to the published version of the manuscript.

Funding

This study was funded by the Spanish Ministry of the Economy’s National Programme for R&D + I Geared to Societal Challenges under the project BIA2017-83231-C2-1-R ‘Nueva herramienta integrada de evaluación para áreas urbanas vulnerables. Hacia la autosuficiencia energética y a favor de un modelo de habitabilidad biosaludable’ and ‘Habita_RES-(2018–2021)’.

Institutional Review Board Statement

The study was conducted according to the guidelines of the Declaration of Helsinki. In addition, the original questionnaire was approved by the Ethics Committee of Consejo Superior de Investigaciones Científicas (CSIC), approval number 057/2020, on 30 April 2020.

Informed Consent Statement

Informed consent was obtained from all subjects involved in the study.

Data Availability Statement

The data are not publicly available due to ethical reasons.

Acknowledgments

The authors acknowledge the [COVID-HAB] project for the contribution of the original questionnaire, here entitled “COVID19-HABITA_RES survey”, from which data related to confinement have been obtained. They also thank the CIBERESP of the Instituto de Salud Carlos III (Spain) for access to the online data collection platform in this study.

Conflicts of Interest

The authors declare no conflict of interest.

Abbreviations

PREpre-lockdown
DLduring lockdown
IEQindoor environmental quality
DHWdomestic hot water
HVACHeating, ventilation and air conditioning
HDDheating degree days
N/Dno data

Appendix A

Sustainability 13 07700 g0a1
Sustainability 13 07700 g0a2
Sustainability 13 07700 g0a3
Sustainability 13 07700 g0a4
Sustainability 13 07700 g0a5
Sustainability 13 07700 g0a6
Sustainability 13 07700 g0a7
Sustainability 13 07700 g0a8
Sustainability 13 07700 g0a9
Sustainability 13 07700 g0a10
Sustainability 13 07700 g0a11
Sustainability 13 07700 g0a12

References

  1. Sohrabi, C.; Alsafi, Z.; O’Neill, N.; Khan, M.; Kerwan, A.; Al-Jabir, A.; Iosifidis, C.; Agha, R. World Health Organization Declares Global Emergency: A Review of the 2019 Novel Coronavirus (COVID-19). Int. J. Surg. 2020, 71–76. [Google Scholar] [CrossRef]
  2. WHO. Pneumonia of Unknown Cause. 2020. Available online: www.Who.Int/Csr/Don/05-January-2020-Pneumonia-of-Unkown-Cause-China/ (accessed on 12 April 2021).
  3. WHO. Coronavirus disease (COVID-19). Weekly Epidemilogical Update and Weekly Operational Update. Available online: https://www.who.int/emergencies/diseases/novel-coronavirus-2019/situation-reports (accessed on 11 October 2020).
  4. WHO. WHO Director-General’s Opening Remarks at the Media Briefing on COVID-19—11 March 2020. Available online: https://www.who.int/dg/speeches/detail/who-director-general-s-opening-remarks-at-the-media-briefing-on-covid-19---11-march-2020 (accessed on 11 October 2020).
  5. Gobierno de España. Real Decreto 463/2020, de 14 de Marzo, Por El Que Se Declara El Estado de Alarma Para La Gestión de La Situación de Crisis Sanitaria Ocasionada Por El COVID-19. 2020. Available online: https://www.boe.es/buscar/act.php?id=BOE-A-2020-3692 (accessed on 11 September 2020).
  6. Vestergaard, L.S.; Nielsen, J.; Richter, L.; Schmid, D.; Bustos, N.; Braeye, T.; Denissov, G.; Veideman, T.; Luomala, O.; Möttönen, T.; et al. Excess All-Cause Mortality during the COVID-19 Pandemic in Europe—Preliminary Pooled Estimates from the EuroMOMO Network, March to April 2020. Eurosurveillance 2020, 25, 2001214. [Google Scholar] [CrossRef]
  7. World Health Organization. Strategic Preparedness and Response Plan for the Novel Coronavirus. 2020. Available online: https://www.who.int/publications/i/item/strategic-preparedness-and-response-plan-for-the-new-coronavirus (accessed on 4 November 2020).
  8. Palomino, J.C.; Rodríguez, J.G.; Sebastian, R. Wage Inequality and Poverty Effects of Lockdown and Social Distancing in Europe. Eur. Econ. Rev. 2020, 129. [Google Scholar] [CrossRef] [PubMed]
  9. de España, G. Plan para la Transición Hacia una Nueva Normalidad. Available online: https://www.lamoncloa.gob.es/consejodeministros/resumenes/Documents/2020/PlanTransicionNuevaNormalidad.pdf (accessed on 12 April 2021).
  10. de España, G. Resumen Real Decreto Ley Coronavirus, 21/2020, de 9 de junio: Nueva Normalidad. Plazos Registrales. Notarios y Registradores|Notarios y Registradores. Available online: https://www.notariosyregistradores.com/web/normas/concretas/resumen-real-decreto-ley-coronavirus-21-2020-de-9-de-junio-nueva-normalidad-plazos-registrales/ (accessed on 11 October 2020).
  11. Romero, E.; López-Romero, L.; Domínguez-Álvarez, B.; Villar, P.; Gómez-Fraguela, J.A. Testing the Effects of COVID-19 Confinement in Spanish Children: The Role of Parents’ Distress, Emotional Problems and Specific Parenting. Int. J. Environ. Res. Public Health 2020, 17, 6975. [Google Scholar] [CrossRef]
  12. Cuerdo-Vilches, T.; Navas-Martín, M.Á. Confined Students: A Visual-Emotional Analysis of Study and Rest Spaces in the Homes. Int. J. Environ. Res. Public Health 2021, 18, 5506. [Google Scholar] [CrossRef]
  13. Analytics, G.W. Work from Home Experience Survey Results. Available online: https://globalworkplaceanalytics.com/global-work-from-home-experience-survey (accessed on 6 April 2021).
  14. Sarah, K.; Oceane, S.; Emily, F.; Carole, F. Learning from Lockdown-Assessing the Positive and Negative Experiences, and Coping Strategies of Researchers during the COVID-19 Pandemic. Appl. Anim. Behav. Sci. 2021, 236. [Google Scholar] [CrossRef]
  15. Devine-Wright, P.; Pinto de Carvalho, L.; Di Masso, A.; Lewicka, M.; Manzo, L.; Williams, D.R. “Re-Placed”—Reconsidering Relationships with Place and Lessons from a Pandemic. J. Environ. Psychol. 2020, 72. [Google Scholar] [CrossRef]
  16. Cheshmehzangi, A. COVID-19 and Household Energy Implications: What Are the Main Impacts on Energy Use? Heliyon 2020, 6, e05202. [Google Scholar] [CrossRef]
  17. Eurofound Living, Working and COVID-19. In COVID-19 Series; Publications Office of the European Union: Luxembourg, 2020. [CrossRef]
  18. Cuerdo-Vilches, T.; Oteiza San José, I.; Navas-Martín, M.Á. Proyecto Sobre Confinamiento Social (covid-19), Vivienda y Habitabilidad [COVID-HAB]. Paraninfo Digital. Available online: https://ciberindex.com/index.php/pd/article/view/e32066o (accessed on 8 April 2021).
  19. Organización Mundial de la Salud. Directrices Sobre Vivienda y Salud; Departamento de Salud Pública, Medio Ambiente y Determinantes Sociales de la Salud: Geneva, Switzerland, 2018; Available online: https://apps.who.int/iris/bitstream/handle/10665/279743/WHO-CED-PHE-18.10-spa.pdf (accessed on 2 April 2021).
  20. Megahed, N.A.; Ghoneim, E.M. Antivirus-Built Environment: Lessons Learned from Covid-19 Pandemic. Sustain. Cities Soc. 2020, 61, 102350. [Google Scholar] [CrossRef] [PubMed]
  21. WHO. Household Air Pollution and Health; WHO Media Centre: Copenhagen, Denmark, 2014; pp. 3–7. [Google Scholar]
  22. Díaz, J.; Antonio-López-Bueno, J.; Culqui, D.; Asensio, C.; Sánchez-Martínez, G.; Linares, C. Does Exposure to Noise Pollution Influence the Incidence and Severity of COVID-19? Environ. Res. 2021, 195. [Google Scholar] [CrossRef] [PubMed]
  23. de España, G.; de Sanidad, M. Consumo y Bienestar Social—Organización Institucional. Available online: http://www.boe.es (accessed on 11 October 2020).
  24. Agency USA EPA. Indoor Air Quality. EPA’s Report on the Environment (ROE)|US EPA. Available online: https://www.epa.gov/report-environment/indoor-air-quality#note1 (accessed on 12 April 2021).
  25. ASHRAE. Standard 55–Thermal Environmental Conditions for Human Occupancy. Available online: https://www.ashrae.org/technical-resources/bookstore/standard-55-thermal-environmental-conditions-for-human-occupancy (accessed on 2 April 2021).
  26. AENOR-UNE. UNE-EN ISO 7730:2006 Ergonomía del Ambiente Térmico. Determina. Available online: https://www.une.org/encuentra-tu-norma/busca-tu-norma/norma?c=N0037517 (accessed on 2 April 2021).
  27. Lourenço, P.; Pinheiro, M.D.; Heitor, T. Light Use Patterns in Portuguese School Buildings: User Comfort Perception, Behaviour and Impacts on Energy Consumption. J. Clean. Prod. 2019, 228, 990–1010. [Google Scholar] [CrossRef]
  28. Muñoz-González, C.; Ruiz-Jaramillo, J.; Cuerdo-Vilches, T.; Joyanes-Díaz, M.D.; Montiel Vega, L.; Cano-Martos, V.; Navas-Martín, M.Á. Natural Lighting in Historic Houses during Times of Pandemic. The Case of Housing in the Mediterranean Climate. Int. J. Environ. Res. Public Health 2021, 18, 7264. [Google Scholar] [CrossRef]
  29. Diaz Lozano Patino, E.; Siegel, J.A. Indoor Environmental Quality in Social Housing: A Literature Review. In Building and Environment; Elsevier Ltd.: Amsterdam, The Netherlands, 2018; pp. 231–241. [Google Scholar] [CrossRef]
  30. Ortiz, M.; Itard, L.; Bluyssen, P.M. Indoor Environmental Quality Related Risk Factors with Energy-Efficient Retrofitting of Housing: A Literature Review. Energy Build. 2020, 110102. [Google Scholar] [CrossRef]
  31. D’Alessandro, D.; Gola, M.; Appolloni, L.; Dettori, M.; Fara, G.M.; Rebecchi, A.; Settimo, G.; Capolongo, S. COVID-19 and Living Space Challenge. Well-Being and Public Health Recommendations for a Healthy, Safe, and Sustainable Housing. Acta Biomed. 2020, 91, 61–75. [Google Scholar] [CrossRef] [PubMed]
  32. Azizi, A.; Achak, D.; Aboudi, K.; Saad, E.; Nejjari, C.; Nouira, Y.; Hilali, A.; Youlyouz-Marfak, I.; Marfak, A. Health-Related Quality of Life and Behavior-Related Lifestyle Changes Due to the COVID-19 Home Confinement: Dataset from a Moroccan Sample. Data Br. 2020, 32, 106239. [Google Scholar] [CrossRef]
  33. Amerio, A.; Brambilla, A.; Morganti, A.; Aguglia, A.; Bianchi, D.; Santi, F.; Costantini, L.; Odone, A.; Costanza, A.; Signorelli, C.; et al. Covid-19 Lockdown: Housing Built Environment’s Effects on Mental Health. Int. J. Environ. Res. Public Health 2020, 17, 5973. [Google Scholar] [CrossRef]
  34. Alonso, C.; Fernando Martín-Consuegra, F.; Oteiza, I.; de Frutos, F.; Fernández-Agüera, J.; Domínguez, S.; Cuerdo-Vilches, T.; Frutos, B. HABITA-RES Nueva Herramienta Integrada de Evaluación Para Áreas Urbanas Vulnerables. Hacia La Autosuficiencia Energética y a Favor de Un Modelo de Habitabilidad Biosaludable; Fundación CONAMA: Madrid. 2020. Available online: http://www.conama11.vsf.es/conama10/download/files/conama2020/CT2020/5429.pdf (accessed on 4 July 2021).
  35. Madurai Elavarasan, R.; Shafiullah, G.M.; Raju, K.; Mudgal, V.; Arif, M.T.; Jamal, T.; Subramanian, S.; Sriraja Balaguru, V.S.; Reddy, K.S.; Subramaniam, U. COVID-19: Impact Analysis and Recommendations for Power Sector Operation. Appl. Energy 2020, 279. [Google Scholar] [CrossRef] [PubMed]
  36. Mofijur, M.; Fattah, I.M.R.; Alam, M.A.; Islam, A.B.M.S.; Ong, H.C.; Rahman, S.M.A.; Najafi, G.; Ahmed, S.F.; Uddin, M.A.; Mahlia, T.M.I. Impact of COVID-19 on the Social, Economic, Environmental and Energy Domains: Lessons Learnt from a Global Pandemic. In Sustainable Production and Consumption; Elsevier B.V: Amsterdam, The Netherlands, 2021; pp. 343–359. [Google Scholar] [CrossRef]
  37. Abu-Rayash, A.; Dincer, I. Analysis of the Electricity Demand Trends amidst the COVID-19 Coronavirus Pandemic; Elsevier Ltd.: Amsterdam, The Netherlands, 2020. [Google Scholar] [CrossRef]
  38. Kanitkar, T. The COVID-19 Lockdown in India: Impacts on the Economy and the Power Sector. Glob. Transitions 2020, 2, 150–156. [Google Scholar] [CrossRef]
  39. Krarti, M.; Aldubyan, M. Review Analysis of COVID-19 Impact on Electricity Demand for Residential Buildings. In Renewable and Sustainable Energy Reviews; Elsevier Ltd: Amsterdam, The Netherlands, 2021; p. 110888. [Google Scholar] [CrossRef]
  40. Ba, M. Towards a Measure of Multidimensional Poverty in COVID-19 Time in Senegal: Identification of Risk Factors and Vulnerable People. Open J. Soc. Sci. 2020, 8, 267–285. [Google Scholar] [CrossRef]
  41. Boateng, G.O.; Phipps, L.M.; Smith, L.E.; Armah, F.A. Household Energy Insecurity and COVID-19 Have Independent and Synergistic Health Effects on Vulnerable Populations. Front. Public Health 2021, 8, 609608. [Google Scholar] [CrossRef] [PubMed]
  42. Anser, M.K.; Yousaf, Z.; Khan, M.A.; Nassani, A.A.; Alotaibi, S.M.; Qazi Abro, M.M.; Vo, X.V.; Zaman, K. Does Communicable Diseases (Including COVID-19) May Increase Global Poverty Risk? A Cloud on the Horizon. Environ. Res. 2020, 187, 109668. [Google Scholar] [CrossRef]
  43. Carrere, J.; Peralta, A.; Oliveras, L.; López, M.J.; Marí-Dell’Olmo, M.; Benach, J.; Novoa, A.M. Energy Poverty, Its Intensity and Health in Vulnerable Populations in a Southern European City. Gac. Sanit. 2020. [Google Scholar] [CrossRef]
  44. Mohan, G. The Impact of Household Energy Poverty on the Mental Health of Parents of Young Children. J. Public Health 2021. [Google Scholar] [CrossRef]
  45. Sumner, A.; Ortiz-Juarez, E.; Hoy, C. Precarity and the Pandemic: COVID-19 and Poverty Incidence, Intensity, and Severity in Developing Countries; WIDER Working Paper; UNU-WIDER: Helsinki, Finland, 2020; Volume 2020. [Google Scholar] [CrossRef]
  46. Suryahadi, A.; Al Izzati, R.; Suryadarma, D. Estimating the Impact of Covid-19 on Poverty in Indonesia. Bull. Indones. Econ. Stud. 2020, 56, 175–192. [Google Scholar] [CrossRef]
  47. Ashford, N.A.; Hall, R.P.; Arango-Quiroga, J.; Metaxas, K.A.; Showalter, A.L. Addressing Inequality: The First Step beyond COVID-19 and towards Sustainability. Sustainability 2020, 12, 5404. [Google Scholar] [CrossRef]
  48. Memmott, T.; Carley, S.; Graff, M.; Konisky, D.M. Sociodemographic Disparities in Energy Insecurity among Low-Income Households before and during the COVID-19 Pandemic. Nat. Energy 2021, 6, 186–193. [Google Scholar] [CrossRef]
  49. Wang, Q.; Wang, S. Preventing Carbon Emission Retaliatory Rebound Post-COVID-19 Requires Expanding Free Trade and Improving Energy Efficiency. Sci. Total Environ. 2020, 746. [Google Scholar] [CrossRef]
  50. Shupler, M.; Mwitari, J.; Gohole, A.; Anderson de Cuevas, R.; Puzzolo, E.; Čukić, I.; Nix, E.; Pope, D. COVID-19 Impacts on Household Energy & Food Security in a Kenyan Informal Settlement: The Need for Integrated Approaches to the SDGs. Renew. Sustain. Energy Rev. 2021, 144, 111018. [Google Scholar] [CrossRef]
  51. Yan, L.; Li, J.; Liu, M.; Hu, M.; Xu, Z.; Xue, K. Heating Behavior Using Household Air-Conditioners during the COVID-19 Lockdown in Wuhan: An Exploratory and Comparative Study. Build. Environ. 2021, 195, 107731. [Google Scholar] [CrossRef] [PubMed]
  52. Oliveira Panão, M.J.N. Lessons Learnt from Using Energy Poverty Expenditure-Based Indicators in a Mild Winter Climate. Energy Build. 2021, 242, 110936. [Google Scholar] [CrossRef]
  53. Santiago, I.; Moreno-Munoz, A.; Quintero-Jiménez, P.; Garcia-Torres, F.; Gonzalez-Redondo, M.J. Electricity Demand during Pandemic Times: The Case of the COVID-19 in Spain. Energy Policy 2021, 148. [Google Scholar] [CrossRef]
  54. EURACTIV. COVID-19 Means Tackling Energy Poverty Is More Urgent Than Ever p. Available online: https://www.euractiv.com/section/energy/opinion/covid-19-means-tackling-energy-poverty-is-more-urgent-than-ever/ (accessed on 27 April 2021).
  55. Ramos, J.; Gómez, A. El COVID-19 Agrava las Diferencias Entre Hombres y Mujeres en la Conciliación de la vida Familiar y Laboral—Web Ivie. Available online: https://www.ivie.es/es_ES/covid-19-agrava-las-diferencias-hombres-mujeres-la-conciliacion-la-vida-familiar-laboral/ (accessed on 6 April 2021).
  56. Rietveld, P. Telework and the Transition to Lower Energy Use in Transport: On the Relevance of Rebound Effects. Environ. Innov. Soc. Transit. 2011, 1, 146–151. [Google Scholar] [CrossRef]
  57. Cuerdo-Vilches, T.; Navas-Martín, M.Á.; Oteiza, I. Working from Home: Is Our Housing Ready? Int. J. Environ. Res. Public Health 2021, 18, 7329. [Google Scholar] [CrossRef]
  58. Melo, P.C.; de Abreu e Silva, J. Home Telework and Household Commuting Patterns in Great Britain. Transp. Res. Part A Policy Pract. 2017, 103, 1–24. [Google Scholar] [CrossRef]
  59. Lyu, Y.; Forsyth, A. Attitudes, Perceptions, and Walking Behavior in a Chinese City. J. Transp. Health 2021, 21. [Google Scholar] [CrossRef]
  60. Maas, S.; Nikolaou, P.; Attard, M.; Dimitriou, L. Classifying Bicycle Sharing System Use in Southern European Island Cities: Cycling for Transport or Leisure? In Transportation Research Procedia; Elsevier B.V.: Amsterdam, The Netherlands, 2021; Volume 52, pp. 565–572. [Google Scholar] [CrossRef]
  61. Cook, S. Geographies of Run-Commuting in the UK. J. Transp. Geogr. 2021, 92, 103038. [Google Scholar] [CrossRef]
  62. Elldér, E. Telework and Daily Travel: New Evidence from Sweden. J. Transp. Geogr. 2020, 86. [Google Scholar] [CrossRef]
  63. Giovanis, E. The Relationship between Teleworking, Traffic and Air Pollution. Atmos. Pollut. Res. 2018, 9, 1–14. [Google Scholar] [CrossRef] [Green Version]
  64. Gautam, S. The Influence of COVID-19 on Air Quality in India: A Boon or Inutile. Bull. Environ. Contam. Toxicol. 2020, 104, 724–726. [Google Scholar] [CrossRef]
  65. Gupta, A.; Bherwani, H.; Gautam, S.; Anjum, S.; Musugu, K.; Kumar, N.; Anshul, A.; Kumar, R. Air Pollution Aggravating COVID-19 Lethality? Exploration in Asian Cities Using Statistical Models. Environ. Dev. Sustain. 2021, 23, 6408–6417. [Google Scholar] [CrossRef]
  66. Poirier, B.; Guyot, G.; Geoffroy, H.; Woloszyn, M.; Ondarts, M.; Gonze, E. Pollutants Emission Scenarios for Residential Ventilation Performance Assessment. A Review. J. Build. Eng. 2021, 42, 102488. [Google Scholar] [CrossRef]
  67. Ruiz-Frutos, C.; Ortega-Moreno, M.; Allande-Cussó, R.; Domínguez-Salas, S.; Dias, A.; Gómez-Salgado, J. Health-Related Factors of Psychological Distress during the COVID-19 Pandemic among Non-Health Workers in Spain. Saf. Sci. 2021, 133, 104996. [Google Scholar] [CrossRef] [PubMed]
  68. Whitehead, B.R.; Torossian, E. Older Adults’ Experience of the COVID-19 Pandemic:A Mixed-Methods Analysis of Stresses and Joys. Gerontologist 2021, 61, 36–47. [Google Scholar] [CrossRef]
  69. Widera, B. Comparative Analysis of User Comfort and Thermal Performance of Six Types of Vernacular Dwellings as the First Step towards Climate Resilient, Sustainable and Bioclimatic Architecture in Western Sub-Saharan Africa. Renew. Sustain. Energy Rev. 2021, 140, 110736. [Google Scholar] [CrossRef]
  70. Morawska, L.; Tang, J.W.; Bahnfleth, W.; Bluyssen, P.M.; Boerstra, A.; Buonanno, G.; Cao, J.; Dancer, S.; Floto, A.; Franchimon, F.; et al. How Can Airborne Transmission of COVID-19 Indoors Be Minimised? Environ. Int. 2020, 142, 105832. [Google Scholar] [CrossRef] [PubMed]
  71. Møller, E.B.; De Place Hansen, E.J. Moisture Supply in Danish Single-Family Houses-The Influence of Occupant Behavior and Type of Room. In Energy Procedia; Elsevier Ltd.: Amsterdam, The Netherlands, 2017; Volume 132, pp. 141–146. [Google Scholar] [CrossRef]
  72. Cuerdo-Vilches, T.; Navas-Martín, M.Á.; Oteiza, I. Behavior Patterns, Energy Consumption and Comfort during COVID-19 Lockdown Related to Home Features, Socioeconomic Factors and Energy Poverty in Madrid. Sustainability 2021, 13, 5949. [Google Scholar] [CrossRef]
  73. Fell, M.J.; Pagel, L.; Chen, C.F.; Goldberg, M.H.; Herberz, M.; Huebner, G.M.; Sareen, S.; Hahnel, U.J.J. Validity of Energy Social Research during and after COVID-19: Challenges, Considerations, and Responses. Energy Res. Soc. Sci. 2020, 68, 101646. [Google Scholar] [CrossRef]
  74. Yan, D.; Hong, T.; Dong, B.; Mahdavi, A.; D’Oca, S.; Gaetani, I.; Feng, X. IEA EBC Annex 66: Definition and Simulation of Occupant Behavior in Buildings. Energy Build. 2017, 156, 258–270. [Google Scholar] [CrossRef] [Green Version]
  75. Cuerda, E.; Guerra-Santin, O.; Neila González, F.J. Defining Occupancy Patterns through Monitoring Existing Buildings. Inf. Constr. 2017, 69, 1–10. [Google Scholar] [CrossRef] [Green Version]
  76. Sede Electrónica del Catastro—Inicio. Available online: http://www.sedecatastro.gob.es/ (accessed on 4 May 2021).
  77. de España, G. Estrategia a Largo Plazo para la Rehabilitación Energética en el Sector de la Edificación en España en Desarrollo del Artículo 4 de la Directiva 2012/27/UE. Available online: https://www.mitma.gob.es/el-ministerio/planes-estrategicos/estrategia-a-largo-plazo-para-la-rehabilitacion-energetica-en-el-sector-de-la-edificacion-en-espana (accessed on 12 October 2020).
  78. Cuerdo-Vilches, T.; Navas-Martín, M.Á.; Oteiza, I. A Mixed Approach on Resilience of Spanish Dwellings and Households during COVID-19 Lockdown. Sustainability 2020, 12, 10198. [Google Scholar] [CrossRef]
  79. Guerra-Santin, O.; Romero Herrera, N.; Cuerda, E.; Keyson, D. Mixed Methods Approach to Determine Occupants’ Behaviour –Analysis of Two Case Studies. Energy Build. 2016, 130, 546–566. [Google Scholar] [CrossRef]
  80. Romero Herrera, N. In-Situ and Mixed-Design Interventions. In Living Labs: Design and Assessment of Sustainable Living; Springer International Publishing: Berlin/Heidelberg, Germany, 2016; pp. 157–167. [Google Scholar] [CrossRef]
  81. Yu, C.H. Book Review: Creswell, J., & Plano Clark, V. Designing and Conducting Mixed Methods Research. Thousand Oaks, CA: Sage. Organ. Res. Methods 2009, 12, 801–804. [Google Scholar] [CrossRef]
  82. Corbetta, P. Metodología y Técnicas de Investigación Social. Available online: https://diversidadlocal.files.wordpress.com/2012/09/metodologc3ada-y-tc3a9cnicas-de-investigacic3b3n-social-piergiorgio-corbetta.pdf (accessed on 10 May 2021).
  83. Djamba, Y.K.; Neuman, W.L. Social Research Methods: Qualitative and Quantitative Approaches. Teach. Sociol. 2002, 30, 380. [Google Scholar] [CrossRef]
  84. Cuerdo-Vilches, T. User Participation in Energy Management of Buildings: Application of Photovoice Method in Workplaces (Spanish); University of Seville: Seville, Spain, 2017. [Google Scholar]
  85. Cisterna Cabrera, F. Categorización y triangulación como procesos de validación del conocimiento en investigación cualitativa. Theoria 2005, 14, 61–71. Available online: https://www.redalyc.org/articulo.oa?id=29900107 (accessed on 4 May 2021).
  86. Alonso, C.; Oteiza, I.; Martín-Consuegra, F.; Frutos, B. Methodological Proposal for Monitoring Energy Refurbishment. Indoor Environmental Quality in Two Case Studies of Social Housing in Madrid, Spain. Energy Build. 2017, 155, 492–502. [Google Scholar] [CrossRef]
  87. Matas, A. Diseño Del Formato de Escalas Tipo Likert: Un Estado de La Cuestión. Rev. Electron. Investig. Educ. 2018, 20, 38–47. [Google Scholar] [CrossRef]
  88. Stechome Tecnología para la Eficiencia Energética. Available online: https://www.stechome.es/ (accessed on 25 June 2021).
  89. Anaconda Documentation—Anaconda Documentation. Available online: https://docs.anaconda.com/ (accessed on 4 May 2021).
  90. Givoni, B. Comfort, Climate Analysis and Building Design Guidelines. Energy Build. 1992, 18, 11–23. [Google Scholar] [CrossRef]
  91. Dovjak, M.; Slobodnik, J.; Krainer, A. Consequences of Energy Renovation on Indoor Air Quality in Kindergartens. Build. Simul. 2020, 13, 691–708. [Google Scholar] [CrossRef]
  92. Korsavi, S.S.; Montazami, A.; Mumovic, D. Indoor Air Quality (IAQ) in Naturally-Ventilated Primary Schools in the UK: Occupant-Related Factors. Build. Environ. 2020, 180, 106992. [Google Scholar] [CrossRef]
  93. Liang, W.; Zhao, B.; Liu, J.; Pei, J. Can Carbon Dioxide Be a Good Indicator for Formaldehyde in Residences?—Monte Carlo Modeling for a Whole Year. Sci. Technol. Built Environ. 2020, 26, 749–762. [Google Scholar] [CrossRef]
  94. Domínguez-Amarillo, S.; Fernández-Agüera, J.; Cesteros-García, S.; González-Lezcano, R.A. Bad Air Can Also Kill: Residential Indoor Air Quality and Pollutant Exposure Risk during the COVID-19 Crisis. Int. J. Environ. Res. Public Health 2020, 17, 7183. [Google Scholar] [CrossRef]
  95. Carratt, A.; Kokogiannakis, G.; Daly, D. A Critical Review of Methods for the Performance Evaluation of Passive Thermal Retrofits in Residential Buildings. J. Clean. Prod. 2020, 263, 121408. [Google Scholar] [CrossRef]
  96. de España, G.; de Fomento, M. Código Técnico de Edificación: Documento Básico HS Salubridad. 2019. Available online: https://www.codigotecnico.org/pdf/Documentos/HS/DBHS.pdf (accessed on 10 May 2021).
  97. OpenStudio. OpenStudio. Available online: https://www.openstudio.net/ (accessed on 4 May 2021).
  98. Ruiz Olabuénaga, J.I. Teoría y Práctica de la Investigación Cualitativa. Available online: https://dialnet.unirioja.es/servlet/libro?codigo=593668 (accessed on 10 May 2021).
  99. Benavides, M.O.; Gómez-Restrepo, C. Métodos En Investigación Cualitativa: Triangulación. Rev. Colomb. Psiquiatr. 2005, 34, 118–124. Available online: http://www.scielo.org.co/scielo.php?script=sci_arttext&pid=s0034-74502005000100008 (accessed on 10 May 2021).
  100. Sun, C.; Zhang, R.; Sharples, S.; Han, Y.; Zhang, H. A Longitudinal Study of Summertime Occupant Behaviour and Thermal Comfort in Office Buildings in Northern China. Build. Environ. 2018, 143, 404–420. [Google Scholar] [CrossRef]
  101. Fernández-Agüera, J.; Domínguez-Amarillo, S.; Alonso, C.; Martín-Consuegra, F. Thermal Comfort and Indoor Air Quality in Low-Income Housing in Spain: The Influence of Airtightness and Occupant Behaviour. Energy Build. 2019, 199, 102–114. [Google Scholar] [CrossRef]
  102. Martin-Consuegra, F.; Pedro Gouveia, J.; de Frutos, F.; Alonso, C.; Oteiza, I. Energy Consumption and Comfort Gap in Social Housing in Madrid, through Smart Meters and Surveys Information. In Proceedings of the 10th European Conference on Energy Efficiency and Sustainability in Architecture and Planning—3rd International Congress on Advanced Construction, Vitoria-Gasteiz, Spain, 11–12 September 2019. [Google Scholar]
  103. Hormigos-Jimenez, S.; Padilla-Marcos, M.Á.; Meiss, A.; Gonzalez-Lezcano, R.A.; Feijó-Muñoz, J. Ventilation Rate Determination Method for Residential Buildings According to TVOC Emissions from Building Materials. Build. Environ. 2017, 123, 555–563. [Google Scholar] [CrossRef]
  104. European Regional Development Fund-Regional Policy-European Commission. Available online: https://ec.europa.eu/regional_policy/en/funding/erdf/ (accessed on 25 June 2021).
  105. Amalia, B.; Fu, M.; Tigova, O.; Ballbè, M.; Castellano, Y.; Semple, S.; Clancy, L.; Vardavas, C.; López, M.J.; Cortés, N.; et al. Environmental and Individual Exposure to Secondhand Aerosol of Electronic Cigarettes in Confined Spaces: Results from the TackSHS Project. Indoor Air 2021. [Google Scholar] [CrossRef]
  106. Frutos, B.; Martín-Consuegra, F.; Alonso, C.; de Frutos, F.; Sánchez, V.; García-Talavera, M. Geolocation of Premises Subject to Radon Risk: Methodological Proposal and Case Study in Madrid. Environ. Pollut. 2019, 247, 556–563. [Google Scholar] [CrossRef] [PubMed]
  107. Frutos, B.; Martín-Consuegra, F.; Alonso, C.; Perez, G.; Peón, J.; Ruano-Ravina, A.; Barros, J.M.; Santorun, A.M. Inner Wall Filler as a Singular and Significant Source of Indoor Radon Pollution in Heritage Buildings: An Exhalation Method-Based Approach. Build. Environ. 2021, 201, 108005. [Google Scholar] [CrossRef]
  108. Niculita-Hirzel, H.; Yang, S.; Jörin, C.H.; Perret, V.; Licina, D.; Pernot, J.G. Fungal Contaminants in Energy Efficient Dwellings: Impact of Ventilation Type and Level of Urbanization. Int. J. Environ. Res. Public Health 2020, 17, 4936. [Google Scholar] [CrossRef]
  109. Pérez-Fargallo, A.; Pulido-Arcas, J.A.; Rubio-Bellido, C.; Trebilcock, M.; Piderit, B.; Attia, S. Development of a New Adaptive Comfort Model for Low Income Housing in the Central-South of Chile. Energy Build. 2018, 178, 94–106. [Google Scholar] [CrossRef] [Green Version]
  110. Awada, M.; Becerik-Gerber, B.; Hoque, S.; O’Neill, Z.; Pedrielli, G.; Wen, J.; Wu, T. Ten Questions Concerning Occupant Health in Buildings during Normal Operations and Extreme Events Including the COVID-19 Pandemic. Build. Environ. 2021, 188. [Google Scholar] [CrossRef]
  111. European Investment Bank. 2020-2021 EIB Climate Survey, Part 3 of 3. Available online: https://www.eib.org/en/surveys/climate-survey/3rd-climate-survey/best-ways-to-fight-climate-change.htm# (accessed on 2 April 2021).
  112. Malik, J.; Bardhan, R.; Hong, T.; Piette, M.A. Contextualising Adaptive Comfort Behaviour within Low-Income Housing of Mumbai, India. Build. Environ. 2020, 177. [Google Scholar] [CrossRef]
  113. Szulgowska-Zgrzywa, M.; Stefanowicz, E.; Piechurski, K.; Chmielewska, A.; Kowalczyk, M. Impact of Users’ Behavior and Real Weather Conditions on the Energy Consumption of Tenement Houses in Wroclaw, Poland: Energy Performance Gap Simulation Based on a Model Calibrated by Field Measurements. Energies 2020, 13, 6707. [Google Scholar] [CrossRef]
  114. Mastropietro, P.; Rodilla, P.; Batlle, C. Emergency Measures to Protect Energy Consumers during the Covid-19 Pandemic: A Global Review and Critical Analysis. Energy Res. Soc. Sci. 2020, 68, 101678. [Google Scholar] [CrossRef] [PubMed]
  115. Abellán García, A.; Aceituno Nieto, P.; Allende, A.; de Andrés, A.; Bartomeus, F.; Bastolla, U.; Benavides, J.; Cabal, B.; Castillo Belmonte, A.B.; Chica Lara, A.; et al. Una Visión Global de La Pandemia COVID-19: Qué Sabemos y Qué Estamos Investigando Desde El CSIC; Consejo Superior de Investigaciones Científicas: Madrid, Spain, 2021; Available online: http://libros.csic.es/product_info.php?products_id=1464&PHPSESSID=3dda41b3d63245c0beacfd68a00479e1 (accessed on 2 April 2021).
Figure 1. Case studies in six neighbourhoods on the outskirts of Madrid.
Sustainability 13 07700 g001
Figure 2. Mixed method flow chart.
Sustainability 13 07700 g002
Figure 3. Survey and monitoring data clusters.
Sustainability 13 07700 g003
Figure 4. Givoni charts by neighbourhoods. Sensor-logged data.
Sustainability 13 07700 g004
Table 1. General characteristics of dwellings studied.
Dwelling Characteristic
CategoryFactorCS1CS2CS3CS4CS5CS6CS7CS8CS9CS10CS11CS12Legend
Dwelling CharacteristicNeighbourhoodSan BlasSan BlasManoterasManoterasCarabanchelCarabanchelOrcasitasOrcasitasOrcasitasFuencarralFuencarralVillaverdeLocation in Madrid
Storey01/0302/0305/0505/0501/0606/0604/1009/1010/1004/0504/0501/02Storey/total storeys
Year const.196019601965196819651965198219821982196519651950Source: cadastre
General
upkeep
GGGDGGDDDDDDP: poor; D: deficient; G: good
Condition of windowsGGGGDGGDGGGPP: poor; D: deficient; G: good
Area (m2)110115707273117110110110919374Source: cadastre
TenancyOOOOOOOOOOOTO: owner; T: tenant
Building type1111222221111. Residential building.
2. Residential building compatible with other uses
Building typologySASASASABCBCSASASASASA SA: stand-alone
BC: block
Orientation-sun exposureE + WSunnySunnySunnyESunnyN + SSunnyN + SN + SN + SSunnySunny: entire dwelling receives sunlight at different times of day
E: east; W: west; S: south; N: north
Shady: presence of obstacles
Skirted byWSWSNSLNSLLLWSLLWAL: landscaping
WA: wide avenue
WS: wide street
NS: narrow street
DHWSystemIndividualIndividualIndividualIndividualIndividualIndividualIndividuaIndividualIndividualIndividualIndividualIndividual
Power sourceNGNGENGGasoil + EENGNGNGNGNGEE: electricity;
NG: natural gas
HEATINGSystemIndividualIndividualIndividualIndividualCommunalCommunalIndividualIndividualIndividualIndividualIndividualIndividualIndividual/Communal
Power sourceNGNG NGGasoilGasoilNGNGNGNGNG NG: Gas Natural; Gasoil.
Facility/systemHP HP + EF HP EFHP: heat pump;
EF: electrical facility
Table 2. COVID-HABITA_RES survey categories and variables.
CategoryVariables
Household characteristicsFamily members: minors (<18); seniors (>65); occupation density; rise in occupation density
HabitsHousehold tasks; remote working; outings; altered habits
Power-consuming facilitiesHousehold appliances and comparative use; digital hardware and comparative use; domestic hot water; source of power and comparative use; heating, type of system and use during lockdown
Indoor environmental qualityNatural lighting; air quality; acoustic comfort; frequency of window opening and comparative practice; frequency of use of shading devices; existence of spaces open to outdoors
Comfort and adaptationApparel-based adaptation; type of adaptation to dissatisfaction with heating; perceived thermal comfort; preferred range of temperatures
Energy savings strategies and use of renewablesSavings strategies, use of renewable energy
Table 3. Sensors. Technical specifications.
Sensor Model-TypeParameterRangeAccuracy
Froggit WH3000Temperature—humidityTemperature−40–60 °C+/− 1 °C
Temperature—humidityRelative humidity10–99%+/− 5%
PrecipitationPrecipitation0–6000 mm+/− 10%
Wind speedWind speed0–50 m/s (0~100 mph)+/− 1 m/s (wind speed < 5 m/s) +/10% (wind speed > 5 m/s)
UV/LUXLight0–200 kLux+/− 15%
AirsenseTemperature—humidityTemperature5–50 °C+/− 0.4 °C
Temperature—humidityRelative humidity0–80%+/− 4%
Carbon dioxide CO2)CO2 +/− 50 ppm, +/− 3% of reading
PowersenseElectricity consumption and generationConsumption<80 A, 20 W–20 kW-
PlugsenseOutlet consumptionConsumption<13 A-
RelaysenseGas consumptionConsumption>10 ms pulse interval-
Table 4. Indoor environmental quality, power-consuming facilities and use of heat during lockdown (survey data).
Indoor Environmental Quality, Power Facilities and Heat Use in Dwellings
CategoryFactorCS1CS2CS3CS4CS5CS6CS7CS8CS9CS10CS11CS12Legend
Indoor Environ-Mental QualityNatural lighting2232243334221: None/scantly adequate;
2: Adequate;
3: Highly adequate;
4: Wholly adequate
Air quality3343244334111: Poor;
2: Mediocre;
3: Good;
4: Very good
Acoustic insulation2242131123211: No/insuff. ins.
2: Sufficiently ins.
3: Well ins.
4: Wholly insulated
Windows3 (4)3 (4)3 (3)4 (4)3 (4)3 (3)3 (3)4 (4)4 (4)4 (4)3 (3)4 (4)1: Closed/Unused Open/in use;
2: A few times/week
3: Once daily
4: Several times/day
5: Open/in use
Shading devices3 (5)4 (4)5 (5)5 (5)4 (4)3 (3)4 (4)4 (4)4 (4)3 (3)4 (3)4 (4)
Spaces open to outdoorsNoYes
OUB
NoNoYes
RC
Yes
ORB
Yes
CB
Yes
CB
NoYes
ORB
NoNoORB.: Open roofed balcony
OUB.: Open unroofed balcony
CB: Closed balcony
RC: Rear courtyard
Kitchen AppliancesHobEGC (=)EGC (=)EGC (+)EGC (=)EGC (=)EI (=)NG (=)EGC (+)E. V (=)EI (+)EGC (=)EI (=)EGC: Electric, glass ceramic
EI.: Electric, induction
NG: Natural gas
(+): greater use;
(=): same use;
(−): less use during lockdown
Oven+=+=+==+=++=
Clothes washer====+=+=
Dishwasher==+=+==+=+ =
Other appliances (> use during lockdown) F
D
F
D
KR
RV
RVKR
RV
F: Freezer;
D: Dryer;
KR: Kitchen robot;
RV: Robot vacuum
Digital And Internet FacilitiesInternetADSL or similarADSL or similarADSL +mobileADSL or similarADSL or similarADSL or similarADSL or similarADSL or similarADSL + mobileADSL or similarADSL or similarADSL or similar
Mobile devices+++++=++++++(+): greater use;
(=): same use;
(−): less use during confinement
Computer++++=++++++=
DHWUse during lockdown+==+==+===
HeatingUse during lockdownAs necessaryAs necessaryNeverAs necessaryContinuallyQuite a lotQuite a lotAs necessaryAs necessaryAlmost neverNeverAlmost never
SavingsStrategy2-2003060 60(10 strategies were suggested)
Table 5. Dwelling use and occupation, comfort, income and power expenditure, vulnerability and habits during lockdown (survey data).
Use and Occupation, Comfort, Energy Expense/Income and Vulnerability Parameters
CategoryVariableCS1CS2CS3CS4CS5CS6CS7CS8CS9CS10CS11CS12LEGEND
Household CharacteristicsNo. members5 (5)2 (2)1 (1)2 (2)3 (3)3 (3)3 (3)4 (4)5 (5)4 (4)2 (2)4 (3)
No. <183 11 321
No. >65 1 1
Occupation density4.551.741.432.784.122.562.783.644.554.442.155.41
Incr. occ. dens.29.17%14.58%54.16%37.50%29.17%30.56%34.72%35.42%25.00%33.33%14.58%11.11%
Comfort and AcclimationThermal comfort level2331333223411: Cool;
2: Slightly cool;
3: Neutral;
4: Slightly warm
Apparel1223222222121: Scant;
2: Normal;
3: Warm
AdaptationWindowsApparelApparelHeatingWindowsApparelApparelWindowsApparelWindowsApparelApparel
Income- Power ExpenditureUsual power expend.10–15%5–10%NS/NC10–15%10–15%5–10%10–15%10–15%5–10%NS/NC5–10%10–15%
Power expend. in lockdown>15% >15%5–10%10–15%>15%10–15% 5–10%10–15%
Unbilled power expend. ScantQuite a lotScant Quite a lot
Fuel VulnerabilityVulnerability during pandemicNoNoNoNoNoNoNoYesNoNoYesNo
Aid Applied for Received
HabitsRemote working?-1011+1+1+1+1-0-
Primary activityCTVH
L
S
RW
H
C
TV
R
C
RWRWL
RW
H
C
C
H
RW
H
C
TV
H
C
TV
H
C: Care;
TV: Television;
H: Housework;
L: Leisure;
S: Sport;
RW: Remote working;
R: Rest
Employment statusChronically ill SelfRetired
Frequency of outingsNCNOTDCTOCTOCTCNTDCNN: Never;
AN: Almost never;
O: Occasionally;
AD: Almost daily;
D: daily.
Habits most intensely alteredW
S
SR
W
S
S/B
L
SR
M
L
EL
SR
W
CC
SM
S/B
SR
L
DR
S
FS
SR
W
SR
W
CC
CL
OH
S
FS
SR
W
CR
E
S
L
SP
SR
W
CC
CL
OH
E
L
SP
FS
SB
SR
L
SP
SR
CR
S
L
SP
FS
SR
W: Work;
S: Sleep;
SR: Social relations;
S/B: Shower/bath;
L: Leisure;
CC: Childcare;
FS: Free space;
SM: Smoking;
CL: Cleaning;
OH: Other housework;
SP: Sport;
DR: Dressing;
E: Eating
Table 6. Weather and power consumption (sensor-logged data).
Sensor-Logged Data
CategoryVariableCS1CS2CS3CS4CS5CS6CS7CS8CS9CS10CS11CS12
OutdoorWeather stationICONIL1ICONIL1IMADRI16IMADRI16IMADRID279IMADRID279IMADRID279IMADRID279IMADRID279IMFUENCA11IMFUENCA11IMVILLAV10
HDD before363637373030303030363634
HDD during464648484141414141474742
Mean T before13.6613.6612.1912.1914.1314.1314.1314.1314.1313.6413.6414.15
Mean T during11.7111.7111.3711.3711.9911.9911.9911.9911.9911.6411.6412.54
Max T before24.3324.3324.3924.3925.5625.5625.5625.5625.5624.4224.4225.17
Max T during22.1422.1422.6422.6421.0621.0621.0621.0621.0622.5822.5822.64
Min T before3.223.221.501.502.942.942.942.942.943.083.083.33
Min T during4.144.143.723.724.834.834.834.834.834.284.284.61
% comf. h before14%14%8%8%17%17%17%17%17%15%15%16%
% comf. h during3%3%3%3%1%1%1%1%1%3%3%5%
Power
Consumption
Power cons. (kWh) before99.2934.8945.8456.7260.39N/D51.0240.7753.7667.6833.70131.28
Power cons. (kWh) during116.9833.5465.6957.3369.87N/D49.0148.1373.1785.7935.08132.79
Incr. pwr cons.17.82%−3.87%43.30%1.08%15.70%N/D−3.94%18.05%36.10%26.76%4.09%1.15%
Linear reg.: elec. pwr cons. vs. HDD before0.860.600.37−0.030.86N/D0.550.330.19−0.050.172.33
Linear rge. pwr. cons. vs. HDD during0.10−0.05−0.140.110.16N/D0.460.370.51−0.09−0.040.04
Natural gas cns. (kWh) before152.57243.71-N/D--N/D53.12N/DN/DN/D-
Natural gas cns. (kWh) during123.08250.85-N/D--N/D27.61N/DN/DN/D-
Incr. natural gas cns. (kWh)−19.33%2.93%-N/D--N/D−48.02%N/DN/DN/D-
Linear reg.: natural gas/HDD before3.513.89-N/D--N/D2.41N/DN/DN/D-
Linear reg.: natural gas/HDD during0.520.92-N/D--N/D0.01N/DN/DN/D-
Table 7. IEQ in living room and bedroom (sensor-logged data).
Data Logged
CategoryVariableCS1CS2CS3CS4CS5CS6CS7CS8CS9CS10CS11CS12
Living RoomMean T before21.0321.8419.3018.5724.03N/D21.1921.6821.3622.2921.6822.42
Mean T during21.5822.4120.4219.9223.68N/D21.7021.6021.9822.2722.5023.05
Max T before22.7023.4022.5021.9526.60N/D23.5023.8524.8024.8523.6027.90
Max T during23.4023.8023.3022.6326.17N/D23.4023.9025.0024.3023.6228.00
Min T before19.1020.6216.7316.3021.60N/D19.5019.7018.7020.6019.7719.85
Min T during19.7720.8018.6517.7521.55N/D20.0019.9019.4020.4821.2220.52
Mean RH before68.3254.2881.3456.3357.17N/D40.0241.0071.2046.0648.9557.39
Mean RH during71.0954.2779.2553.2360.67N/D42.2142.0770.3147.8346.2059.17
% comf. h before85%100%4%27%100%N/D89%95%69%100%95%99%
% c¡omf. h during92%100%8%39%100%N/D100%98%90%100%100%99%
% outd. comf. h+IEQ before0%29%0%15%7%N/D96%100%21%58%85%0%
% outd. comf. h+IEQ during0%0%0%40%0%N/D100%100%100%100%100%0%
Mean IAQ before1966136819139181408N/D8228931154102910642263
Mean IAQ during1939128421528061602N/D7717361035105010291722
Cum. IAQ before277,78674,591235,75311,75270,781N/D160915,09641,21720,61721,657354,005
Cum. IAQ during262,61121,831311,6841681157,662N/D00861765586792202,463
BedroomMean T before20.8420.5821.1118.0825.32N/D19.43N/D18.6520.6219.1120.48
Mean T during20.7521.2623.5119.2124.84N/D20.04N/D19.0620.9019.8321.10
Max T before24.1522.1026.0821.6528.20N/D20.88N/D22.0022.4021.8024.35
Max T during23.8522.3026.5521.6627.35N/D20.90N/D22.2022.2021.4024.00
Min T before18.0519.8019.0014.9023.10N/D18.00N/D15.4219.5016.2317.90
Min T during18.7019.8520.5517.1523.30N/D18.40N/D15.3019.5517.9019.00
Mean RH before75.7956.6569.8381.3049.14N/D40.02N/D71.2049.3856.7675.61
Mean RH during73.7054.1053.3387.3053.18N/D42.21N/D70.3150.2953.7570.14
% comf. h before11%92%60%21%99%N/D27%N/D14%83%34%5%
% comf. h during0%99%100%35%100%N/D49%N/D27%96%45%53%
% outd. comf. h + IEQ before0%33%46%54%7%N/D46%N/D4%54%65%0%
% outd. comf. h+IEQ during0%0%0%80%0%N/D100%N/D50%100%100%0%
Mean IAQ before2305128615397531312N/D912N/D1437122412082263
Mean IAQ during2441115616956531505N/D841N/D1316123210711722
Cum. IAQ before340,67945,684160,516014,810N/D3279N/D11947485,02654,424354,005
Cum. IAQ during367,7320189,187099,268N/D0N/D8150271,84017,150202,463
Table 8. Comparison of survey and sensor-logged data.
Parameter ComparedPREPREDLDLPREPREDLDLPREPREDLDLPREPREPREDLDLDLPREPREDLDLPREDL
CS1CS2CS1CS2CS3CS4CS3CS4CS5CS6CS5CS6CS7CS8CS9CS7CS8CS9CS10CS11CS10CS11CS12CS12
Starting
Data
Dwelling characteristics
General upkeep
GG Gp MG MpM MM p
Household characteristics
Occupation density
Incr. occupation
AVG+++VGG+++++AVG++GGA+++++AVG+++P=
Potential of passive measures
Living room
Bedroom
=
=
=
-
=
-
+
+
-
-
N/D
N/D
+
+
=
N/D
=
+
+
+
+
+
=
=
IaqGeneral environmental quality
Air quality
Ventilation frequency
G
A
G
A

++

=
VG
A
G
G

=

=
M
A
VG
A

+

=
VG
A
G
G
G
G

=

=

=
VG
G
P
A

=

=
P
G

=
IAQ
Living room
Bedroom
P
P
M
M
P
P
M
M
P
P
G
G
P
P
G
G
M
P
N/D
N/D
P
P
N/D
N/D
VG
A
VG
N/D
G
PP
VG
A
VG
N/D
VG
A
M
M
M
M
M
M
M
M
P
P
P
P
Power
Consumption
Habits
Habits entailing power consumption
+++ =+ +++ +++++++ ++= =/+
Facilities (Consumption) (Appliances/DHW/heating)
Electricity
Natural gas
++
+
=
=
+=
=
++= =/+
=/+
+++
+/=
=/+
=/=
++
+
+
=/+
=
Energy saving strategies PVP PVP VPR VPVPA VPA VP
Fuel vulnerability
(% income for power)
M+P=N/D+M=M+A=MMA=++S/D+A= =
Consumption:
Electricity
Natural gas
+
-
-
+
+= +N/D -
N/D
+
-
+
N/D
++ +
ComfortComfort-adaptation:
Comfort?
Does adaptation entail power consumption?
MG==GP=+GG==GMM===GM== =
Air comfort:
Living room
Bedroom
VG
VP
VG
VG
VG
VP
VG
VG
VP
G
A
M
VP
VG
A
A
VG
VG
N/D
N/D
VG
VG
N/D
N/D
VG
A
VG
N/D
G
M
VG
A
VG
N/D
VG
A
VG
VG
VG
A
VG
VG
VG
A
VG
VP
VG
G
Six-point scale where: VP: very poor; P: poor; M: mediocre; A: acceptable, adequate; G: good; VG: very good; N/D: no data, nothing reported. NOTE: Depending on the nature of the variables, in some categories their scale was reduced to 5 or 4 points. For increased use or consumption, the options applied were: -: less; =: the same; +: greater;++: much greater; +++: very much greater. PRE: Pre-lockdown; DL; during lockdown.
Publisher’s Note: MDPI stays neutral with regard to jurisdictional claims in published maps and institutional affiliations.

